Back to Journals » Clinical Epidemiology » Volume 15
A Novel Chronic Kidney Disease Phenotyping Algorithm Using Combined Electronic Health Record and Claims Data
Authors Mansour O, Paik JM, Wyss R ![]() , Mastrorilli JM
, Mastrorilli JM ![]() , Bessette LG
, Bessette LG ![]() , Lu Z, Tsacogianis T, Lin KJ
, Lu Z, Tsacogianis T, Lin KJ ![]()
Received 10 November 2022
Accepted for publication 16 February 2023
Published 8 March 2023 Volume 2023:15 Pages 299—307
DOI https://doi.org/10.2147/CLEP.S397020
Checked for plagiarism Yes
Review by Single anonymous peer review
Peer reviewer comments 2
Editor who approved publication: Dr Eyal Cohen
Omar Mansour,1,* Julie M Paik,1– 3,* Richard Wyss,1 Julianna M Mastrorilli,1 Lily Gui Bessette,1 Zhigang Lu,1 Theodore Tsacogianis,1 Kueiyu Joshua Lin1,4
1Division of Pharmacoepidemiology and Pharmacoeconomics, Department of Medicine, Brigham and Women’s Hospital, Harvard Medical School, Boston, MA, USA; 2Renal Division, Department of Medicine, Brigham and Women’s Hospital, Harvard Medical School, Boston, MA, USA; 3New England Geriatric Research Education and Clinical Center, VA Boston Healthcare System, Boston, MA, USA; 4Department of Medicine, Massachusetts General Hospital, Harvard Medical School, Boston, MA, USA
*These authors contributed equally to this work
Correspondence: Kueiyu Joshua Lin, Division of Pharmacoepidemiology and Pharmacoeconomics, Department of Medicine, Brigham and Women’s Hospital, Harvard Medical School, 1620 Tremont St. Suite 3030, Boston, MA, 02120, USA, Tel +1 617 278-0930, Fax +1 617 232-8602, Email [email protected]
Purpose: Because chronic kidney disease (CKD) is often under-coded as a diagnosis in claims data, we aimed to develop claims-based prediction models for CKD phenotypes determined by laboratory results in electronic health records (EHRs).
Patients and Methods: We linked EHR from two networks (used as training and validation cohorts, respectively) with Medicare claims data. The study cohort included individuals ≥ 65 years with a valid serum creatinine result in the EHR from 2007 to 2017, excluding those with end-stage kidney disease or on dialysis. We used LASSO regression to select among 134 predictors for predicting continuous estimated glomerular filtration rate (eGFR). We assessed the model performance when predicting eGFR categories of < 60, < 45, < 30 mL/min/1.73m2 in terms of area under the receiver operating curves (AUC).
Results: The model training cohort included 117,476 patients (mean age 74.8 years, female 58.2%) and the validation cohort included 56,744 patients (mean age 73.8 years, female 59.6%). In the validation cohort, the AUC of the primary model (with 113 predictors and an adjusted R2 of 0.35) for predicting eGFR < 60, eGFR< 45, and eGFR < 30 mL/min/1.73m2 categories was 0.81, 0.88, and 0.92, respectively, and the corresponding positive predictive values for these 3 phenotypes were 0.80 (95% confidence interval: 0.79, 0.81), 0.79 (0.75, 0.84), and 0.38 (0.30, 0.45), respectively.
Conclusion: We developed a claims-based model to determine clinical phenotypes of CKD stages defined by eGFR values. Researchers without access to laboratory results can use the model-predicted phenotypes as a proxy clinical endpoint or confounder and to enhance subgroup effect assessment.
Keywords: EHR, prediction, RPDR
Introduction
Chronic kidney disease (CKD) is a serious public health challenge that affects approximately 32 million individuals in the United States (US),1 with over 6% of individuals having moderate-to-severe CKD (stages 3–5) between 2015 and 2018. It is estimated that the Medicare spending on beneficiaries with CKD exceeded $87 billion, representing 23% of total Medicare fee-for-service (FFS) expenditures in 2019.1 CKD is associated with poor quality of life, high morbidity, and increased mortality.2–4 Additionally, it is commonly assessed as a key factor for risk stratification and confounding adjustment in comparative safety and effectiveness research.5,6
In routine clinical practice, a patient with CKD is identified by measuring their serum creatinine value based on which the glomerular filtration rate can be estimated. While much of the comparative safety and effectiveness research has relied on administrative claims data,7 information on laboratory results is not available in claims, and CKD is very unreliably coded as a diagnosis.8,9 CKD stages based on only International Classification of Diseases (ICD) codes were found to have low sensitivity (3–30%)9,10 with widely variable positive predictive values (PPVs).3,9,11,12 Because patients with advanced CKD are often excluded from clinical trials, evidence from real-world data such as claims data is particularly important for informing clinical decisions in routine care. While electronic health records (EHRs) have been increasingly used to generate real-world evidence, missing data due to care provided by provider networks outside of the reach of the research team has been a great threat to study validity.13 Yet, relying on claims data may lead to misclassification of CKD in clinical studies based on data lacking detailed laboratory results. Therefore, we aimed to build prediction models for identifying a CKD phenotype determined by laboratory results in EHR using information available in claims data.
Methods
Data Source
We used data from the Research Patient Data Repository (RPDR)14 linked to Medicare FFS Parts A (inpatient coverage), B (outpatient coverage), and D (prescription benefits) claims data from 2007 to 2017. The RPDR includes longitudinal EHR data from 2 networks in the Boston metropolitan area. The first network (EHR system 1) consists of 1 tertiary hospital, 2 community hospitals, and 19 primary care centers. The second network (EHR system 2) includes 1 tertiary hospital, 1 community hospital, and 18 primary care centers. EHR system 1 was used for training and system 2 for validating the EHR-continuity prediction model. This dataset includes information on body mass index (BMI), blood pressure, smoking status, and laboratory and radiology test results. The Medicare claims data were linked with the EHR dataset by the unique Medicare beneficiary number, date of birth, and sex, with a success linkage rate of 98.7%.15 Medicare is a US federal health insurance program that currently covers approximately 50 million Americans by providing medical and prescription drug coverage to individuals aged 65 years and older and to younger individuals with disabilities. The Medicare FFS claims database contains longitudinal, individual-level data on healthcare utilization, inpatient and outpatient diagnoses, diagnostic tests and procedures, and pharmacy filled prescriptions. These data are commonly used in real‐world drug effectiveness and safety studies.15–17 This study was approved by the Institutional Review Board of the Brigham and Women’s Hospital, Boston, Massachusetts.
Study Population
Using the EHR-Medicare linked database, we identified a cohort with a valid serum creatinine laboratory result (measurement date = cohort entry date [CED]) and at least 90 days of continuous Medicare enrollment before and after the CED. Operationally, a valid serum creatinine measurement means a laboratory value with a unit-specific Logical Observation Identifiers Names and Code (LOIC) that corresponds to serum creatinine, excluding those with implausible values (Table S1). The range of implausible values was verified by board-certified physicians on the team (JMP and KJN).
Patients with end-stage kidney disease (ESKD), who were on dialysis, who were younger than 65 years of age, or had missing information on age or sex were excluded.
Cohort Characteristics
Baseline characteristics were assessed during the baseline assessment period (BAP), which was defined as 90 days before and after CED. We considered 134 potential variables based on clinical expertise and a comprehensive literature review.18–20 These included demographic characteristics (eg, age and sex), CKD-related and other comorbidities (eg, acute kidney injury, diabetes, anemia, etc.), medication use variables, a combined comorbidity score,21 a claims-based frailty index (CFI) validated against clinical measures of frailty,22–25 and healthcare utilization variables (ie, number of outpatient office visits, number of emergency room visits, number and duration of hospitalizations). A full list of included variables is provided in the Supplementary Appendix (Table S2).
Outcome
The study outcomes were continuous estimated glomerular filtration rate (eGFR), and eGFR in categories (<60, <45, and <30 mL/min/1.73m2). This was calculated based on measured serum creatinine using the Chronic Kidney Disease Epidemiology Collaboration (CKD-EPI) equation:

where:
Scr is serum creatinine in mg/dL,
κ is 0.7 for females and 0.9 for males,
α is −0.329 for females and −0.411 for males,
Min indicates the minimum of Scr/κ or 1, and
Max indicates the maximum of Scr/κ or 1.
Statistical Analysis
To describe the baseline characteristics of patients included in the study, we used means and standard deviations (SDs) for continuous variables and proportions for categorical variables. The models were developed using data from the training set. We first applied the least absolute shrinkage and selection operator (LASSO) regression with Bayesian information criteria to select predictors from the 134 preselected variables. To get our primary model, we then fit a linear regression model with the continuous eGFR as the dependent variable and the selected predictor variables as independent variables. Because those with eGFR <30 represent an infrequent and severe phenotype, the predictors of this particular phenotype and their coefficients may be different from that for the continuous eGFR. Therefore, in a secondary analysis, we used LASSO regression with Bayesian information criteria to select predictors for the binary outcome of eGFR <30 and fit a logistic regression with the LASSO-selected variables predicting eGFR <30. Model performance characteristics were assessed by calculating the area under the receiver operating curves (AUC) for the predicted probability of eGFR in the training and validation sets. We used the coefficient of determination, R2, to assess our primary model predicting continuous eGFR. Additionally, model calibration was assessed using goodness-of-fit to compare the observed and predicted events of CKD, which were tested by Hosmer–Lemeshow tests. We calculated overall accuracy, defined as the number of accurate predictions divided by the number of total predictions, PPVs, defined as the probability of being a true case, given positive prediction by the model, and sensitivity, defined as the probability of being identified as a case of specific eGFR by the model for a true case for that specific level. The optimal cut-off was chosen to maximize overall correctness while keeping a PPV of at least 80% if achievable (choose the optimal PPV if a PPV of 80% is not possible).26 All analyses were conducted in SAS version 9.4 (SAS Institute Inc., Cary, NC, USA).
Results
Patient Inclusion and Characteristics
Out of a total of 718,341 patients in the linked EHR-Medicare dataset, 478,699 (66.6%) had a valid serum creatinine laboratory result. After applying the inclusion/exclusion criteria, 174,220 patients were included in the analysis: 117,476 (67.4%) in the training set and 56,744 (32.6%) in the validation set (Figure 1).
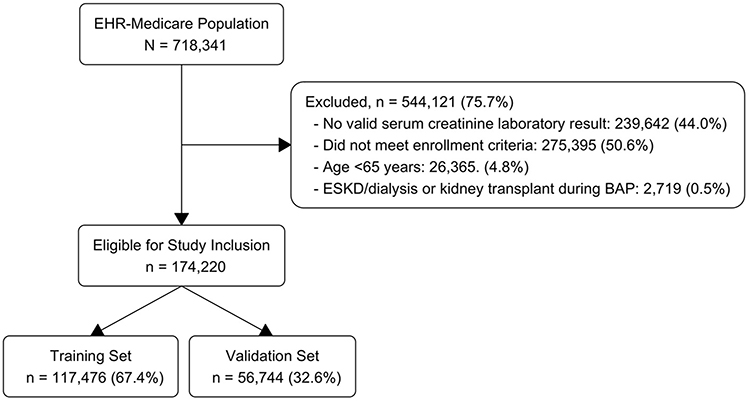 |
Figure 1 Flowchart of study population derivation. Abbreviations: HER, electronic health records; ESKD, end-stage kidney disease; BAP, baseline assessment period. |
Overall, patients included in the training and validation sets had comparable characteristics: the mean age was 74.8 (73.2) years in the training (validation) set, 58.2% (59.6%) were female in the training (validation) set, the majority of patients were white in both sets, mean eGFR was 70.9 (72.5) mL/min/1.73m2 in the training (validation) set, and both sets had similar distributions of comorbidities, medication use, and health care utilization (Table 1).
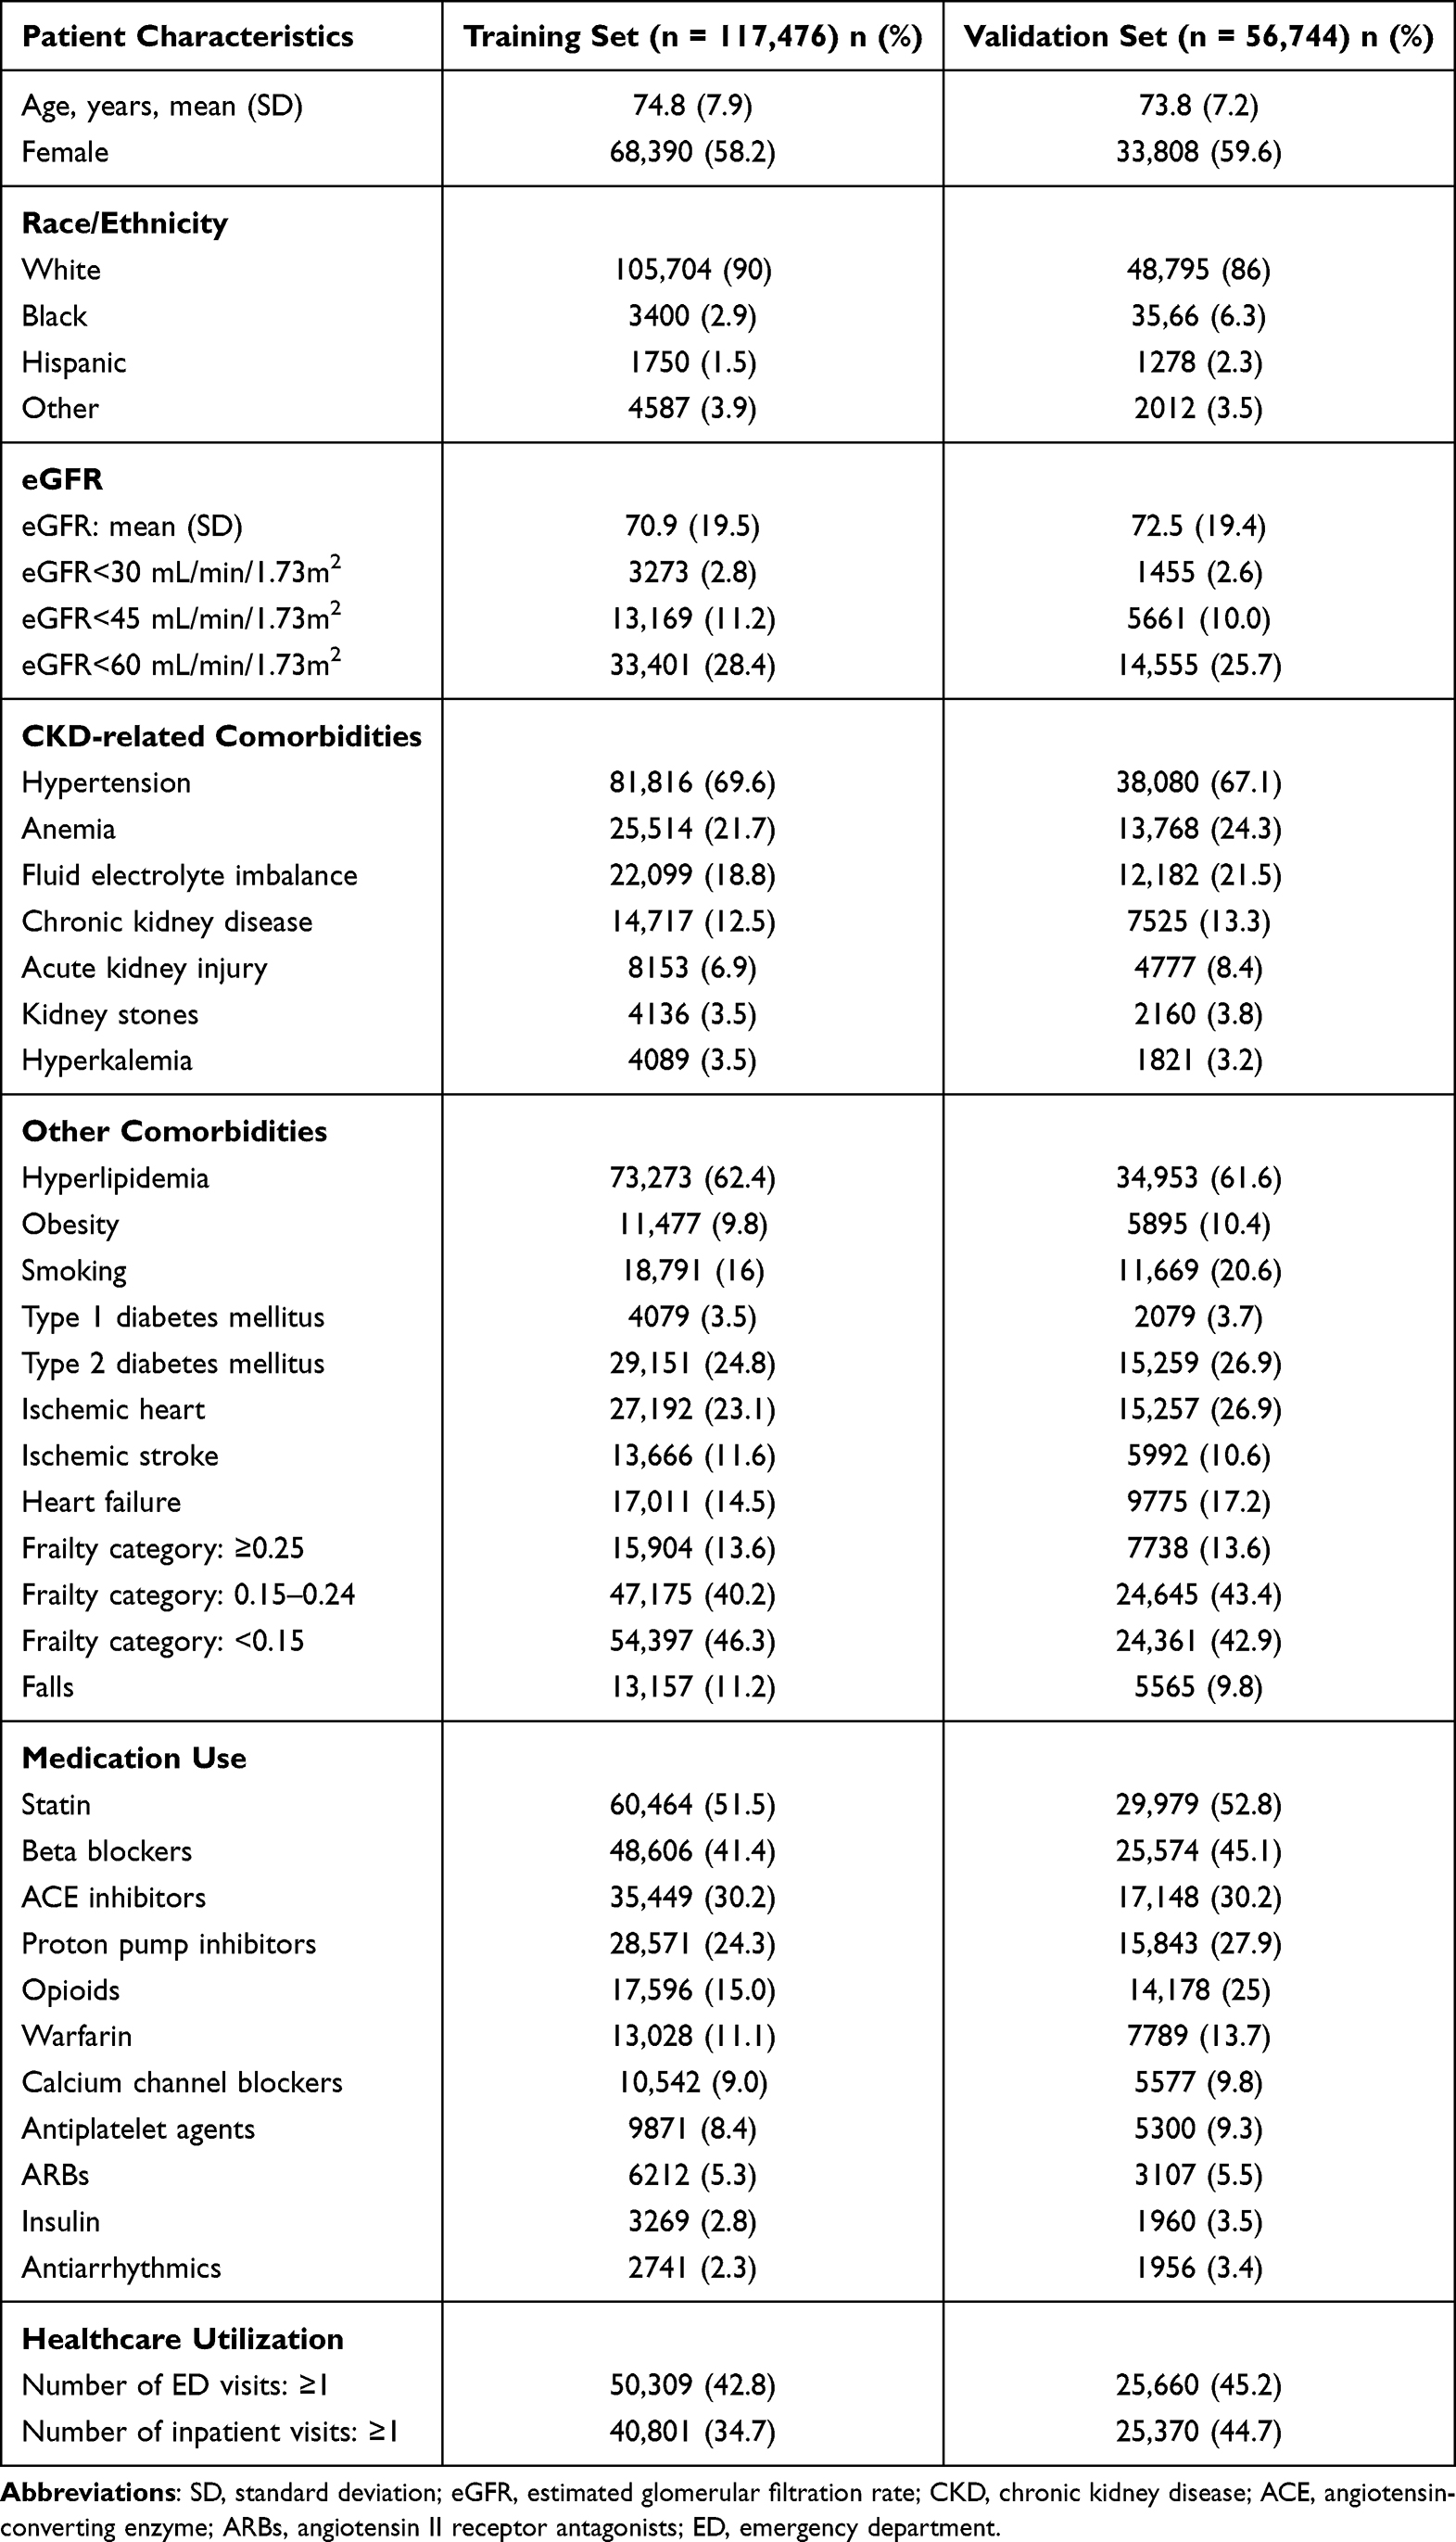 |
Table 1 Patient Characteristics in the Training and Validation Sets (N = 174,220) |
Model to Predict Continuous eGFR Values
Our primary model predicting continuous eGFR included a total of 113 factors with an adjusted R2 of 0.354. The top-ranked predictors being history of CKD, age, portal vein thrombosis, liver transplantation, acute kidney injury, hyperkalemia, and use of loop diuretics (Table S2). The mean measured and predicted eGFR values were similar within each predicted eGFR decile in the training vs validation set (Figure 2). For example, the mean measured eGFR in the first decile was 58.3 mL/min/1.73m2 (±17.7 SD) in the training set and 59.4 mL/min/1.73m2 (±18.0 SD) in the validation set. A similar trend was observed for the SD.
 |
Figure 2 Mean measured eGFR by predicted eGFR decile in the training vs validation sets. Error bars represent standard deviations. |
Performance of the Model Predicting eGFR <60 and <45 mL/min/1.73m2
The AUC was similar across the three categorical levels of eGFR score when comparing the validation set to the training set (Figure 3). In the validation set, the AUC was 0.81 and 0.88 when predicting eGFR <60 and <45 mL/min/1.73m2, respectively. Based on the optimal cut-off, the overall accuracy was 0.81 (95% confidence interval [CI]: 0.81, 0.81) and 0.90 (0.90, 0.91) when predicting eGFR <60 and eGFR <45 mL/min/1.73m2, respectively. The corresponding PPVs were 0.80 (0.79, 0.81) and 0.79 (0.75, 0.84) [Table 2]. Based on the Hosmer-Lemeshow Goodness-of-Fit test, the model tends to overestimate the risks of the high-risk patients, which is more pronounced when predicting eGFR <45 than <60 mL/min/1.73m2 (Tables S3 and S4).
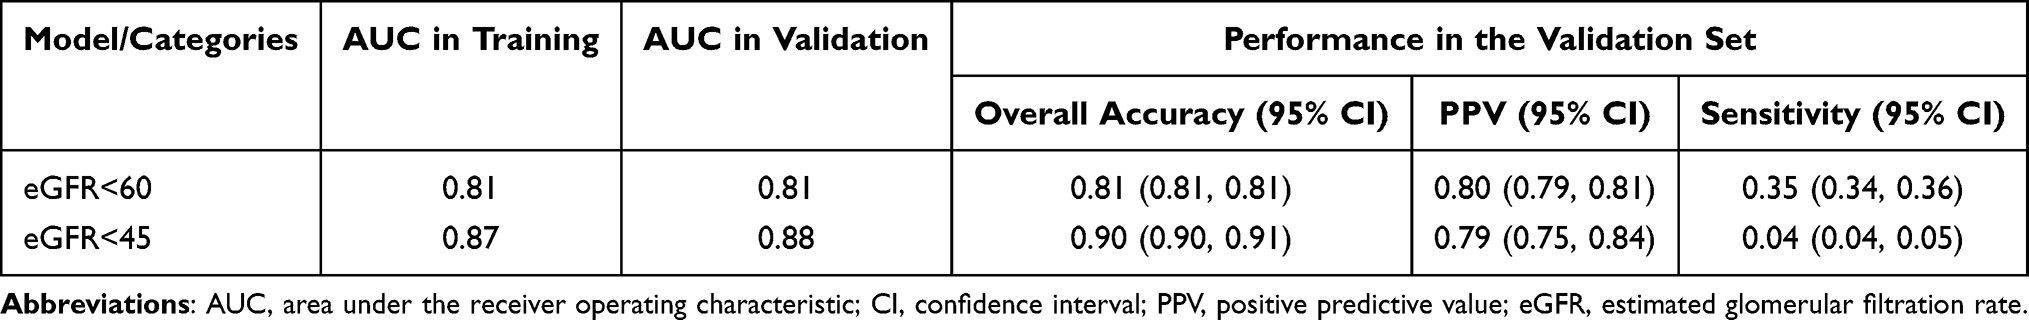 |
Table 2 Performance of the Model Predicting eGFR <60 and <45 mL/min/1.73m2 Categories |
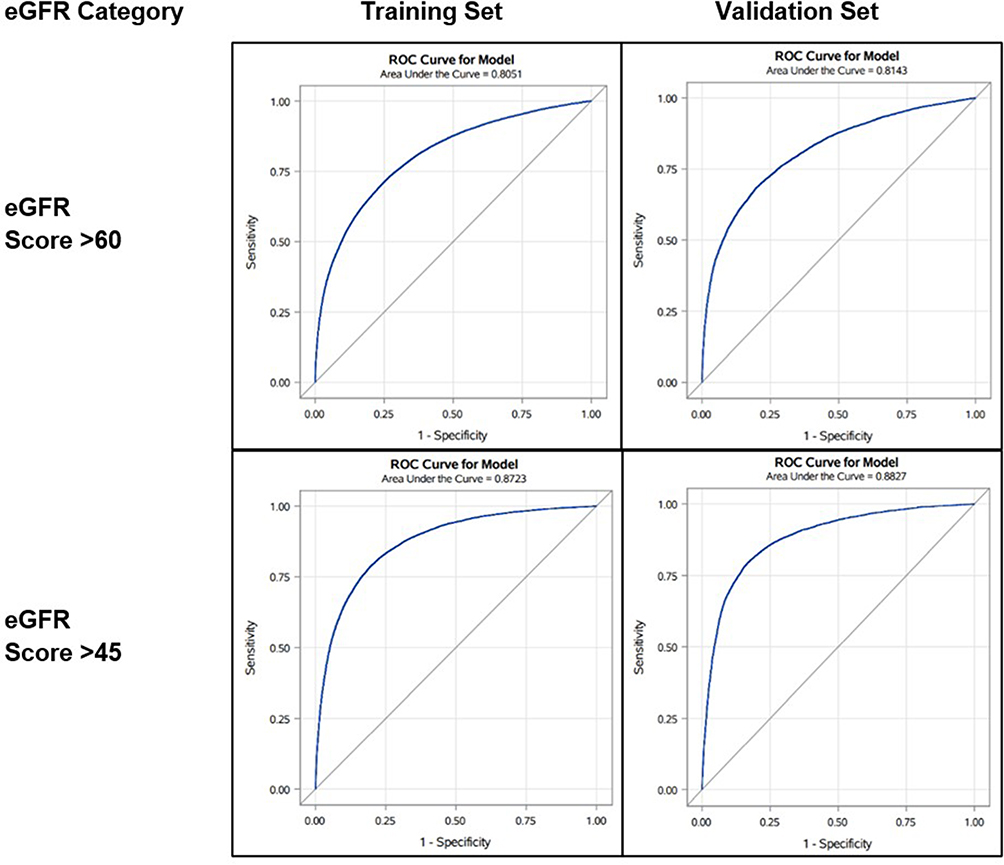 |
Figure 3 Area under the receiver operating characteristic (AUROC) curves of the performance of the eGFR prediction tool in the training and validation set. |
Performance of the Model Predicting eGFR <30 mL/min/1.73m2
The primary model predicting continuous eGFR has an AUC of 0.92 in the validation set when predicting eGFR <30 mL/min/1.73m2. The secondary model developed to predict the binary outcome of eGFR <30 mL/min/1.73m2 included a total of 53 factors. The top-ranked predictors included history of CKD, acute kidney injury, age, use of loop diuretics, hyperkalemia, abdominal ultrasound testing, and liver dysfunction (Table S5). The AUC of this secondary model was 0.93 when predicting binary eGFR <30 mL/min/1.73m2 (Table 3). The overall accuracy of the model was similar for the primary and secondary models (0.97, 95% CI: 0.97, 0.98). Compared to the primary model, the secondary model yielded a higher PPV (0.56 vs 0.38) at the cost of lower sensitivity (0.003 vs 0.05, Table 3). Based on the Hosmer-Lemeshow Goodness-of-Fit test, the model tends to overestimate the risks of the high-risk patients (Tables S6 and S7).
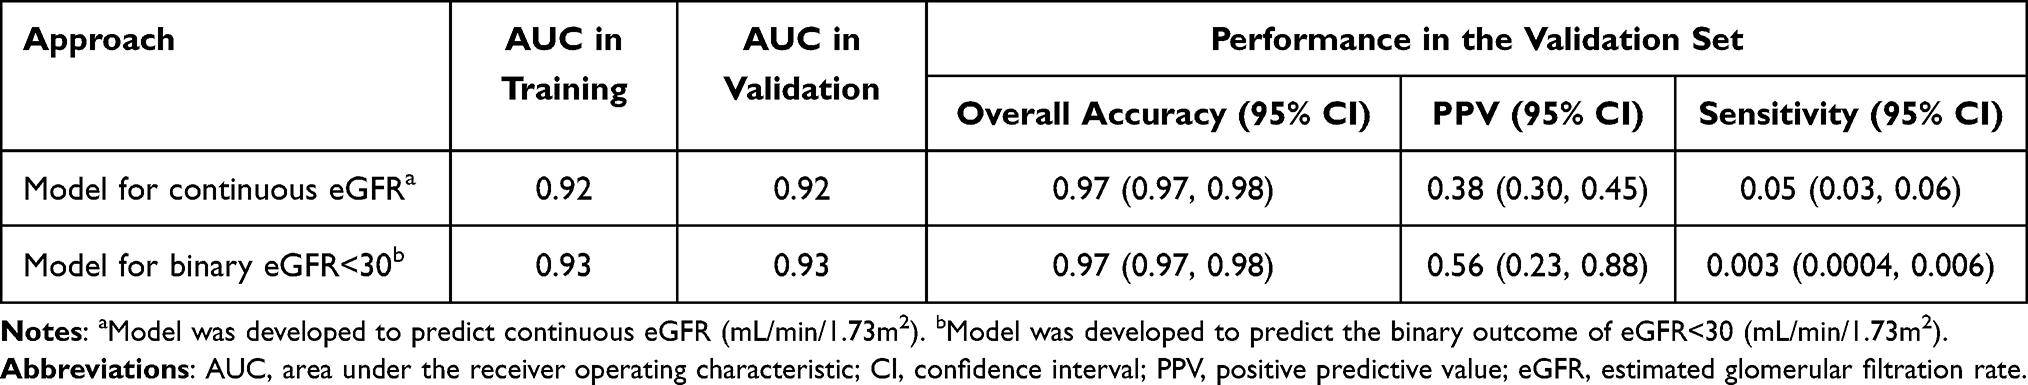 |
Table 3 Performance of the Prediction Model for eGFR <30 mL/min/1.73m2 |
Discussion
In this study, we developed and validated a model based on information in claims data to identify a CKD phenotype. Based on data from 174,220 Medicare beneficiaries, our model was able to predict a CKD phenotype with good discrimination capability. The AUC for predicting eGFR of <60, <45, and <30 mL/min/1.73m2 was 0.81, 0.88, and 0.92, respectively. While the PPVs for the models identifying eGFR of <60 and <45 mL/min/1.73m2 were satisfactory (ranging between 0.79 and 0.80), the PPV for identifying eGFR <30 mL/min/1.73m2 was suboptimal.
Given the burden of CKD, it is critical to accurately identify patients with CKD for safety and effectiveness studies. In a systematic review of the validity of administrative database coding for CKD, sensitivity and PPVs were substantially variable in 19 studies.12 Particularly, sensitivity values had a median of 0.41 with a range from 0.03 to 0.88, while PPVs had a median of 0.78 with a range from 0.29 to 1.00. However, the majority of the studies included in the systematic review had relatively small sample sizes, different study populations (eg, some included patients with ESKD), variant algorithms for CKD definition, and different reference standards (eg, medical chart review and laboratory values). Additionally, in a large study of a US commercial insurance claims database, the PPV of a claims-based (ICD-10) algorithm to identify adults with CKD stages 3–5 was 0.86.7 The results from our models, especially PPVs, well align with the upper bounds reported in previous studies.
Since patients with advanced CKD are often excluded from clinical trials,27 it is important to evaluate drug safety and effectiveness in patients with advanced CKD in the population using routinely collected information in databases, such as insurance claims data. Development and validation of a claims-based CKD phenotype prediction model can facilitate identification of patients with CKD because laboratory results (eg, serum creatinine) are typically not available and CKD is unreliably coded as a diagnosis in the claims data.8,9 Currently, there is no diagnosis-code-based algorithm that can identify those with moderate-to-severe CKD (ie, eGFR <45 [stage 3b and worse] and eGFR <30 [stage 4 and worse]). Our model therefore can advance researchers’ ability to investigate the subgroup effects of the clinical questions at hand among patients of higher vulnerability due to advanced renal dysfunction.
The model developed in this study was able to predict with sufficient accuracy a CKD phenotype using routinely collected data. Our cut-off was chosen to optimize PPV at the cost of reduced sensitivity because claims data usually offer a large cohort containing sufficient patients with CKD. Using a cut-off with high PPV can ensure those identified as having CKD have a high probability of having true CKD in which a valid causal inference regarding CKD can be drawn.9 The predicted CKD can also be used as a proxy factor for confounding adjustment. Because claims data typically do not have laboratory results, renal function defined by laboratory results would otherwise be an important unmeasured confounder in the analysis. Another possible application of our model is to use the predicted CKD as the clinical end points in a comparative safety analysis. This application will favor high PPV, since relative risk estimates are unbiased if outcomes are assessed with 100% specificity, even if sensitivity is lower.28
Practically, our algorithm can be used as an imputation model in settings where eGFR is critical but not available. This requires the missing at random assumption where all predictors of missingness are observed when imputing eGFR. There are two main reasons that may enhance our confidence in predicting the missingness (ie, the data missing mechanism is missing at random). First, serum creatinine is widely ordered as a routine laboratory test, making it a simple and practical marker to estimating GFR. Second, the risk factors that often prompt clinicians to order serum creatinine test are captured in the claims data, including medical diagnosis (eg, CKD, acute kidney injury, and diabetes), medical procedures (eg, cardiac catheterization), and use of certain medications (eg, diuretics, diabetes medications, and angiotensin II receptor blockers [ARBs]).
The study has several limitations. First, the study population was limited to patients aged 65 years or older with Medicare coverage; thus, we were not able to generalize the results to patients younger than 65 years. Because CKD is highly prevalent in older adults and Medicare claims data are often used in comparative effectiveness research,29–31 we argue that our models are useful as they are not intended to generalize to the younger populations. Second, the application of our model to other populations relies on the assumption that the relationship between covariates and renal dysfunction is similar across care delivery systems. We used two academic EHR systems in Massachusetts as the training and validation datasets. These two systems both consist of care facility of all care continuum, including primary care center, community hospitals, and tertiary referral centers. Because both care delivery networks are general hospital based rather than specialty-based centers (eg, cancer centers), it is more likely that this assumption can be met, which is supported by the fact that we did not observe reduction in model performance in the validation set. Third, our model relies on serum creatinine as the gold-standard for kidney function, which may underestimate severity of kidney disease in patients with reduced muscle mass.32
Conclusion
In conclusion, based on a cohort of Medicare beneficiaries aged 65 years or older, we developed and validated a phenotyping algorithm to identify patients with CKD stages 3–5 based on information in claims data. Our models can be used as a proxy factor for confounding adjustment, as a proxy clinical end point during follow-up, and to enhance assessment of subgroup effects by these CKD phenotypes in clinical research using large insurance claims data in the absence of laboratory testing results.
Data Sharing Statement
Data supporting the results reported in this manuscript contain detailed, patient-level clinical information and therefore cannot be made available publicly to protect patient privacy. The data accessed in this study comply with all relevant data protection and privacy regulations.
Funding
This study was funded by the National Institutes of Health (1RF1AG063381-01 and R01LM013204). The funder had no role in the design, collection, analysis, interpretation of the data, or the decision to submit the manuscript for publication.
Disclosure
The authors declare no conflict of interests for this work.
References
1. System USRD. 2021 USRDS annual data report: epidemiology of kidney disease in the United States; 2021. Available from: https://adr.usrds.org/2021.
2. Chen TK, Knicely DH, Grams ME. Chronic kidney disease diagnosis and management: a review. JAMA. 2019;322(13):1294–1304. doi:10.1001/jama.2019.14745
3. Porter AC, Lash JP, Xie D, et al. Predictors and outcomes of health-related quality of life in adults with CKD. Clin J Am Soc Nephrol. 2016;11(7):1154–1162. doi:10.2215/cjn.09990915
4. Tonelli M, Wiebe N, Guthrie B, et al. Comorbidity as a driver of adverse outcomes in people with chronic kidney disease. Kidney Int. 2015;88(4):859–866. doi:10.1038/ki.2015.228
5. Desai R, Park H, Brown JD, Mohandas R, Pepine CJ, Smith SM. Comparative safety and effectiveness of aldosterone antagonists versus beta-blockers as fourth agents in patients with apparent resistant hypertension. Hypertension. 2022;79(10):2305–2315. doi:10.1161/hypertensionaha.122.19280
6. Chan YH, Lee HF, See LC, et al. Effectiveness and safety of four direct oral anticoagulants in Asian patients with nonvalvular atrial fibrillation. Chest. 2019;156(3):529–543. doi:10.1016/j.chest.2019.04.108
7. Paik JM, Patorno E, Zhuo M, et al. Accuracy of identifying diagnosis of moderate to severe chronic kidney disease in administrative claims data. Pharmacoepidemiol Drug Saf. 2022;31(4):467–475. doi:10.1002/pds.5398
8. Muntner P, Gutiérrez OM, Zhao H, et al. Validation study of medicare claims to identify older US adults with CKD using the Reasons for Geographic and Racial Differences in Stroke (REGARDS) Study. Am J Kidney Dis. 2015;65(2):249–258. doi:10.1053/j.ajkd.2014.07.012
9. Winkelmayer WC, Schneeweiss S, Mogun H, Patrick AR, Avorn J, Solomon DH. Identification of individuals with CKD from medicare claims data: a validation study. Am J Kidney Dis. 2005;46(2):225–232. doi:10.1053/j.ajkd.2005.04.029
10. Fleet JL, Dixon SN, Shariff SZ, et al. Detecting chronic kidney disease in population-based administrative databases using an algorithm of hospital encounter and physician claim codes. BMC Nephrol. 2013;14:81. doi:10.1186/1471-2369-14-81
11. Kern EF, Maney M, Miller DR, et al. Failure of ICD-9-CM codes to identify patients with comorbid chronic kidney disease in diabetes. Health Serv Res. 2006;41(2):564–580. doi:10.1111/j.1475-6773.2005.00482.x
12. Vlasschaert ME, Bejaimal SA, Hackam DG, et al. Validity of administrative database coding for kidney disease: a systematic review. Am J Kidney Dis. 2011;57(1):29–43. doi:10.1053/j.ajkd.2010.08.031
13. Lin KJ, Glynn RJ, Singer DE, Murphy SN, Lii J, Schneeweiss S. Out-of-system care and recording of patient characteristics critical for comparative effectiveness research. Epidemiology. 2018;29(3):356–363. doi:10.1097/ede.0000000000000794
14. Nalichowski R, Keogh D, Chueh HC, Murphy SN. Calculating the benefits of a research patient data repository. AMIA Annu Symp Proc. 2006;2006:1044.
15. Lin KJ, Singer DE, Glynn RJ, et al. Prediction score for anticoagulation control quality among older adults. J Am Heart Assoc. 2017;6(10). doi:10.1161/jaha.117.006814
16. Patorno E, Najafzadeh M, Pawar A, et al. The EMPagliflozin compaRative effectIveness and SafEty (EMPRISE) study programme: design and exposure accrual for an evaluation of empagliflozin in routine clinical care. Endocrinol Diabetes Metab. 2020;3(1):e00103. doi:10.1002/edm2.103
17. Patorno E, Pawar A, Franklin JM, et al. Empagliflozin and the risk of heart failure hospitalization in routine clinical care. Circulation. 2019;139(25):2822–2830. doi:10.1161/circulationaha.118.039177
18. Fralick M, Chen SK, Patorno E, Kim SC. Assessing the risk for gout with sodium-glucose cotransporter-2 inhibitors in patients with type 2 diabetes: a population-based cohort study. Ann Intern Med. 2020;172(3):186–194. doi:10.7326/m19-2610
19. Fralick M, Schneeweiss S, Redelmeier DA, Razak F, Gomes T, Patorno E. Comparative effectiveness and safety of sodium-glucose cotransporter-2 inhibitors versus metformin in patients with type 2 diabetes: an observational study using data from routine care. Diabetes Obes Metab. 2021;23(10):2320–2328. doi:10.1111/dom.14474
20. Patorno E, Htoo PT, Glynn RJ, et al. Sodium-glucose cotransporter-2 inhibitors versus glucagon-like peptide-1 receptor agonists and the risk for cardiovascular outcomes in routine care patients with diabetes across categories of cardiovascular disease. Ann Intern Med. 2021;174(11):1528–1541. doi:10.7326/m21-0893
21. Gagne JJ, Glynn RJ, Avorn J, Levin R, Schneeweiss S. A combined comorbidity score predicted mortality in elderly patients better than existing scores. J Clin Epidemiol. 2011;64(7):749–759. doi:10.1016/j.jclinepi.2010.10.004
22. Kim DH, Glynn RJ, Avorn J, et al. Validation of a claims-based frailty index against physical performance and adverse health outcomes in the health and retirement study. J Gerontol a Biol Sci Med Sci. 2019;74(8):1271–1276. doi:10.1093/gerona/gly197
23. Kim DH, Patorno E, Pawar A, Lee H, Schneeweiss S, Glynn RJ. Measuring frailty in administrative claims data: comparative performance of four claims-based frailty measures in the US medicare data. J Gerontol Biol Sci Med Sci. 2020;75(6):1120–1125. doi:10.1093/gerona/glz224
24. Kim DH, Schneeweiss S, Glynn RJ, Lipsitz LA, Rockwood K, Avorn J. Measuring frailty in medicare data: development and validation of a claims-based frailty index. J Gerontol Biol Sci Med Sci. 2018;73(7):980–987. doi:10.1093/gerona/glx229
25. Gautam N, Bessette L, Pawar A, Levin R, Kim DH. Updating international classification of diseases 9th revision to 10th revision of a claims-based frailty index. J Gerontol Biol Sci Med Sci. 2021;76(7):1316–1317. doi:10.1093/gerona/glaa150
26. Greiner M, Pfeiffer D, Smith RD. Principles and practical application of the receiver-operating characteristic analysis for diagnostic tests. Prev Vet Med. 2000;45(1–2):23–41. doi:10.1016/s0167-5877(00)00115-x
27. Corrigan-Curay J, Sacks L, Woodcock J. Real-world evidence and real-world data for evaluating drug safety and effectiveness. JAMA. 2018;320(9):867–868. doi:10.1001/jama.2018.10136
28. Schneeweiss S, Avorn J. A review of uses of health care utilization databases for epidemiologic research on therapeutics. J Clin Epidemiol. 2005;58(4):323–337. doi:10.1016/j.jclinepi.2004.10.012
29. Wetmore JB, Yan H, Herzog CA, Weinhandl E, Reyes JL, Roetker NS. CKD progression in medicare beneficiaries with nonvalvular atrial fibrillation treated with apixaban versus warfarin. Am J Kidney Dis. 2021;78(2):180–189. doi:10.1053/j.ajkd.2020.12.004
30. Zhao JZ, Weinhandl ED, Carlson AM, St Peter WL. Glucose-lowering medication use in CKD: analysis of US medicare beneficiaries between 2007 and 2016. Kidney Med. 2021;3(2):173–182.e1. doi:10.1016/j.xkme.2020.09.016
31. Patel PA, Liang L, Khazanie P, et al. Antihyperglycemic medication use among medicare beneficiaries with heart failure, diabetes mellitus, and chronic kidney disease. Circ Heart Fail. 2016;9(7). doi:10.1161/circheartfailure.115.002638
32. Delanaye P, Cavalier E, Pottel H. Serum creatinine: not so simple! Nephron. 2017;136(4):302–308. doi:10.1159/000469669
 © 2023 The Author(s). This work is published and licensed by Dove Medical Press Limited. The
full terms of this license are available at https://www.dovepress.com/terms
and incorporate the Creative Commons Attribution
- Non Commercial (unported, 3.0) License.
By accessing the work you hereby accept the Terms. Non-commercial uses of the work are permitted
without any further permission from Dove Medical Press Limited, provided the work is properly
attributed. For permission for commercial use of this work, please see paragraphs 4.2 and 5 of our Terms.
© 2023 The Author(s). This work is published and licensed by Dove Medical Press Limited. The
full terms of this license are available at https://www.dovepress.com/terms
and incorporate the Creative Commons Attribution
- Non Commercial (unported, 3.0) License.
By accessing the work you hereby accept the Terms. Non-commercial uses of the work are permitted
without any further permission from Dove Medical Press Limited, provided the work is properly
attributed. For permission for commercial use of this work, please see paragraphs 4.2 and 5 of our Terms.