Back to Journals » Journal of Inflammation Research » Volume 14
A Genome-Wide Association Study Identifies Novel Risk Loci for Sarcopenia in a Taiwanese Population
Received 10 September 2021
Accepted for publication 31 October 2021
Published 16 November 2021 Volume 2021:14 Pages 5969—5980
DOI https://doi.org/10.2147/JIR.S338724
Checked for plagiarism Yes
Review by Single anonymous peer review
Peer reviewer comments 3
Editor who approved publication: Dr Monika Sharma
Shou-En Wu,1– 3 Wei Liang Chen2– 4
1Department of Dermatology, Tri-Service General Hospital, National Defense Medical Center, Taipei, Taiwan, Republic of China; 2Division of Family Medicine, Department of Family and Community Medicine, Tri-Service General Hospital; and School of Medicine, National Defense Medical Center, Taipei, Taiwan, Republic of China; 3Division of Geriatric Medicine, Department of Family and Community Medicine, Tri-Service General Hospital; and School of Medicine, National Defense Medical Center, Taipei, Taiwan, Republic of China; 4Department of Biochemistry, National Defense Medical Center, Taiwan, Republic of China
Correspondence: Wei Liang Chen
Division of Geriatric Medicine, Department of Family Medicine, Tri-Service General Hospital, National Defense Medical Center, Number 325, Section 2, Chang-Gong Road, Nei-Hu District, Taipei, 114, Taiwan, Republic of China
Tel +886-2-87923311 ext. 16567
Fax +886-2-87927057
Email [email protected]
Purpose: A genome-wide association study (GWAS) of sarcopenia unraveled the importance of genetic contribution to decline in muscle. The current study investigated sarcopenia-related single nucleotide polymorphisms (SNPs) in Asian older adults, and further constructed a genotype score that tests the combined effect of these SNPs on risk of sarcopenia.
Patients and Methods: Ninety-six subjects aged 60 or above were recruited from the database of annual geriatric health examination at Tri-Service General Hospital during 2020. Eligible criteria included: 1) not having severe comorbidities; 2) agreed to join the Taiwan Precision Medicine Initiative project; and 3) having sufficient information of required sarcopenic measurements. Genotype–phenotype association analysis was performed to find SNPs that were significantly associated with each of three sarcopenic indices (low muscle mass, muscle strength, and physical performance). Subsequently, these SNPs comprised a sarcopenia-related genotype score that summed up the number of SNPs carrying unfavorable allele(s).
Results: Twelve SNPs revealed suggestive genome-wide significance with the three sarcopenic indices, and eight of them revealed a relationship with more than one index. Low muscle strength was the item that had the most (eight) related SNPs. Among them, rs10282247 affects cholesterol binding and rs7022373 participates in cellular apoptosis. In addition, higher genotype score demonstrated higher risk of sarcopenia (≥ 4 points: OR=630.6; 2– 3 points: OR=408, p-value< 0.001).
Conclusion: Several newly discovered SNPs suggest that genetic contribution plays a part in the pathogenesis of sarcopenia. Further studies are warranted to verify the underlying mechanisms. Moreover, a genotype score provides an estimate of the combined effect of genetic association with sarcopenia, which may modestly improve clinical risk classification.
Keywords: sarcopenia, elderly, genome-wide association study, single nucleotide polymorphism
Introduction
Sarcopenia is a generalized skeletal muscle disorder characterized by decline in both muscle mass and function.1 It is a vital geriatric issue to be reckoned with as it brings adverse outcomes such as falls, disability, hospitalization, and mortality if not faced squarely.2 Studies have also illustrated its association with metabolic syndrome, which further leads to the development of diabetes mellitus and cardiovascular disease.3,4 This evidence suggests that sarcopenia is more than just a muscle disorder, but rather a risk factor for multiple diseases. To date, researchhas proposed multiple contributing factors including sedentary lifestyle,5 menopause involving hormone changes,6 chronic illness,7,8 adiposity,9 triggers of inflammatory pathway,10 etc. As environmental causes are becoming more understood, the extent of genetic determination in sarcopenia is still ambiguous.
Genome-wide association studies (GWAS) are widely used by scientists to investigate genetic risk factors, and various single nucleotide polymorphisms (SNPs) have been found to show an association with sarcopenia.11–13 SNP is a variation at a single base pair in a DNA sequence among individuals, and thus alters the function and regulatory capacity of genes. Some SNPs have been confirmed in sarcopenia in Caucasian populations,13,14 but as SNPs vary across different ethnic groups and populations, we are interested in the candidate genes that relate to muscle phenotypes in Asians. Furthermore, previous studies generated heterogenous results with different sarcopenia-associated SNPs, illustrating that individual SNPs may each contribute a modest impact on sarcopenia, but an estimate of the combined effect lacks an appropriate instrument. In the present study, we aim to identify the valuable SNPs that play significant roles in Asians and establish a scoring model by summing up the number of SNPs that carried unfavorable alleles, which expects to provide an evaluating tool of the combined effect of genetic association with phenotypic traits of sarcopenia.
Materials and Methods
Study Sample
We collected our subjects from 96 participants aged 60 years old or above who received annual geriatric health examination at Tri-Service General Hospital through January 2020 to December 2020. They were community-dwelling older adults and maintained a relatively stable health condition. Trained investigators initially screened the medical records of each subject and excluded those with health problems including neurological (eg, cognitive impairment), musculoskeletal (eg, pain during exercise), cardiovascular (eg, congestive heart failure), nephrological (eg, renal failure), and oncological (eg, under treatment for malignancy). Subjects without previous conditions were informed of sufficient information about Taiwan Precision Medicine Initiative (TPMI),15 a project which aimed at collecting at least 1 million samples of genetic profiles and clinical data from 13 medical centers in Taiwan before mid-June, 2022. TPMI, a joint project hosted by the National Centre for Genomics Medicine, Academia Sinica, Taiwan and partner hospitals, expects to promote disease screening and effective interventions by utilizing such large-scale database. The subjects joined the project after written informed consent. The protocol of the present study was approved by the Institutional Review Board of Tri-Service General Hospital (TSGH IRB No. 1-107-05-178 and No. 2-108-05-038), and all experiments were performed in accordance with the Declaration of Helsinki.
Demographic information was obtained by a structured questionnaire filled out by the participant in person or asked by a trained interviewer. Measurements of diagnostic components of sarcopenia were arranged. Patients who failed to complete these examinations, including measurements of muscle mass, handgrip strength, and gait speed measurement, were excluded (n=12). Finally, 96 were eligible for further analysis. A flow diagram that depicts the study design is provided in Supplementary Figure S1.
Assessment of Diagnostic Components of Sarcopenia
The current study adopted the criteria of the latest diagnostic algorithm of sarcopenia proposed by the Asian Working Group for Sarcopenia.16 The following three major criteria should all be met to achieve a diagnosis of sarcopenia. Appendicular skeletal muscle mass (SMI) was measured using bioelectrical impedance analysis (BIA) (InBody 720; Biospace). In brief, a tetra-polar eight-point tactile electrode system was used. The impedance of the right arm, left arm, trunk, right leg, and left leg were measured at six different frequencies (1, 5, 50, 250, 500, and 1000 kHz) for each body segment. Males <7.0 kg/m2 and females <5.7 kg/m2 were regarded as having low muscle mass.16 Muscle strength adopted the examination of handgrip strength with an analog isometric dynamometer (Exacta Hydraulic Hand Dynamometer; North Coast Medical Inc., Gilroy, CA). Three measures of the dominant hand with a 10-minute break between each examination were taken, and the average value was acquired. Low handgrip strength was defined as under 28 and 18 kg in males and females, respectively.16 Physical performance adopted measurement of gait speed as representative. Participants were asked to walk a 15-feet distance at their maximum speed and the time duration was recorded. Low gait speed was defined as below 1.0 m/s.16
Genotyping and SNP Selection
Deoxyribonucleic acid (DNA) for genotyping was collected from peripheral blood in our research. SNP detection utilized the Affymetrix Axiom Genome-Wide TWB 2.0 array plate, which was specially designed and identifies disease-related SNPs or drug metabolism-related SNPs that represents Taiwanese genotypic background. Genomic DNA was extracted from blood with the QIAamp DSP DNA Mini Kit in the QIA symphony platform (Qiagen, Hilden, Germany), and assessment of this extraction process was performed with a NanoDrop One spectrophotometer (Thermo Fisher Scientific, Waltham, MA). Next, raw data of signal files were transformed into genotyping profiles using Analysis Power Tools. Quantile normalization was performed before entering genome-wide association studies (GWAS) analysis. The quality of genotyping was evaluated using PLINK. Unqualified SNPs were excluded as they were not able to achieve either a genotype calling rate of >97% or a Hardy-Weinberg equilibrium of p>0.00001. To exclude SNPs that are missing in a large proportion of the subjects, we filtered out SNPs with very high levels of missingness (>10%). SNPs which met the minor allele frequency threshold (>5%) were included. In addition, we mapped all candidate variants to The Genotype-Tissue Expression (GTEx) project v8 project (https://gtexportal.org/home/) by downloading 50 tissue cis-expression quantitative trait locus (cis-eQTL) data with false discovery rate (FDR) cut-off 5% to identify risk loci that affect mRNA expression.17 According to the common practice in the field of GWAS, a p-value<5×10⁻⁸ was considered replicated, and a p-value<10−5 was considered suggestive significant.18,19 We adopted this value for selection of sarcopenia-related SNPs in our study.
Genotype–Phenotype Association Analysis
To evaluate the relationship between selected SNP (genotype) and sarcopenia along with its indices (phenotype), statistical significance tests including Pearson’s chi-square test and logistic regression analysis were conducted. We determined eight SNPs that revealed a suggestive significant relationship with ≥1 sarcopenic index at this step, and further constructed a sarcopenia-related SNP genotype score that is described in the following section.
Establishment of Sarcopenia-Related SNP Genotype Scores
After selecting a set of SNPs that revealed suggestive significant associations with sarcopenia in our study population, we grew interest in whether having multiple SNPs generated an aggregating effect on sarcopenia. We hypothesized having a higher number of sarcopenia-related SNPs denoted a higher risk of sarcopenia. Therefore, we established a genotype score that added up the total number of SNPs that carried unfavorable alleles in each subject. A similar scoring method has been used previously for predicting the risk of cardiovascular disease in a large study of >5,000 subjects.20 Such a scoring model aims at examining the combined contribution of multiple SNPs toward a single disease. Each SNP produces two scores: zero for no unfavorable alleles (the homozygous genotype of the major allele), and one for ≥ one unfavorable allele(s) (heterozygote and the homozygous genotype for the minor allele). There were eight SNPs in total, and thus the scores ranged from 0 to 8 for each participant in our study.
Statistical Analysis
SPSS (IBM Corp. Released 2013. IBM SPSS Statistics for Windows, Version 22.0. Armonk, NY) was the statistical analysis software in this research. Pearson’s chi-squared test was applied to determine significant differences between subgroups with diverse numbers of unfavorable alleles. Logistic regression analysis was conducted to evaluate both the correlation between selected SNPs and three diagnostic components of sarcopenia as well as the association between total SNP score and sarcopenia. p-values below 0.05 are considered statistically significant.
Results
Baseline Characteristics
In Table 1, subjects were classified into three subgroups according to the sarcopenic index (low SMI, gait speed, or handgrip strength) they met, and those reaching all three indices were defined as sarcopenia. The oldest mean age belonged to the low gait speed subgroup (74.32±7.31 years old), and the low SMI subgroup had the highest percentage of male subjects (42.9%). Regarding medical history, hypertension was the most reported event (ranging from 34.3–54.1%), while coronary artery disease was the least (ranging from 2.9–8.8%).
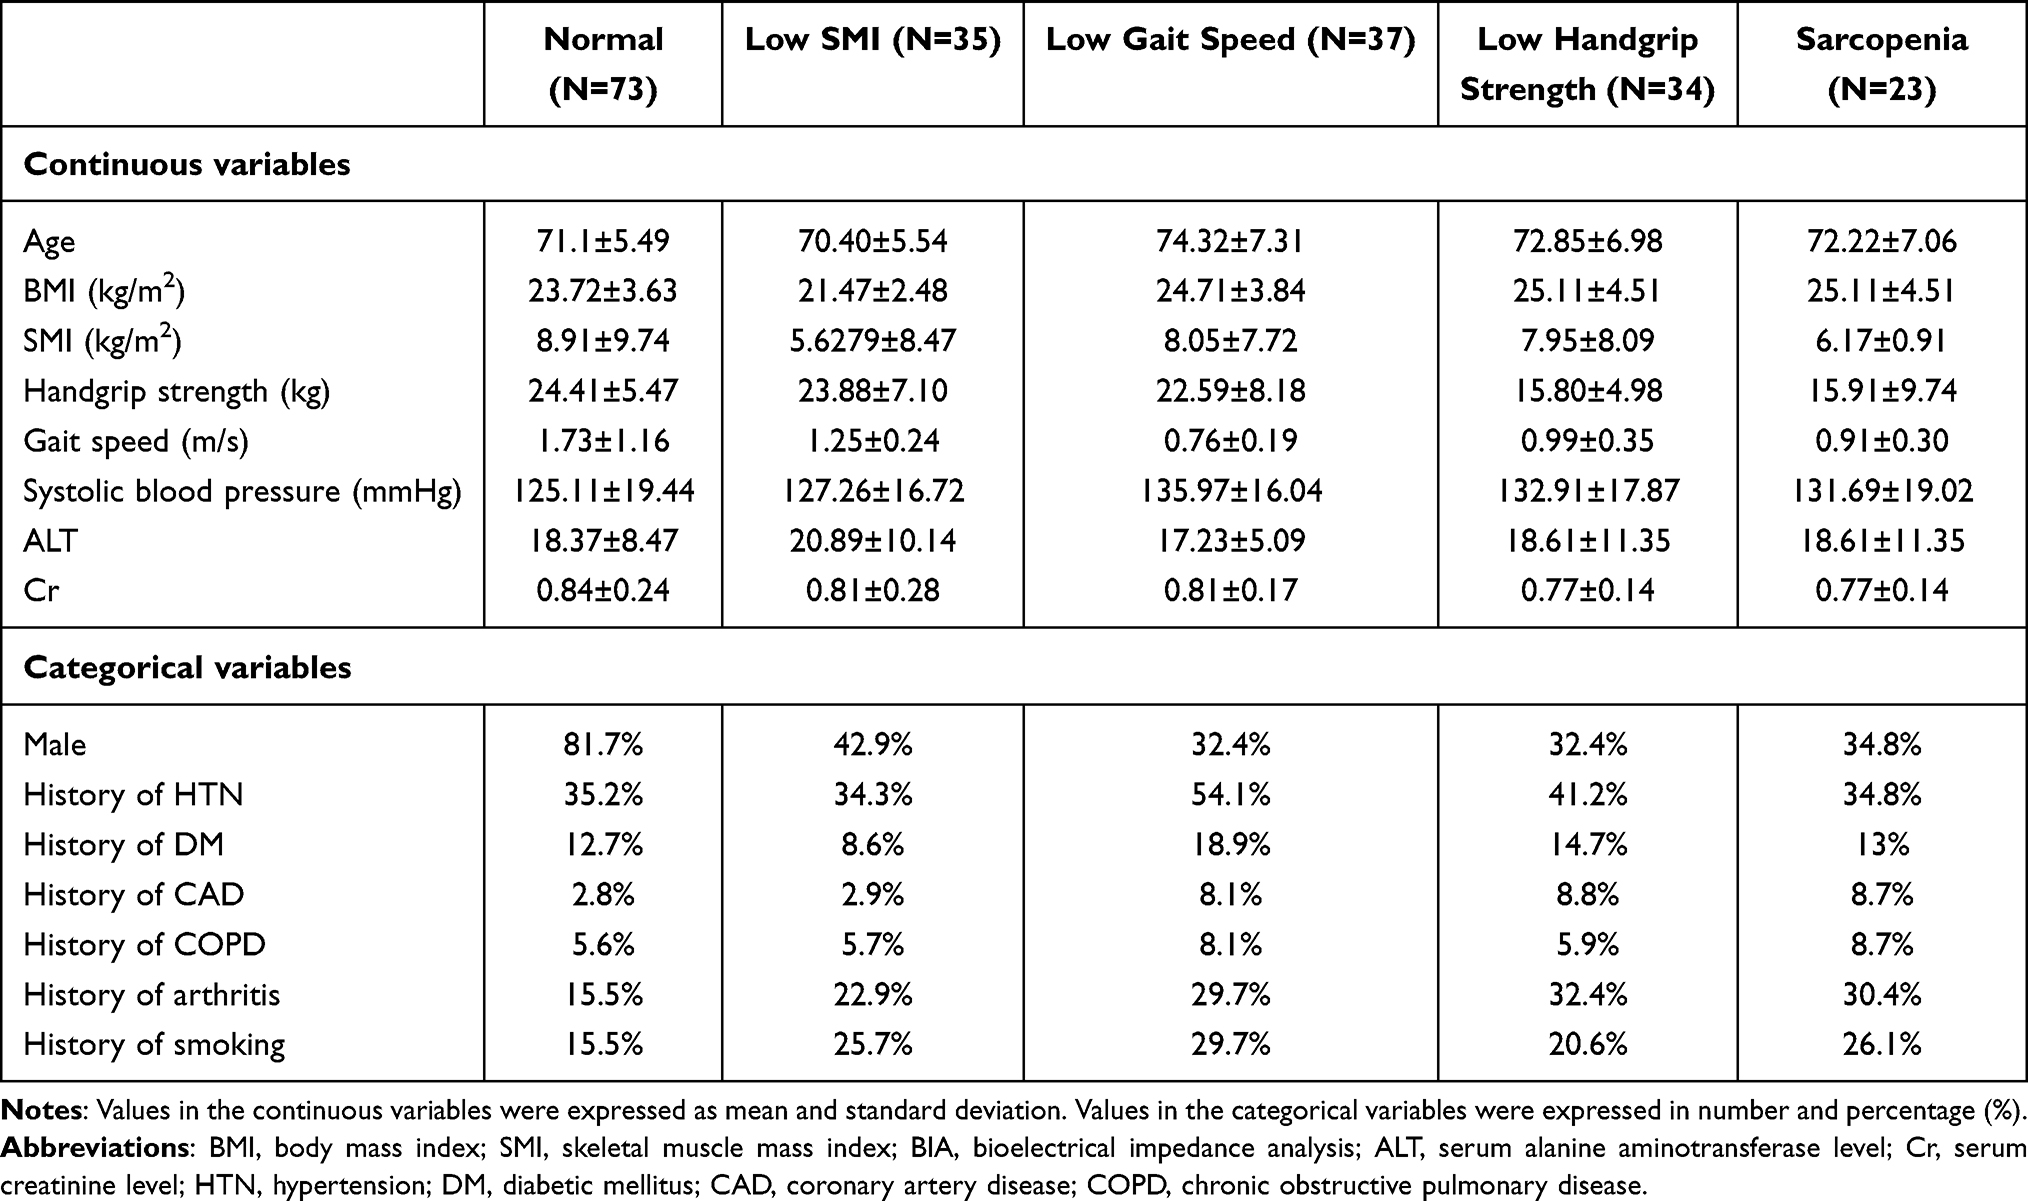 |
Table 1 Demographic Information |
Selection of Sarcopenia-Related SNPs
We performed GWAS in the three subgroups (low SMI, gait speed, or handgrip strength) and identified a total of 12 SNPs that were considered suggestive genome-wide significant as having a p-value<10−5.18,19 Detailed information of each SNP is shown in Table 2. Most SNPs were located in intergenic (a total of 7, 58%) or intronic regions (a total of 3, 25%), echoing previous findings that the majority of SNPs belong to non-coding regions.21 The closest genes were mapped out since SNPs are often considered molecularly-relevant to the nearest gene and affect a certain phenotype.22 The distance cutoff was 500 kb, taken from a study of the pathway-based approach of GWAS.23 Genes >500 kb away from the SNP were not considered as a neighboring gene. The most significantly associated marker was the SNP “rs7022373” (chromosome: 9:19452992; p-value=8.286E-8). The highest number of SNPs was found in the low handgrip strength index (a total of 8). The odds ratio of SNPs in the low handgrip strength index (ranging from 4.848–17.51) was higher comparing to the other two indices (ranging from 3.96–8.333). Collectively, sarcopenia-related SNPs revealed a closer association with low muscle strength.
 |
Table 2 Single Nucleotide Polymorphism (SNP) That Shows a Suggestive Significant Relationship with Sarcopenic Components by a Genome-Wide Association Study |
Boxplots in Supplementary Figure S2 show the differences in sarcopenic indices among genotypes of 12 SNPs. Generally, lower SMI (Supplementary Figure S2A), lower gait speed (Supplementary Figure S2B), and lower handgrip strength (Supplementary Figure S2C) were observed in heterozygous allele and nonreference homozygous allele genotypes.
Odds ratios of each selected SNP for the three sarcopenic indices (low SMI, gait speed, or handgrip strength) and sarcopenia itself were calculated (Table 3). The highest ORs for low SMI, low gait speed, and low handgrip strength were observed in rs79444246 (OR=12.238, p-value<0.001), rs78269470 (OR=33.530, p-value=0.002), and rs10282247 (OR=23.474, p-value<0.001), respectively. While some SNPs revealed significance in only a single component, others were significant in more than one sarcopenic factor. Those contributing higher risk to more than one sarcopenic manifestation (a total of eight SNPs) demonstrated their phenotype-association with sarcopenia in our study. Interestingly, all eight SNPs belonged to the low handgrip strength group in Table 2. A list of the eight identified SNPs, their closest genes and functions are provided in Table 4. Two of them (rs7022373, rs11231180) were located within gene, and the two located >500 kb away from the SNP were listed but not considered a neighboring gene in our discussion.
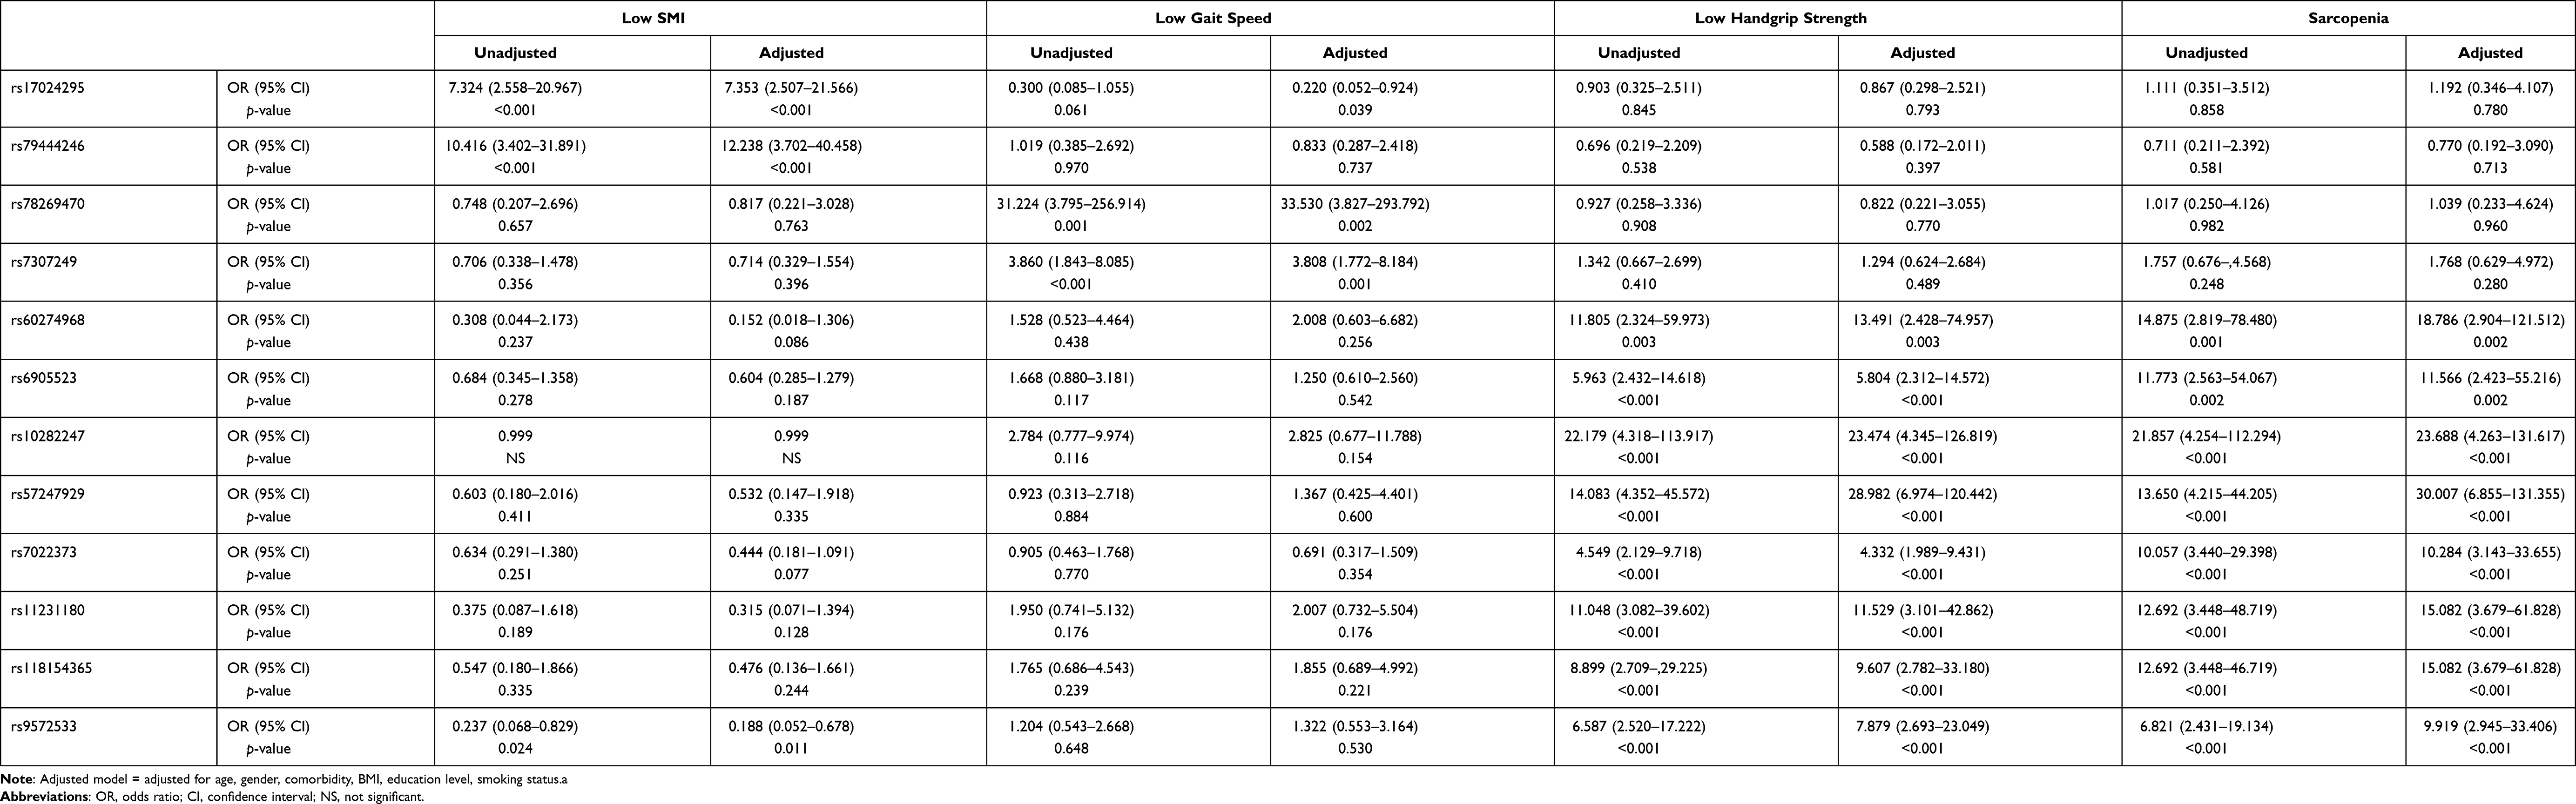 |
Table 3 Logistic Regression Results (Odds Ratio) for Different Sarcopenic Components in Selected Single Nucleotide Polymorphism (SNP) |
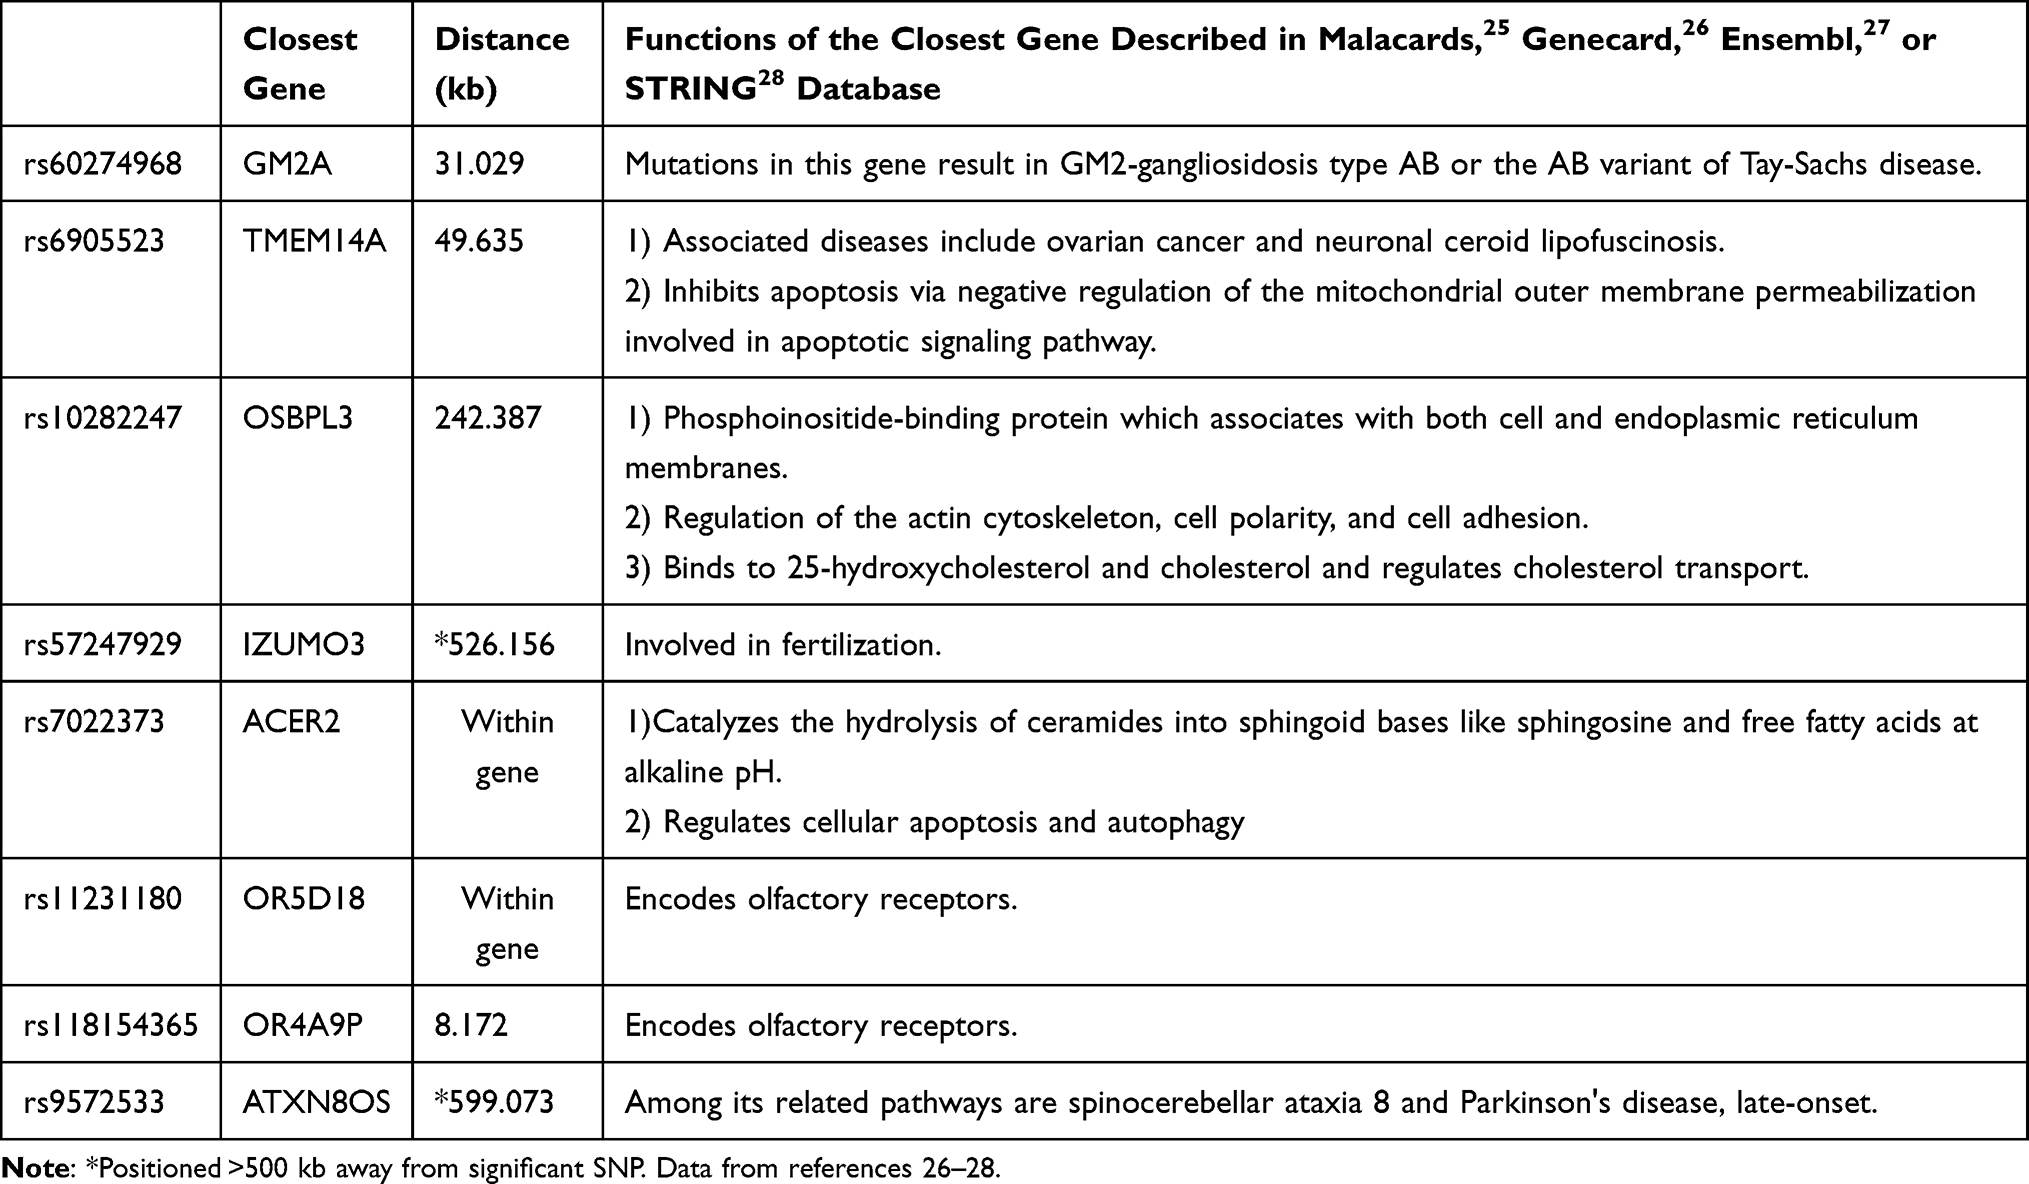 |
Table 4 List of Identified Single Nucleotide Polymorphisms (SNPs) That Revealed a Relationship with More Than the Sarcopenic Index |
Construction of a Sarcopenia-Related SNP Genotype Score
To evaluate the aggregating effect of these sarcopenia-SNPs to one subject, we constructed a genotype score by adding up the presence of the eight SNPs showing dual or multiple significance in the previous section (rs60274968, rs6905523, rs10282247, rs57247929, rs7022373, rs11231180, rs118154365, and rs9572533). A similar method was used in a study discussing the contribution of SNPs to the risk of cardiovascular disease.20 For each SNP, one point represents carrying at least one unfavorable allele, while zero points represents carrying none. Each subject was given a score ranging from 0 to 8 accordingly. In Table 5, we demonstrated that having a higher genotype score (≥4 points: OR=630.599, 95% CI=40.946–9711.758, p-value<0.001; 2–3 points: OR=408.000, 95% CI=34.740–4791.679, p-value<0.001) contributes to higher risk for sarcopenia.
 |
Table 5 Logistic Regression Results (Odds Ratio) for Sarcopenia in “Sarcopenia-Related SNP Genotype Scores” |
Discussion
Genetic influence on sarcopenia has earned attention only in recent decades comparing to the broadly investigated environmental factors.11 Our study delineated several new sarcopenia-related SNPs which have never been reported before. In addition, a novel sarcopenia-related SNP genotype score is proposed which not only provided an evaluation tool for clinical practice, but also illustrated that sarcopenia may resemble a quantitative trait that is affected by polygenic as well as environmental factors.
Novel Sarcopenia-Related SNPs Found in Our Study
Recent GWAS discussing sarcopenia-associated SNPs and genes obtained heterogeneous results, showing that genetic analysis of sarcopenia is still in its infancy. Our study, like many previous ones,13,24 faces the challenge of genetic annotation when linking the newly-discovered SNP to sarcopenia or muscle in a large bioinformatic database like the Malacards,25 Genecard,26 Ensembl,27 or STRING database.28 Despite there being no direct evidence that relates these SNPs/genes to molecular regulation in muscle tissue, some established mechanisms may indirectly or collaboratively affect muscle mass and function. Of the eight SNPs that constitute the sarcopenia-related genotype score, rs10282247 (closest gene: OSBPL3), rs7022373 (within gene: ACER2), rs11231180 (within gene: OR5D18), and rs118154365 (closest gene: OR4A9P) especially caught our eye.
Possible Mechanisms That Link These SNPs with Sarcopenia
First, oxysterol-binding protein like protein 3 (OSBPL3), the closest gene to rs10282247, encodes oxysterol-binding-related protein (ORP) 3 that serves as lipid transporters and manages cellular lipid metabolism. The ORP family is highly expressed in brain and muscle tissue and is known to interact with vimentin intermediate filaments.29 The UniProt database depicts ORP 3’s role in cholesterol binding,30 and therefore diseases that associate with cholesterol metabolism may be correlated with ORP dysfunction.31 Evidence suggests that outcomes of excessive cholesterol accumulation, oxidative stress, and chronic inflammation lead to sarcopenia,10 and particularly in sarcopenic-obesity.32 Therefore, dysregulation of OSBPL3 may fairly affect muscle health by accumulation of reactive oxygen species (ROS) and proinflammatory molecules. Secondly, rs7022373 locates within Alkaline Ceramidase 2 (ACER2) gene, which encodes a ceramidase that catalyzes the hydrolysis of ceramides to produce sphingosine. ACER2 remains a low level of expression in normal tissue but increases remarkably when encountering DNA damage.33 Studies have demonstrated its role in cellular apoptosis and autophagy,34 and highlighted these findings in several cancers.35,36 Sarcopenia, though never directly related to ACER2, is attributed by a shared mechanism of apoptosis.37 Studies have delineated the acceleration of myocyte apoptosis as an alarm regarding age-related muscle atrophy.38 Collectively, there is a possibility that rs7022373 regulates muscle loss via elevated level of apoptosis. Lastly, rs11231180 and rs118154365 locates within OR5D18 and closed to OR4A9P, respectively. They are both genes for olfactory receptors (ORs) that bind odorant molecules in the nose and trigger olfactory pathways that eventually give rise to the sense of smell. These receptors are, though not as abundantly in nasal epithelium, found in non-chemosensory organs.39 These ectopic expressions, including muscle, imply that ORs may play roles other than the initiation of smell. To date, evidence has revealed mouse olfactory receptor 23 (MOR23) to be involved in skeletal muscle development and regeneration.40,41 It has been proposed to resist abnormal myofiber branching and hence prevent muscular dystrophy.42 More researches are needed to explore if SNPs that affect other olfactory genes (like the ones in our study) have an impact on sarcopenia.
Recent Genetic Discoveries in Sarcopenia
Considering the multifactorial etiology of sarcopenia, the identification of genetic factors that are involved in the disease trajectory are becoming popular. Nevertheless, diverse results were presented owing to different sample groups or analytic methods, and revealed the large proportion of unknown in this field. A recent study demonstrated NUDT3 and KLF5 associating with lean mass, and HLA-DQB1-AS1 associated with hand grip strength.13 They drew a similar conclusion to ours that the three sarcopenic indices may correlate with different SNPs and genes. Another study conducted in community-dwelling older women in the UK demonstrated four SNPs that associated with skeletal muscle mass (%) and skeletal muscle mass index.14 FTO has been described as an obesity-related risk genotype; NOS3 regulates endothelial nitric oxide synthase and thus affects mitochondrial energy production in muscle; ESR1 encodes estrogen receptors that play a role in maintenance of muscle mass; and TRHR regulates thyroid hormone functions. A cohort study elucidated the SNAP-25 rs363050 AA genotype to be significantly more common in sarcopenic patients, but reduced SNAP-25-associated miRNA expression after rehabilitation.43 Taken together, these previous findings, as well as ours, proposed various SNPs and genes that were first mentioned in the genomic field of sarcopenia. Despite none reaching a common result, we discussed potential mechanisms that link these genes with sarcopenia, in the hope that future studies could take advantage of the shoulder of giants and get the full picture.
The Heterogenous Heritability of Sarcopenic Components
Moreover, low muscle strength was the sarcopenic component revealed to have a relationship with the highest number of SNPs. Though not clearly understood, this particular component showed stronger genetic determination compared to the other two (low muscle mass and low physical performance) in the present study. One review article evaluated recent studies on a related issue and concluded the heritability (h2) of muscle strength in sarcopenia ranged from 30–85%, while muscle mass ranged from 45–90%.11 Heterogenous results in various GWAS studies implied that the power of genetic determination in sarcopenia still needs validation. Differences among studies, no matter the characteristics of participants or the measurement methods, may be the contributing factor to diverse results. Taking muscle strength as an example, different sites of measurements gave divergent results. The estimated h2 of handgrip strength was 30–52%,44,45 with h2 of quadriceps strength being 31–78%,46,47 and lower limb muscle strength being 42–64%.45,48 In addition, such a genetic contribution seemed to account for the smaller fraction of etiology in sarcopenia in the older population. A study of the National Heart, Lung, and Blood Institute (NHLBI) twin study with a 10-year follow-up period discovered a decline in heritability (at baseline: 35% of the variance; at follow-up: 22% of the variance) and increase in environmental effects (at baseline: 39% of the variance; at follow-up: 45% of the variance) toward sarcopenia. A reasonable explanation is the impact of environmental factors accumulates and enhances its influence on sarcopenia with the increase of age. Environmental factors like sedentary lifestyles,5 adiposity,9 and multi-morbidity7,8 cause chronic inflammation and thus start to show up their damage late in life. Therefore, a further study on heritability of sarcopenia should take these variables into consideration when interpreting results.
A Genotype Score Allows an Estimate of Combined Effects of These SNPs on Sarcopenia
Another highlight in our study is the construction of sarcopenia-related SNP genotype score and the demonstration that higher scores link to higher risk for sarcopenia. The idea of such a scoring model is inspired by an article that predicted the risk of cardiovascular disease using a genotype score composed of nine SNPs that were significantly associated with higher low-density lipoprotein (LDL) cholesterol levels or lower high-density lipoprotein (HDL) cholesterol levels.20 They created the genotype score on the assumption that individual SNP with a modest effect on lipid levels would have limited capacity to show a significant influence on cardiovascular events. Likewise, we discovered previous studies mostly discussing individual SNP affecting sarcopenia, but were unable to demonstrate which SNP or gene playing key roles were due to scattering results. In the past year, a few GWAS studies on sarcopenia have introduced a similar scoring system to better analyze associations between genetic inheritance and phenotypic traits. One study done in Manchester Metropolitan University calculated a muscle‐driven genetic predisposition score based on seven muscle‐related SNPs.49 They concluded that there was a higher score in the sarcopenic group compared to the non‐sarcopenic group. Though with a small sample size and a single sex (48 Caucasian women aged 65–79 years old), they provided the idea that investigating the combined genetic association with physical phenotypes is applicable with a scoring model. Another study in Slovenia presented the Total Sarcopenia Genetic Risk Score, which added up effects of three candidate genes.50 They also found an increased risk of sarcopenia in participants with a higher score based on the assumption that the polygenic profile gives an additive effect. These emerging applications illustrated that GWAS in sarcopenia may gain benefit from constructing a scoring model. In terms of the polygenic trait of sarcopenia, the cumulative effects of many genes contribute to this phenotype. Hence, a polygenic risk score approach could serve as a practical tool to evaluate the combined genetic contribution of relevant polymorphism to the targeted phenotypic trait.
Limitations of Our Study
The current study, however, has several limitations. First, our participants were recruited from a single medical institution in Taiwan, ROC. All of them were Taiwanese adults aged above 60 years old. Due to the sampling from limited ethnicity and range of age, the generalizability of our result may be less convincing. Secondly, due to the established exam items in the annual geriatric health check-up in TSGH, we could only obtain low muscle mass from measurement using BIA. Nevertheless, dual-energy X-ray absorptiometry (DXA) has been considered as a better reference standard for measuring muscle lean body mass.51,52 Further study is warranted to extend the applicability of GWAS in sarcopenia and validate replication of existing studies.
Conclusion
Our study found eight sarcopenia-related SNPs which has never been reported before. Among them, rs10282247 affects cholesterol metabolism, and rs7022373 participates in cellular apoptosis. Though not directly associated with sarcopenia, a shared underlying mechanism may be inferred. Other SNPs which mostly located in intergenic regions require further study to verify their functions. Moreover, a novel sarcopenia-related SNP genotype score was constructed, and higher scores were demonstrated to link to increase in risk. Such a composite score provides estimation of the combined effect of multiple genes and relates them to the phenotype of interest, which has advantages in polygenic traits like sarcopenia.
Data Sharing Statement
Raw data were generated at Tri-Service General Hospital. Derived data supporting the findings of this study are available from the corresponding author on request.
Ethics Approval and Consent to Participate
All participants in Taiwan Precision Medicine Initiative (TPMI) provide written informed consent. This study was approved by the Institutional Review Board of the Tri-Service General Hospital, National Defense Medical Center (TSGH IRB No. 1-107-05-178 and No. 2-108-05-038).
Author Contributions
All authors made substantial contributions to the conception and design, acquisition of data, or analysis and interpretation of data; took part in drafting the article or revising it critically for important intellectual content; agreed to submit to the current journal; gave final approval of the version to be published; and agreed to be accountable for all aspects of the work.
Funding
This research did not receive any specific grant from funding agencies in the public, commercial, or not-for-profit sectors.
Disclosure
The authors declare no competing interests.
References
1. Cruz-Jentoft AJ, Bahat G, Bauer J, et al. Sarcopenia: revised European consensus on definition and diagnosis. Age Ageing. 2019;48(1):16–31. doi:10.1093/ageing/afy169
2. Beaudart C, Zaaria M, Pasleau F, Reginster JY, Bruyère O. Health outcomes of sarcopenia: a systematic review and meta-analysis. PLoS One. 2017;12(1):e0169548. doi:10.1371/journal.pone.0169548
3. Zhang H, Lin S, Gao T, et al. Association between sarcopenia and metabolic syndrome in middle-aged and older non-obese adults: a systematic review and meta-analysis. Nutrients. 2018;10(3):364. doi:10.3390/nu10030364
4. Kim SH, Jeong JB, Kang J, et al. Association between sarcopenia level and metabolic syndrome. PLoS One. 2021;16(3):e0248856. doi:10.1371/journal.pone.0248856
5. Gianoudis J, Bailey CA, Daly RM. Associations between sedentary behaviour and body composition, muscle function and sarcopenia in community-dwelling older adults. Osteoporos Int. 2015;26(2):571–579. doi:10.1007/s00198-014-2895-y
6. Messier V, Rabasa-Lhoret R, Barbat-Artigas S, Elisha B, Karelis AD, Aubertin-Leheudre M. Menopause and sarcopenia: a potential role for sex hormones. Maturitas. 2011;68(4):331–336. doi:10.1016/j.maturitas.2011.01.014
7. Pereira RA, Cordeiro AC, Avesani CM, et al. Sarcopenia in chronic kidney disease on conservative therapy: prevalence and association with mortality. Nephrol Dial Transplant. 2015;30(10):1718–1725. doi:10.1093/ndt/gfv133
8. Umegaki H. Sarcopenia and diabetes: hyperglycemia is a risk factor for age-associated muscle mass and functional reduction. J Diabetes Investig. 2015;6(6):623–624. doi:10.1111/jdi.12365
9. Cesari M, Kritchevsky SB, Baumgartner RN, et al. Sarcopenia, obesity, and inflammation–results from the trial of angiotensin converting enzyme inhibition and novel cardiovascular risk factors study. Am J Clin Nutr. 2005;82(2):428–434. doi:10.1093/ajcn.82.2.428
10. Meng SJ, Yu LJ. Oxidative stress, molecular inflammation and sarcopenia. Int J Mol Sci. 2010;11(4):1509–1526. doi:10.3390/ijms11041509
11. Tan LJ, Liu S-L, Lei SF, Papasian CJ, Deng HW. Molecular genetic studies of gene identification for sarcopenia. Hum Genet. 2012;131(1):1–31. doi:10.1007/s00439-011-1040-7
12. Ran S, He X, Jiang ZX, et al. Whole-exome sequencing and genome-wide association studies identify novel sarcopenia risk genes in Han Chinese. Mol Genet Genomic Med. 2020;8(8):e1267. doi:10.1002/mgg3.1267
13. Singh AN, Gasman B. Disentangling the genetics of sarcopenia: prioritization of NUDT3 and KLF5 as genes for lean mass & HLA-DQB1-AS1 for hand grip strength with the associated enhancing SNPs & a scoring system. BMC Med Genet. 2020;21(1):40. doi:10.1186/s12881-020-0977-6
14. Khanal P, He L, Stebbings G, et al. Prevalence and association of single nucleotide polymorphisms with sarcopenia in older women depends on definition. Sci Rep. 2020;10(1):2913. doi:10.1038/s41598-020-59722-9
15. Sinica A. Taiwan precision medicine initiative. Available from: https://tpmi.ibms.sinica.edu.tw/www/en/.
16. Chen LK, Woo J, Assantachai P, et al. Asian Working Group for Sarcopenia: 2019 consensus update on sarcopenia diagnosis and treatment. J Am Med Dir Assoc. 2020;21(3):300–307.e2. doi:10.1016/j.jamda.2019.12.012
17. Lonsdale J, Thomas J, Salvatore M. The Genotype-Tissue Expression (GTEx) project. Nat Genet. 2013;45(6):580–585. doi:10.1038/ng.2653
18. Pe’er I, Yelensky R, Altshuler D, Daly MJ. Estimation of the multiple testing burden for genomewide association studies of nearly all common variants. Genet Epidemiol. 2008;32(4):381–385. doi:10.1002/gepi.20303
19. Dudbridge F, Gusnanto A. Estimation of significance thresholds for genomewide association scans. Genet Epidemiol. 2008;32(3):227–234. doi:10.1002/gepi.20297
20. Kathiresan S, Melander O, Anevski D, et al. Polymorphisms associated with cholesterol and risk of cardiovascular events. N Engl J Med. 2008;358(12):1240–1249. doi:10.1056/NEJMoa0706728
21. Maurano MT, Humbert R, Rynes E, et al. Systematic localization of common disease-associated variation in regulatory DNA. Science. 2012;337(6099):1190–1195. doi:10.1126/science.1222794
22. Brodie A, Azaria JR, Ofran Y. How far from the SNP may the causative genes be? Nucleic Acids Res. 2016;44(13):6046–6054. doi:10.1093/nar/gkw500
23. Wang K, Li M, Bucan M. Pathway-based approaches for analysis of genomewide association studies. Am J Hum Genet. 2007;81(6):1278–1283. doi:10.1086/522374
24. Zillikens MC, Demissie S, Hsu YH, et al. Large meta-analysis of genome-wide association studies identifies five loci for lean body mass. Nat Commun. 2017;8(1):80. doi:10.1038/s41467-017-00031-7
25. Rappaport N, Nativ N, Stelzer G, et al. MalaCards: an integrated compendium for diseases and their annotation. Database. 2013;2013:bat018. doi:10.1093/database/bat018
26. Safran M, Dalah I, Alexander J, et al. GeneCards Version 3: the human gene integrator. Database. 2010;2010:baq020. doi:10.1093/database/baq020
27. Howe KL, Achuthan P, Allen J, et al. Ensembl 2021. Nucleic Acids Res. 2021;49(D1):D884–D891. doi:10.1093/nar/gkaa942
28. Szklarczyk D, Gable AL, Lyon D, et al. STRING v11: protein-protein association networks with increased coverage, supporting functional discovery in genome-wide experimental datasets. Nucleic Acids Res. 2019;47(D1):D607–d613. doi:10.1093/nar/gky1131
29. Wang C, JeBailey L, Ridgway ND. Oxysterol-binding-protein (OSBP)-related protein 4 binds 25-hydroxycholesterol and interacts with vimentin intermediate filaments. Biochem J. 2002;361(Pt3):461–472. doi:10.1042/0264-6021:3610461
30. Consortium U. UniProt: a hub for protein information. Nucleic Acids Res. 2015;43(D1):D204–D212.
31. Poli G, Biasi F, Leonarduzzi G. Oxysterols in the pathogenesis of major chronic diseases. Redox Biol. 2013;1(1):125–130. doi:10.1016/j.redox.2012.12.001
32. Bellanti F, Romano AD, Lo Buglio A, et al. Oxidative stress is increased in sarcopenia and associated with cardiovascular disease risk in sarcopenic obesity. Maturitas. 2018;109:6–12. doi:10.1016/j.maturitas.2017.12.002
33. Xu R, Wang K, Mileva I, Hannun YA, Obeid LM, Mao C. Alkaline ceramidase 2 and its bioactive product sphingosine are novel regulators of the DNA damage response. Oncotarget. 2016;7(14):18440–18457. doi:10.18632/oncotarget.7825
34. Wang Y, Zhang C, Jin Y, et al. Alkaline ceramidase 2 is a novel direct target of p53 and induces autophagy and apoptosis through ROS generation. Sci Rep. 2017;7(1):44573. doi:10.1038/srep44573
35. Liu B, Xiao J, Dong M, Qiu Z, Jin J. Human alkaline ceramidase 2 promotes the growth, invasion, and migration of hepatocellular carcinoma cells via sphingomyelin phosphodiesterase acid-like 3B. Cancer Sci. 2020;111(7):2259–2274. doi:10.1111/cas.14453
36. Mao Z, Sun W, Xu R, et al. Alkaline ceramidase 2 (ACER2) and its product dihydrosphingosine mediate the cytotoxicity of N-(4-hydroxyphenyl)retinamide in tumor cells. J Biol Chem. 2010;285(38):29078–29090. doi:10.1074/jbc.M110.105296
37. Marzetti E, Leeuwenburgh C. Skeletal muscle apoptosis, sarcopenia and frailty at old age. Exp Gerontol. 2006;41(12):1234–1238. doi:10.1016/j.exger.2006.08.011
38. Dupont-Versteegden EE. Apoptosis in muscle atrophy: relevance to sarcopenia. Exp Gerontol. 2005;40(6):473–481. doi:10.1016/j.exger.2005.04.003
39. Kang N, Koo J. Olfactory receptors in non-chemosensory tissues. BMB Rep. 2012;45(11):612–622. doi:10.5483/bmbrep.2012.45.11.232
40. Griffin CA, Kafadar KA, Pavlath GK. MOR23 promotes muscle regeneration and regulates cell adhesion and migration. Dev Cell. 2009;17(5):649–661. doi:10.1016/j.devcel.2009.09.004
41. Tong T, Kim M, Park T. α-Cedrene, a newly identified ligand of MOR23, increases skeletal muscle mass and strength. Mol Nutr Food Res. 2018;62(15):e1800173. doi:10.1002/mnfr.201800173
42. Pichavant C, Burkholder TJ, Pavlath GK. Decrease of myofiber branching via muscle-specific expression of the olfactory receptor mOR23 in dystrophic muscle leads to protection against mechanical stress. Skelet Muscle. 2016;6(1):2. doi:10.1186/s13395-016-0077-7
43. Agostini S, Mancuso R, Costa AS, et al. Sarcopenia associates with SNAP-25 SNPs and a miRNAs profile which is modulated by structured rehabilitation treatment. J Transl Med. 2021;19(1):315. doi:10.1186/s12967-021-02989-x
44. Arden NK, Spector TD. Genetic influences on muscle strength, lean body mass, and bone mineral density: a twin study. J Bone Miner Res. 1997;12(12):2076–2081. doi:10.1359/jbmr.1997.12.12.2076
45. Frederiksen H, Gaist D, Petersen HC, et al. Hand grip strength: a phenotype suitable for identifying genetic variants affecting mid- and late-life physical functioning. Genet Epidemiol. 2002;23(2):110–122. doi:10.1002/gepi.1127
46. Huygens W, Thomis MA, Peeters MW, et al. Linkage of myostatin pathway genes with knee strength in humans. Physiol Genomics. 2004;17(3):264–270. doi:10.1152/physiolgenomics.00224.2003
47. Tiainen K, Sipilä S, Alen M, et al. Heritability of maximal isometric muscle strength in older female twins. J Appl Physiol. 2004;96(1):173–180. doi:10.1152/japplphysiol.00200.2003
48. Zhai G, Ding C, Stankovich J, Cicuttini F, Jones G. The genetic contribution to longitudinal changes in knee structure and muscle strength: a sibpair study. Arthritis Rheum. 2005;52(9):2830–2834. doi:10.1002/art.21267
49. He L, Khanal P, Morse CI, Williams A, Thomis M. Associations of combined genetic and epigenetic scores with muscle size and muscle strength: a pilot study in older women. J Cachexia Sarcopenia Muscle. 2020;11(6):1548–1561. doi:10.1002/jcsm.12585
50. Urzi F, Pokorny B, Buzan E. Pilot study on genetic associations with age-related sarcopenia. Front Genet. 2020;11:1754.
51. Buckinx F, Landi F, Cesari M, et al. Pitfalls in the measurement of muscle mass: a need for a reference standard. J Cachexia Sarcopenia Muscle. 2018;9(2):269–278. doi:10.1002/jcsm.12268
52. Kim J, Wang Z, Heymsfield SB, Baumgartner RN, Gallagher D. Total-body skeletal muscle mass: estimation by a new dual-energy X-ray absorptiometry method. Am J Clin Nutr. 2002;76(2):378–383. doi:10.1093/ajcn/76.2.378
 © 2021 The Author(s). This work is published and licensed by Dove Medical Press Limited. The
full terms of this license are available at https://www.dovepress.com/terms
and incorporate the Creative Commons Attribution
- Non Commercial (unported, 3.0) License.
By accessing the work you hereby accept the Terms. Non-commercial uses of the work are permitted
without any further permission from Dove Medical Press Limited, provided the work is properly
attributed. For permission for commercial use of this work, please see paragraphs 4.2 and 5 of our Terms.
© 2021 The Author(s). This work is published and licensed by Dove Medical Press Limited. The
full terms of this license are available at https://www.dovepress.com/terms
and incorporate the Creative Commons Attribution
- Non Commercial (unported, 3.0) License.
By accessing the work you hereby accept the Terms. Non-commercial uses of the work are permitted
without any further permission from Dove Medical Press Limited, provided the work is properly
attributed. For permission for commercial use of this work, please see paragraphs 4.2 and 5 of our Terms.