")
Back to Journals » Advances in Medical Education and Practice » Volume 11
A Day in the Life of an Internal Medicine Resident – A Time Study: What Is Changed from First to Third Year?
Authors Wieler J, Lehman E, Khalid M, Hennrikus E
Received 1 February 2020
Accepted for publication 15 March 2020
Published 30 March 2020 Volume 2020:11 Pages 253—258
DOI https://doi.org/10.2147/AMEP.S247974
Checked for plagiarism Yes
Review by Single anonymous peer review
Peer reviewer comments 2
Editor who approved publication: Prof. Dr. Balakrishnan Nair
Jane Wieler,1 Erik Lehman,2 Muhammad Khalid,3 Eileen Hennrikus3
1Department of Emergency Medicine, Jefferson University Medical Center, Philadelphia, PA, USA; 2Department of Public Health Sciences, Pennsylvania State University College of Medicine, Hershey, PA, USA; 3Department of Internal Medicine, Pennsylvania State University College of Medicine and Hershey Medical Center, Hershey, PA, USA
Correspondence: Eileen Hennrikus Email [email protected]
Background: In the past decade, internal medicine residencies have undergone major changes in competency-based assessments, work-hour restrictions and the implementation of the electronic medical record. The aim of this study is to compare a typical day of a first year post-graduate (PGY1) to that of a third year post-graduate (PGY3) internal medicine resident and examine if the differences in their days demonstrate the American Board of Internal Medicine’s (ABIM) desired progression towards competency-based milestones and unsupervised practice.
Methods: We conducted an observational time study documenting 14,103 minutes, 9 major categories, and 17 subcategories while shadowing 10 internal medicine PGY1s and 10 PGY3s during inpatient, non-call days. The following day, house staff completed surveys of their perceived time allocation of the previous 24 hours.
Results: PGY1s spent an average of 12.5 hours managing an average of 6 patients. Thirty-eight percent of their time was spent on the computer, 21% discussing patients and 18% directly with patients. PGY3s, overseeing an average of 12 patients, worked 1.5 hours less per day (p< 0.001), had 1.5 hours less computer time (p=0.001), 24 minutes less direct patient contact (p=0.045), and 36 minutes more patient care discussions (p=0.011).
Conclusion: The difference between PGY1s’ and PGY3s’ daily time allocations is minimal. Whereas a PGY3 spends 1.5 hours less than a PGY1 on writing computer notes and discharges, they also work 1.5 hours less per day. The additional 36 minutes of patient care discussions was the only significant time quantity difference that would be considered a higher level of practice for the PGY3 compared to the PGY1. With residents now caring for fewer patients, there has been a marked increase in computer time per patient for both PGY1s and PGY3s.
Keywords: time allocations, residents, competency-based milestones
Introduction
Background
Resident work-hour restrictions, the electronic health record (EHR) and computerized provider order entry (CPOE) have altered resident workflow.1–6 However, the basic premise that as residents progress through their programs, they are expected to transition from collecting and conveying facts to more clinical reasoning, decision-making, and discussion of the evidence has not changed. The American Board of Internal Medicine (ABIM) has adjusted assessments of resident education to a competency-based framework and attainment of milestones for independent practice. The six general competencies are medical knowledge, patient care, professionalism, interpersonal and communication skills, practice-based learning and improvement and systems-based practice. Each competency has 20–30 milestones.7
Objectives
In this time study, our primary goal was to determine if there was any significant difference in the daily work allocation between post-graduate year 1 (PGY1) and post-graduate year 3 (PGY3) and if residents were performing higher-order tasks, consistent with the ABIM’s competency-based framework, as they progressed through training.
Residency program directors depend on resident surveys to evaluate work hours and educational satisfaction. To measure the accuracy of resident reporting, we surveyed resident’s perception of how they spent their time and compared their responses with the actual time measured.
Methods
Setting
Investigation was performed at Penn State Health, Milton S. Hershey Medical Center, Hershey, PA, USA. This study was approved by the Penn State College of Medicine IRB. Three general internal medicine ward teams consisted of two PGY1s, a PGY2 or PGY3, an attending and a third and/or fourth year student. The fourth team was a nonteaching hospitalist service. All residents were required to participate in a weekly afternoon clinic, and all resident team members had one mandatory day off per week. Day admissions (7am–3pm) were sequentially distributed to the four teams. For each team, on three of four days, admissions stopped at 3pm and residents signed out by 6pm. Every fourth day the “long call” team took all admissions after 3pm until 7pm. Patient census was capped at 14 patients per teaching team. The study was conducted mid-year from November through February.
Two hours of formal education were provided daily. Morning conferences from 7:30 to 8:30am were either Grand Rounds or Morning Report. One hour noon conferences were also provided daily.
Participants
Ten PGY1s and 10 PGY3s on the general medicine ward rotation provided consent and were observed throughout one of their “non-long call” workdays, from sign-in to sign-out. Each resident was shadowed once on a day that they did not have afternoon clinic. Eight different attendings were supervising the teams during the observations, providing a randomization of attending influence over the workday. Patient bedside rounds and duration of rounds were at the discretion of the attending.
Design Overview
One research assistant (JW) shadowed consenting residents on non-call days: recording data, accounting for every minute of their day. A stopwatch was used and data were recorded on a spreadsheet with all the task categories. Timing was as precise as to measure half a minute of an activity. The research assistant counted the number of minutes shadowing the resident and then compared this to the number of minutes that were counted. On average, the difference between counted and actual time was only 3.5 minutes per day.
There were 9 major time categories and 17 subcategories. Direct patient care included any time when the resident was physically at the patient’s bedside, either individually or during team rounds. Indirect patient care included discussions outside the room during rounds, discussions with the team or consulting physicians, signing in and out, clerical work and phone calls to nursing, primary care physicians, family members, and pharmacy. Computer entry included writing notes, entering patient orders, and entering discharge and admission notes and orders. Computer retrieval included looking up patient history, labs and diagnostic tests. Nurse contact was defined as face-to-face interaction with nurses, care coordinators and social workers. The education category included time spent in formal conferences, personal reading, and team teaching other than rounds. Non-electronic clerical work included faxing, printing papers, writing out prescriptions. Travel was walking through the hospital to and from patients’ rooms. For instances of multi-tasking, eg walking and talking on the phone, the time recorded was split in half between those task categories.
The participants received two surveys on the day following their observation. The first survey measured their perception of their previous day’s time allocations. The second survey inquired about their overnight time allocation.
Statistical Analysis
All analyses were carried out using SAS Software version 9.3 (SAS Institute, Cary, NC), and a significance level of 0.05 was used for all comparisons. The percentage of time spent on each task was calculated. Means and standard deviations were used to summarize the time and percentage spent on each task overall and by group. A Two-sample t-test was utilized to compare the mean time spent on each task in hours as well as the mean percentage of time spent on each task between interns and senior residents. Comparisons were made for the combination of the two groups between the mean perceived and mean actual time spent in minutes on each task using a paired t-test. A Two-sample t-test was also employed to make a comparison between interns and residents in terms of the mean difference between the perceived and actual time spent in minutes on each task.
Results
Ten internal medicine PGY1s and ten PGY3s were followed for a total of 14,103 minutes (235.1 hours) of observation. Due to mandatory “days off” and afternoon clinics, the team of two PGY1s and a PGY3 were present the entire day 15% of the time.
On average, PGY1s cared for six patients, had one admission and 1.5 discharges daily. Patient census averaged 13 patients per medical team during all of the observations. The average PGY1 workday was 12.5 hours. PGY3s worked on average 1.5 hours less per day than the PGY1s (p<0.001).
PGY3s spent less time, an average of 1.8 hours (16.1%) of their workday on direct patient care compared to PGY1s’ 2.2 hours (18%) (p=0.045). PGY3s spent 3.0 hours (27.5%) of their day, similar to PGY1s’ 2.7 hours (21.0%) on indirect patient care activities. However, within that category, PGY3s spent more time than PGY1s (36 minutes) discussing patient care with other professionals (p=0.011). PGY3s spent 3.4 hours (30.4%) and PGY1s 4.9 hours (38.6%) on the computer retrieving and entering data; PGY1s spending a greater amount of time on computer entry than PGY3s (p=<0.002). Formal educational activities (conferences, teaching, reading) were 48 minutes (7.3%) per day for PGY3s and 24 minutes (3%) per day for PGY1s (p=0.046). PGY1s spent on average 12 minutes and PGY3s 30 minutes in conferences that are scheduled 2 hours every day. PGY1s averaged 6 minutes; PGY3s averaged 12 minutes of daily reading while in the hospital (Table 1).
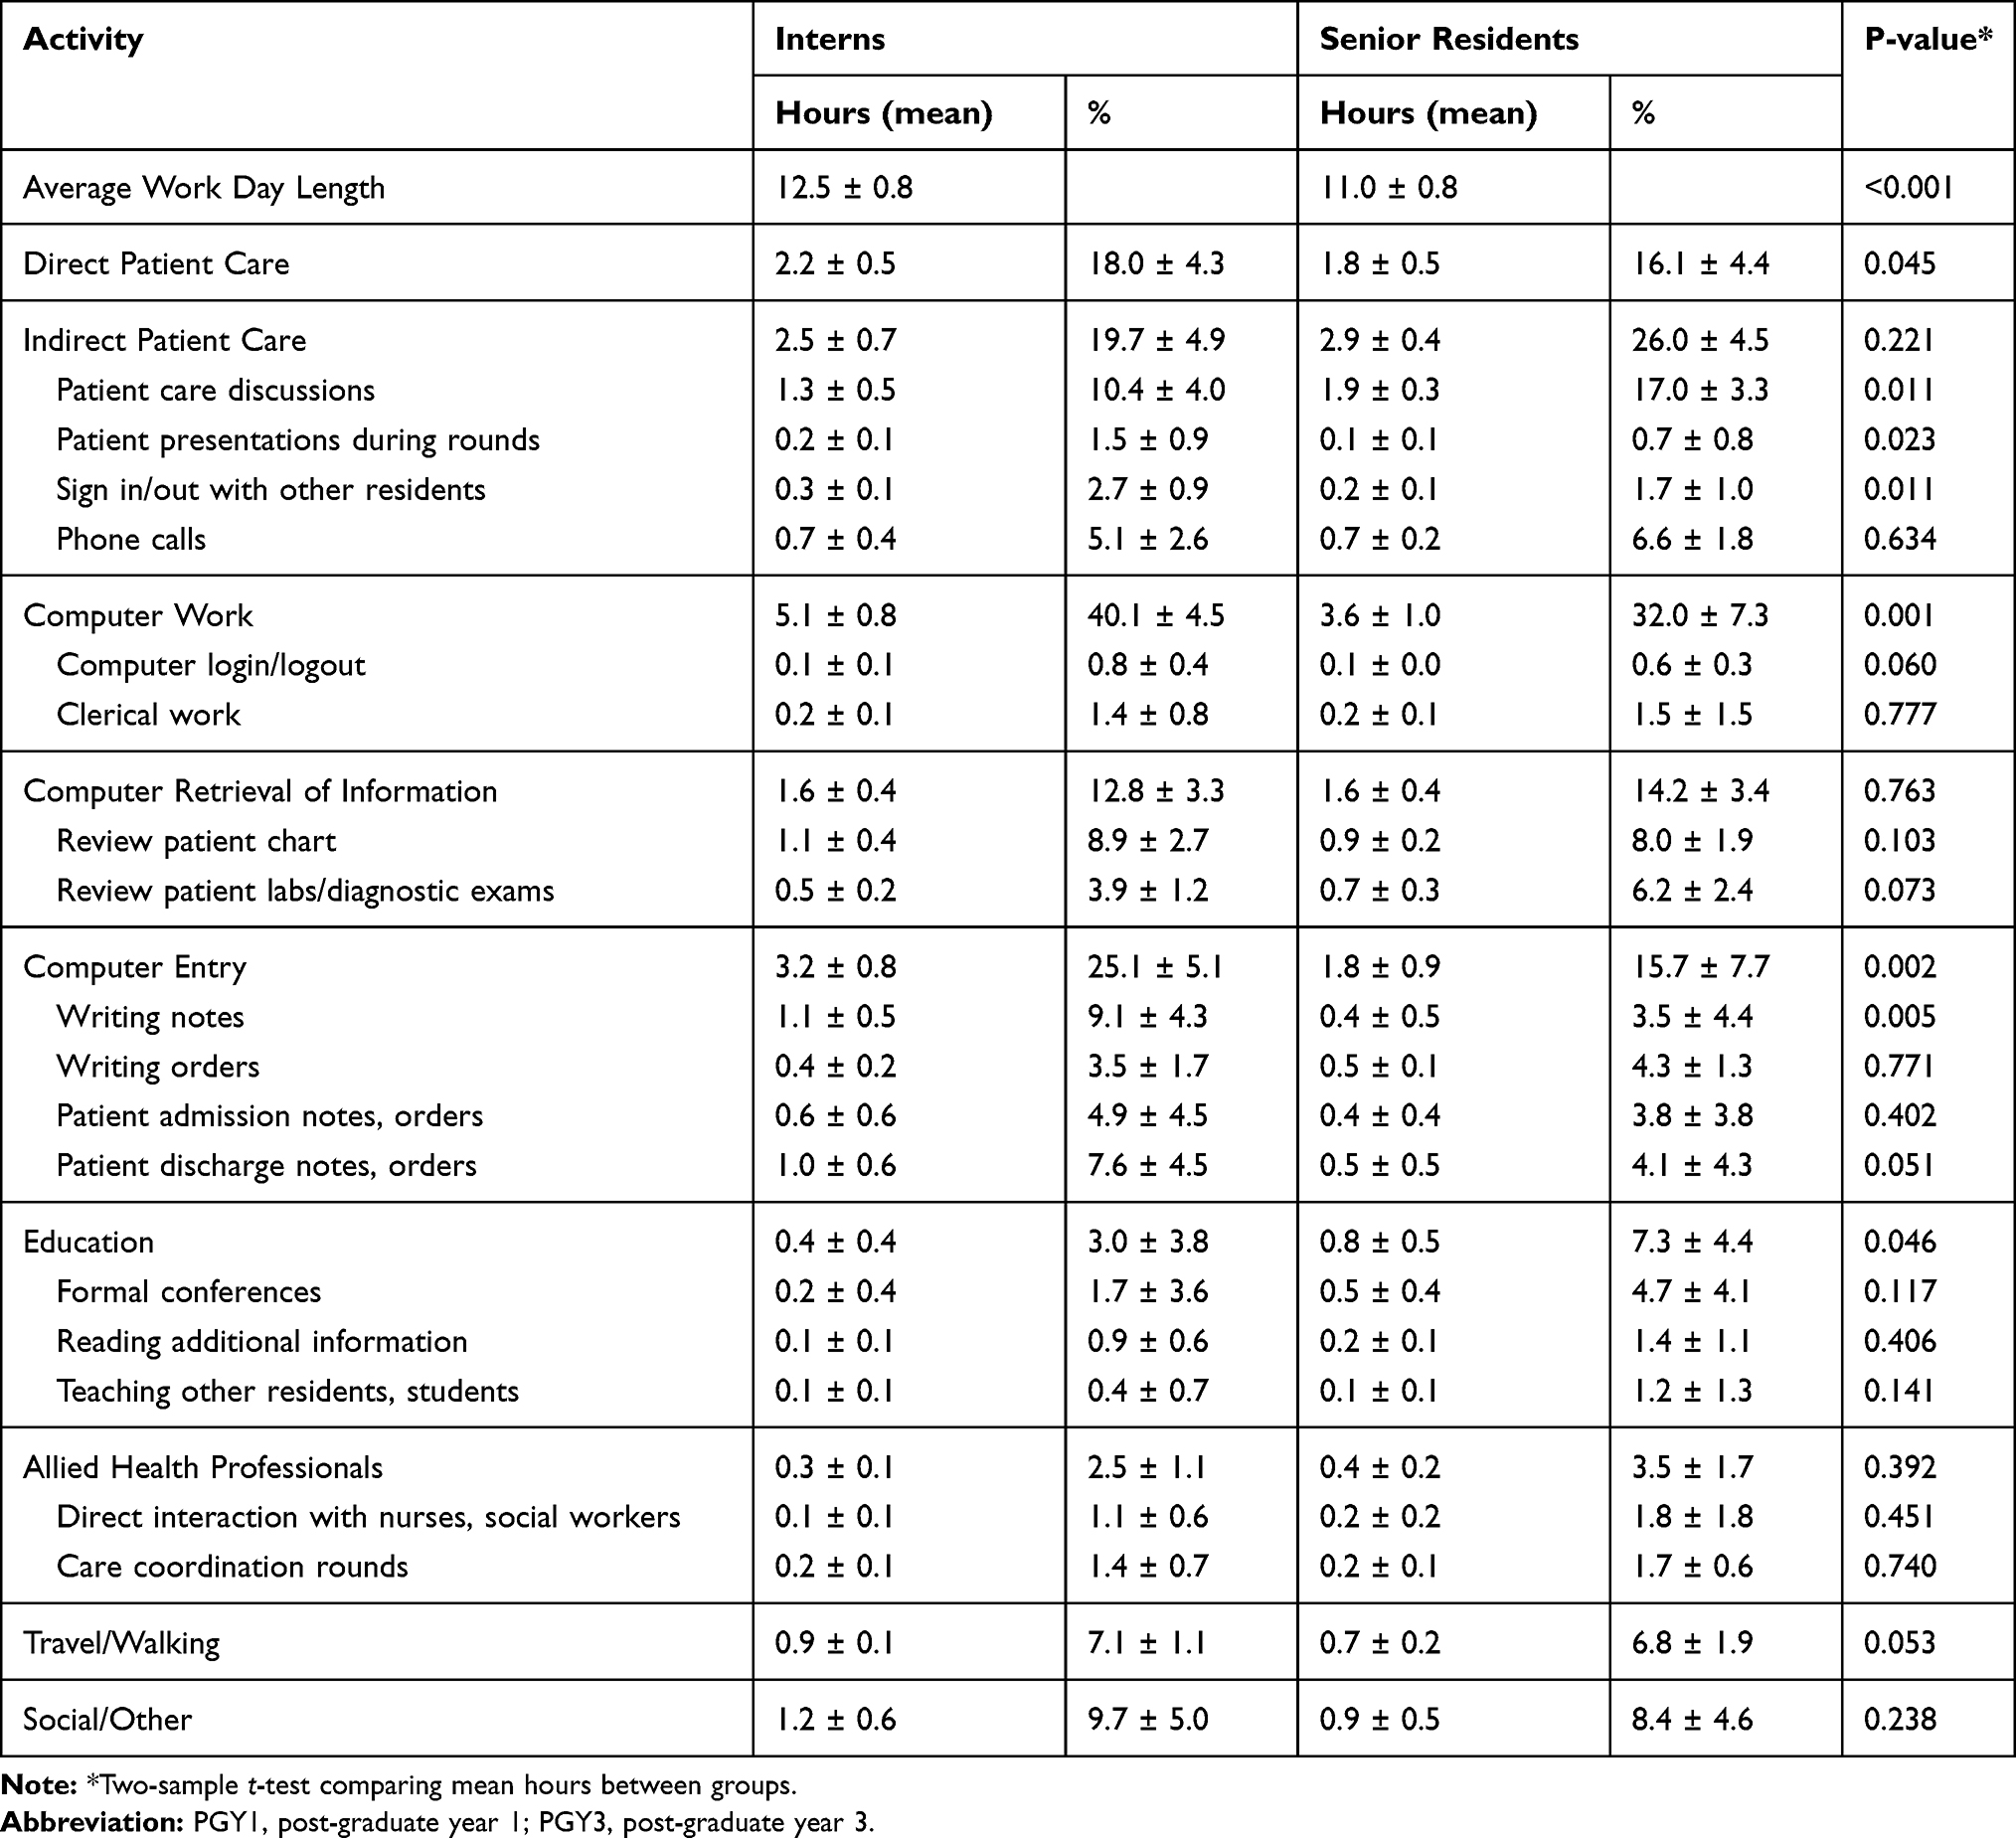 |
Table 1 PGY1 vs PGY3 Work Day Time Allocation |
PGY3s and PGY1s spent 24 minutes (3.5%) and 18 minutes (2.5%) respectively in face-to-face nursing communication but perceived that they spent twice that much time (p=0.003). Time traveling through the hospital was slightly greater for PGY1s than PGY3s (54 minutes compared to 42 min, p=0.05) but was underestimated by both groups (p=0.005). For the other five task categories, PGY1s’ and PGY3s’ perceptions were similar to the actual time spent on each task (Table 2).
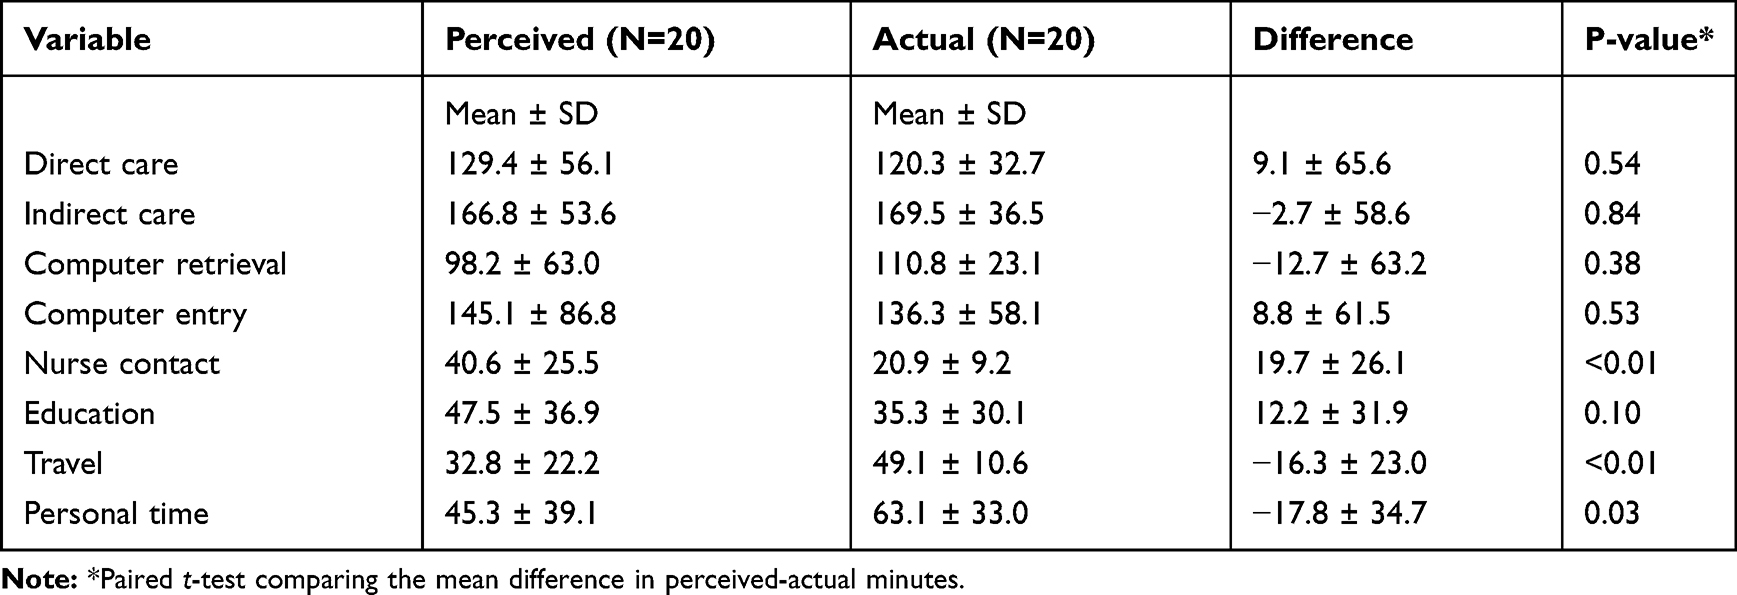 |
Table 2 Resident Tasks: Perceived Time vs Actual Time (minutes) |
With an average of 12 hours off duty, house staff spent the majority of that time sleeping (mean, 6.6 hours), 3% on educational reading. A mean of 2.4 hours was unaccounted for. There were no significant differences in off-duty time usage between PGY1s and PGY3s (Table 3).
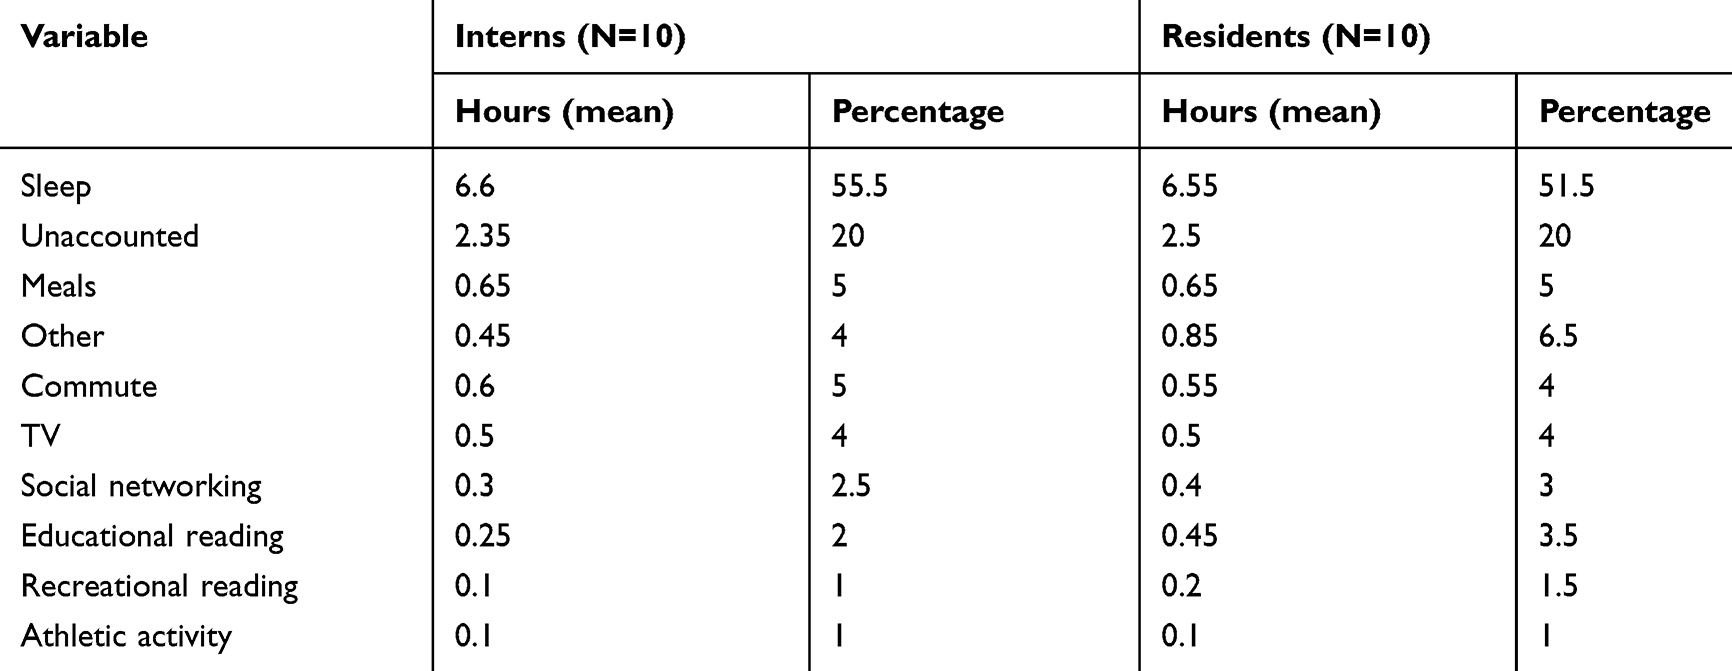 |
Table 3 Resident Activities During off-Duty Hours |
Discussion
In this time study of internal medicine PGY1s compared to PGY3s, we demonstrated minimal differences in their daily ward-service time allocations. The greatest portion of a PGY1’s day is spent on the computer (40%), followed by indirect patient care (20%), direct patient care (18%) and education (3%). PGY3s follow the same pattern: 32%, 26%, 16% and 7%, respectively. Prior literature examining resident time allocations is similar: 32–41% computer time, 12–18% direct patient care, 3–7% on formal education.8–10
The PGY1s had a significantly longer day than the PGY3s, 1.5 hours longer. The amount of computer entry was significantly higher for PGY1s, mostly from writing daily progress notes and completing discharge notes. They also had greater direct patient care, due to “pre-rounding.” Transit time (7%) and personal time (9%) were about the same for PGY1s and PGY3s.
Resident work hours on a non-call day have not changed substantially over the years, averaging between 10 and 12 hours.11–14 However, the patient census has decreased from 8 to 12 patients15,16 to an average of 6–7 patients per intern. Time spent on paper or computer work has risen 10–15% for PGY1s and 7% for PGY3s. Documentation and charting has gone up by 4–5% for both PGY1s and PGY3s. Inputting orders and reviewing labs has increased 5–15%.8–15 This increase in chart time has occurred while the number of patients has halved. Therefore, per patient, the amount of documentation, inputting orders and reviewing labs has markedly risen.
Documentation requirements have increased over the years, with attention now directed at having all the necessary billing components. The complexity of the CPOE has increased computer order entry time. We suspect that the increased complexity of patients and their medical treatment has led to the increase in time spent reviewing labs and diagnostic results. Much of the computer time is looking up and conveying factual information. The additional 10% of PGY3 time discussing patients with other health-care professionals could be viewed as time allocated to clinical reasoning: integrating knowledge and experience, and applying it to the practical management of patient care.17
Designated education time was the lowest percentage despite the availability of daily morning and noon conferences (designated 16–20% of the day). Two factors work against residents from attending noon conference: pressure to discharge early and the fact that only 15% of the time was the full complement of 2 interns and 1 resident available for the entire day. Frequently, PGY1s and PGY3s worked through the noon hour to complete notes and discharges, with PGY3s assuming the chores for absent PGY1s. PGY1s attended 10% and PGY3s 25% of conference time.
Conferences and lectures are only one method of learning.18–21 We found that on average, while in the hospital, residents read about 12 minutes per day, interns 6 minutes. Adding home reading, as reported by survey results, interns spent approximately 2.6 hours and residents 4.2 hours on medical reading per week.
Residency programs rely on resident reporting of work hours and time off. Resident perception was fairly accurate of actual time allocation. We suspect that the reason perceived time in face-to-face nursing contact was higher than actuality was due to the amount of time residents text page or phone nurses, which we counted as indirect patient care.
Limitations
This study was completed at only one academic medical center, and we evaluated only 20 residents. Our medical team structure, patient admission “drip” system and educational conference schedule is only one system in a variety of other structures at other institutions. While we documented time allotted to various resident tasks, we did not qualitatively analyze those tasks. For example, we would expect that the quality of the direct and indirect patient care between PGY1s and PGY3s would be different, with PGY3s acting in a more supervisory and independent role.
Conclusion
The difference between PGY1s’ and PGY3s’ daily time allocations of tasks is minimal. Whereas a PGY3 spends 1.5 hours less than a PGY1 on writing computer notes and discharges, they also work 1.5 hours less per day. The additional 36 minutes of patient care discussions was the only significant quantity time difference that would be considered a higher level of practice for the PGY3 compared to the PGY1. The quality of the direct and indirect patient care PGY3s was not measured in this study. The EHR and COPE have not significantly altered the ratios of resident daily time allocations. However, with residents now caring for fewer patients, there has been a marked increase in computer time per patient for both PGY1s and PGY3s. Program directors should ensure that each progressive year of residency includes time for the attainment of the ABIM’s competencies and independence of practice.
Disclosure
The authors report no conflicts of interest in this work.
References
1. Rosenbaum L, Lamas D. Residents’ duty hours-toward an empirical narrative. N Engl J Med. 2012;367(21):2044–2049. doi:10.1056/NEJMsr1210160
2. Desai S, Feldman L, Brown L, et al. Effect of the 2011 vs 2003 duty hour regulation- compliant models on sleep duration, trainee education, and continuity of patient care among internal medicine house staff. JAMA Intern Med. 2013;173(8):649–654. doi:10.1001/jamainternmed.2013.2973
3. Poissant L, Pereira J, Tamblyn R, Kawasumi Y. The impact of electronic health records on time efficiency of physicians and nurses: a systematic review. J Am Med Informatics Assoc. 2005;12(5):505–516. doi:10.1197/jamia.M1700
4. Campbell E, Guappone K, Sittig D, Dykstra R, Ash J. Computerized provider order entry adoption: implications for clinical workflow. J Gen Intern Med. 2009;24(1):21–26. doi:10.1007/s11606-008-0857-9
5. Peets A, Ayas NT. Restricting resident work hours: the good, the bad, and the ugly. Crit Care Med. 2012;40(3):960–966. doi:10.1097/CCM.0b013e3182413bc5
6. Dykstra R. Computerized physician order entry and communication: reciprocal impacts.
7. Weinberger SE, Pereira AG, Iobst WF, Mechaber AJ, Bronze MS. The alliance for academic Internal medicine education redesign task force II. Competency-based education and training in internal medicine. Ann Intern Med. 2020;153(11):751–756. doi:10.7326/0003-4819-153-11-201012070-00009
8. Oxentenko A, West C, Popkave C, Weinberger S, Kolars J. Time spent on clinical documentation: a survey of internal medicine residents and program directors. Arch Intern Med. 2010;170(4):377–380. doi:10.1001/archinternmed.2009.534
9. Fletcher K, Visotcky A, Slagle J, Tarima S, Weinger M, Schapira M. The composition of intern work while on call. J Gen Intern Med. 2012;27(11):1432–1437. doi:10.1007/s11606-012-2120-7
10. Block L, Habicht R, Wu A, et al. In the wake of the 2003 and 2011 duty hours regulations, how do internal medicine interns spend their time? J Gen Intern Med. 2013;28(8):1042–1047. doi:10.1007/s11606-013-2376-6
11. Gabow P, Karkhanis A, Knight A, Dixon P, Eisert S, Albert R. Observations of residents’ work activities for 24 consecutive hours: implications for workflow redesign. Acad Med. 2006;81(8):766–775. doi:10.1097/00001888-200608000-00016
12. Boex J, Leahy P. Understanding residents’ work: moving beyond counting hours to assessing educational value. Acad Med. 2003;78(9):939–944. doi:10.1097/00001888-200309000-00022
13. Gillanders W, Heiman M. Time study comparisons of 3 intern programs. J Med Education. 1971;46:142–149.
14. Parenti C, Lurie N. Are things different in the light of day? A time study of internal medicine house staff days. Am J Med. 1993;94:654–658. doi:10.1016/0002-9343(93)90220-J
15. Dresselhaus T, Luck J, Spragg R, Lee M, Bozzette S. Analyzing the time and value of house staff inputting work. J Gen Intern Med. 1998;13(8):534–540. doi:10.1046/j.1525-1497.1998.00164.x
16. Thanarajasingam U, McDonald F, Halvorsen A, et al. Service census caps and unit-based admissions: resident workload, conference attendance, duty hour compliance, and patient safety. Mayo Clin Proc. 2012;87(4):320–327. doi:10.1016/j.mayocp.2011.12.012
17. Bowen J, Cox M, Irby DM. Educational strategies to promote clinical diagnostic reasoning. N Engl J Med. 2006;355:2217–2225. doi:10.1056/NEJMra054782
18. Armstrong E, Parsa-Parsi R. How can physicians’ learning styles drive educational planning? Acad Med. 2005;80(7):680–684. doi:10.1097/00001888-200507000-00013
19. Busari JO, Arnold AER. Educating doctors in the clinical workplace: unraveling the process of teaching and learning in the medical resident as teacher. J Postgrad Med. 2009;55:278–283. doi:10.4103/0022-3859.58935
20. Beckman TJ, Lee MC. Proposal for a collaborative approach to clinical teaching. Mayo Clin Proc. 2009;84:345–352. doi:10.1016/S0025-6196(11)60543-0
21. Edson R, Beckman T, West C, et al. A multi-institutional survey of internal medicine residents’ learning habits. Med Teach. 2010;32:773–775. doi:10.3109/01421591003692698
 © 2020 The Author(s). This work is published and licensed by Dove Medical Press Limited. The full terms of this license are available at https://www.dovepress.com/terms.php and incorporate the Creative Commons Attribution - Non Commercial (unported, v3.0) License.
By accessing the work you hereby accept the Terms. Non-commercial uses of the work are permitted without any further permission from Dove Medical Press Limited, provided the work is properly attributed. For permission for commercial use of this work, please see paragraphs 4.2 and 5 of our Terms.
© 2020 The Author(s). This work is published and licensed by Dove Medical Press Limited. The full terms of this license are available at https://www.dovepress.com/terms.php and incorporate the Creative Commons Attribution - Non Commercial (unported, v3.0) License.
By accessing the work you hereby accept the Terms. Non-commercial uses of the work are permitted without any further permission from Dove Medical Press Limited, provided the work is properly attributed. For permission for commercial use of this work, please see paragraphs 4.2 and 5 of our Terms.