")
Back to Journals » Breast Cancer: Targets and Therapy » Volume 16
ZNF217 Gene Copy Number as a Marker of Response to Standard Therapy Drugs According to ERα Status in Breast Cancer
Authors Rangel N , Sánchez IL, Valbuena DS, Rondón-Lagos M
Received 6 November 2023
Accepted for publication 24 January 2024
Published 15 March 2024 Volume 2024:16 Pages 127—139
DOI https://doi.org/10.2147/BCTT.S445753
Checked for plagiarism Yes
Review by Single anonymous peer review
Peer reviewer comments 2
Editor who approved publication: Professor Harikrishna Nakshatri
Nelson Rangel,1 Iris Lorena Sánchez,2 Duván Sebastián Valbuena,2 Milena Rondón-Lagos2
1Departamento de Nutrición y Bioquímica, Facultad de Ciencias, Pontificia Universidad Javeriana, Bogotá, 110231, Colombia; 2School of Biological Sciences, Universidad Pedagógica Y Tecnológica de Colombia, Tunja, 150003, Colombia
Correspondence: Nelson Rangel, Bogotá, 110231, Colombia, Tel/Fax +57 (601) 320 8320, Email [email protected]
Purpose: The therapeutic decision for the management of breast cancer (BC) patients is based on the evaluation of prognostic factors alongside clinical and pathological parameters. Despite the use of standard biomarkers, response and resistance to therapy represent a challenge for clinicians. Among the new potential biomarkers for BC the ZNF217 gene have gained importance in recent years. However, while associations between ZNF217 gene copy number and clinicopathological characteristics have been established, its correlation with treatment response remains unclear.
Patients and Methods: This study aimed to evaluate the ZNF217 gene copy number and establish its associations with treatment response in estrogen receptor positive (ERα+) and ERα negative (ERα-) BC cell lines. In addition, a validation of the relationship between ZNF217 gene copy number and its prognostic value was performed using datasets of BC patients retrieved from the cBioPortal public database.
Results: Our data show that in ERα+ cells, ZNF217 gene copy number increase (amplification), while cell proliferation decreases in response to standard drug treatments. In contrast, both ZNF217 gene copy number (gain) and cell proliferation increases in response to standard drug treatments in ERα- cells. The results obtained align with findings from the cBioPortal database analysis, demonstrating that ERα+/HER2- low proliferation patients, exhibiting ZNF217 gene amplification or gain, have a significantly higher survival probability after treatment, compared to ERα-/HER2- and HER2+ patients.
Conclusion: Our results suggest that in ERα+ BC cells, ZNF217 gene amplification could be indicative of a favorable response, while in ERα- BC cells, ZNF217 gene gain could be postulated as a potential predictor of treatment resistance. A broader understanding of the role of ZNF217 gene in treatment response, together with prospective studies in BC patients, could contribute to confirming our data, as well as optimizing existing treatments and exploring novel approaches to improve overall cancer treatment outcomes.
Keywords: gene amplification, gene gain, hormone therapy, chemotherapy, treatment resistance, FISH
Introduction
Breast Cancer (BC) is the most common type of cancer in women worldwide with around 2.261.419 of new cases and 684.996 deaths annually.1 The molecular classification of this disease is based on the expression of four biomarkers already standardized at the clinical level: Estrogen receptor alpha (ERα), Progesterone receptor (PR), Human epidermal growth factor receptor type 2 (HER2) and the cell proliferation marker Ki67. These biomarkers allow classifying this neoplasm into at least four subgroups according to their presence or absence.2,3 Although this has been a fundamental pillar in directing treatments in recent years, the increase in resistance has contributed to significant difficulties in the success of therapeutic approaches. Consequently, for every 100 women who have received some treatment for their disease at an early stage, 30 relapses.4,5 Therefore, establishing phenotypes of sensitivity to treatments based on the use of predictive biomarkers could be an additional useful tool to help physicians in decision-making regarding response to treatment in BC patients.6 Among the many genes that have gained importance in recent years, for its possible role in the response to treatment in BC is the ZNF217 gene.7 ZNF217 is a candidate oncogene located on chromosome 20. The chromosomal region containing ZNF217 gene (20q13), is amplified in up to 29% of BC and has been observed mainly in ERα-/PR negative (PR-)8,9 and in luminal A, node-negative BC patients.7 ZNF217 gene amplification has been associated with aggressive phenotypes, poor clinical prognosis,10 higher clinical stages,11 high cancer risk,12–14 and shorter patient survival in breast7 and in ovarian cancers.15 In addition, ZNF217 was shown to be more highly expressed in breast cancer cell lines carrying the 20q13 amplification than in cells with normal 20q13 copy number.10
ZNF217 gene encodes for a krüppel-like zinc finger protein that localizes to the nucleus,16 and interacts with co-repressors and histone modifying proteins,17–19 suggesting that ZNF217 may be part of a transcriptional repressor complex. Furthermore, the product of the ZNF217 gene has been shown to interfere with apoptotic pathways at early and later tumor progression stages, which may be associated with resistance to chemotherapy.20,21 Indeed, it has been indicated that ectopic expression of ZNF217 conferred resistance to doxorubicin and paclitaxel, but ZNF217 silencing increased the sensitivity of the BC cells to these drugs.20,21 However, while a specific association between ZNF217 mRNA expression with treatment response has been established in BC, studies that report associations between ZNF217 gene copy number with treatment response are scarce or absent.
Since amplification seems to be the predominant mechanism leading to overexpression,16,22 the value of assessing the relationship of ZNF217 gene copy number with cell proliferation (a marker of response to standard treatments), independently of the ZNF217 gene-expression levels, appears worthwhile. Additionally, it has been shown that high ZNF217 mRNA expression levels are not necessarily correlated to ZNF217 gene amplification in BC cells.7,16,22,23 The hypothesis established around this behavior is that some tumors overexpress ZNF217 as an early antiapoptotic and anti-stress mechanism that can later disappear when other mechanisms take over.7 This highlights the value of assessing ZNF217 gene copy number as a possible predictive biomarker of response to therapy.
Considering the above, this study aimed to evaluate the ZNF217 gene copy number and to establish its associations with cell proliferation, as an indicator of response to standard treatments, in BC cell lines representative of the Luminal [ERα+/HER2- and ERα+/HERα2-], HER2-enriched [ERα-/HER2+], and Triple Negative (TNBC - ERα-/HER2-) tumor subtypes. In addition, a validation of the relationship between ZNF217 gene copy number and its prognostic value, was performed using datasets of BC patients retrieved from the cBioPortal public database.
Materials and Methods
Cell Lines
The human BC cell lines MCF7 (RRID: CVCL_0031; ERα+/HER2-), MDA-MB468 (RRID: CVCL_0419; ERα-/HER2-), and BT474 (RRID:CVCL_0179; ERα+/HER2+), were obtained from the American Type Culture Collection (ATCC). KPL4 (RRID: CVCL_5310; ERα-/HER2+) cells were a kindly gift from Professor Anna Sapino, from the University of Turin, Italy. Cell lines were expanded and stored at −80°C for short-term use. Cells from these stocks were thawed and used for the experiments. MCF7, MDA-MB468 and KPL4 were cultured in RPMI-1640 medium (Sigma), whereas BT474 was cultured in DMEM medium (Sigma). Culture media were supplemented with antibiotic-antimycotic solution (1X) (Sigma), 10% fetal bovine serum (FBS) (Sigma) and L-glutamine (2 mM) (Invitrogen GmbH). Cells were cultured in 75 cm2 flasks using general conditions (37°C and 5% CO2). PCR assays were performed to confirm the absence of contamination with mycoplasma. The research was approved by the Ethics Committee of Universidad Pedagógica y Tecnológica de Colombia.
Treatments
BC cell lines were treated with tamoxifen (TAM) (T5648; Sigma), docetaxel (DOC) (sc-201436; Santa Cruz Biotechnology), doxorubicin (DOX) (sc-200923; Santa Cruz Biotechnology), Herceptin® (HT) and combined treatments (TAM+DOC, TAM+DOX, HT+TAM, HT+DOC and HT+DOX). TAM, DOC, DOX and HT were dissolved in absolute ethanol and diluted in medium at 1 μM, 10 nM, 0.05 μM and 50 μg/mL, respectively. Subsequently, these doses were added to the culture media for 24h, 48h, and 96h, both for individual and combined treatments. The above concentrations were selected considering that they were the highest and best doses in which a change in cytoskeleton architecture and cell death was observed in BC cell lines.24–27 TAM, DOC and DOX as single treatments, as well as TAM+DOC, and TAM+DOX as combined treatments, were added to all cell lines. While HT as single treatment and, HT+TAM, HT+DOC, and HT+DOX, as combined treatments, were added only to HER2+ cells (BT474 and KPL4). Control cells were treated with ethanol (vehicle control) at appropriate concentrations and incubated together with the drug treated cell lines.
Proliferation Assay
Cells were seeded at a density of 2.5–5×10³ cells in 100 μL of phenol red-free medium. After 24h, cells were treated with single and combined treatments for 24h, 48h, and 96h. The BrdU Cell Proliferation ELISA Kit (Roche Diagnostics Deutschland GmbH) was used to evaluate the cell proliferation after each treatment. The absorbance was measured using a Tecan Infinite M200 reader (Tecan Trading AG, Switzerland) against a background control as a blank. Each treatment was performed in 24 replicates (3 biological replicates with 8 technical replicates each one).
Nuclei Spreads
Nuclei from control and treated BC cell lines were obtained through standardized harvesting protocols. Briefly, 2.5h before cell harvesting colcemid solution (0.03 μg/mL) (Sigma) was added to cultures. Then, cells were detached from flasks by Trypsin-EDTA solution 1X (Sigma) and treated with hypotonic solution. Subsequently, cells were fixed three times with Carnoy’s fixative (3:1 methanol to acetic acid), and spread on glass. Nuclei spreads were analyzed using Fluorescence in situ Hybridization (FISH).
ZNF217 Gene Copy Number Evaluation
To evaluate the ZNF217 gene copy number, molecular cytogenetic analysis on control and treated BC cell lines were performed. The ZNF217 gene copy number was evaluated by FISH, on the nuclei spreads obtained previously, using the ZNF217 amplification probe (Cytocell, Cambridge) and standard procedures. The above is a 197kb red probe spanning the ZNF217 gene and neighboring regions. The 20p13 probe in green, acts as a control for chromosome 20. ZNF217 gene copy number was assessed in a minimum of 100 intact and non-overlapping nuclei. The analysis of the ZNF217 dual probe was performed by counting the number of red and green signals on the images taken in an Olympus microscope and transferred to the Cytovision software version 7.4. A ratio of ZNF217 gene signals (red signals) divided by the number of control signals (green signals) (ZNF217/20p13) was calculated for all cell lines analyzed, both control and treated. Cell lines were considered as amplified when ZNF217/20p13 ratio was greater than 2 (≥ 2) in ≥ 10% of analyzed cells [28–30]. Whilst, cells lines were considered to carry a ZNF217 gene gain (increase in ZNF217 copy number) when the ZNF217 gene copy number was ≥ 3 and the ZNF217/20p13 ratio was less than 2 (≥ 2) in ≥ 10% of analyzed cells.8,28–30 In order to understand the reason for the use of the ZNF217/20p13 ratio, it is important to clarify the difference between gene amplification and gene gain (polysomy). Although both, can give rise to an increase in gene copy number in tumor cells, gene amplification is a copy number increase for a specific gene (or group of genes) on a given chromosome arm, that does not change the copy number of genes located in other regions of the chromosome.31 However, gene gain increases the copy number for a given gene as a result of the presence of extra copies of the entire chromosome. Thus, the ZNF217/20p13 ratio, makes it possible to differentiate an increased copy number of the ZNF217 gene attributable to gene amplification, from that resulting from extra copies of the chromosome (polysomy/gene gain).
cBioPortal Database Analysis
In order to evaluate the prognostic value of ZNF217 gene copy number and its potential role as predictor of response to treatments, we analyze breast tumor data published in the cBioPortal database. Specifically, cBioPortal is a publicly available web program for exploring and analyzing genomic, transcriptomic, proteomic and clinical data from cancer patients and cell lines (http://cbioportal.org/).32,33 First, we analyzed ZNF217 gene amplification and gain events in BC cell lines (MCF7, MDA-MB468, BT474 and KPL4) in 3 different datasets included in the cBioPortal database (data not shown). Then, we analyze data from BC patients included in the METABRIC studies,34,35 which have data of primary tumors from 2509 BC patients with long-term clinical follow-up. Using the cBioPortal database, we created a virtual study where the main parameter selected for the analysis was information of somatic copy number aberrations/alterations (CNAs). A total of 2173 out of 2509 BC patients have data for CNAs. In these cases, the ZNF217 gene was queried to differentiate patients having amplification from those with gains or without amplification or gains (Diploids/Deletions). After creating the virtual study, ZNF217 CNAs, clinicopathological characteristics, type of treatment [hormone therapy (HoT) or chemotherapy (CT)], tumor subtypes and survival data (OS and RFS) of BC patients were downloaded from the cBioPortal website and examined with classical statistical packages in order to establish the prognostic value of the ZNF217 gene copy number.
As tumor subtypes we use those defined by the 3 gene classifier,2 a subtype classification model which group the major and clinically relevant molecular subtypes [ERα-/HER2-, ERα+/HER2- High Proliferation (HP), ERα+/HER2- Low Proliferation (LP), and HER2+], by quantitative measurements of three key BC genes: ESR1 (ERα), HER2, and aurora kinase A (AURKA).
Statistical Analysis
Results are expressed as the mean ± standard deviation (SD). Two-way analysis of variance (ANOVA) with the Dunnett’s multiple comparisons test were used to evaluate the potential differences for both cell proliferation and gene copy number (ZNF217/20p13 ratio) between groups (control vs treated cells). For data downloaded from the cBioPortal website, Pearson’s chi-square test was preliminarily performed to compare categorical variables and to evaluate the potential differences in the variable distribution among the groups. Survival distribution curves were plotted using the Kaplan–Meier method. Statistical comparisons were performed using the Log rank test. The progression/relapse-free survival (RFS) indicates whether patient’s disease has recurred/progressed, and at what time the disease recurred, or the patient was last seen. Overall survival (OS) indicates time of diagnosis to time of death for BC or last follow-up. Cox regression analysis were carried out on the RFS and OS to calculate the Hazard Ratio (HR) with 95% confidence intervals (CIs) for the different study groups. All statistical tests were two sided. p values < 0.05 were considered significant. Statistical analyzes were performed using Prism v.7.0. (GraphPad) statistical software and R: Language and Environment for Statistical Computing.
Results
MCF7 Shows ZNF217 Gene Amplification and Decreased Cell Proliferation After Treatments
In MCF7 cells (ERα+/HER2-), a reduction in cell proliferation was observed in response to all treatments, both individual and combined, at all evaluated times (Figure 1A). However, these effects were significant at 48 and 96h (p ≤ 0.04), suggesting that in early times (24h) therapies seems not to be yet effective enough (Supplementary Table 1). To note, combined treatments (both TAM [1 μM] + DOC [10 nM], and TAM [1 μM] + DOX [0,05 μM]) showed a greater cell proliferation inhibition.
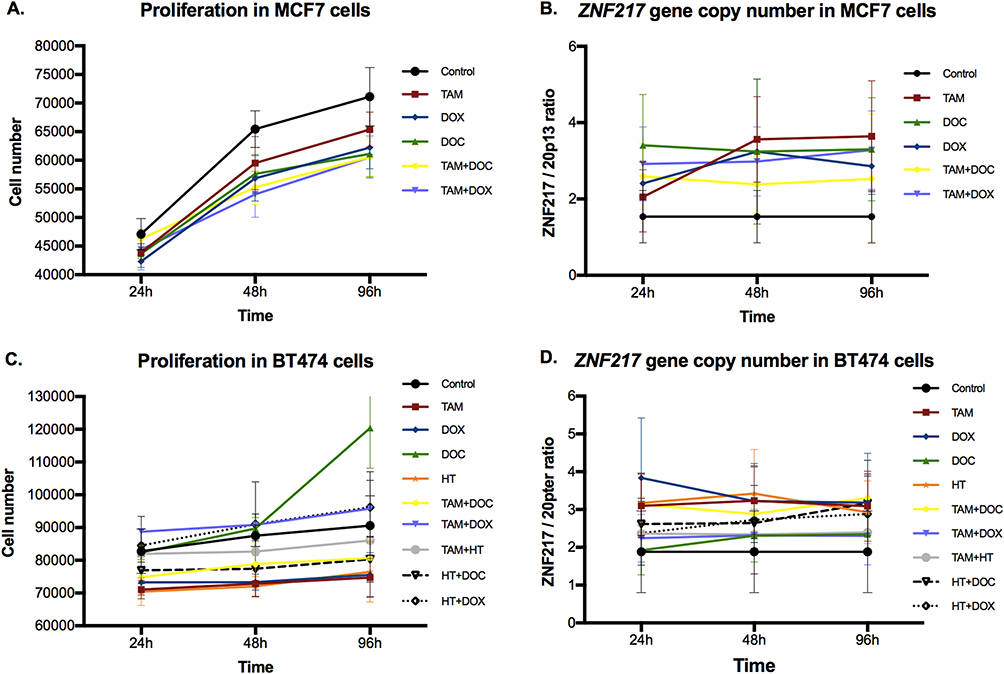 |
Figure 1 Effects of single and combined treatments on cell proliferation, and on ZNF217 gene copy number in ERα+ cells after 24h, 48h and 96h. (A and B) MCF7 cells. (C and D) BT474 cells. Error bars represents mean standard deviation of 24 replicates. Differences between control and treatments were evaluated with Dunnett’s multiple comparisons test (see Supplementary Tables 1 and 2). |
Regarding to the ZNF217 gene copy number, the control cells (cell without treatment), showed ZNF217 gene gain (ZNF217 gene copies ≥ 3 and ZNF217/20p13 ratio < 2) (Figures 1B and 2). After all treatments (individual and combined), and at 48 and 96h, MCF7 cells showed a significant ZNF217 gene amplification (ZNF217/20p13 ratio ≥ 2), indicating that in these cells, there is a biologically relevant induction of ZNF217 gene copy number in response to treatments (Figure 1B and Supplementary Table 2). It is noteworthy, that the behavior mentioned was more evident when the cells were individually treated with TAM [1 μM] and DOC [10 nM] (Figure 1B and Supplementary Table 2). These results suggest that in MCF7 cells (ERα+/HER2), ZNF217 gene amplification could serve as an indicator of a positive response to both, individual and combined drug treatments.
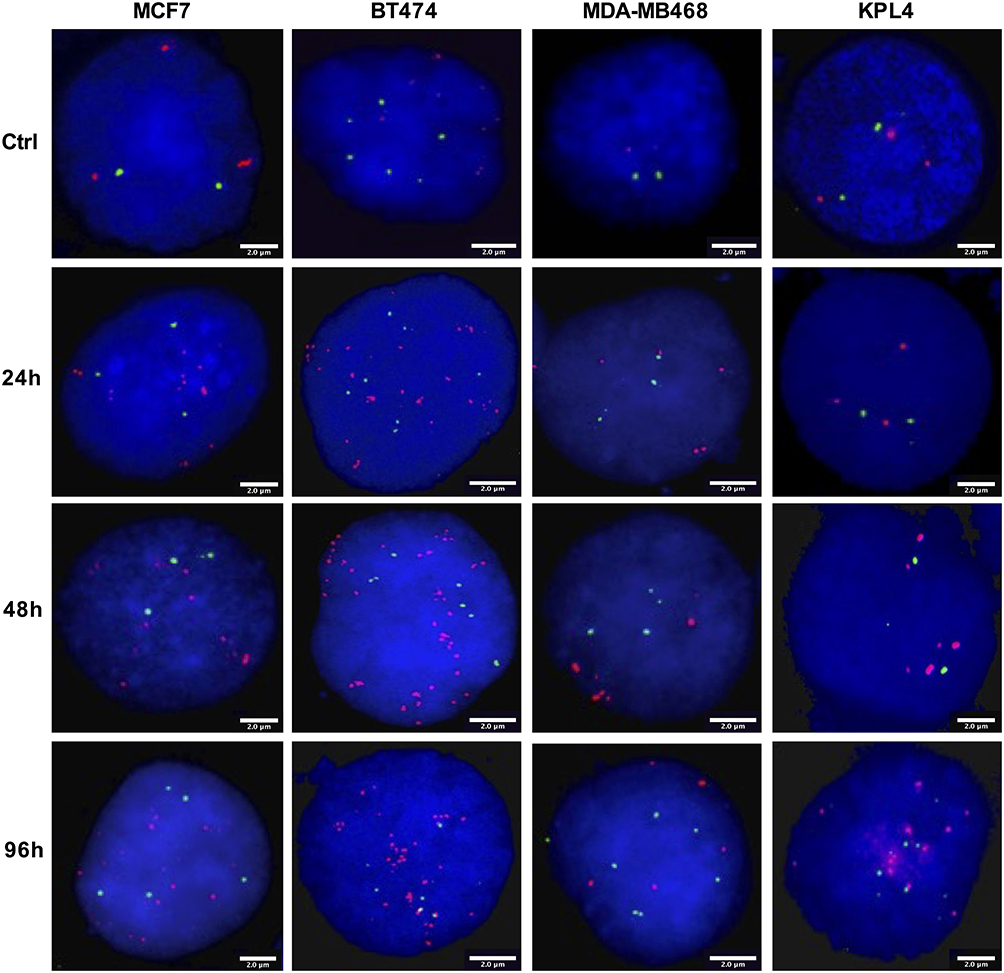 |
Figure 2 Representative FISH images of BC cells after TAM treatment for 24h, 48h and 96h. FISH was performed on nuclei spreads for ZNF217 gene and for neighboring regions (20p13) as control, using a dual color probe labeled with different spectrum colors: spectrum orange for ZNF217 gene and spectrum green for 20p13 region. Interphase nuclei at each treatment time point are indicated. The scale bars at the bottom right of each FISH image are indicative of the surface area of the nucleus. Ctrl: Control, untreated cells. |
BT474 Exhibits the Highest Increase in ZNF217 Gene Copy Number Following Treatments
In ERα+/HER2+ cells, TAM [1 μM], DOX [0,05 μM] and HT [50 μg/mL] single treatments, significantly reduced cell proliferation at all evaluated times (p ≤ 0.002); while, DOC [10 nM] treatment induced a significant increase (p ≤ 0.01) but only at 96h (Figure 1C and Supplementary Table 1). Among the combined treatments, TAM [1 μM] + DOC [10 nM] and HT [50 μg/mL] + DOC [10 nM], induced a significant reduction in cell proliferation in two of three evaluated times (p ≤ 0.04). The other combined treatments do not seem to have significant effects on the proliferation of this cell type (Figure 1C and Supplementary Table 1).
Regarding the ZNF217 gene copy number, control cells were characterized by having ZNF217 gene gain (ZNF217 gene copies ≥ 3 and ZNF217/20p13 ratio < 2). For most individual and combined treatments, there was a significant induction of ZNF217 gene amplification (ZNF217/20p13 ratio ≥ 2) at all evaluated times (Figures 1D and 2, and Supplementary Table 2). Only DOC at 24h, did not show a significant change. It should be noted that, the amplification of this gene was higher in cells exposed to individual (TAM, DOX and HT) and combined (TAM+DOC and HT+DOC) treatments, which also showed a significant reduction in cell proliferation. In addition, BT474 was the cell line that presented the greatest increase in the number of copies of the ZNF217 gene after the treatments, with increases ranging from 9 copies in the control, up to a maximum of 19 copies after the treatments (Supplementary Table 2). These findings suggest that ZNF217 gene amplification in ERα+/HER2+ BC cells, holds promise as a favorable predictor of treatment response.
MDA-MB468 Shows a Significantly Higher Increase in ZNF217 Gene Gain and Increased Cell Proliferation After Treatments
In the ERα-/HER2- cell line, most treatments induced a significant increase in cell proliferation at all evaluated times. Although an increase in cell number was observed, TAM [1 μM] as individual treatment, was the only treatment showing no meaningful effects (p ≥ 0.05) (Figure 3A and Supplementary Table 3).
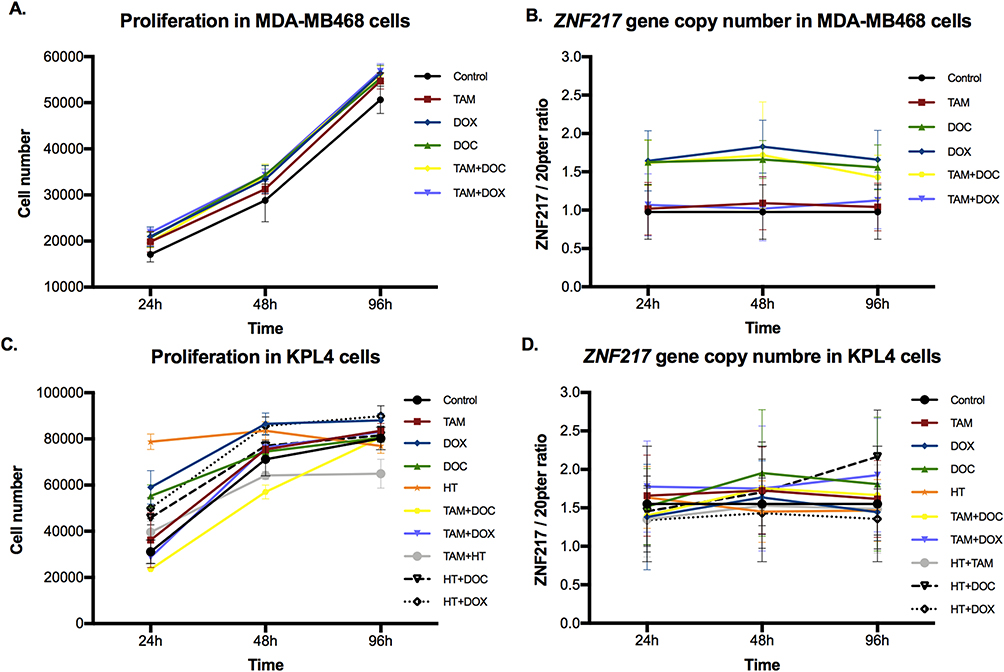 |
Figure 3 Effects of single and combined treatments on cell proliferation, and on ZNF217 gene copy number in ERα- cells after 24h, 48h and 96h. (A and B) MDA-MB468 cells. (C and D) KPL4 cells. Error bars represents mean standard deviation of 24 replicates. Differences between control and treatments were evaluated with Dunnett’s multiple comparisons test (see Supplementary Tables 3 and 4). |
About the ZNF217 gene copy number, two copies were observed in the control cells (Figures 2 and 3B). However, MDA-MB468 cells showed a significantly higher increase in the ZNF217 gene copy number (gene gain) (ZNF217 gene copies ≥ 3 and ZNF217/20p13 ratio < 2) (p ≤ 0.0001), after DOC, DOX and TAM+DOC treatments, at all evaluated times (Supplementary Table 4). The above was not evident at any time for TAM and TAM+DOX treatments. Our findings suggest a potential correlation between ZNF217 gene gain and treatment resistance in triple-negative cells (MDA-MB468).
KPL4 Shows Increased Cell Proliferation, with No Alterations in the ZNF217 Gene Copy Number Following Treatments
In ERα-/HER2+ cells, all individual treatments showed an increase in cell proliferation, this increase being greater and significant, after treatments with DOX [0,05 μM] (at all times evaluated), DOC [10 nM] (at 24h) and HT [50 μg/mL] (at 24 and 48h) (p ≤ 0.006). Concerning combined treatments, the effects were variable, since TAM [1 μM] + DOC [10 nM] and TAM [1 μM] + HT [50 μg/mL] showed a statistically significant reduction in cell proliferation in two of the three evaluated times (p ≤ 0.02) (Figure 3C). While HT [50 μg/mL] + DOC [10 nM] (at 24 and 48h) and HT [50 μg/mL] + DOX [0,05 μM] (at all times) induced a significant increase in cell proliferation (p ≤ 0.0001) (Figure 3C and Supplementary Table 3).
Regarding the ZNF217 gene copy number, control cells showed ZNF217 gene gain (ZNF217 gene copies ≥ 3 and ZNF217/20p13 ratio < 2). Nevertheless, after individual and combined treatments, little and variable changes in the ZNF217 gene copy number were identified, most of them without statistical meaning. In fact, only DOC (at 48 and 96h), TAM+DOX (at 24 and 96h) and HT+DOC (at 96h) treatments, showed a significant increase respect to control. However, despite these changes, the status of the ZNF217 gene (ZNF217/20p13 ratio < 2) was not altered with respect to the control (Figures 2 and 3D, and Supplementary Table 4). Overall, our findings suggest that ERα-/HER2+ cells exhibit resistance to both chemotherapeutic and HER2 targeted treatments, with no discernible alterations in the ZNF217 gene copy number.
cBioPortal Database Analysis
The characteristics of the 2173 BC patients having data for copy number alterations (CNAs) and stratified by ZNF217 gene copy number are reported in Supplementary Table 5. Of the 2173 cases, 178 (8.2%) had amplification and 423 (19.5%) gain of the ZNF217 gene. Patients with amplification or gain, carried larger tumors with higher grading, frequently with more positive lymph nodes and most of them negative for PR status (p ≤ 0.04). Univariate cox regression analysis showed that ZNF217 gene amplification is a significant marker of poor survival [HR = 1.26 for overall survival (OS), and HR = 1.57 for relapse-free survival (RFS), both p ≤ 0.02], associated with high grades, tumor size ≥15 mm, nodal involvement ≥1, and related with more aggressive molecular subtypes (Supplementary Table 6). Multivariate analysis, adjusted by age, showed that the prognostic value of ZNF217 is maintained only for gene amplification in RFS (Supplementary Table 7). Furthermore, in BC patients with ZNF217 gene amplification or gene gain, a lower survival probability was observed for both, OS and RFS (p ≤ 0.024) (Figures 4A and B). According to the BC molecular subtypes, our data suggest a possible association between ZNF217 gene amplification (Figure 4C) and/or gene gain (Figure 4D) with reduced RFS probability in patients classified as ERα-/HER2-, HER2+ and ERα+/HER2- HP compared to those ERα+/HER2- LP. In this context no associations were observed between ZNF217 CNAs and OS.
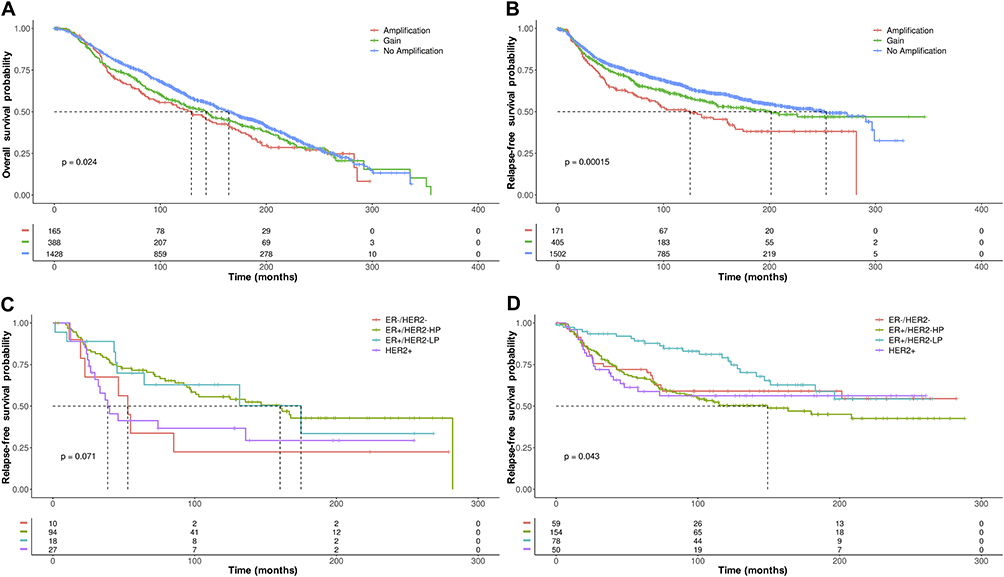 |
Figure 4 Kaplan–Meier plots of (A) OS and (B) RFS in BC patients with ZNF217 gene amplification or gene gain, versus BC patients without ZNF217 gene amplification or gene gain. (C) Kaplan–Meier plots of RFS in BC patients with ZNF217 gene amplification or (D) ZNF217 gene gain according to molecular subtypes defined by 3 gene classifier model. p value was determined using the Log rank test. |
Also, we decided to analyze whether the presence of ZNF217 gene amplification or gene gain, may be a prognostic predictor of response to CT or HoT, according to the BC molecular subtypes (3 gene classifier model). Cases with ZNF217 gene amplification, treated with HoT and classified as ERα-/HER2- and HER2+, were associated with reduced OS, compared to ERα+/HER2- BC patients (p ≤ 0.0018) (Figure 5A). No associations between survival and cases with ZNF217 gene amplification treated with CT were observed among subtypes (data not shown). With regard to ZNF217 gene gain, HER2+ and ERα+/HER2- HP BC patients treated with CT presented a significantly reduced OS (p ≤ 0.042), compared to ERα+/HER2- LP BC patients (Figure 5B). Like above, BC patients with ZNF217 gene gain classified as HER2+, ERα+/HER2- HP and ERα-/HER2- but treated with HoT (Figure 5C), presented a significantly reduced RFS, compared to those ERα+/HER2- LP BC patients (p ≤ 0.015).
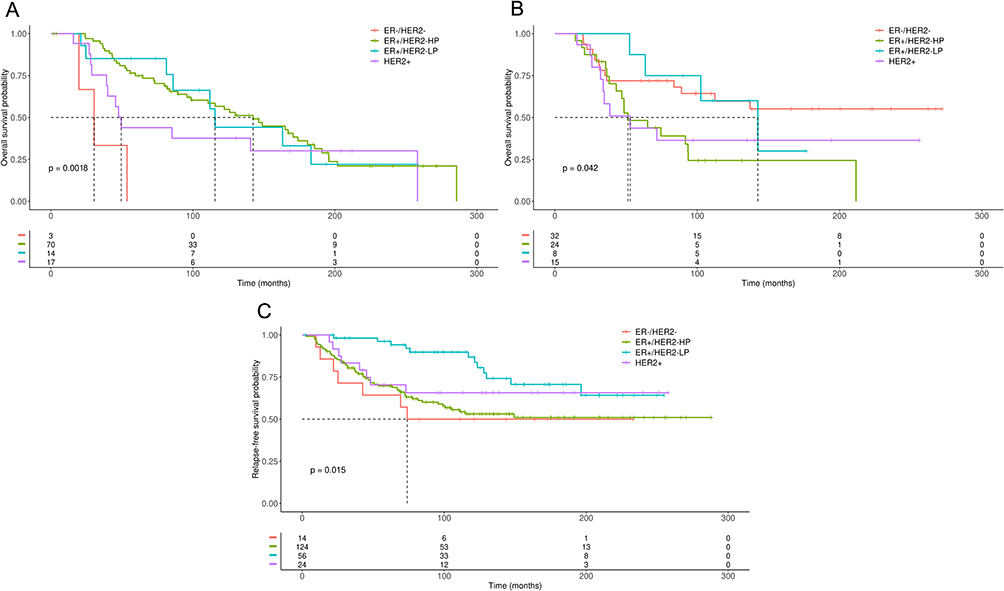 |
Figure 5 Kaplan–Meier plots of OS or RFS in BC patients with ZNF217 gene amplification or gain according to molecular subtypes defined by 3 gene classifier model and treated with CT or HoT. (A) OS in BC patients with ZNF217 gene amplification treated with HoT. (B) OS in BC patients with ZNF217 gene gain treated with CT. (C) RFS in BC patients with ZNF217 gene gain, treated with HoT. p value was determined using the Log rank test. |
Discussion
In this study, we provide evidence suggesting that ZNF217 gene copy number might be a predictive biomarker of response to standard drug treatment (individual or combined) in BC cells according to the ERα status. Our results allowed us to identify (before treatments), two copies of the ZNF217 gene in triple negative cells (MDA-MB468), and an increase in the gene copy number in ERα+ cells (MCF7 and BT474). Analysis of BC cell lines using the cBioPortal database, showed that at least one of the cBioPortal datasets was concordant with our results. KPL4 cell line was the only cell line not studied in any of the 3 data sets included in the tool. The slight differences with some of the datasets can be explained by the methods used to establish CNAs, since while we use FISH, the cBioPortal dataset analysis reports CNAs data obtained by Next Generation Sequencing.
In MCF7 cells, a relevant induction of ZNF217 gene amplification over time (48h and 96h), together with a decrease in cell proliferation, was evidenced in response to all treatments, mainly to TAM. A similar behavior was observed in BT474 cells, where most treatments (TAM, DOX, HT, TAM+DOC and HT+DOC) induced a significant reduction in cell proliferation that coincided with a significant induction of ZNF217 gene amplification (Figure 1). These results align with analysis from cBioPortal database, where it was observed that, ERα+/HER2- LP BC patients, having ZNF217 gene amplification or gain, and treated with HoT, have higher survival probability (Figure 5). Our results are in line with previous studies indicating that TAM reduce proliferation of ERα+ cells. These studies further indicate that the effects of TAM can be explained mainly by downregulation of ERα target pathways (eg, JAK/STAT, MAPK) and by mitochondria-mediated apoptosis.36,37
ZNF217 gene amplification observed in ERα+ cells, may be related to genome integrity loss of many human cancers which is indicative of chromosomal instability (CIN) of tumor cells.19 In fact, it has been indicated that CIN plays an important role in molding BC genomes and is useful for therapeutic purposes.31,38–40 Indeed, previous studies have indicated that ERα+ cells, having increased CIN, are sensitive to different standard treatments.41 However, paradoxical associations between extreme CIN and improved outcome have also been reported.40–43 Thus, although most studies have assigned oncogenic properties to the ZNF217 gene expression in ERα+ BC,44 based on our data and those of others who have not found clear associations with gene expression or amplification,7,9,44–46 we cannot rule out that the increased CNAs observed for the ZNF217 gene in MCF7 and BT474 cells, as well as in ERα+ BC patients (representative of luminal subtypes), could be a potential indicator of CIN related to improved outcomes for some types of treatments.
In contrast to what was observed in ERα+ cells, our findings suggest a potential correlation between ZNF217 gene gain and treatment resistance in triple-negative cells (MDA-MB468). Except for TAM, all treatments in MDA-MB468, induced a significant increase in cell proliferation, which agreed with an increase in the ZNF217 gene copy number. These results, also agree with analysis from cBioPortal database, indicating that ERα-/HER2- BC patients treated with HoT and, having ZNF217 gene amplification or gene gain, had worse OS and RFS, respectively (Figures 5A and 5B). The lack of significant differences between ZNF217 gene amplification and survival of TNBC patients treated with CT, may be due to the low number of cases included in the analysis, by dilution of the sample after the cases were grouped according to each tumor subtype. However, it must be noted that in this analysis, ERα+/HER2- LP BC patients had a higher survival probability respect to ERα-/HER2- BC. Besides, when BC patients were not classified by tumor subtypes, those treated with CT and having ZNF217 gene amplification or gene gain, had worse survival (Supplementary Figure 1A and 1B). The resistance phenotype observed is consistent with studies showing that the drugs used here do not always inhibit ERα- cell growth, and evidence the aggressiveness and worse prognosis associated with TNBC.47,48 This behavior could be explained by the fact that alterations in chromosome copy number and gene dosage (ZNF217 gene gain) may induce cellular stresses, including CIN, which has been associated with therapy resistance.49,50 In fact, an interesting hypothesis indicates that cancer cells might exploit CIN to survive under conditions of selective pressure. Thus, CIN could provide phenotypic variation which increases heterogeneity within a tumor and drives the ability of cancer cells to adapt to stressful conditions, including chemotherapy.49 In addition, it has been reported that progression of TNBC could be due to oncogenic ZNF217-driven activation of PTEN/PI3K/AKT/mTOR pathway,39,51,52 which is hyperactivated mainly due to loss of PTEN, and is not only associated with progression but also with chemoresistance of TNBC.53
Like TNBC cell line, the ERα-/HER2+ cells (KPL4) showed a resistance phenotype (increased cell proliferation) in response to DOC, DOX, HT and some combined treatments (HT+DOC and HT+DOX). However, this behavior does not seem to be related to the ZNF217 gene copy number, since none of the mentioned treatments induced significant changes in the status of this gene with respect to control cells (Figure 3). It should be noted that, treatments such as TAM+DOC and TAM+HT, induced a reduction in cell proliferation of KPL4 cells, an interesting behavior, since the addition of TAM as a single treatment, did not induce any notable effect on these ERα- cells. Although these treatments did not modify the ZNF217 gene copy number, these results confirm that hormonal therapy combined with other therapeutic strategies, may be useful for the treatment of ERα- tumors, as previously reported.54,55 Likewise, it cannot be ruled out that the variable effects observed in KPL4 cells could be explained by the increased expression of the HER2 receptor. In fact, on the HER2+ BT474 cells, DOC, TAM+DOX and HT+DOX, unlike to all others treatments, induced a slight increased cell proliferation. However, in both KPL4 and BT474 cells, most treatments induced changes similar to those observed in its partner cells lines MDA-MB468 and MCF7, respectively. The above suggests that responses to treatments seem to be mainly influenced by the ERα status. In general, results in KPL4 cells suggest resistance to chemotherapeutic and HER2 targeted treatments, with no evident changes in the ZNF217 gene copy number. The above agrees with analysis from the cBioPortal database, since HER2+ BC patients treated with CT and having ZNF217 gene amplification, not showed differences in OS or RFS with respect to other subtypes. However, HER2+ BC patients treated with CT or HoT, but with ZNF217 gene gain, were associated with a reduced survival probability (Figure 5). This variable behavior suggests that, at least in ERα-/HER2+ cells, the ZNF217 gene copy number, may not be informative enough and that other mechanisms (eg, changes in the mRNA and protein expression levels) must be related to the oncogenic role assigned to ZNF217 in ERα-/HER2+ subtypes.46 In fact, it has been reported that the increased expression of the ERBB3 gene (a member of the HER family receptors), which is a direct target for the ZNF217 transcription factor, could favor the ZNF217-driven activation of the survival signaling pathways PI3K/AKT and MAPK, both of which are implicated in BC therapy resistance.39,51,56 The above suggests that variations in the expression levels of the ZNF217 gene could be a better indicator of survival related to BC cases that are positive for the HER family receptors.
Our study has limitations related to the in vitro models (cell lines) used for treatment evaluation, which could provide variable results. However, it is important to note that, in order to reduce such variability, the effect of each treatment was evaluated at least in 24 replicates and the gene copy number was studied in at least 100 non-overlapping nuclei for each chromosome. Moreover, is also worth mentioning that due to the retrospective nature of the analysis performed with the cBioPortal dataset, the samples included correspond to tumors from patients before treatments. However, the CNA data from these patients gives us insights into the relationship between ZNF217 CNAs and the possible prognosis of BC patients after they undergo HoT or CT. To further address these limitations and validate our data, future studies need to be performed with in vivo models, as well as evaluating a large cohort of BC patients with long follow-up in prospective studies, including cases with neoadjuvant regimens for different types of treatment.
Conclusions
In this study, we suggest the value of ZNF217 gene copy number (gene amplification and gene gain) as a predictive biomarker of response to standard drug treatment (individual or combined), according to the ERα status in BC cells. Our “in vitro” study in BC cell lines, suggests that ZNF217 gene amplification appears to be a good predictor of favorable drug response in ERα+ cells (MCF7 and BT474 cell lines), while in ERα-/HER2- cells (MDA-MB468 cell line), gene gain appears to be a good predictor of resistance to CT. The above results are consistent with analysis from cBioPortal database, where was observed that ERα+/HER2- LP patients, with ZNF217 gene amplification or gain, have significant higher survival probability after treatments (mainly HoT), in contrast to ERα-/HER2- patients. These data reinforce the insight that ZNF217 CNAs could be useful to improve the prognostic and predictive utility of classical markers, like ERα and HER2, as well as, the prognostic value of BC subtypes related to these markers. Our results highlight the role of ZNF217 gene amplification or gain, in predicting favorable response to CT and HoT in ERα+ BC cases and resistance to CT for ERα-, mainly for ERα-/HER2- BC patients. A broader understanding of the role of ZNF217 gene copy number in the treatment response of BC could contribute to the optimization of therapeutic strategies and/or support new ones for improved cancer treatment outcomes.
Ethics Approval and Consent to Participate
The study was approved by the Ethical Committee of Universidad Pedagógica y Tecnológica de Colombia.
Funding
This work was supported by Universidad Pedagógica y Tecnológica de Colombia and by Pontificia Universidad Javeriana through the “Support for the publication of high-quality research articles 2024” grant.
Disclosure
The authors report no conflicts of interest in this work.
References
1. Sung H, Ferlay J, Siegel RL, et al. Global cancer statistics 2020: globocan estimates of incidence and mortality worldwide for 36 cancers in 185 countries. CA Cancer J Clin. 2021;71(3):209–249. doi:10.3322/caac.21660
2. Harbeck N, Penault-Llorca F, Cortes J, et al. Breast cancer. Nat Rev Dis Primers. 2019;5(1):66. doi:10.1038/s41572-019-0111-2
3. Haibe-Kains B, Desmedt C, Loi S, et al. A three-gene model to robustly identify breast cancer molecular subtypes. JNCI J National Cancer Inst. 2012;104(4):311–325. doi:10.1093/jnci/djr545
4. Gonzalez-Angulo AM, Morales-Vasquez F, Hortobagyi GN. Overview of Resistance to Systemic Therapy in Patients with Breast Cancer. Madame curie bioscience database. Available from: https://www.ncbi.nlm.nih.gov/books/NBK6306/.
5. Szostakowska M, Trębińska-Stryjewska A, Grzybowska EA, Fabisiewicz A. Resistance to endocrine therapy in breast cancer: molecular mechanisms and future goals. Breast Cancer Res Treat. 2019;173(3):489–497. doi:10.1007/s10549-018-5023-4
6. Nass N, Kalinski T. Tamoxifen resistance: from cell culture experiments towards novel biomarkers. Pathol Res Pract. 2015;211(3):189–197. doi:10.1016/j.prp.2015.01.004
7. Ginestier C, Cervera N, Finetti P, et al. Prognosis and gene expression profiling of 20q13-amplified breast cancers. Clin Cancer Res. 2006;12(15):4533–4544. doi:10.1158/1078-0432.CCR-05-2339
8. Carracedo A, Salido M, Corominas JM, et al. Are ER+PR+ and ER+PR− breast tumors genetically different? A CGH array study. Cancer Genet. 2012;205(4):138–146. doi:10.1016/j.cancergen.2012.01.001
9. Letessier A, Sircoulomb F, Ginestier C, et al. Frequency, prognostic impact, and subtype association of 8p12, 8q24, 11q13, 12p13, 17q12, and 20q13 amplifications in breast cancers. BMC Cancer. 2006;6(1):245. doi:10.1186/1471-2407-6-245
10. Quinlan K, Verger A, Yaswen P, Crossley M. Amplification of zinc finger gene 217 (ZNF217) and cancer: when good fingers go bad. Biochim Biophys Acta Rev Cancer. 2007;1775(2):333–340. doi:10.1016/j.bbcan.2007.05.001
11. Shimada M, Imura J, Kozaki T, et al. Detection of Her2/neu, c-MYC and ZNF217 gene amplification during breast cancer progression using fluorescence in situ hybridization. Oncol Rep. 2005;13(4):633–641.
12. Shi H, Bevier M, Johansson R, et al. Single nucleotide polymorphisms in the 20q13 amplicon genes in relation to breast cancer risk and clinical outcome. Breast Cancer Res Treat. 2011;130(3):905–916. doi:10.1007/s10549-011-1600-5
13. Vendrell JA, Solassol J, Győrffy B, et al. Evaluating ZNF217 mRNA expression levels as a predictor of response to endocrine therapy in er+ breast cancer. Front Pharmacol. 2019;10:9. doi:10.3389/fphar.2018.01581
14. Vendrell JA, Thollet A, Nguyen NT, et al. ZNF217 Is a marker of poor prognosis in breast cancer that drives epithelial–mesenchymal transition and invasion. Cancer Res. 2012;72(14):3593–3606. doi:10.1158/0008-5472.CAN-11-3095
15. Ginzinger DG, Godfrey TE, Nigro J, et al. Measurement of DNA copy number at microsatellite loci using quantitative PCR analysis. Cancer Res. 2000;60(19):5405–5409.
16. Collins C, Volik S, Kowbel D. Comprehensive genome sequence analysis of a breast cancer amplicon. Genome Res. 2001;11(6):1034–1042. doi:10.1101/gr.GR1743R
17. Banck MS, Li S, Nishio H, Wang C, Beutler AS, Walsh MJ. The ZNF217 oncogene is a candidate organizer of repressive histone modifiers. Epigenetics. 2009;4(2):100–106. doi:10.4161/epi.4.2.7953
18. Cowger JJM, Zhao Q, Isovic M, Torchia J. Biochemical characterization of the zinc-finger protein 217 transcriptional repressor complex: identification of a ZNF217 consensus recognition sequence. Oncogene. 2007;26(23):3378–3386. doi:10.1038/sj.onc.1210126
19. Quinlan KGR, Nardini M, Verger A, et al. Specific recognition of znf217 and other zinc finger proteins at a surface groove of c-terminal binding proteins. Mol Cell Biol. 2006;26(21):8159–8172. doi:10.1128/MCB.00680-06
20. Huang G, Krig S, Kowbel D, et al. ZNF217 suppresses cell death associated with chemotherapy and telomere dysfunction. Hum Mol Genet. 2005;14(21):3219–3225. doi:10.1093/hmg/ddi352
21. Thollet A, Vendrell JA, Payen L, et al. ZNF217 confers resistance to the pro-apoptotic signals of paclitaxel and aberrant expression of Aurora-A in breast cancer cells. Mol Cancer. 2010;9(1):291. doi:10.1186/1476-4598-9-291
22. Collins C, Rommens JM, Kowbel D, et al. Positional cloning of ZNF 217 and NABC 1: genes amplified at 20q13.2 and overexpressed in breast carcinoma. Proc Natl Acad Sci. 1998;95(15):8703–8708. doi:10.1073/pnas.95.15.8703
23. Huang HN, Huang WC, Lin CH, Chiang YC, Huang HY, Kuo KT. Chromosome 20q13.2 ZNF217 locus amplification correlates with decreased E-cadherin expression in ovarian clear cell carcinoma with PI3K-Akt pathway alterations. Hum Pathol. 2014;45(11):2318–2325. doi:10.1016/j.humpath.2014.07.020
24. Ginestier C, Adélaïde J, Gonçalvès A, et al. ERBB2 phosphorylation and trastuzumab sensitivity of breast cancer cell lines. Oncogene. 2007;26(50):7163–7169. doi:10.1038/sj.onc.1210528
25. Hartmann K, Becker-Putsche M, Bocklitz T, et al. A study of docetaxel-induced effects in MCF-7 cells by means of raman microspectroscopy. Anal Bioanal Chem. 2012;403(3):745–753. doi:10.1007/s00216-012-5887-9
26. Sapino A, Pietribiasi F, Bussolati G, Marchisio PC. Estrogen- and tamoxifen-induced rearrangement of cytoskeletal and adhesion structures in breast cancer MCF-7 cells. Cancer Res. 1986;46(5):2526–2531.
27. Wang S, Konorev EA, Kotamraju S, Joseph J, Kalivendi S, Kalyanaraman B. Doxorubicin induces apoptosis in normal and tumor cells via distinctly different mechanisms. J Biol Chem. 2004;279(24):25535–25543. doi:10.1074/jbc.M400944200
28. Rennstam K, Baldetorp B, Kytölä S, Tanner M, Isola J. Chromosomal rearrangements and oncogene amplification precede aneuploidization in the genetic evolution of breast cancer. Cancer Res. 2001;61(3):1214–1219.
29. Schipf A, Mayr D, Kirchner T, Diebold J. Molecular genetic aberrations of ovarian and uterine carcinosarcomas—a CGH and FISH study. Virchows Archiv. 2008;452(3):259–268. doi:10.1007/s00428-007-0557-6
30. Wolff AC, Hammond MEH, Allison KH, et al. Human epidermal growth factor receptor 2 testing in breast cancer: American society of clinical oncology/college of American pathologists clinical practice guideline focused update. Arch Pathol Lab Med. 2018;142(11):1364–1382. doi:10.5858/arpa.2018-0902-SA
31. Albertson DG. Gene amplification in cancer. Trends Genet. 2006;22(8):447–455. doi:10.1016/j.tig.2006.06.007
32. Cerami E, Gao J, Dogrusoz U, et al. The cBio cancer genomics portal: an open platform for exploring multidimensional cancer genomics data. Cancer Discov. 2012;2(5):401–404. doi:10.1158/2159-8290.CD-12-0095
33. Gao J, Aksoy BA, Dogrusoz U, et al. Integrative analysis of complex cancer genomics and clinical profiles using the cBioPortal. Sci Signal. 2013;6(269). doi:10.1126/scisignal.2004088
34. Curtis C, Shah SP, Chin SF, et al. The genomic and transcriptomic architecture of 2000 breast tumours reveals novel subgroups. Nature. 2012;486(7403):346–352. doi:10.1038/nature10983
35. Pereira B, Chin SF, Rueda OM, et al. The somatic mutation profiles of 2433 breast cancers refine their genomic and transcriptomic landscapes. Nat Commun. 2016;7(1):11479. doi:10.1038/ncomms11479
36. Li LT, Jiang G, Chen Q, Zheng JN. Ki67 is a promising molecular target in the diagnosis of cancer (Review). Mol Med Rep. 2015;11(3):1566–1572. doi:10.3892/mmr.2014.2914
37. Zheng A, Kallio A, Härkönen P. Tamoxifen-induced rapid death of mcf-7 breast cancer cells is mediated via extracellularly signal-regulated kinase signaling and can be abrogated by estrogen. Endocrinology. 2007;148(6):2764–2777. doi:10.1210/en.2006-1269
38. Baslan T, Kendall J, Volyanskyy K, et al. Novel insights into breast cancer copy number genetic heterogeneity revealed by single-cell genome sequencing. Elife. 2020;9. doi:10.7554/eLife.51480
39. Krig SR, Miller JK, Frietze S, et al. ZNF217, a candidate breast cancer oncogene amplified at 20q13, regulates expression of the erbB3 receptor tyrosine kinase in breast cancer cells. Oncogene. 2010;29(40):5500–5510. doi:10.1038/onc.2010.289
40. Vargas-Rondón N, Pérez-Mora E, Villegas VE, Rondón-Lagos M. Role of chromosomal instability and clonal heterogeneity in the therapy response of breast cancer cell lines. Cancer Biol Med. 2020;17(4):970–985. doi:10.20892/j.issn.2095-3941.2020.0028
41. Endesfelder D, Burrell RA, Kanu N, et al. chromosomal instability selects gene copy-number variants encoding core regulators of proliferation in er+ breast cancer. Cancer Res. 2014;74(17):4853–4863. doi:10.1158/0008-5472.CAN-13-2664
42. Birkbak NJ, Eklund AC, Li Q, et al. Paradoxical relationship between chromosomal instability and survival outcome in cancer. Cancer Res. 2011;71(10):3447–3452. doi:10.1158/0008-5472.CAN-10-3667
43. Jamal-Hanjani M, A’Hern R, Birkbak NJ, et al. Extreme chromosomal instability forecasts improved outcome in ER-negative breast cancer: a prospective validation cohort study from the TACT trial. Ann Oncol. 2015;26(7):1340–1346. doi:10.1093/annonc/mdv178
44. Nguyen NT, Vendrell JA, Poulard C, et al. A functional interplay between ZNF217 and estrogen receptor alpha exists in luminal breast cancers. Mol Oncol. 2014;8(8):1441–1457. doi:10.1016/j.molonc.2014.05.013
45. Cohen PA, Donini CF, Nguyen NT, Lincet H, Vendrell JA. The dark side of ZNF217, a key regulator of tumorigenesis with powerful biomarker value. Oncotarget. 2015;6(39):41566–41581. doi:10.18632/oncotarget.5893
46. Fahmé P, Ramadan F, Le DT, et al. The intricate interplay between the ZNF217 oncogene and epigenetic processes shapes tumor Progression. Cancers. 2022;14(24):6043. doi:10.3390/cancers14246043
47. Ferrari P, Scatena C, Ghilli M, Bargagna I, Lorenzini G, Nicolini A. Molecular mechanisms, biomarkers and emerging therapies for chemotherapy resistant TNBC. Int J Mol Sci. 2022;23(3):1665. doi:10.3390/ijms23031665
48. Liedtke C, Mazouni C, Hess KR, et al. Response to neoadjuvant therapy and long-term survival in patients with triple-negative breast cancer. J Clin Oncol. 2008;26(8):1275–1281. doi:10.1200/JCO.2007.14.4147
49. Ippolito MR, Martis V, Martin S, et al. Gene copy-number changes and chromosomal instability induced by aneuploidy confer resistance to chemotherapy. Dev Cell. 2021;56(17):2440–2454.e6. doi:10.1016/j.devcel.2021.07.006
50. Roylance R, Endesfelder D, Gorman P, et al. Relationship of extreme chromosomal instability with long-term survival in a retrospective analysis of primary breast cancer. Cancer Epidemiol Biomarkers Prev. 2011;20(10):2183–2194. doi:10.1158/1055-9965.EPI-11-0343
51. Littlepage LE, Adler AS, Kouros-Mehr H, et al. The transcription factor znf217 is a prognostic biomarker and therapeutic target during breast cancer progression. Cancer Discov. 2012;2(7):638–651. doi:10.1158/2159-8290.CD-12-0093
52. Nedeljković M, Damjanović A. Mechanisms of chemotherapy resistance in triple-negative breast cancer—how we can rise to the challenge. Cells. 2019;8(9):957. doi:10.3390/cells8090957
53. Inanc M, Ozkan M, Karaca H, et al. Cytokeratin 5/6, c-met expressions, and PTEN loss prognostic indicators in triple-negative breast cancer. Med Oncol. 2014;31(1):801. doi:10.1007/s12032-013-0801-7
54. Early Breast Cancer Trialists’ Collaborative Group. Tamoxifen for early randomised trials. Lancet. 1998;351(9114):1451–1467. doi:10.1016/S0140-6736(97)11423-4
55. Gruvberger-Saal SK, Bendahl PO, Saal LH, et al. Estrogen receptor β expression is associated with tamoxifen response in erα-Negative breast carcinoma. Clin Cancer Res. 2007;13(7):1987–1994. doi:10.1158/1078-0432.CCR-06-1823
56. Wang S, Huang X, Lee CK, Liu B. Elevated expression of erbB3 confers paclitaxel resistance in erbB2-overexpressing breast cancer cells via upregulation of survivin. Oncogene. 2010;29(29):4225–4236. doi:10.1038/onc.2010.180
 © 2024 The Author(s). This work is published and licensed by Dove Medical Press Limited. The full terms of this license are available at https://www.dovepress.com/terms.php and incorporate the Creative Commons Attribution - Non Commercial (unported, v3.0) License.
By accessing the work you hereby accept the Terms. Non-commercial uses of the work are permitted without any further permission from Dove Medical Press Limited, provided the work is properly attributed. For permission for commercial use of this work, please see paragraphs 4.2 and 5 of our Terms.
© 2024 The Author(s). This work is published and licensed by Dove Medical Press Limited. The full terms of this license are available at https://www.dovepress.com/terms.php and incorporate the Creative Commons Attribution - Non Commercial (unported, v3.0) License.
By accessing the work you hereby accept the Terms. Non-commercial uses of the work are permitted without any further permission from Dove Medical Press Limited, provided the work is properly attributed. For permission for commercial use of this work, please see paragraphs 4.2 and 5 of our Terms.