Back to Journals » ClinicoEconomics and Outcomes Research » Volume 15
Work Loss and Direct and Indirect Costs Associated with Parkinson’s Disease
Authors Jerry M ![]() , Arcona S
, Arcona S ![]() , McMorrow D, Schwartz H, Princic N, Sasane R
, McMorrow D, Schwartz H, Princic N, Sasane R
Received 8 December 2022
Accepted for publication 15 April 2023
Published 27 April 2023 Volume 2023:15 Pages 309—319
DOI https://doi.org/10.2147/CEOR.S398509
Checked for plagiarism Yes
Review by Single anonymous peer review
Peer reviewer comments 2
Editor who approved publication: Prof. Dr. Dean Smith
Michelle Jerry,1 Steve Arcona,2 Donna McMorrow,1 Hana Schwartz,1 Nicole Princic,1 Rahul Sasane2
1Merative, Ann Arbor, MI, USA; 2Cerevel Therapeutics, Cambridge, MA, USA
Correspondence: Michelle Jerry, Merative, 100 Phoenix Dr Ste 200, Ann Arbor, MI, 48108, USA, Email [email protected]
Purpose: To examine work loss and indirect costs during the three-year periods prior to and following initial diagnosis of Parkinson’s disease (PD) in patients and in spouses of PD patients, as well as direct costs of healthcare.
Patients and Methods: This is a retrospective, observational cohort study using the MarketScan Commercial and Health and Productivity Management databases.
Results: A total of 286 employed PD patients and 153 employed spouses met all diagnostic and enrollment criteria for short-term disability (STD) analysis (PD Patient cohort and Caregiving Spouse cohort). The proportion of PD patients having a STD claim increased from roughly 5% and plateaued at around 12– 14% starting in the year prior to first diagnosis of PD. The mean number of days lost from work due to STD per year increased from 1.4 days in the 3rd year prior to diagnosis to 8.6 days in the 3rd year after diagnosis (corresponding to an increase in indirect costs from $174 to $1104). STD use for spouses of patients with PD was lowest in the year after their spouses were diagnosed and then rose dramatically in the 2nd and 3rd years after the spouse’s diagnosis. Total all-cause direct health-care costs increased during the years leading up to PD diagnosis and were highest in the years following diagnosis, with PD-related costs contributing ~20– 30% of the total.
Conclusion: PD has both a significant direct and indirect financial burden on patients and their spouses when analyzed for 3 years before and after diagnosis.
Keywords: caregiver burden, cost of illness, health expenditures, prodromal symptoms, retrospective studies, sick leave
Introduction
Parkinson’s disease (PD) is a progressive neurodegenerative disease characterized by bradykinesia and other motor and non-motor clinical features.1 Approximately 572 per 100,000 persons ages 45 years and older in North America suffer from PD,2 and PD is estimated to affect 1.6% of persons ages 65 years and older,3 with a median age of onset is 60 years old.4
There is a large, direct economic burden associated with PD due to its chronic, progressive, and debilitating nature. A report from the Lewin Group, supported by the Michael J. Fox Foundation, showed that on average PD patients in the United States had $24,439 higher direct medical costs in 2017 when compared with a control group of similar age, gender, and insurance coverage.5 Diseases of the central nervous system tend to have a disproportionately high burden of indirect costs, and this is particularly true for PD because its median age of onset occurs while many patients and caregivers are still working. The indirect cost of PD is an important component often left out of models that attempt to quantify the economic burden of PD. A few studies have measured the indirect cost associated with PD, but those measurements are often based on survey data.3,5–7 Recently, two different database studies have looked at the indirect costs of PD for PD patients8 and their caregivers,4 each finding a significant economic burden.
This retrospective, observational cohort study adds to the literature of database studies that quantify the indirect burden of PD by measuring time off work (and associated indirect costs) due to short-term disability (STD) and absenteeism (ABS) for both patients with PD as well as spouses potentially providing care for PD patients in the United States. In addition, this study describes direct health-care costs among PD patients who are full-time employees as well as PD patients who are the spouses of full-time employees (but who may not be working themselves) to provide a comprehensive analysis of PD patients.
Materials and Methods
Study Design and Data Source
This retrospective, observational cohort study was conducted using commercial claims from the MarketScan® Commercial Database and the MarketScan Health and Productivity Management (HPM) Database. The Commercial database contains the inpatient, outpatient, and outpatient prescription drug experience of employees and their dependents, covered under a variety of fee-for-service and managed care health plans, including exclusive provider organizations, preferred provider organizations (PPOs), point-of-service (POS) plans, indemnity plans, and health maintenance organizations (HMOs). The HPM database contains workplace absence, short-term disability, long-term disability, and workers’ compensation data for a subset of employees. The database is fully linkable to the corresponding medical and pharmacy claims data for these employees.
All definitions of variables used to identify study outcomes and cohorts were measured based on inpatient medical, outpatient medical, and outpatient pharmaceutical data using enrolment records, service dates, International Classification of Diseases, 9th/10th Revision, Clinical Modification (ICD-9-CM/ICD-10-CM) codes, Current Procedural Technology 4th edition (CPT) codes, Healthcare Common Procedure Coding System (HCPCS) codes, and National Drug Codes (NDCs).
Study Populations and Period
There were three main populations of interest included in this study. Patients with PD who are also the full-time employee and insurance subscriber (referred to as the “PD Patient” cohort). Individuals who are the full-time employee and insurance subscriber, do not have PD, but are spouses potentially providing care for their PD-diagnosed spouse (“Caregiving Spouse” cohort). Patients with PD who are linked to the Caregiving Spouses (“PD Spouse” cohort). Patients in the PD Spouse cohort may or may not be employed themselves (see Table S1 for elaboration on cohort terminology) and were included as a contrast to employed Parkinson’s patients (PD Patient cohort) when reporting direct health-care costs. Separate cohorts of PD Patients and Caregiving Spouses meeting eligibility criteria were identified for analysis of STD (core) and ABS (Figures S1, S2, and S3) work loss outcomes.
The time period captured in the study spanned from January 1, 2005, through December 31, 2019. The pre-index period was the three years prior to PD diagnosis and was divided into three year-long increments (ie, Year −3, Year −2, and Year −1). The follow-up period was the three years following PD diagnosis and also was divided into three year-long increments (ie, Year +1, Year +2 and Year +3).
PD Patient Cohort
Employees with HPM eligibility who had at least two non-diagnostic claims (inpatient or outpatient) at least 6 months apart with an ICD-9-CM or ICD-10-CM diagnosis code for PD between January 1, 2008, and December 31, 2019 were initially selected for the PD Patient cohort. The earliest diagnosis of PD was used as the index date. All patients were required to be between ages 18–64 years on the index date, to have at least three years of continuous enrollment with medical and pharmacy benefits and work loss eligibility prior to the index date (pre-index period) and after the index date (follow-up period), and to remain a full-time employee during this time. PD patients were excluded from the study if they had any claims with a diagnosis code for PD during the pre-index period (to ensure patients were newly diagnosed) or if they had evidence of pregnancy or childbirth during the study period (January 1, 2008 – December 31, 2019).
Caregiving Spouse and PD Spouse Cohorts
Employees with HPM eligibility who had a spouse on their insurance plan with an eligible diagnosis of PD (ie, at least two non-diagnostic claims at least 6 months apart with an ICD-9-CM or ICD-10-CM diagnosis code for PD) were initially selected for the Caregiving Spouse cohort. The earliest PD diagnosis of the spouse with PD was used as the index date. Caregiving Spouses were excluded if they had claims with a diagnosis code for PD at any time during the study period. All other inclusion and exclusion criteria were consistent with the PD Patient cohort. After selecting employees to the Caregiving Spouse cohort, their spouses (who had PD) were assigned to the PD Spouse cohort. Both of the linked spouses (ie, the Caregiving Spouse and the PD Spouse) were included to address different aspects of the study objectives.
Patient Characteristics
Demographic characteristics of PD Patients and Caregiving Spouses were measured on the index date and included age, sex, work industry, geographic region of residence, population density of area of residence, insurance plan type, and index year. The Deyo-Charlson Comorbidity Index (DCI) as well as its individual components were reported in the one year prior to the index date as a measure of baseline health status.
Productivity Loss and Indirect Cost Outcomes
STD and ABS productivity loss and indirect cost outcomes were reported during the three one-year increments of both the pre-index and follow-up periods for the PD Patient and Caregiving Spouse cohorts. The number and percentage of PD Patients and Caregiving Spouses with at least one day of work loss were measured. Mean number of days lost from work and mean indirect costs among individuals with work loss were also measured. Indirect costs were reported descriptively by converting the number of days lost to a dollar amount using a “median daily wage” constant of $183.40 per day ($917 per week/5 days), which is equivalent to the median daily wage for employed full-time, wage and salary workers from the 2019 US Bureau of Labor and Statistics Current Population Survey.9 For ABS, the calculation was [number of workdays lost] x [median daily wage]. Since STD benefits generally pay 70% of wages, 70% of the wage rate per day was used to quantify indirect costs incurred due to STD.
Direct Healthcare Cost Outcomes
All-cause and PD-related health-care costs were reported in the PD Patient cohort and the PD Spouse cohort during the three one-year increments of both the pre-index and follow-up periods. The PD Patient cohort included full-time employees who remain employed for the full follow-up period, while the PD Spouse cohort included individuals who may or may not be employed. Reporting health-care costs in these two groups (ie, PD Patients who are employed and healthy enough to stay at their job and PD Spouses who may no longer be able to work) is an important consideration and required for a comprehensive analysis.
PD-related costs were defined as inpatient admissions with primary diagnosis of PD, outpatient claims with diagnosis of PD in any position, and pharmacy claims for PD treatments (see Table S2 for list of generic names for PD treatments that were included). Service categories included inpatient (IP) admissions, outpatient (OP) medical services (emergency room [ER] visits, office visits and other outpatient services), and OP pharmacy prescriptions. Total direct medical costs included the sum of medical costs (IP + OP services) and OP pharmacy prescriptions. Health-care costs were based on paid amounts of adjudicated claims, including insurer and health plan payments as well as patient cost-sharing in the form of copayment, deductible, and coinsurance. All dollar estimates were inflated to 2019 dollars using the Medical Care Component of the Consumer Price Index (CPI).
Utilization in each of the above service categories also was reported. Additionally, the number and percentage of patients with a prescription or office administration of any PD drug and three specific classes of PD drugs (levodopa, dopamine agonists, and monoamine oxidase B (MAO B) inhibitors) were reported.
Analyses
Bivariate analyses were calculated for all study variables. Categorical variables were presented as the count and percentage of PD Patients and Caregiving Spouses in each category. Continuous variables were summarized by providing the mean, median, and standard deviation (SD). All data analyses were conducted using WPS version 4.2 (World Programming, United Kingdom).
Results
Patient Characteristics
After application of all inclusion and exclusion criteria, there were 286 PD Patients and 153 Caregiving Spouses eligible for the core study of STD work loss and direct health-care costs (Figure 1). In addition, there were 104 PD Patients and 45 Caregiving Spouses eligible for the analysis of ABS work loss (Figure S1). For the core study, the PD Patient cohort had a mean (SD) age of 53.1 (5.2) years, were mostly male (85.0%), and had an average DCI score of 0.51 (1.2). The Caregiving Spouse cohort had a mean (SD) age of 53.0 (5.2) years old, 64.1% were male, and had an average DCI score of 0.42 (1.0) (Table 1).
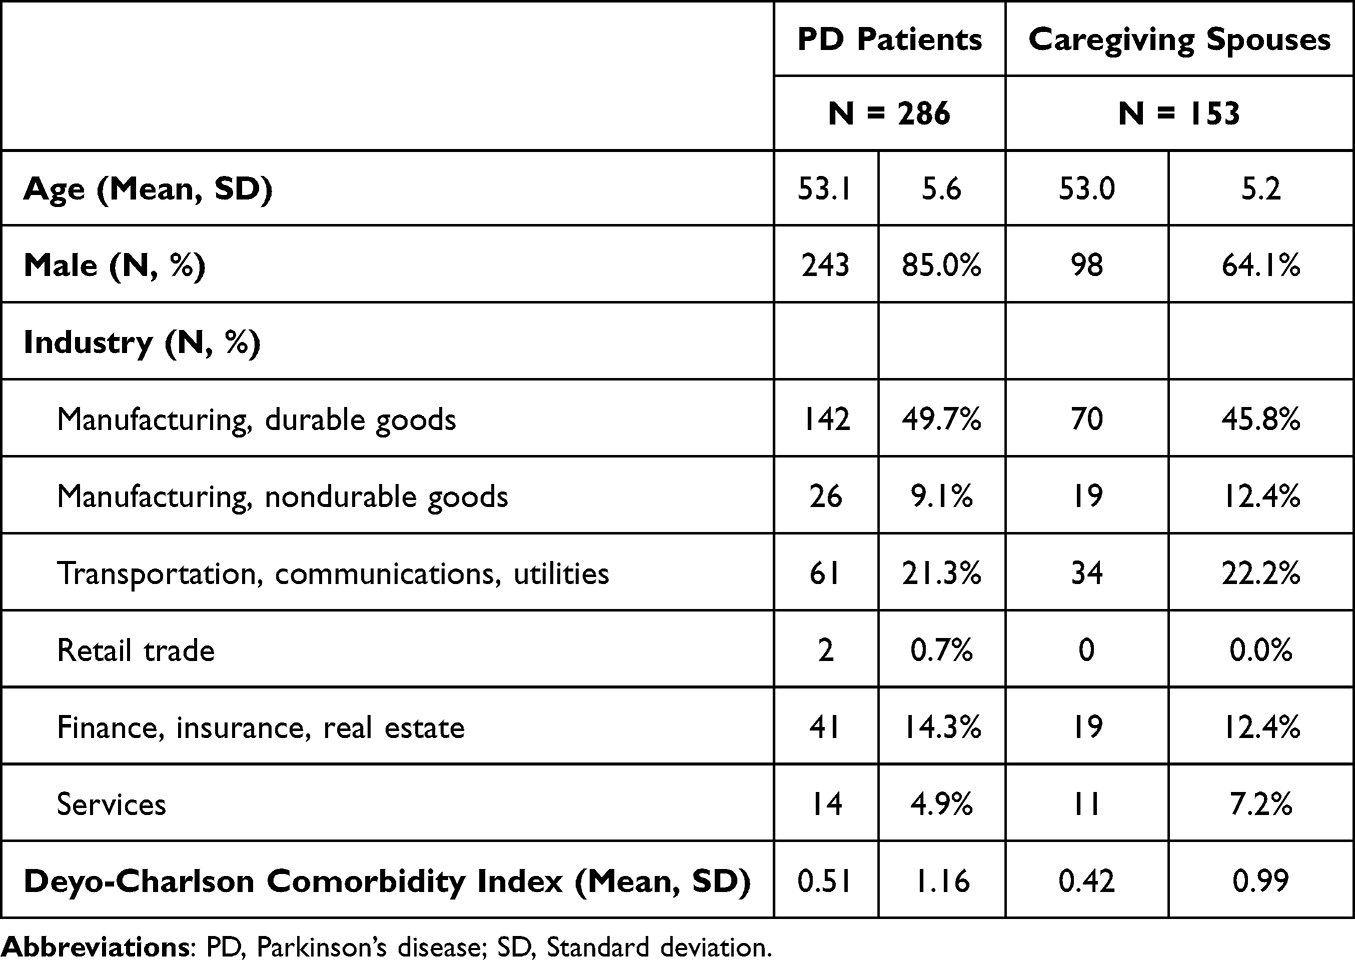 |
Table 1 PD Patient and Caregiving Spouse Characteristics |
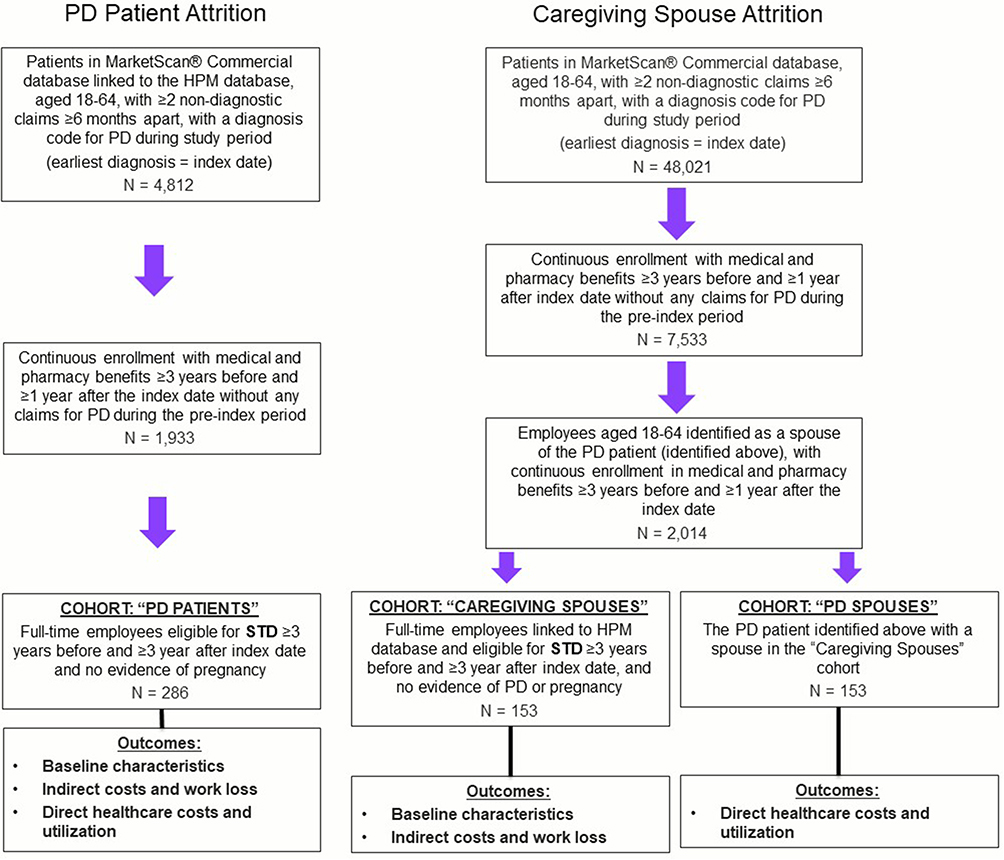 |
Figure 1 PD Patient and Caregiving Spouse attrition. |
Productivity Loss and Indirect Costs
The proportion of PD Patients with work loss due to STD increased steadily during the three years prior to and following diagnosis (4.9–14.0%) (Figure 2). The mean number of days lost from work due to STD per year increased from 1.4 days in the 3rd year prior to diagnosis to 8.6 days in the 3rd year after diagnosis (corresponding to an increase in indirect costs from $174 to $1104) (Figure 3). Among those with work loss due to STD, the mean number of days lost from work per year increased from 27.6 days in the 3rd year prior to diagnosis to 61.5 days in the 3rd year after diagnosis with a corresponding increase in indirect costs from $3549 to $7892.
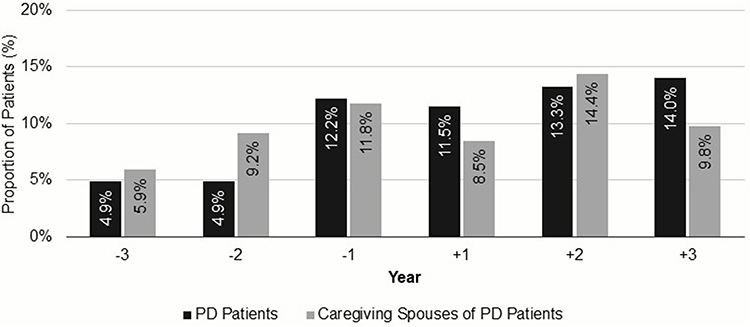 |
Figure 2 Proportion of PD Patient cohort and Caregiving Spouse cohort with short-term disability. |
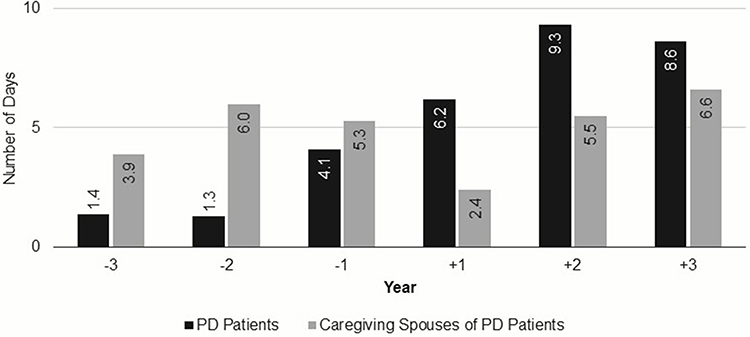 |
Figure 3 Number of short-term disability days among the PD Patient cohort and Caregiving Spouse cohort. |
The proportion of Caregiving Spouses with STD increased from 5.9% to 11.8% during the three years prior to diagnosis of their PD Spouse, fell to 8.5% during the first year after diagnosis, then increased again to 14.4% and 9.8% for the following two years (Figure 2). The mean number of days lost from work due to STD per year followed a similar trend, increasing during the years prior to diagnosis (from 3.9 to 5.3 days per year), falling during the first year after diagnosis (to 2.4 days per year), and then rising again the following two years (5.5 and 6.6 days per year in Year +2 and Year +3, respectively) (Figure 3). This increase in workdays lost due to STD in the post-diagnosis years corresponds to an increase in indirect costs from $302 to $850.
Work ABS (proportion of with work loss and number of days lost) remained relatively stable during the three years prior to and following diagnosis for both PD Patients and Caregiving Spouses (Figures S2 and S3). The mean number of ABS days lost was high in the year prior to diagnosis and trended upward throughout the post-diagnosis years.
Direct Healthcare Costs
Total all-cause average costs increased steadily from Year −3 ($5742) to Year +3 ($18,527) in the PD Patient cohort (full-time employees with PD) but were lower in each year when compared with the PD Spouse cohort (spousal dependents with PD who are on the insurance of the Caregiving Spouse cohort) (Figure 4). Total all-cause average health-care costs of the PD Spouse cohort increased from Year −3 ($16,998) to Year +2 ($35,488), and then slightly decreased by Year +3 ($28,968) (Figure 4). During the three years after diagnosis, increases in costs were consistent in most services categories (IP, OP, pharmacy) (Table 2).
 |
Table 2 PD Patient and PD Spouse Direct Health-care Costs |
 |
Figure 4 Direct healthcare costs for PD Patients and PD Spouses. |
Average PD-related health-care costs (medical and pharmacy) remained fairly stable during the first three years after diagnosis and were similar for the PD Patient cohort ($5313 in Year +1 to $6179 in Year +3) and PD Spouse cohort ($5630 in Year +1 to $6489 in Year +3). PD-related costs were 31–36% of total health-care costs in the PD Patient cohort and 13–22% of total health-care costs in the PD Spouse cohort (Table 2 and Figure 4).
Utilization trends of PD-related treatments were similar in the PD Patient cohort and PD Spouse cohort. Treatment utilization started to rise in the year preceding initial diagnosis of PD (~30–35%) with a majority (~83–89%) of patients having at least one treatment during the first year following diagnosis (Figure S4). PD drugs may be present prior to the first PD diagnosis because the patient may have undergone the “levodopa challenge” (trial of the medication that confirms a PD diagnosis if the patient’s symptoms improve while taking the medication), the patient may be treated for PD-related symptoms prior to a specific PD diagnosis, or the patient may be prescribed the drug for non-PD conditions (eg, some dopamine agonists may be prescribed for restless leg syndrome). Levodopa was the most commonly observed drug, followed by dopamine agonists and MAO-B inhibitors (Figure S4).
Discussion
In this retrospective, observational cohort study assessing work loss and health-care costs associated with PD (patients and caregiving spouses), PD patients had steady increases in the percent with a STD claim (roughly 5% to 14%) and the mean number of days of STD per year (roughly 1 to 9 days) comparing a couple of years before to a couple of years after diagnosis of PD. This roughly 8-day increase in annual work loss translates to an increase in indirect costs of $1027 per PD patient. After restricting only to PD patients with STD, the mean number of STD days per year increased from roughly 26–28 days per year before PD diagnosis to roughly 62–70 days per year after PD diagnosis. This roughly 40-day increase in annual work loss translates to an increase in indirect costs of $5135 per PD patient with STD. While the $1027 increase reflects a rise in indirect costs due to PD (as well as age-related worsening health status), the $5135 increase shows that PD is more debilitating than other conditions for which STD may be utilized. The number of STD days decreased slightly in the third year following diagnosis (from 9.3 days in Year 2+ to 8.6 days in Year 3+), potentially due to an increase in levodopa utilization yielding greater symptom control (50.7% of PD patients used levodopa in Year +1 compared with 61.2% and 67.5% in Year +2 and Year +3).
Work loss due to STD among spouses potentially providing care to those with PD was lowest in the year after their spouses were diagnosed with PD and then rose dramatically the next two years. The delayed sharp increase may reflect that caregiving-related comorbidities (such as depression, arthritis, etc.) take time to develop. A recent study4 of PD caregiver burden also found substantial increases in caregiving-related indirect costs in the years following a family member’s PD diagnosis. In that study, caregivers experienced $345 higher indirect costs in Year +1 compared to controls, and $457 and $607 higher indirect costs in Years +2 and +3.
Mean all-cause health-care costs increased steadily from Year −3 to Year +3 in both the PD Patient cohort and the PD Spouse cohort. The rise in costs across the years prior to PD diagnosis may reflect costs associated with treatment of PD prodromal symptoms and tests to narrow in on the PD diagnosis. All-cause health-care costs were much higher for the PD Spouse cohort compared with the PD Patients cohort, which may be attributed to the requirement that the PD Patient cohort retain full-time employment for the three years after PD diagnosis and therefore may represent a generally healthier PD population. Given this, the trends observed in both indirect cost analyses (STD and ABS) may be representative of a less severe PD population.
A report from the Lewin Group5 estimated that on average, PD patients had $24,439 higher direct medical costs in 2017 when compared with a control group of similar age, gender, and insurance coverage. Our study also demonstrated a large direct economic burden for PD patients (mean all-cause total costs of $17,035-$18,527 in the first 3 years after diagnosis [PD Patient cohort], and $28,968-$35,488 [PD Spouse cohort]), though our reported PD-related costs were much lower than those in the Lewin Group report. In our study, PD-related costs were about $4500 to $6500 annually, which accounted for 31–36% of total health-care costs in the PD Patient cohort and 13–22% of total health-care costs in the PD Spouse cohort. The difference in PD-related costs between the Lewin Group report and our study may be explained by several factors. First, the Lewin Group report included all PD patients (82% of which were age 65 years and older), while our study only analyzes younger PD patients (under age 65) and therefore may have less severe disease. Second, our PD-related costs may be underestimated because they only reflect costs from health-care claims that specify a PD diagnosis and pharmacy claims for PD treatments, potentially missing costs for conditions that may be intertwined with PD (such as depression). Third, our study only analyzed the first three years after initial diagnosis, but costly PD-related events (such as falls) usually do not take place until several years later.10,11
This study analyzed data available for patients and caregivers during the three years prior to and the three years after initial PD diagnosis, providing a consistent denominator population throughout the entire six year period in order to avoid spurious trends due to non-random attrition. Additionally, the databases allowed for analysis of a wide range of outcomes for both the patient and caregiver populations.
However, the study results should be examined while considering its limitations, many of which are inherent in any retrospective study. This study was limited to individuals ages 18–64 who had commercial health coverage. Consequently, results of this study may not be generalizable to individuals diagnosed with PD after age 65 or to those with other insurance or without health insurance coverage. The study relied on diagnosis, procedure, and medication codes to identify a patient’s clinical profile. While such information is available in claims data, it is subject to data coding limitations and data entry error. Work absence claims reflect any absence that a patient takes from work, and although some employers do provide some classification for absences (eg, illness), the reason is largely unknown. For STD, the reason for the claim is also unknown, so we reported all-cause work loss, rather than PD-specific work loss. This study is based on data from 2005 through 2019 and thus the reported direct and indirect cost estimates may not be generalizable to recent PD trends. For instance, historically, levodopa was reserved for sicker PD patients due to the risk of associated side effects but there has been a recent shift toward using levodopa earlier now that doctors are learning how to titrate levodopa dosing and thus limit those side effects.12 Finally, relatively small sample sizes (due to studying a condition not commonly found in working-age individuals within a linked database of health-care claims and work productivity data) have low power to detect statistically significant changes, and thus, formal statistical comparisons were not pre-specified. Moreover, our study did not aim to show statistically significant trends in health-care costs; rather, health-care costs were included in our study to benchmark the relative magnitude of the work-loss-related (indirect) costs versus healthcare (direct) costs and to contrast the trends of indirect versus direct costs before and after PD diagnosis.
Several avenues for additional research are suggested by the results of this study. For PD patients, non-PD-related health-care costs in the follow-up period were much higher than the pre-period, suggesting that there may be some costs related to PD that were not accounted for in the current study. A control cohort could help isolate PD-related healthcare cost burden from total costs. The control cohort also could quantify how much of the rise in STD use (and all-cause health-care costs) for PD patients is attributable to increasing age (and thus, age-related worsening health status) versus PD. Additional research could also follow PD patients for more than three years after initial PD diagnosis, which would allow for more severe progression of PD to be accounted for in both direct and indirect cost outcomes since costly disease milestones (such as falls with trauma and hospitalization, hallucinations, residential home placement, etc.) typically occur several years after diagnosis. These conditions require specific treatments with related high costs, which could be explored in future works. Likewise, longer follow-up of PD caregivers would allow more time for caregiving-related comorbidities to develop. Finally, this analysis did not focus on device-aided therapies like levodopa-carbidopa intestinal gel infusion (LCIG), continuous subcutaneous apomorphine infusion (CSAI), and deep brain stimulation (DBS). Prior research13 has studied the direct costs of these treatments; however, the work loss (and associated indirect costs) among patients receiving these treatments has not been studied.
Conclusions
Overall, this study adds to the growing body of literature that PD has both a significant direct and indirect financial burden on patients and their caregivers. Using administrative claims data, we were able to quantify the indirect economic burden of PD for three years before and after diagnosis. These results are consistent with previous literature that has shown the significant economic burden of PD.
Abbreviations
STD, short-term disability; PD, Parkinson’s disease; HPM, health and productivity management; ABS, absenteeism; EPO, exclusive provider organization; PPO, preferred provider organizations; POS, point-of-service; HMO, health maintenance organization; ICD-9-CM/ICD-10-CM, international classification of diseases, 9th/10th revision, clinical modification; DCI, Deyo-Charlson Comorbidity Index; CPT, current procedural technology, HCPCS, health-care common procedure coding system; NDC, national drug codes; IP, inpatient; OP, outpatient; WPS, world programming services.
Data Sharing Statement
The data that support the findings of this study are available from Merative. Restrictions apply to the availability of these data, which were used under license for this study.
Ethics Approval and Informed Consent
All database records are de-identified and fully compliant with United States patient confidentiality requirements, including the Health Insurance Portability and Accountability Act (HIPAA) of 1996. The databases have been evaluated and certified by an independent third party to be in compliance with the HIPAA statistical de-identification standard. The databases were certified to satisfy the conditions set forth in Sections 164.514 (a)-(b)1ii of the HIPAA privacy rule regarding the determination and documentation of statistically de-identified data. Because this study uses only de-identified patient records and does not involve the collection, use, or transmittal of individually identifiable data, the data does not involve human subjects (per the definition of human subjects in the Code of Federal Regulations (CFR) Title 45 Part 46.102(e)). Thus, this study was exempted from Institutional Review Board (IRB) approval. Data was used under license for this study.
Consent for Publication
There are no images and no statements included in this manuscript that require consent.
Acknowledgments
Programming services were provided by Caroline Henriques and writing assistance was provided by James Nelson of Merative.
Author Contributions
All authors made a significant contribution to the work reported, whether that is in the conception, study design, execution, acquisition of data, analysis and interpretation, or in all these areas; took part in drafting, revising or critically reviewing the article; gave final approval of the version to be published; have agreed on the journal to which the article has been submitted; and agree to be accountable for all aspects of the work.
Funding
This study was funded by Cerevel Therapeutics. The publication of study results was not contingent on Cerevel Therapeutics approval or censorship of the manuscript.
Disclosure
Ms. Jerry, Ms. McMorrow, Ms. Schwartz, and Ms. Princic reported being employed by Merative, which received funding from Cerevel Therapeutics to conduct this study. Drs Arcona and Sasane reported being employed by and receiving stock options from Cerevel Therapeutics. The authors report no other conflicts of interest in this work.
References
1. Poewe W, Seppi K, Tanner CM, et al. Parkinson disease. Nat Rev Dis Primers. 2017;3:17013. doi:10.1038/nrdp.2017.13
2. Marras C, Beck JC, Bower JH, et al. Prevalence of Parkinson’s disease across North America. NPJ Parkinsons Dis. 2018;4:21. doi:10.1038/s41531-018-0058-0
3. Huse DM, Schulman K, Orsini L, et al. Burden of illness in Parkinson’s disease. Mov Disord. 2005;20:1449–1454. doi:10.1002/mds.20609
4. Martinez-Martin P, Macaulay D, Jalundhwala YJ, et al. The long-term direct and indirect economic burden among Parkinson’s disease caregivers in the United States. Mov Disord. 2019;34:236–245. doi:10.1002/mds.27579
5. Yang G, Schmiel L, Zhou M, et al. Economic Burden and Future Impact of Parkinson’s Disease. Falls Church, VA, USA: The Lewin Group, Inc; 2019.
6. Whetten-Goldstein K, Sloan F, Kulas E, et al. The burden of Parkinson’s disease on society, family, and the individual. J Am Geriatr Soc. 1997;45:844–849. doi:10.1111/j.1532-5415.1997.tb01512.x
7. Yang W, Hamilton JL, Kopil C, et al. Current and projected future economic burden of Parkinson’s disease in the U.S. NPJ Parkinsons Dis. 2020;6:15. doi:10.1038/s41531-020-0117-1
8. Kowal SL, Dall TM, Chakrabarti R, et al. The current and projected economic burden of Parkinson’s disease in the United States. Mov Disord. 2013;28:311–318. doi:10.1002/mds.25292
9. U.S Bureau of Labor Statistics. Labor force statistics from the current population survey. Available from: https://www.bls.gov/cps/aa2019/cpsaat37.htm.
10. Sveinbjornsdottir S. The clinical symptoms of Parkinson’s disease. J Neurochem. 2016;139(Suppl 1):318–324. doi:10.1111/jnc.13691
11. Wood BH, Bilclough JA, Bowron A, et al. Incidence and prediction of falls in Parkinson’s disease: a prospective multidisciplinary study. J Neurol Neurosurg Psychiatry. 2002;72:721–725. doi:10.1136/jnnp.72.6.721
12. Pringsheim T, Day GS, Smith DB, et al. Dopaminergic therapy for motor symptoms in early Parkinson disease practice guideline summary: a report of the AAN guideline subcommittee. Neurology. 2021;97(20):942–957.
13. Marsili L, Bologna M, Miyasaki JM, Colosimo C. Parkinson’s disease advanced therapies - A systematic review: more unanswered questions than guidance. Parkinsonism Relat Disord. 2021;83:132–139. doi:10.1016/j.parkreldis.2020.10.042
 © 2023 The Author(s). This work is published and licensed by Dove Medical Press Limited. The
full terms of this license are available at https://www.dovepress.com/terms
and incorporate the Creative Commons Attribution
- Non Commercial (unported, 3.0) License.
By accessing the work you hereby accept the Terms. Non-commercial uses of the work are permitted
without any further permission from Dove Medical Press Limited, provided the work is properly
attributed. For permission for commercial use of this work, please see paragraphs 4.2 and 5 of our Terms.
© 2023 The Author(s). This work is published and licensed by Dove Medical Press Limited. The
full terms of this license are available at https://www.dovepress.com/terms
and incorporate the Creative Commons Attribution
- Non Commercial (unported, 3.0) License.
By accessing the work you hereby accept the Terms. Non-commercial uses of the work are permitted
without any further permission from Dove Medical Press Limited, provided the work is properly
attributed. For permission for commercial use of this work, please see paragraphs 4.2 and 5 of our Terms.