Back to Journals » Cancer Management and Research » Volume 13
Value of Machine Learning with Multiphases CE-MRI Radiomics for Early Prediction of Pathological Complete Response to Neoadjuvant Therapy in HER2-Positive Invasive Breast Cancer
Authors Li Q, Xiao Q ![]() , Li J, Wang Z, Wang H
, Li J, Wang Z, Wang H ![]() , Gu Y
, Gu Y
Received 2 February 2021
Accepted for publication 4 May 2021
Published 28 June 2021 Volume 2021:13 Pages 5053—5062
DOI https://doi.org/10.2147/CMAR.S304547
Checked for plagiarism Yes
Review by Single anonymous peer review
Peer reviewer comments 2
Editor who approved publication: Dr Ahmet Emre Eşkazan
Qin Li,1,2,* Qin Xiao,1,2,* Jianwei Li,2,3 Zhe Wang,4,5 He Wang,4,5 Yajia Gu1,2
1Department of Radiology, Fudan University Shanghai Cancer Center, Shanghai, People’s Republic of China; 2Department of Oncology, Shanghai Medical College, Fudan University, Shanghai, People’s Republic of China; 3Department of Breast Surgery, Fudan University Shanghai Cancer Center, Shanghai, People’s Republic of China; 4Shanghai Center for Mathematical Sciences, Fudan University, Shanghai, People’s Republic of China; 5Human Phenome Institute, Fudan University, Shanghai, People’s Republic of China
*These authors contributed equally to this work
Correspondence: Yajia Gu; He Wang Tel +8618017312040
Fax +862164174774
Email [email protected]; [email protected]
Background: To assess the value of radiomics based on multiphases contrast-enhanced magnetic resonance imaging (CE-MRI) for early prediction of pathological complete response (pCR) to neoadjuvant therapy (NAT) in patients with human epithelial growth factor receptor 2 (HER2) positive invasive breast cancer.
Methods: A total of 127 patients with newly diagnosed primary HER2 positive invasive breast cancer underwent CE-MRI before NAT and performed surgery after NAT. Radiomic features were extracted from the 1st postcontrast CE-MRI phase (CE1) and multi-phases CE-MRI (CEm),respectively. With selected features using a forward stepwise regression, 23 machine learning classifiers based on CE1 and CEm were constructed respectively for differentiating pCR and non-pCR patients. The performances of classifiers were assessed and compared by their accuracy, sensitivity, specificity and AUC (area under curve). The optimal machine learning classification was used to discriminate pCR vs non-pCR in mass and non-mass groups, uni-focal and unilateral multi-focal groups, respectively.
Results: For the task of pCR classification, 6 radiomic features from CE1 and 6 from CEm were selected for the construction of machine learning models, respectively. The linear SVM based on CEm outperformed the logistic regression model using CE1 with an AUC of 0.84 versus 0.69. In mass and non-mass enhancement groups, the accuracy of linear SVM achieved 84% and 76%. Whereas in unifocal and unilateral multifocal cases, 79% and 75% accuracy were achieved by linear SVM.
Conclusion: Multiphases CE-MRI imaging may offer more heterogeneity information in the tumor and provide a non-invasive approach for early prediction of pCR to NAT in patients with HER2-positive invasive breast cancer.
Keywords: radiomics, breast cancer, neoadjuvant therapy, machine learning, magnetic resonance imaging
Backgrounds
HER2 (human epithelial growth factor receptor 2) positive breast cancer (non-luminal) is defined as HER2-positive and hormone receptor (HR)-negative tumor. It has high malignancy, more recurrence and poor prognosis, but is sensitive to neoadjuvant therapy (NAT, chemotherapy combined anti-HER2 therapy)1,2 which is widely used in HER2 positive breast cancer.3–5 NAT could improve the disease-free and overall survival, therefore the pathologic complete response (pCR) to NAT has been proposed as a prognostic marker in HER2 positive breast cancer patients.6–9 Nevertheless, only about 40% of the patients could achieve pCR after the completion of NAT. Predicting pCR before NAT is desirable for identifying patients who will not benefit from NAT. Identification of pCR can only be confirmed by histopathological specimens which is traumatic and may not reflect the heterogeneity of the entire tumor. Thus, a method to predict pCR earlier and noninvasively remains a major challenge.
Compared with mammography and ultrasound, breast magnetic resonance imaging (MRI) was confirmed as the most reliable imaging tool for evaluating the response of tumor to chemotherapy.10,11 Many imaging modality of MRI, such as T2WI (T2 weighted imaging), DWI (diffusion weighted imaging) and CE (contrast enhancement)-MRI, had been proposed to evaluate the response to NAT in patients with breast cancer.12,13 Besides, CE-MRI is sensitive to perfusion, permeability of tissue microvascular and angiogenic changes and has been identified as the most sensitive method for prediction of treatment response to NAT.14–22 While clinical MRI images depend on naked eyes, radiomics can translate medical images into high-dimensional data which reflect not only macroscopic but also the cellular and molecular properties of tissues.23,24 Radiomics is the bridge to combine medical imaging and personalized medicine. The purpose of radiomic analysis is to generate image-driven biomarkers which can provide a deeper understanding of microenvironment and spatial heterogeneity in tumor noninvasively.
To date, previous studies have indicated that radiomics model can detect the pCR to NAT in breast cancer.13,14,21,25 However, studies that specifically assess the performance of MRI radiomics in detecting pCR to NAT in HRE2 positive subtype has not been retrieved yet. In addition, these studies demonstrated the feasibility and potential benefits of radiomics in pCR prediction in breast cancer only using the 1st postcontrast CE-MRI phase (CE1) which only reflects the spatial heterogeneity of the tumor. Nevertheless, features derived from multi-phases of contrast enhanced MRI images (CEm) may imply much information changing over time points.26,27
In the present study, we utilized all phases of contrast enhanced MRI images to calculate new sequential texture features changing over time points, and then compared the predictive ability of features from CE1 and CEm. The aimed of this study is to assess the value of radiomics based on multiphases CE-MRI for early prediction of pCR to NAT in HER2 positive invasive breast cancer.
Materials and Methods
Patient Population
In total, 127 female patients who underwent conserving breast surgery or radical mastectomy between January 2012 and December 2018 were consecutively enrolled in the study according to the inclusion and exclusion criteria. We have complied with the World Medical Association Declaration of Helsinki regarding the ethical conduct of research involving human subjects. This study was approved by the medical ethics committee of Fudan University Cancer Hospital. Written informed consents were waived due to the retrospective nature of our study and we confirmed that the data was anonymized and maintained with confidentiality. The flowchart of the study is shown in Figure 1.
 |
Figure 1 Flow chart of patient recruitment in this study. |
Inclusion criteria were as follows: (1) patients had primary invasive HER2-positive breast cancers (≥T2, and/or positive nodal status) confirmed by biopsy; (2) patients received complete standard treatment (4~6 cycles of PCH) with no prior treatment before NAT; (3) pretreatment MRI data obtained using the 1.5-T MR scanner (Aurora Dedicated Breast MRI System; USA; Aurora); (4) the course of NAT need to be monitored with MRI; (5) underwent modified radical mastectomy or breast conservation within one month after completion of NAT; (6) available clinicopathological data (age, menopausal status, tumor size, Ki-67 index, MRI-reported T stage, N stage, surgery type, FGT, BPE, numbers of lesion, enhancement pattern).
Exclusion criteria were as follows: (1) Metastasis elsewhere in the body; (2) not complete standard treatment; (3) canceled surgery or not undergo surgery at our hospital; (4) poor MR image quality resulting from poor contrast injection or motion artifacts; (5) Occult breast cancer.
MRI Protocol
For all patients, axial breast CE-MR were performed before NAT on a 1.5-T MR scan (Aurora Dedicated Breast MRI System; USA; Aurora) using a breast unique transmit/receive coil in the prone position. The CE-MRI protocol included: (a) T1-weighted fat-saturated precontrast sequence, (b) multiple (3 phases) T1-weighted fat-saturated postcontrast sequences that were acquired after intravenous administration of a 0.1 mmol/kg dose of Gd-DTPA (Magnevist; Bayer-Schering Pharma, Berlin, Germany). Scan parameters were TR/TE=29.0/4.8ms; FOV=36 cm×36 cm; matrix=360×360; 108 slices; slice thickness=1.5mm. The scanning time of each phase was about 3 minutes, and the number of single-phase scanning layers was 108.
Imaging Analysis and Pathological Evaluation
All images were retrospectively evaluated by two experienced radiologists (QX and QL) according to the 5th edition of the American College of Radiology Breast Imaging Reporting and Data System (BI-RADS) in 2013. Mass is defined as a three-dimensional, space-occupying structure that protrude outward in contour. Non-mass enhancement (NME) is used to describe an area that is neither a mass nor a focus. NME may have areas or spots of normal fibroglandular tissue or fat between the abnormal enhancing components. According to the type of tumor on CE-MRI, the patients were grouped into mass and non-mass group. According the number of tumors, the patients were grouped into uni-focal and unilateral multi-focal group.
Treatment Regimen and Criteria for pCR
All patients received 4~6 cycles of PCH regimen (paclitaxel + carboplatin + trastuzumab; paclitaxel: 80mg/m2, carboplatin: AUC=2, trastuzumab was initially measured at 4mg/kg and maintained at 2mg/kg; Once a week, 3 times is a cycle of treatment) and then underwent radical mastectomy or breast conservation.
Pathological response was determined by pathologist. pCR was defined as the absence of residual invasive tumor cells in the breast and axillary lymph nodes (ypT0/is + ypN0), as determined microscopically, in surgical specimens.
Tumor Masking and Inter-Observer Reproducibility Evaluation
When drawing the outline of the tumor, we obey the following principles. First, regardless of whether the lesion presented mass or non-mass enhancement, tumor regions of interest (ROI) were delineated along the contour of the tumor on the 1st postcontrast CE-MRI scan (the peak enhanced phase of the multiphases CE-MRI where the border of lesion was the most obvious). Second, the ROIs of breast cancer were drawn manually on each slice including the necrosis and blood areas to get the 3D segmentation of the whole tumor. Last, if the tumor is unilateral multifocal lesion, the largest one will be selected as the object. And then the 3D segmented contouring based on the 1st postcontrast images were propagated to pre-contrast and the other two post-contrast phases of CE images. The segmentation of whole tumor was performed on the 3D-Slicer software (version 4.10.2, https://www.slicer.org).
Inter-observer reproducibility of ROI detection and radiomic feature extraction were measured using CE1 of 30 randomly chosen samples. Two experienced radiologists (QL and QX) performed the ROI delineation independently, and then radiomic features extracted from the above two ROIs were compared to get the inter-class correlation coefficient. An ICC score greater than 0.8 was interpreted to reach satisfactory agreement. ICC for radiomic features was defined as high (ICC≥0.8), medium (0.8>ICC≥0.5), or low (ICC<0.5).
Feature Extraction
Radiomic shape and texture features were calculated with PyRadiomics package (https://pyradiomics.readthedocs.io/en/latest/index.html) in the Python software (v. 3.7, Python Software Foundation, https://www.python.org/). In total, three groups of imaging features (Supplementary Material 1) for each patient were extracted from normalized pretreatment CE-MRI scans: Group 1(CEshape) consisted of 14 shape-based features derived from the 1st postcontrast CE images; Group 2(CEtexture) comprised 93 texture features based on each phase CE-MRI independently, yielding 372 features; Group 3(CEsequential) comprised of 930 sequential features, which were calculated from 93 texture features to characterize the textural changes over time points. In group 3, ten new sequential features from each texture feature were calculated (Algorithms for the ten new sequential features were shown in Supplementary Material 2). The first six features, including mean, variance, kurtosis, skewness, energy and entropy, were extracted from each individual subject. The other four features, including Kendall-tau-b, conservation, stability, and dispersion, were calculated from the interactive information between the current subject and the remainder of the subjects. All these features have been used in previous radiomic studies.26,27 The source image of radiomic features is shown in Figure 2.
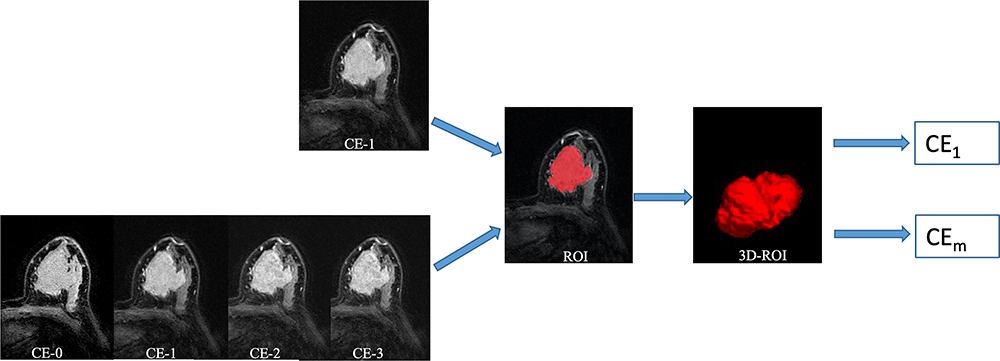 |
Figure 2 The source images of radiomics features. |
Feature Selection Method and Machine Learning-Based Classification Construction
To avoid severe multicollinearity or overfitting, a forward stepwise regression was used to select potential important features (stepwise fit function in Matlab 2016, The MathWorks, Natick, MA). And then, the number of selected features was determined by AIC (Akaike information criterion). The penter was set as 0.05 while the premove was set as 0.10.
With useful features, machine learning models based on CE1 and CEm were constructed respectively. Twenty-three classifiers were constructed for discriminating pCR and non-pCR: including three decision tree classifiers (fine tree, medium tree, and coarse tree), two discriminant analysis classifiers (Linear Discriminant Analysis LDA and quadratic discriminant analysis QDA), one Logistic regression, six SVM classifiers (linear, quadratic, cubic, fine gaussian, medium gaussian, and coarse gaussian), six k nearest neighbor (KNN) classifiers (fine KNN, medium KNN, coarse KNN, cosine KNN, cubic KNN and weighted KNN), and five ensemble learning classifiers (subspace discriminant, subspace KNN, Boosted Trees, Bagged Trees and the RUS Boost trees). All the models were conducted using the 5-fold cross validation, whereby 80% of cases as training set while 20% as testing set. The procedure was repeated for ten rounds to average the estimates of performance.
The feature selection and machine learning classification were achieved using the Statistics and Machine Learning Toolbox in MatLab (v. R2018a; The MathWorks, Natick, MA).
Performance of Optical Model in Different Types of Carcinoma
The performances of machine learning-based classifiers were assessed by their accuracy, sensitivity, specificity and AUC. The optical machine learning classifier was used for discriminating pCR vs non-pCR in mass and non-mass groups, uni-focal and unilateral multi-focal groups respectively.
Radiomics Signature Building
The Rad-score of each patient was calculated via a linear combination of potential features, weighted by their respective coefficients. The formula of Rad-score were shown in Supplementary Materials 3 and 4.
Statistical Analysis
Descriptive statistics were summarized as mean ± standard deviation (SD). Comparisons between pCR and non-pCR groups were made using the Student’s t-test or Mann–Whitney U-test for quantitative variables and the Χ2 test or Fisher’s test for qualitative variables. All statistical analysis and statistical drawing were performed by MATLAB 2018a software and Python 3.6. p less than 0.05 was considered statistically significant.
Results
Clinical Characteristics
A total of 127 lesions from 127 women (mean age, 51.2 years; age range, 24–84 years) were ultimately evaluated. Fifty-four of 127 patients (42.52%) achieved pCR in the study. Among the 127 cases of HER2 positive breast cancer, 89 cases presented mass enhancement and 38 cases presented NME, while 96 patients were with uni-focal cancers and 31 patients had unilateral multi-focal lesions. The differences in clinical features and MRI morphology between pCR and non-pCR groups were not statistically significant (shown in Table 1).
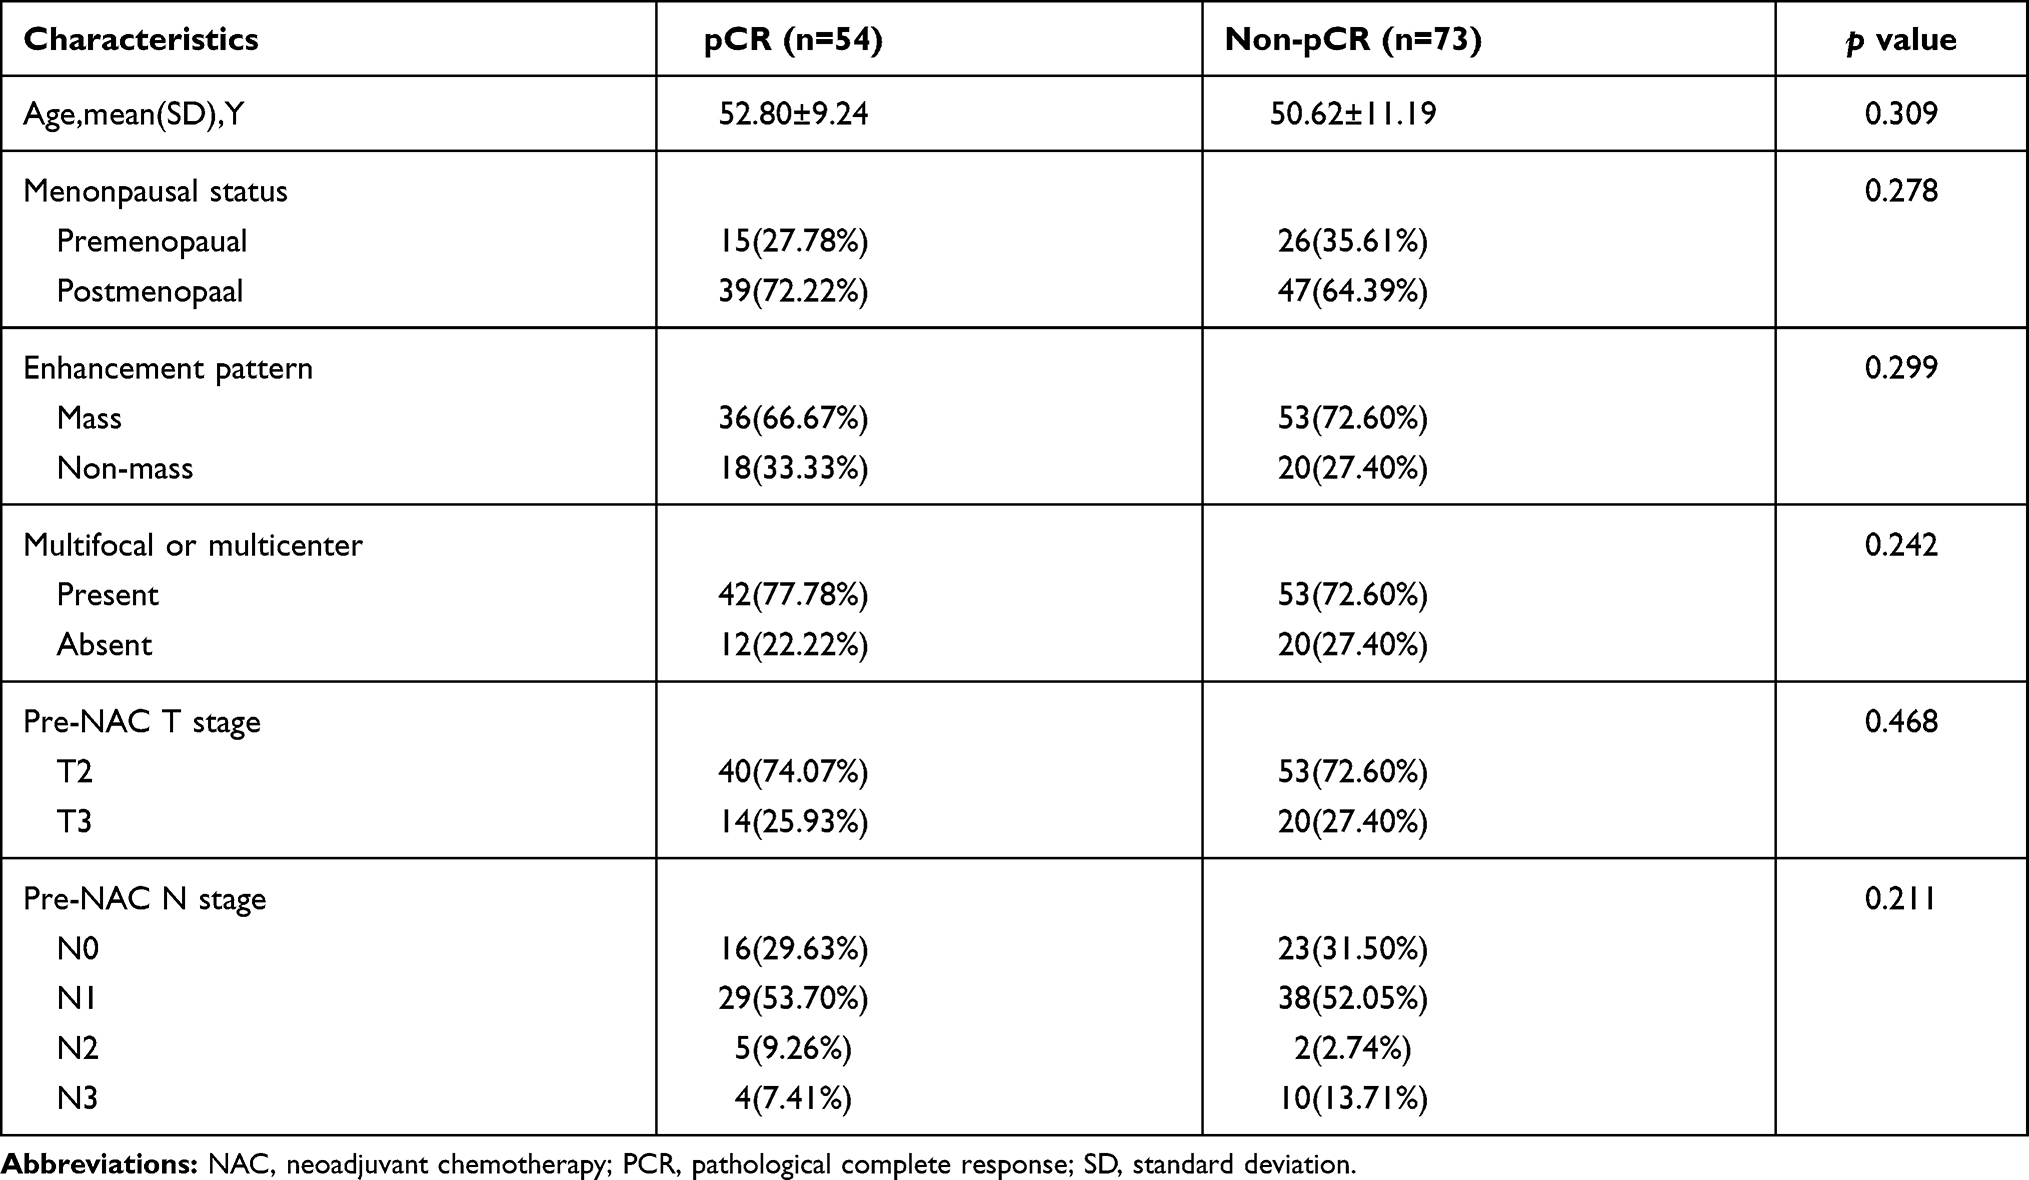 |
Table 1 Clinical and Morphology Characteristics Between pCR and Non-pCR Group |
ICC
The ICC for radiomic features ranged from 0.95 to 0.97 between the two radiologists QL and QX.
Selected Features
For the CE1 and CEm, 6 features from CEtexture and 6 features from CEsequential were selected for the final machine learning models respectively. The potential features were shown in Supplementary Materials 5 and 6.
Performance of the Machine Learning-Based Classification
With the selected six features from CE1, the accuracy of 23 classifiers ranged from 57.5% to 68.5% (Table 2). The optimal model was Logistic regression yielding the highest accuracy of 68.5%, with an AUC of 0.69.
 |
Table 2 The Accuracy, Sensitivity, Specificity and AUC of Machine Learning Classification Based on Optimal Six Features from CE1 |
With the selected six features from CEm, the accuracy of 23 classifiers ranged from 40.9% to 79.5% (Table 3). The best accuracy was achieved by linear support vector machine (SVM) in conjunction with 6 sequential features based on CE time points, with an AUC of 0.84.
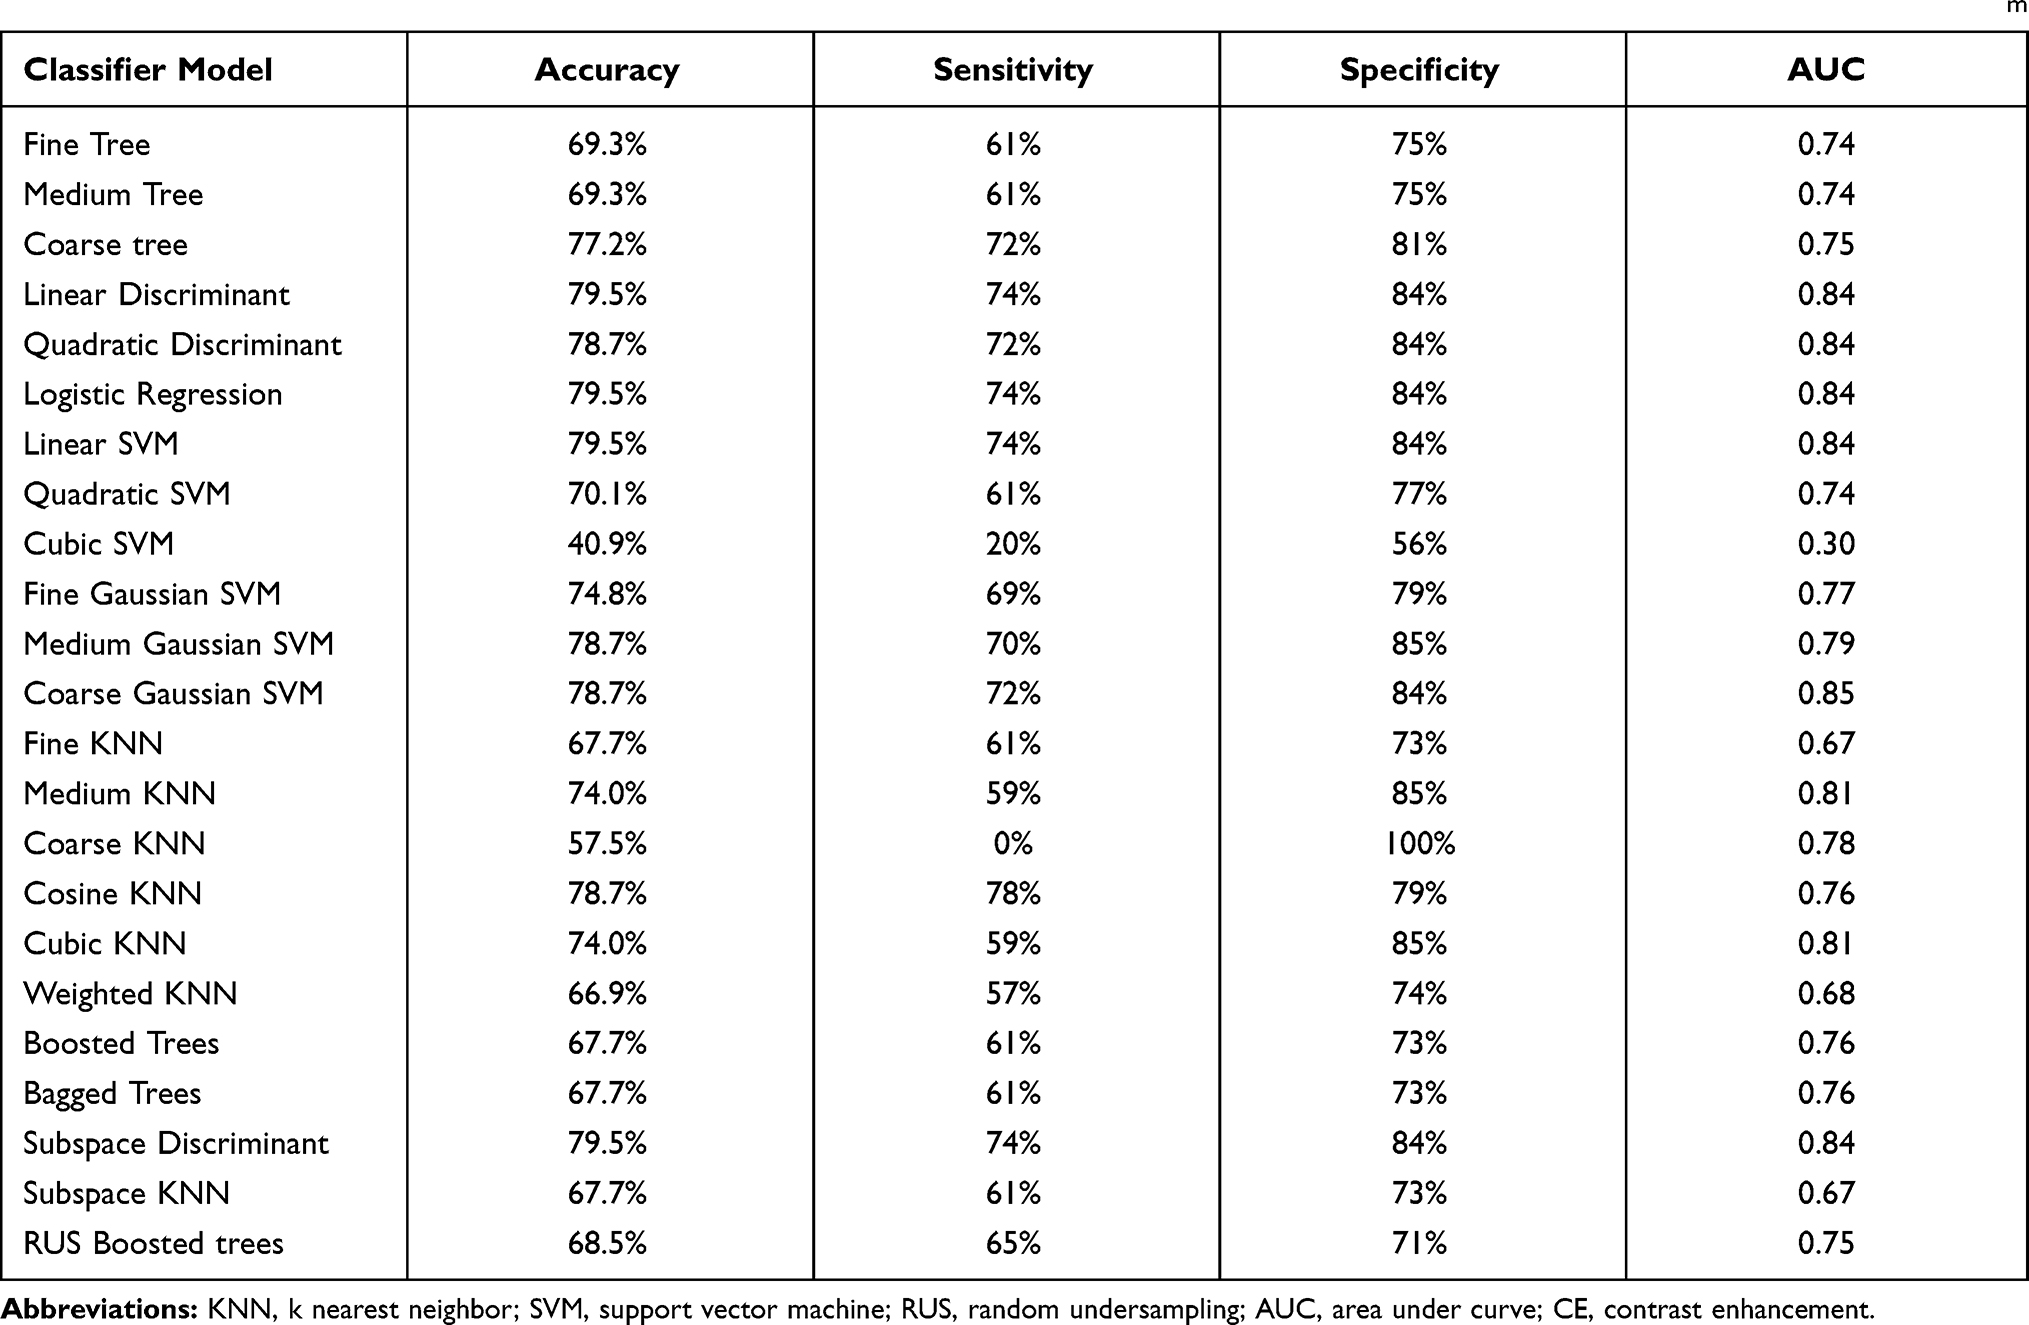 |
Table 3 The Accuracy, Sensitivity, Specificity and AUC of Machine Learning Classification Based on Optimal Six Features from CEm |
The linear SVM based on CEm showed a higher performance, with an AUC of 0.84 (Figure 3) than Logistic regression using CE1 (AUC=0.69, Figure 4). (De-long test: p<0.05)
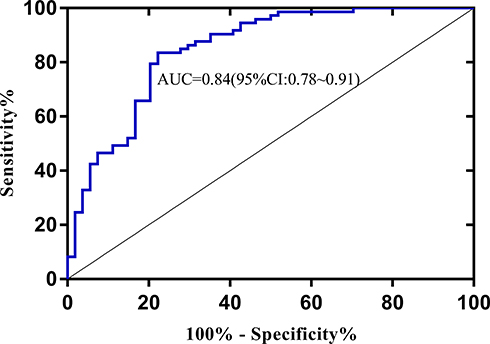 |
Figure 3 ROC of linear SVM predicting pCR and non-pCR. |
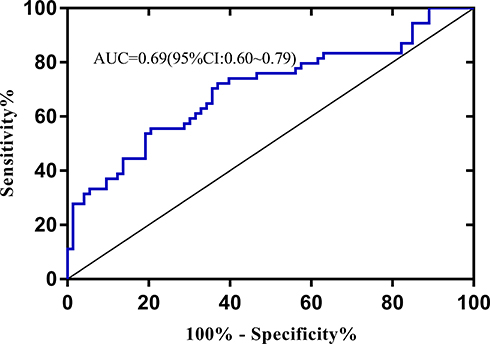 |
Figure 4 ROC of logistic regression predicting pCR and non-pCR. |
In mass and non-mass enhancement groups, the accuracy of linear SVM achieved 84% and 76%. Whereas in uni-focal and unilateral multi-focal cases, the accuracy of linear SVM achieved 79% and 75%.
Rad-Score Building
The Rad-score calculated from the two optical models were significantly higher in the pCR group than the non-pCR group (Figure 5). Besides, the linear SVM based on multiphase CE-MRI outperformed the Logistic Regression using the single 1st post-contrast CE-MRI sequence according to the boxplot.
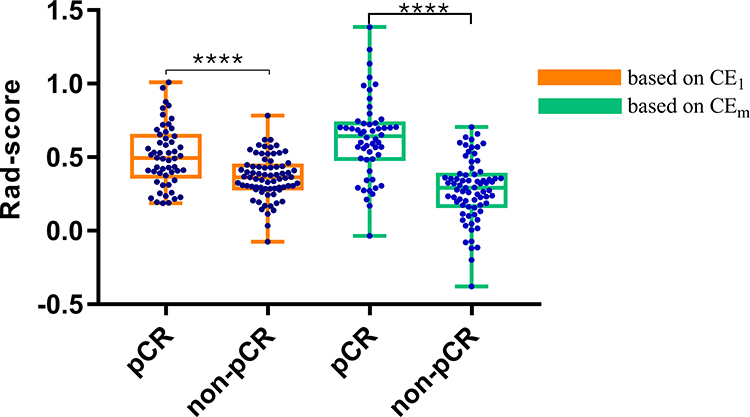 |
Figure 5 Rad-score box plot for pCR classification based on the CE1 and CEm. Note: ****Indicates p value (<0.0001). |
Discussion
In the study, we investigated the ability of machine learning models based on pretreatment CE-MRI to predict pCR to NAT in patients with HER2 positive invasive breast cancer. Sequential texture features changing over time points of pretreatment CE-MRI were proposed with better performance compared with traditional texture features based on the single 1st phase of postcontrast T1-weighted imaging at CE-MRI imaging. The outperformance of sequential texture features indicated that combining multiphases of pretreatment CE-MRI may be helpful for the early prediction of pCR to NAT in HER2 positive invasive breast cancer.
In order to predict response to chemotherapy in patients with breast cancer, previous studies13–15 utilize texture measures extracted from CE1. Herein, our study made full use of all phases of CE-MRI images and compared the prediction ability of machine learning models based on CE1 and CEm. For the 1st phase, the 6 radiomic features selected for the final models comprised 2 features from first order, 1 from GLCM, 2 from GLSZM and 1 from GLRLM. The potential model based on CE1 yielded the highest accuracy of 68.5% with an AUC of 0.69, which was similar to the results of recent reports in HER2 positive subgroups.13–15 For multiphases, all the selected 6 radiomic features were obtained from CEsequential, comprising 2 features calculated from kurtosis, 2 from entropy, 1 from dispersion and 1 from stability. Among them, kurtosis and entropy had been identified as biomarkers of response to neoadjuvant chemotherapy in previous reviews.13,28 The optimal model was able to perform robustly. Specifically, the AUC of the final model was 0.84, which was significantly higher than that of previous reports12,25 based on the 1st phase. The result revealed that sequential texture features may captured more detailed information of tumor complexity and heterogeneity that indistinguishable to the 1st phase. Besides, the sequential texture features changing over time points had been identified to be useful in the subtype classification of breast cancer26 and prediction of DFS (disease free survival) in HER2 positive breast cancer.27 Specially, the optimal model linear SVM performed well in predicting pCR to NAT in HER2 positive patients stratified by breast cancer enhancement pattern and number. In mass and non-mass enhancement groups, the accuracy for discriminating pCR achieved 76% and 84%. Whereas in uni-focal and unilateral multi-focal cases, the accuracies were 79% and 75% respectively. While in many studies,12,14,24,25 non-mass enhancement and unilateral multifocal cases were excluded, our model performed well without regarding to tumor morphology and number. Several studies suggested that non-mass enhancement and multifocal or multicentric29–31 tumors were more frequently present in HER2-positive subtype. For patients with non-mass enhancement and multifocal breast carcinoma, neoadjuvant therapy was more recommended to downstage and improve prognosis.32,33 In our study, the rates of non-mass enhancement and multifocal lesions were 28.35% (38/127) and 25.20% (32/127), respectively. Therefore, it is more scientific to include non-mass enhancement and multifocal cases in the study of predicting the response to NAT in HER2 positive breast cancer.
In our research, all patients underwent MRI examination with the same scanner and treated with the consistent regimens of 4–6 cycles of PCH. The linear support vector machine (SVM) was the optimal model with an AUC of 0.84. The prediction performance was greater than a recent study12 on HER2 positive subgroup in which the corresponding AUCs was 0.70. A possible explanation is that the treatment regions for training set and validation are not uniform. Another study25 combining the HER2 positive and TN breast cancers as one subgroup concluded that the AUCs of model of predicting pCR to NAC were less than 0.80 not only in the training sets but also in the validation sets. Nevertheless, analysis suggested that there was a difference in pCR rates after NAC for HER2-positive and triple-negative breast cancers. To the end, a study14 concluded that a model using intratumor and peritumor radiomics was able to predict pCR with an AUC of 0.80 in HER2 positive breast cancers which was similar to our result. Previous studies34–36 have shown that radiological characteristics may be affected by differences in MRI magnetic intensity. So, the same scanner and uniform treatment regions can enhance robustness of the omics and were beneficial to the establishment of a better prediction model.
Rad-score were calculated for each patient with equation of the optical model. Our results indicated that the Rad-score in the pCR group was significantly higher compared to the non-pCR group. This was successfully confirmed in treatment evaluation in patients with locally advanced rectal cancer.37
The work presented in our study had several limitations. First, this was a retrospective study and all patients were recruited from a single center. Second, we compared the performance of machine learning models based on radiomic of pretreatment the 1st postcontrast sequence and multiphases CE-MRI imaging. However, the study lacked an independent validation cohort, external validation of our results pending adequate patient follow-up will be entailed in the future work.
Conclusion
Multiphases CE-MRI imaging may offer more heterogeneity information in the tumor and provide a non-invasive approach for early prediction of pCR to NAC in patients with HER2 positive invasive breast cancer.
Abbreviations
AUC, area under the receiver operating characteristic curve; CE, contrast enhanced; NAT, neoadjuvant therapy; GLCM, gray-level co-occurrence matrix; GLRLM, gray-level run length matrix; GLSZM, gray-level size zone matrix; GLDM, gray level dependence matrix; ICC, intraclass correlation coefficient; ROC, receiver operating characteristic curve; ROI, region of interest; SVM, support vector machine; PCR, pathological complete response; RUS, random under sampling.
Data Sharing Statement
All data generated or analysed during this study are included in this published article and its supplementary information files.
Ethics Approval and Consent to Participate
Written informed consents were waived due to the study design. The medical ethics committee of Fudan University cancer hospital approved this retrospective study and confirmed that the data was anonymized and maintained with confidentiality.
Acknowledgments
This study has received funding by Clinical Research Plan of SHDC(SHDC2020CR2008A). .
Author Contributions
All authors contributed to data analysis, drafting or revising the article, have agreed on the journal to which the article will be submitted, gave final approval of the version to be published, and agree to be accountable for all aspects of the work.
Funding
This study has received funding by Clinical Research Plan of SHDC(SHDC2020CR2008A).
Disclosure
The authors declare that they have no competing interests.
References
1. Agner SC, Rosen MA, Englander S, et al. Computerized image analysis for identifying triple-negative breast cancers and differentiating them from other molecular subtypes of breast cancer on dynamic contrast-enhanced MR images: a feasibility study. Radiology. 2014;272(1):91–99. doi:10.1148/radiol.14121031
2. Lee HJ, Park IA, Park SY, et al. Two histopathologically different diseases: hormone receptor-positive and hormone receptor-negative tumors in HER2-positive breast cancer. Breast Cancer Res Treat. 2014;145(3):615–623. doi:10.1007/s10549-014-2983-x
3. Steenbruggen TG, van Ramshorst MS, Kok M, Linn SC, Smorenburg CH, Sonke GS. Neoadjuvant therapy for breast cancer: established concepts and emerging strategies. Drugs. 2017;77(12):1313–1336.
4. von Minckwitz G, Untch M, Blohmer JU, et al. Definition and impact of pathologic complete response on prognosis after neoadjuvant chemotherapy in various intrinsic breast cancer subtypes. J Clin Oncol. 2012;30(15):1796–1804. doi:10.1200/JCO.2011.38.8595
5. Cortazar P, Zhang L, Untch M, et al. Pathological complete response and long-term clinical benefit in breast cancer: the CTNeoBC pooled analysis. Lancet. 2014;384(9938):164–172. doi:10.1016/S0140-6736(13)62422-8
6. Spring L, Greenup R, Niemierko A, et al. Pathologic complete response after neoadjuvant chemotherapy and long-term outcomes among young women with breast cancer. J Natl Compr Canc Netw. 2017;15(10):1216–1223. doi:10.6004/jnccn.2017.0158
7. Slamon D, Eiermann W, Robert N, et al. Adjuvant trastuzumab in HER2-positive breast cancer. N Engl J Med. 2011;365(14):1273–1283. doi:10.1056/NEJMoa0910383
8. Perez EA, Romond EH, Suman VJ, et al. Trastuzumab plus adjuvant chemotherapy for human epidermal growth factor receptor 2-positive breast cancer: planned joint analysis of overall survival from NSABP B-31 and NCCTG N9831. J Clin Oncol. 2014;32(33):3744–3752. doi:10.1200/JCO.2014.55.5730
9. Asselain B, Barlow W, Bartlett J. Long-term outcomes for neoadjuvant versus adjuvant chemotherapy in early breast cancer: meta-analysis of individual patient data from ten randomised trials. Lancet Oncol. 2018;19(1):27–39. doi:10.1016/S1470-2045(17)30777-5
10. Yeh E, Slanetz P, Kopans DB, et al. Prospective comparison of mammography, sonography, and MRI in patients undergoing neoadjuvant chemotherapy for palpable breast cancer. AJR Am J Roentgenol. 2005;184(3):868–877. doi:10.2214/ajr.184.3.01840868
11. Rosen EL, Blackwell KL, Baker JA, et al. Accuracy of MRI in the detection of residual breast cancer after neoadjuvant chemotherapy. AJR Am J Roentgenol. 2003;181(5):1275–1282. doi:10.2214/ajr.181.5.1811275
12. Liu Z, Li Z, Qu J, et al. Radiomics of multiparametric MRI for pretreatment prediction of pathologic complete response to neoadjuvant chemotherapy in breast cancer: a multicenter study. Clin Cancer Res. 2019;25(12):3538–3547. doi:10.1158/1078-0432.CCR-18-3190
13. Parikh J, Selmi M, Charles-Edwards G, et al. Changes in primary breast cancer heterogeneity may augment midtreatment MR imaging assessment of response to neoadjuvant chemotherapy. Radiology. 2014;272(1):100–112. doi:10.1148/radiol.14130569
14. Braman NM, Etesami M, Prasanna P, et al. Intratumoral and peritumoral radiomics for the pretreatment prediction of pathological complete response to neoadjuvant chemotherapy based on breast DCE-MRI. Breast Cancer Res. 2017;19(1):57. doi:10.1186/s13058-017-0846-1
15. Teruel JR, Heldahl MG, Goa PE, et al. Dynamic contrast-enhanced MRI texture analysis for pretreatment prediction of clinical and pathological response to neoadjuvant chemotherapy in patients with locally advanced breast cancer. NMR Biomed. 2014;27(8):887–896. doi:10.1002/nbm.3132
16. Thibault G, Tudorica A, Afzal A, et al. DCE-MRI texture features for early prediction of breast cancer therapy response. Tomography. 2017;3(1):23–32. doi:10.18383/j.tom.2016.00241
17. Golden DI, Lipson JA, Telli ML, Ford JM, Rubin DL. Dynamic contrast-enhanced MRI-based biomarkers of therapeutic response in triple-negative breast cancer. J Am Med Inform Assoc. 2013;20(6):1059–1066. doi:10.1136/amiajnl-2012-001460
18. Michoux N, Van den Broeck S, Lacoste L, et al. Texture analysis on MR images helps predicting non-response to NAC in breast cancer. BMC Cancer. 2015;15:574. doi:10.1186/s12885-015-1563-8
19. Nilsen L, Fangberget A, Geier O, Olsen DR, Seierstad T. Diffusion-weighted magnetic resonance imaging for pretreatment prediction and monitoring of treatment response of patients with locally advanced breast cancer undergoing neoadjuvant chemotherapy. Acta Oncol. 2010;49(3):354–360. doi:10.3109/02841861003610184
20. Chamming’s F, Ueno Y, Ferré R, et al. Features from computerized texture analysis of breast cancers at pretreatment MR imaging are associated with response to neoadjuvant chemotherapy. Radiology. 2018;286(2):412–420. doi:10.1148/radiol.2017170143
21. Fan M, Wu G, Cheng H, Zhang J, Shao G, Li L. Radiomic analysis of DCE-MRI for prediction of response to neoadjuvant chemotherapy in breast cancer patients. Eur J Radiol. 2017;94:140–147. doi:10.1016/j.ejrad.2017.06.019
22. Minarikova L, Bogner W, Pinker K, et al. Investigating the prediction value of multiparametric magnetic resonance imaging at 3 T in response to neoadjuvant chemotherapy in breast cancer. Eur Radiol. 2017;27(5):1901–1911. doi:10.1007/s00330-016-4565-2
23. Liu Z, Wang S, Dong D, et al. The applications of radiomics in precision diagnosis and treatment of oncology: opportunities and challenges. Theranostics. 2019;9(5):1303–1322. doi:10.7150/thno.30309
24. Gillies RJ, Kinahan PE, Hricak H. Radiomics: images are more than pictures, they are data. Radiology. 2016;278(2):563–577. doi:10.1148/radiol.2015151169
25. Cain EH, Saha A, Harowicz MR, Marks JR, Marcom PK, Mazurowski MA. Multivariate machine learning models for prediction of pathologic response to neoadjuvant therapy in breast cancer using MRI features: a study using an independent validation set. Breast Cancer Res Treat. 2019;173(2):455–463. doi:10.1007/s10549-018-4990-9
26. Xie T, Wang Z, Zhao Q, et al. Machine learning-based analysis of MR multiparametric radiomics for the subtype classification of breast cancer. Front Oncol. 2019;9:505. doi:10.3389/fonc.2019.00505
27. Li Q, Xiao Q, Li J, et al. MRI-based radiomic signature as a prognostic biomarker for HER2-positive invasive breast cancer treated with NAC. Cancer Manag Res. 2020;12:10603–10613. doi:10.2147/CMAR.S271876
28. De Cecco CN, Ganeshan B, Ciolina M, et al. Texture analysis as imaging biomarker of tumoral response to neoadjuvant chemoradiotherapy in rectal cancer patients studied with 3-T magnetic resonance. Invest Radiol. 2015;50(4):239–245. doi:10.1097/RLI.0000000000000116
29. Morrow M. Personalizing extent of breast cancer surgery according to molecular subtypes. Breast. 2013;22(Suppl 2):S106–109. doi:10.1016/j.breast.2013.07.020
30. Pekar G, Hofmeyer S, Tabár L, et al. Multifocal breast cancer documented in large-format histology sections: long-term follow-up results by molecular phenotypes. Cancer. 2013;119(6):1132–1139. doi:10.1002/cncr.27877
31. Yang WT, Zhu XZ. [The introduction of 2012 WHO classification of tumours of the breast]. Zhonghua Bing Li Xue Za Zhi. 2013;42(2):78–80. Chinese. doi:10.3760/cma.j.issn.0529-5807.2013.02.002
32. Koh J, Park AY, Ko KH, Jung HK. Can enhancement types on preoperative MRI reflect prognostic factors and surgical outcomes in invasive breast cancer? Eur Radiol. 2019;29(12):7000–7008. doi:10.1007/s00330-019-06236-2
33. Masuda N, Lee SJ, Ohtani S, et al. Adjuvant capecitabine for breast cancer after preoperative chemotherapy. N Engl J Med. 2017;376(22):2147–2159. doi:10.1056/NEJMoa1612645
34. Ford J, Dogan N, Young L, Yang F. Quantitative radiomics: impact of pulse sequence parameter selection on MRI-based textural features of the brain. Contrast Media Mol Imaging. 2018;2018:1729071. doi:10.1155/2018/1729071
35. Molina D, Pérez-Beteta J, Martínez-González A, et al. Lack of robustness of textural measures obtained from 3D brain tumor MRIs impose a need for standardization. PLoS One. 2017;12(6):e0178843. doi:10.1371/journal.pone.0178843
36. Depeursinge A, Foncubierta-Rodriguez A, Van De Ville D, Müller H. Three-dimensional solid texture analysis in biomedical imaging: review and opportunities. Med Image Anal. 2014;18(1):176–196. doi:10.1016/j.media.2013.10.005
37. Cui Y, Yang X, Shi Z, et al. Radiomics analysis of multiparametric MRI for prediction of pathological complete response to neoadjuvant chemoradiotherapy in locally advanced rectal cancer. Eur Radiol. 2019;29(3):1211–1220. doi:10.1007/s00330-018-5683-9
 © 2021 The Author(s). This work is published and licensed by Dove Medical Press Limited. The
full terms of this license are available at https://www.dovepress.com/terms
and incorporate the Creative Commons Attribution
- Non Commercial (unported, 3.0) License.
By accessing the work you hereby accept the Terms. Non-commercial uses of the work are permitted
without any further permission from Dove Medical Press Limited, provided the work is properly
attributed. For permission for commercial use of this work, please see paragraphs 4.2 and 5 of our Terms.
© 2021 The Author(s). This work is published and licensed by Dove Medical Press Limited. The
full terms of this license are available at https://www.dovepress.com/terms
and incorporate the Creative Commons Attribution
- Non Commercial (unported, 3.0) License.
By accessing the work you hereby accept the Terms. Non-commercial uses of the work are permitted
without any further permission from Dove Medical Press Limited, provided the work is properly
attributed. For permission for commercial use of this work, please see paragraphs 4.2 and 5 of our Terms.