Back to Journals » Infection and Drug Resistance » Volume 16
Utility of Machine Learning and Radiomics Based on Cavity for Predicting the Therapeutic Response of MDR-TB
Authors Lv X, Li Y, Cai B, He W, Wang R, Chen M, Pan J, Hou D
Received 18 August 2023
Accepted for publication 17 October 2023
Published 28 October 2023 Volume 2023:16 Pages 6893—6904
DOI https://doi.org/10.2147/IDR.S435984
Checked for plagiarism Yes
Review by Single anonymous peer review
Peer reviewer comments 2
Editor who approved publication: Professor Suresh Antony
Xinna Lv,1,* Ye Li,1,* Botao Cai,2 Wei He,1 Ren Wang,1 Minghui Chen,1 Junhua Pan,1 Dailun Hou1
1Department of Radiology, Beijing Chest Hospital, Capital Medical University, Beijing, 101149, People’s Republic of China; 2Department of Radiology, Harbin Chest Hospital, Harbin, 150000, People’s Republic of China
*These authors contributed equally to this work
Correspondence: Junhua Pan; Dailun Hou, Department of Radiology, Beijing Chest Hospital, Capital Medical University, Beijing, 101149, People’s Republic of China, Tel +8613901097074 ; +8618001286699, Email [email protected]; [email protected]
Background: Sputum culture result at the sixth month is essential for predicting therapeutic response to longer multidrug-resistant tuberculosis (MDR-TB) regimens. This study aimed to construct a predictive model using cavity-based radiomics to predict sputum status at the sixth month for MDR-TB patients treated with longer regimens.
Methods: This retrospective study recruited 315 MDR-TB patients treated with longer regimens from two centers (250 patients from center 1 and 65 patients from center 2), who were divided into persistently positive and conversion to negative sputum culture groups according to sputum results. Radiomics features were extracted based on the cavity, and a radiomics model was selected and established using a random forest classifier. The clinical characteristics and primary CT signs with significant differences were integrated to build a clinical model. A combined model was generated using the radiomics and clinical model. ROC curves, F1-score and DCA curves were used to assess the predictive performance of the models.
Results: Twenty-eight radiomics features were selected to build a radiomics model for predicting the sputum status. The radiomics model achieved good performance, with AUCs of 0.892 and 0.839 in the training and testing cohort, respectively, which was similar to the performance of the combined model (0.913 and 0.815) and much higher than that of the clinical model (0.688 and 0.525) in the two cohorts.
Conclusion: The cavity-based radiomics model has the potential to predict sputum culture status for MDR-TB patients receiving longer regimens, which could guide follow-up treatment effectively.
Keywords: machine learning, radiomics, tuberculosis, drug-resistance, therapeutic response
Introduction
Tuberculosis (TB) is a major cause of morbidity and mortality worldwide and the leading cause of death due to infectious diseases until the coronavirus pandemic.1 According to the 2022 Global Tuberculosis Report of the World Health Organization (WHO), the annual number of deaths from TB has increased in 2020 and 2021, reversing the trend of slow decline between 2005 and 2019.2 Drug-resistant tuberculosis is a major threat to global control, particularly in strains with multidrug resistance.3 Multidrug-resistant tuberculosis (MDR-TB) is defined as a strain that is resistant to rifampicin and isoniazid.4 Almost 3.7% of new TB cases and 20% of retreatment cases have MDR-TB, which is unprecedented.4 Therefore, it is critical to develop an individualized treatment regimen based on a patient’s response to therapy.
Longer MDR-TB regimens have shown good clinical efficacy and safety. Longer MDR-TB regimens refer to a total treatment duration of 18–20 months consisted of at least four effective anti-TB drugs in the initial phase, and at least three TB agents are used for the rest of the treatment after bedaquiline is stopped.3 The 6-month sputum culture conversion result is an important index for assessing outcomes of MDR-TB treatment and thus regulates the treatment strategy.5 Evidence on the safety and effectiveness of some antituberculosis agents beyond 6 months, such as delamanid, is insufficient for review.3,6 Prolonging the use of these agents should be carefully considered. Therefore, it would be of great importance to predict sputum status after 6 months of longer MDR-TB treatment, which is beneficial for retesting drug resistance, adjusting therapeutic strategies, and establishing individualized treatment.
Chest computed tomography (CT) is a conventional method used to monitor treatment response and toxicity in patients receiving long-term MDR-TB treatment regimens.3,7,8 MDR-TB has various imaging features, including common radiological findings of cavitation, tree-in-bud (TIB), and consolidation.9 Cavitation is a gas-filled space within a pulmonary consolidation, mass, or nodule formed after the necrotic portion of the lesion is expelled through the bronchial tree.10 Cavitation is an important sign of TB, and evidence has demonstrated that thick-walled cavities are the most promising sign for differentiating MDR-TB.8,9 More importantly, cavity variations can measure the response to TB treatment.11 Radiomics is an approach that extracts multiple types of data from radiological images and converts these images into high-dimensional quantitative information that reflects the pathophysiology of lesions.12 A recent report has shown that CT radiomics features have the potential to identify MDR-TB in cavitary TB patients.10 However, no study has predicted the therapeutic effect at six months in patients with a longer MDR-TB regimen using CT radiomics based on cavitary signs.
The purpose of this study was to establish a more targeted radiomics model based on cavities to predict the sputum result at the sixth month for MDR-TB patients treated with longer MDR-TB regimens, which is helpful in formulating and regulating individualized therapy strategies.
Materials and Methods
Participants
This retrospective study was approved by the Ethics Committee of the local hospital. Informed consent from patients was waived by the committee, considering the retrospective nature of the study and the utilization of anonymized data, while ensuring patient privacy and confidentiality.
The patients recruited in our study were based on the following inclusion criteria: (a) confirmation of TB by sputum culture, microscopy, or polymerase chain reaction test; (b) determination of MDR-TB by drug-resistant testing (DST); (c) receiving longer MDR-TB regimens after the diagnosis of MDR-TB; (d) having the result of sputum culture at the sixth month after starting treatment; (e) performance of CT scans within one month before treatment; and (f) clear cavity on CT images. The exclusion criteria were as follows: (a) irregular or interrupted treatment; (b) image artifacts or incomplete clinical materials; (c) HIV seropositivity or diabetes; and (d) a history of pulmonary surgery, trauma, or other diseases.
According to WHO guidelines,3 longer MDR-TB regimens refer to a total treatment duration of 18–20 months consisted of at least four effective anti-TB drugs in the initial phase, and at least three TB agents are used for the rest of the treatment after bedaquiline is stopped. According to the 6-month sputum culture conversion result, these patients were divided into persistently positive and conversion to negative groups. The persistently positive group was defined as the sputum culture results remained positive 6 months after treatment with a longer MDR-TB regimens, otherwise it was defined as the conversion to negative groups.
Finally, 315 MDR-TB patients were reviewed for selection. The training cohort recruited in Hospital 1 from June 2013 to December 2022 was composed of 250 MDR-TB patients, which included 72 patients with persistently positive sputum cultures and 178 patients whose sputum cultures had converted to negative sputum cultures. In addition, from December 2020 to December 2022 in Hospital 2, we recruited 65 MDR-TB patients as the testing cohort that comprised 30 patients with persistently positive sputum cultures and 35 patients with conversion to negative sputum cultures. The patient selection process is depicted in detailedly in Figure 1.
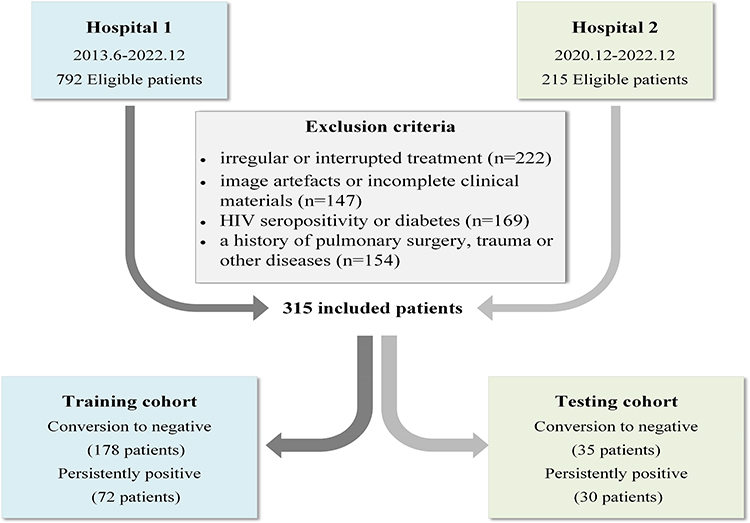 |
Figure 1 The flowchart of patient selection. |
CT Image Acquisition
All pretreatment chest CT images were acquired using a Light Speed VCT, Revolution CT, or Optima CT 680 system (GE Healthcare). The scanning parameters were 120 kV tube voltage, automatic tube current modulation, 500 ms rotation time, 1.375 pitch, and 512×512 matrix. The image reconstruction parameters for the slice thickness were 1.25 to 1.5 mm.
Evaluation of Primary CT Signs
The primary CT signs were analyzed separately by two radiologists with rich experience in TB diagnosis, who were blinded to the final sputum culture results. The primary signs included (a) TIB sign, (b) consolidation, (c) emphysema, (d) enlarged mediastinal lymph nodes, (e) pleural effusion, (f) bronchiectasis, (g) calcified nodules, (h) fibrostripe, (i) number of cavities, and (g) wall thickness of cavities. A detailed definition of the CT signs is provided in the Supplementary Material.
Cavity Segmentation
Regions of interest (ROIs), that is, the cavities, were manually delineated on the CT images layer-by-layer using a 3D slicer (http://www.slicer.org), including circumambient satellite lesions in lung windows. The entire cavity segmentation process was performed and confirmed by two experienced radiologists using chest CT images. In addition, the participants were blinded to the final results.
Process of Radiomics Feature Extraction
To homogenize the datasets prior to feature extraction, image resampling (to the same voxels of 1×1 × 1 mm3 in-plane resolution) was performed to ensure the correct calculation of radiomics features. The discretization of intensity values inside the ROIs was followed by a fixed bin width of 25 Hounsfield units, which has been reported to yield the most reproducible radiomic features for CT images. In addition, default package image normalization (z-score normalization) of PyRadiomics was applied to CT images to mitigate differences in image quality and noise across examinations.
Radiomic features were extracted from the original and filtered images. The Laplacian of Gaussian was applied with five different Gaussian values ranging from 1 to 5 mm to the original image. In addition, the wavelet-transformed images were filtered using either a low-bandpass filter or a high-bandpass filter in the x-, y-, and z-directions. Radiomics features can be divided into three categories: first-order features, shape and size features, and texture features. Detailed information regarding the radiomics features is provided in the official documentation of PyRadiomics. (https://pyradiomics.readthedocs.io/en/latest/features.html).
Feature Selection
The radiomics features were first normalized to the training cohort using the MinMaxScaler method as well as to the testing cohort. To overcome the imbalanced dataset of conversion to negative and sputum cultures persistently positive, we used the synthetic minority oversampling technique to balance the number of the two groups. Subsequently, the maximal information coefficient was applied to select the features according to the maximal information coefficient values, which ranged in decreasing order, and the top 200 features were selected. The recursive feature elimination (RFE) method was used to further screen the most predictable radiomics features. The RFE algorithm selects features in training datasets relevant to the prediction of target labels and removes weak features using importance gain. We used tenfold cross-validation to avoid overfitting. Finally, based on the highest cross-validated score, we selected the features to construct the model and visualize the process.
Model Construction
Relying on the selected radiomics features, a random forest classifier (RFC) model was trained on the training dataset using sputum status as the outcome. In addition, clinical characteristics and primary CT signs with significant differences were screened to construct a clinical model using logistic regression. Finally, we established a combined model combining selected radiomic features and clinical characteristics using RFC. The training cohort was randomly divided into two parts by the ratio of 7:3, then we trained and validated these three models on it by tenfold cross validation. We tested it on an external testing cohort by selecting the best model for cross validation. Feature selection and model construction were performed using Python scikit-learn package (version 3.8, Scikit-learn Version 0. 21, http://scikit-learn.org/). The radiomics-based machine learning workflow pipeline is shown in Figure 2.
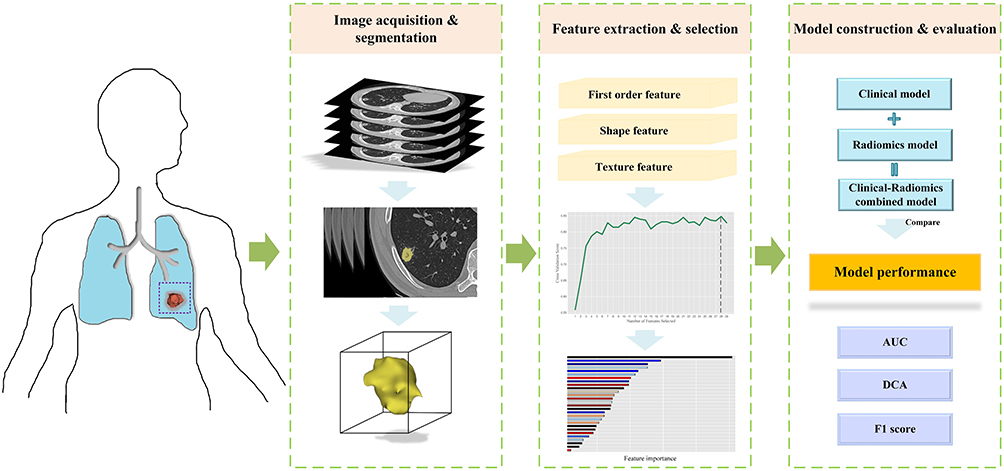 |
Figure 2 Workflow of model construction. |
Statistical Analysis
Statistical analysis was performed using SPSS software (version 26) and Python Scikit-learn package. The kappa test was used to evaluate the inter-reader agreement of the primary CT signs. Continuous variables were analyzed using an independent two-sample t-test, whereas differences in categorical variables were analyzed using the χ2-test or Wilcoxon test. The predictive performance of the model was quantified through the area under the receiver operator characteristic (ROC) curve (AUC) in both the training and testing cohort. The ROC curve was plotted, and the 95% confidence interval was calculated. The DeLong test was used to compare the AUCs of these three models in the two cohorts and evaluate whether overfitting occurred. Decision curve analysis (DCA) was applied to determine the clinical usefulness of these models by calculating the net benefits at different threshold probabilities in the training and testing cohorts. Briefly, the net benefit is equivalent to the proportion of net true positives. From this binary prediction, the sensitivity, specificity, precision, negative predictive value, accuracy, balanced accuracy, and F1-score were determined. The reported statistical significance level was two-sided at p < 0.05.
Results
Clinical Characteristics and Primary CT Signs
An overview of the baseline patient characteristics is presented in Table 1. As shown in Table 1, no significant differences were found in clinical characteristics and primary CT signs in the training set, except for age, TIB, consolidation, and emphysema. The mean age and previous TB treatment duration of patients with persistently positive sputum cultures were higher than those of patients who converted to negative sputum cultures (p<0.05). TIB, emphysema and consolidation were more common in patients who converted to negative results (p<0.05). In addition, there were no significant difference in clinical characteristics and primary CT signs in the testing cohort. The wall thicknesses of the cavities in the two groups are listed in Table 2. This shows that the thickness of the cavity wall was not statistically different between the two groups in either the training or the testing cohorts. Excellent interobserver agreement was observed for all primary CT signs (k > 0.7, all).
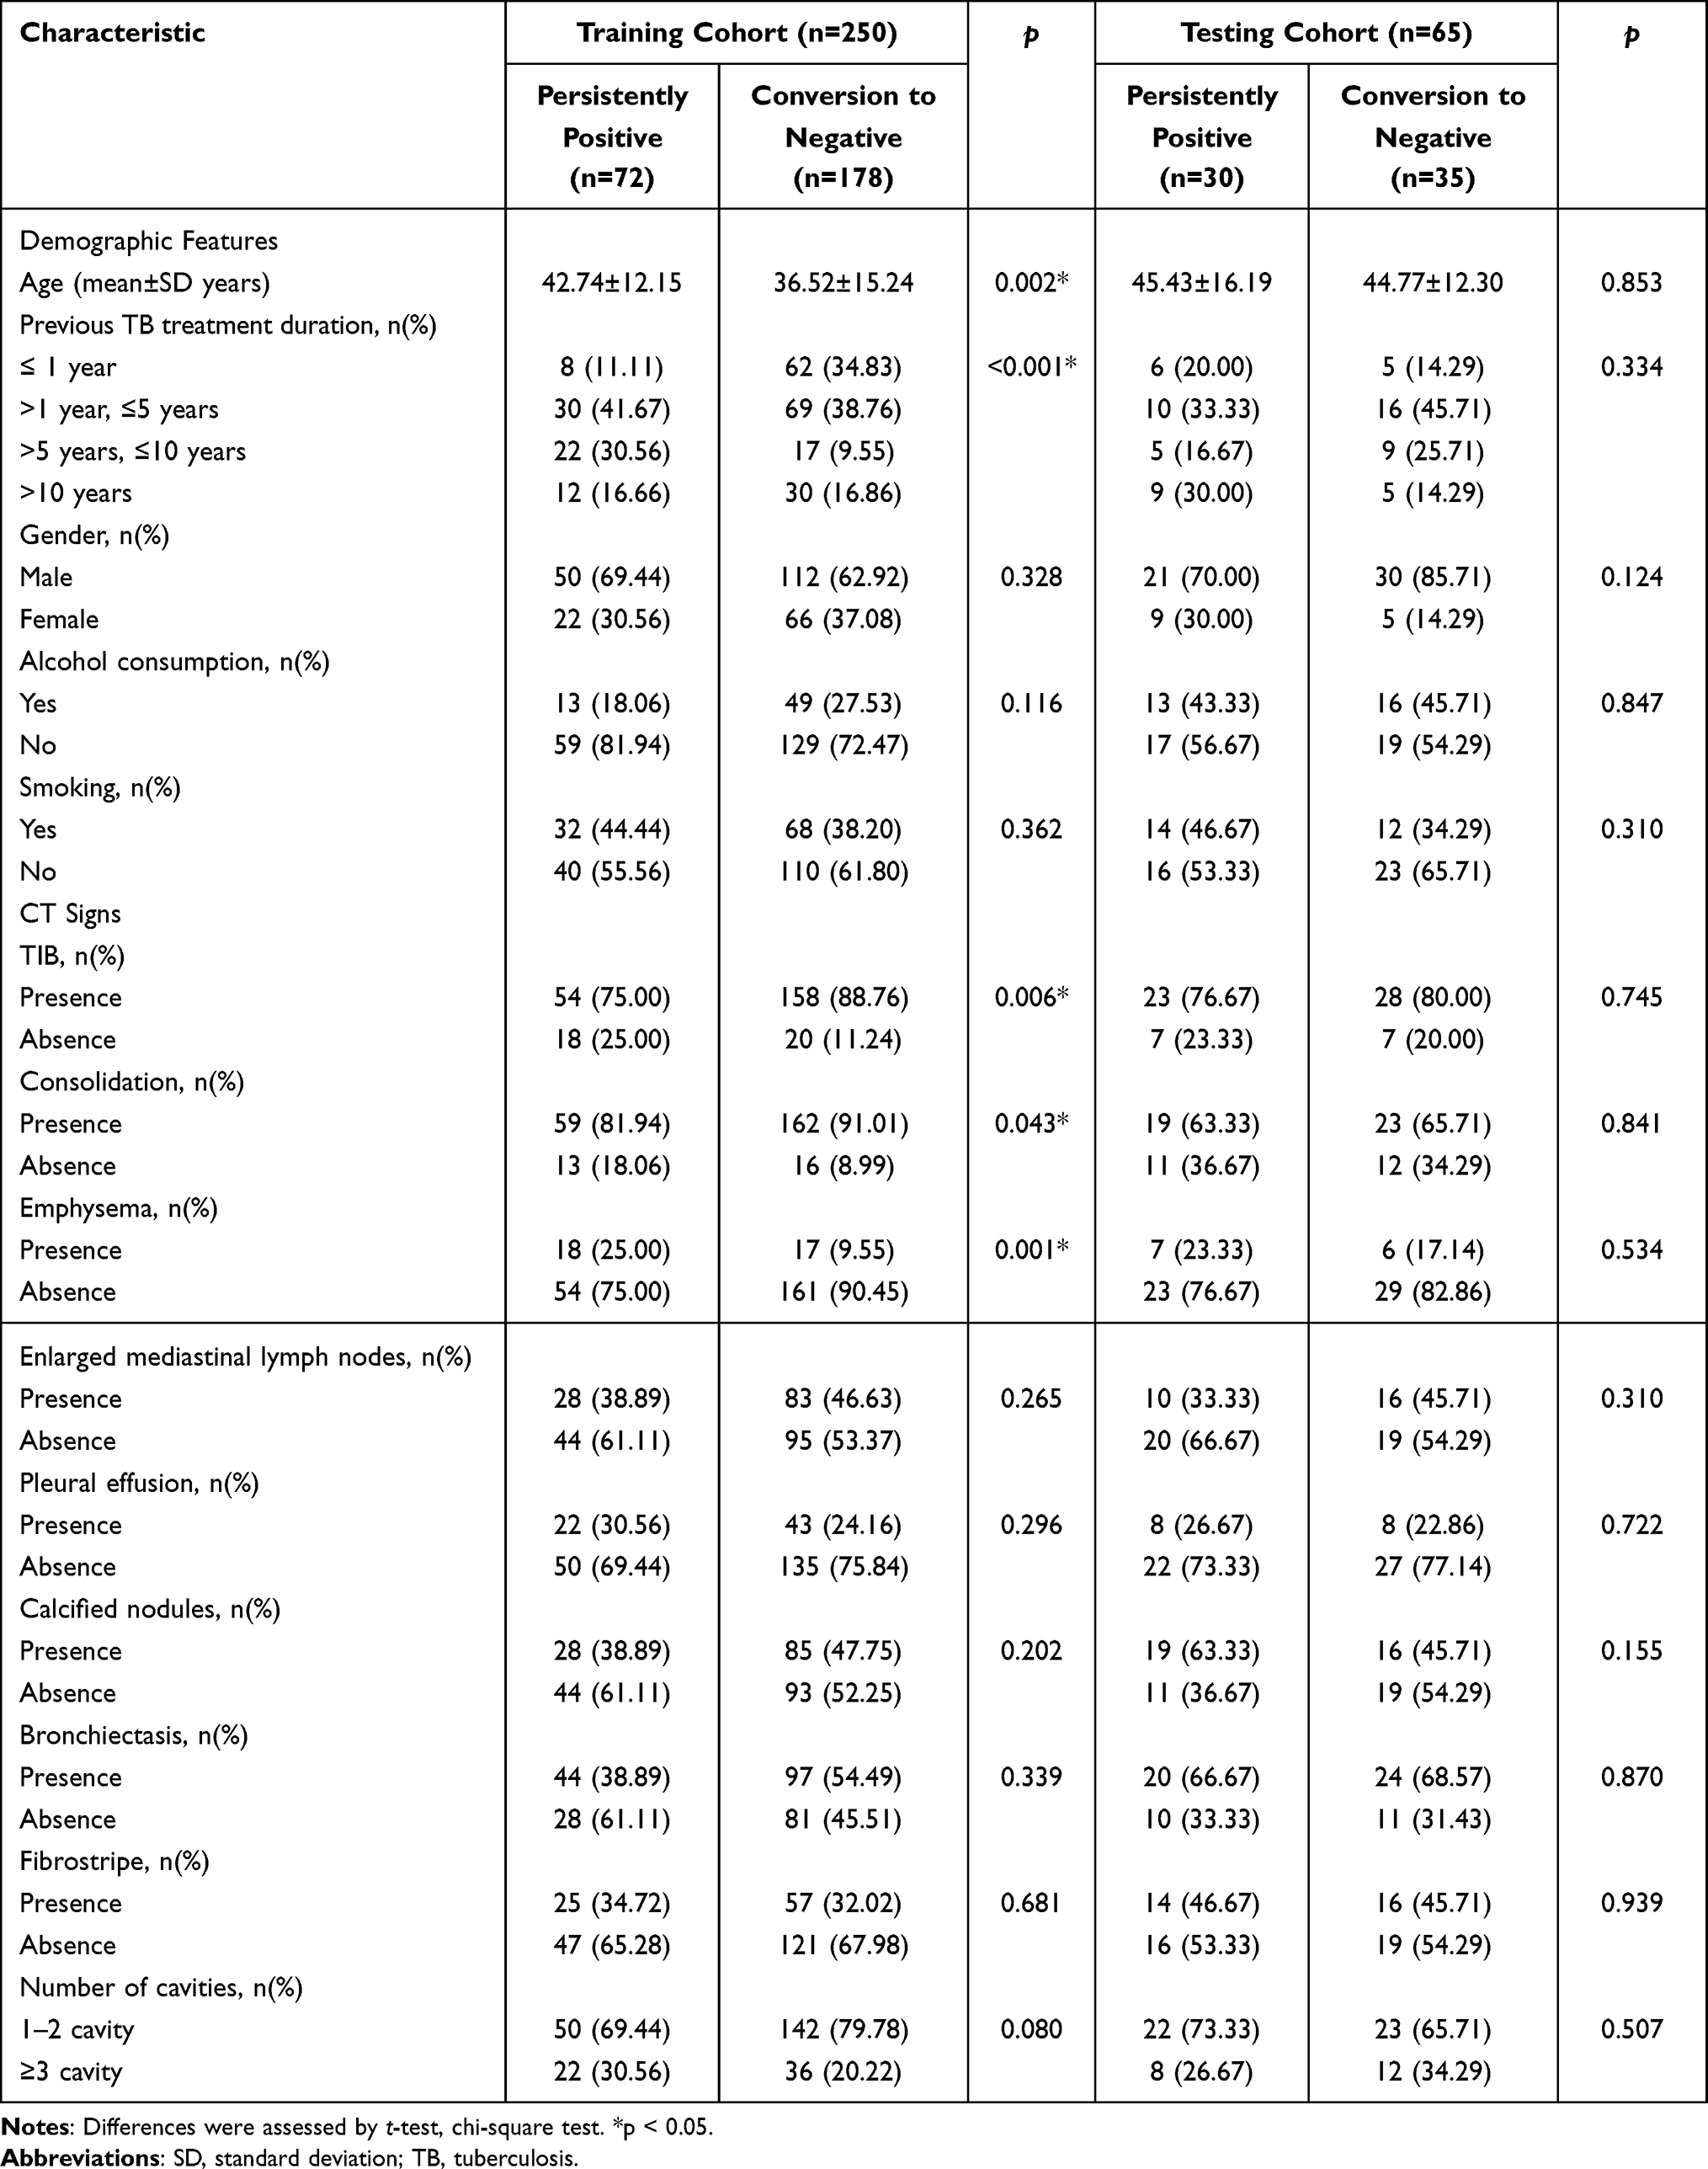 |
Table 1 Clinical Characteristics and CT Signs of Persistently Positive and Conversion to Negative Sputum Cultures Groups in the Training Cohort and Testing Cohort |
 |
Table 2 Wall Thickness of Cavities of Persistently Positive and Conversion to Negative Sputum Cultures Groups in the Training Cohort and Testing Cohort |
Feature Selection
In total, 28 radiomics features were extracted based on cavities using RFE according to the highest cross-validation score. The results of feature selection and its importance in the radiomics model based on the training cohort are displayed in Figure 3. A clustering map of the 28 radiomics features in the training dataset is shown in Figure 4. The radiomic features showed obvious clusters that had different responses to conversion from negative to positive.
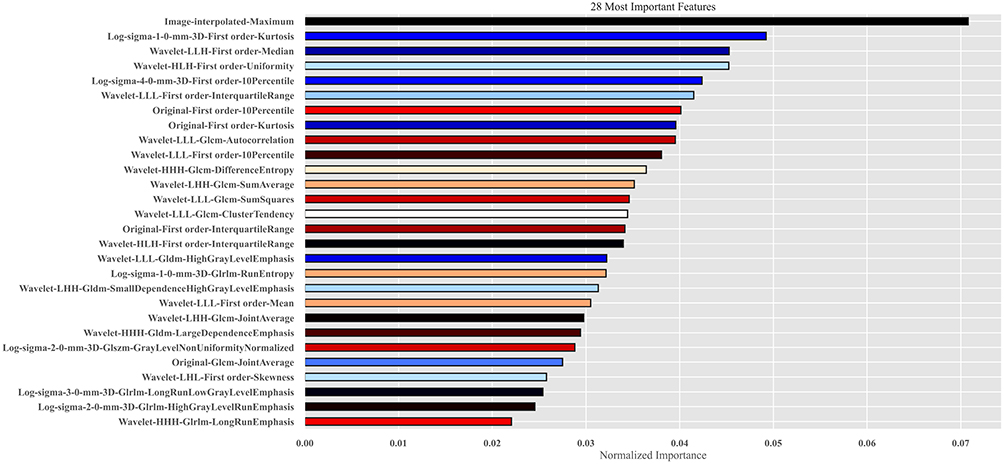 |
Figure 3 The 28 radiomics features based on cavity with the highest normalized importance were selected and included. |
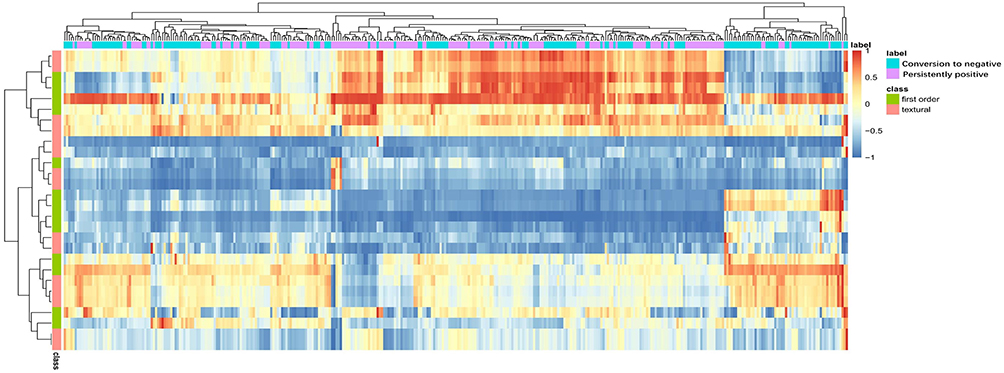 |
Figure 4 The clustering heatmap of selected radiomics features in the training dataset. Notes: Patients in the training cohort were arrayed on the horizontal axis which included conversion to negative and persistently positive sputum cultures groups. The 28 radiomics features were arrayed on the vertical axis which included first-order and textural features. |
Model Performance
The predictive model for the status of sputum culture based on radiomics features can differentiate patients with conversion to negative sputum cultures from those with persistently positive sputum cultures and achieve an encouraging performance. As shown in Figure 5, the AUCs of the radiomics model was 0.892 (95% CI:0.818–0.956) and 0.839 (95% CI:0.749–0.922) in the training and testing cohorts, respectively. The F1 scores were 0.842 and 0.764 for the two cohorts. The clinical model yielded AUCs and F1 scores of 0.688 (95% CI:0.603–0.770) and 0.525 (95% CI:0.402–0.654) and 0.619 and 0.543 in the training and testing cohorts, respectively. The combined model showed excellent performance in the training cohort, with an AUC and F1 score of 0.913 (95% CI:0.842–0.970) and 0.846, respectively. This was confirmed in the testing cohort, with an AUC and F1 score of 0.815 (95% CI:0.723–0.902) and 0.702, respectively. Furthermore, the predictive performances of the radiomics, clinical, and combined models were compared between the two cohorts. The radiomics model showed greater discrimination power (0.892 and 0.839) than the clinical model (0.688 and 0.525), respectively) in the training cohort (p=0.002)) and the testing cohort (p<0.0001). Compared with the combined model, there were no significant differences in the AUCs between the training (p=0.102) and testing cohorts (p=0.180). In addition, the AUCs of the combined model were significantly higher than those of the clinical model during the training (p<0.0001) and testing (p<0.0001) cohorts. DCA curves are shown in Figure 6. Radiomics and the combined model would offer net benefits over the “treat-all” or “treat-none” schemes within a certain range of thresholds in the training and testing cohorts. We also calculated the accuracy, precision, and recall of these models for the two cohorts as shown in Table 3). The thresholds for binary classification of the radiomics, clinical, and combined models were 0.650, 0.514, and 0.638, respectively.
 |
Table 3 Predictive Performance of Three Models in the Training and Testing Cohorts |
 |
Figure 5 ROC curves of the clinical, radiomics and combined model. Notes: (a) Training cohort. (b) Testing cohort. |
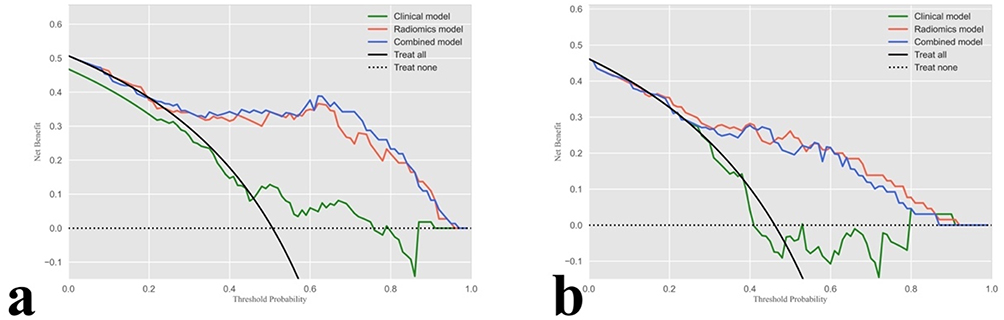 |
Figure 6 DCA curves of the clinical, radiomics and combined model. Notes: (a) Training cohort. (b) Testing cohort. The net benefit versus the threshold probability is plotted which included black line (all patients with sputum cultures persistently positive) and dotted line (all patients with sputum cultures convert to negative). The x-axis and y-axis showed threshold probability and net benefit separately. Only when the model has a higher net benefit than the default treat-all (all patients with sputum cultures persistently positive) and treat-none (all patients with sputum cultures convert to negative), it is clinically useful. The radiomics and combined model are superior to either treat-all or none strategy within certain ranges of risk threshold. |
Discussion
Sputum culture results at 6 months of longer MDR-TB regimens are important for subsequent treatment. In the present study, we developed a radiomics model based on a cavity and compared it with a clinical model and a combined model. Finally, we found that the radiomics model and the combined model could effectively predict sputum status and perform much better than the clinical model.
This study enrolled and analyzed the clinical characteristics and primary CT signs to build a clinical model. The analysis of clinical characteristics revealed that age and previous TB treatment duration were significantly different between the persistently positive and conversion to negative sputum culture groups, whereas other features such as sex, smoking, and surgical history were not statistically significant. This result is in line with a previous report that MDR-TB patients older than 65 years with a history of TB treatment are more likely to experience treatment failure.13 Furthermore, some common CT findings, such as consolidation, TIB, and emphysema, were significantly different between the two groups. TIB and consolidation are the frequent signs of active TB.14 A previous study suggested that emphysema increases the risk of delayed time-to-culture conversion in TB.15 In addition, basic visual assessments of cavities, such as the number and wall thickness, were analyzed in this study. However, these factors cannot differentiate patients with persistently positive sputum cultures from those with conversion to negative cultures.
The response of MDR-TB patients to treatment was monitored based on monthly sputum cultures, which is the most sensitive detection method. The results from cultured isolates are generally available only after 4–8 weeks. Accordingly, at the sixth month of treatment, the culture results from the specimens taken at months 4 and 5 were available. For most patients, the sputum status is expected to be negative within the first few months of treatment initiation. Persistently positive within 4–6 months indicates a high risk of treatment failure. More importantly, a review of the regimen and performance of the DST will be triggered if the culture remains positive beyond or close to that point.3 Additionally, when the regimens included injectable agents such as amikacin, the intensive phase was defined as the initial part of the treatment. Generally, the intensive phase is suggested for 6–8 months, whereas extending the duration to 8 months depends on sputum status at the end of the intensive phase.16 In addition, the standardized duration of bedaquiline (a Group A anti-tuberculosis agent) was recommended to be 24 weeks, according to the WHO guidelines.17 Recent reports have revealed that appropriate extension of the duration of bedaquiline administration may reduce the rate of sputum culture, reversing to positive.6,18 However, considering the safety and drug resistance, the use of bedaquiline for longer than 24 weeks should be specifically addressed.6 Patients with persistently positive sputum cultures within the first 6 months should be given priority to prolong bedaquiline use. Finally, evidence on the safety and effectiveness of several drugs beyond 6 months, such as delamanid, is insufficient for review, and toxicity may increase with the duration of use.3 Therefore, it is necessary to evaluate the therapeutic effects of these drugs before deciding whether to prolong their use. In summary, early identification of patients whose sputum culture continuously remains positive until sixth months after starting treatment, thus strengthening clinical, drug safety, and microbiology monitoring, is helpful in adjusting new treatment regimens when there are early signs of treatment failure or drug intolerance and simultaneously reducing adverse events and emergence of drug resistance.
The imaging signs of MDR-TB are diverse and exhibit large individual differences. Therefore, in this study, we analyzed a common CT sign of MDR-TB to improve predictive accuracy. Cavitary lesions are an important sign of TB and are the biological foundation of MDR-TB.19 Wang et al found that thick-walled multiple cavities were the most promising imaging signs for identifying MDR-TB.9 Cavity is a key method of TB transmission and is strongly associated with high mycobacterial load.20 Assessing the size and variation of the cavity is of great significance for measuring the response to TB treatment.11 However, the analysis of conventional CT signs may be influenced by the subjectivity of readers. Radiomics is a method that can reveal deeply and qualify cavity lesion characteristics in sufficient detail. Recent studies have built and validated radiomics models based on frequent CT signs such as cavity, TIB, or nodules to differentiate MDR-TB from drug-sensitive TB, and have achieved excellent performance.10,21 Yan et al22 showed that radiomics features extracted from cavities based on CT images can effectively distinguish nontuberculous Mycobacterium pulmonary disease from pulmonary TB. These studies have effectively demonstrated the association between cavitary radiomic features and the pathophysiology. In addition, a previous study used machine learning to identify patients at a high risk of TB treatment failure.23 They found that forward stepwise selection achieved the best performance, and yielded an AUC of 0.74.23 Nevertheless, there is a lack of radiomics research based on cavitary TB to predict treatment efficacy at the sixth month after longer MDR-TB regimens.
In our study, we established three predictive models (radiomics, clinical, and radiomics-clinical combined models). The results showed that the performance of the clinical model was unsatisfactory, whereas the other two models performed well in both training and testing cohorts. In the training cohort, the combined model was slightly better than the radiomics model, with an AUC of 0.892, which was lower than that of the testing cohort. However, no significant differences between the two models. This implies that the radiomic features extracted from the cavity played a more important role in the combined model than the basic clinical characteristics and subjective CT findings. The F1-score of the two models were similar in the training cohort. For the testing cohort, the F1-score of the radiomics model was higher than that of the combined model, which indicated that the radiomics model may be more stable in clinical practice, especially when the sample set is imbalanced. In addition, the DCA curves showed that the radiomics and combined model added a greater net benefit than the assumption of “all patients persistently positive sputum cultures” or “all converse to negative sputum cultures” across the majority of reasonable threshold probabilities, which could warrant high-risk patients with prolonged duration of therapy or other modifications to the treatment regimen.
Our study had some limitations. First, it was a retrospective study with a relatively small sample size. The generalizability and reproducibility of the models are uncertain owing to the different characteristics of the patients and CT machines. Therefore, it is necessary to increase the amount of data and conduct a prospective study to validate this model in the future. Another shortcoming of this research is that we only analyzed a single sign of the cavity and ignored other CT findings, such as TIB, nodules, and consolidation. Finally, the study focused on the therapeutic effect in the first sixth month, the ultimate treatment outcome of the longer MDR-TB regimens has not been assessed, and it will be our future research target.
In conclusion, this study analyzed and compared the ability of three models (radiomics, clinical, and combined models) to predict the therapeutic effect at the sixth month after longer MDR-TB regimens. It found that the radiomics model and combined model have excellently predictive potential, especially the radiomics features based on CT imaging of cavitary TB have great value in predicting the sputum culture result at the sixth month for patients receiving longer MDR-TB regimens, which could guide follow-up treatment.
Abbreviations
AUC, Area under the ROC curve; CT, Computed tomography; DCA, Decision curve analysis; DST, Drug-resistant testing; MDR-TB, Multidrug-resistant tuberculosis; RFC, Random forest classifier; RFE, Recursive feature elimination; ROC, Receiver operator characteristic; ROIs, Regions of interest; TB, Tuberculosis; TIB, Tree-in-bud; WHO, World Health Organization.
Ethics Approval and Consent to Participate
This retrospective study, conducted at Beijing Chest Hospital, Capital Medical University, was approved by the Ethics Committee. Informed consent from patients was waived by the committee, considering the retrospective nature of the study and the utilization of anonymized data, while ensuring patient privacy and confidentiality. All patient data were handled in strict accordance with relevant privacy regulations, guidelines, and the principles outlined in the Declaration of Helsinki, ensuring confidentiality and anonymity throughout the study.
Acknowledgments
This research was supported by Beijing Hospital Authority Clinical Medical Development of Special Funding (XMLX202146). This funding source provided financial support without influencing the study design and data interpretation.
Author Contributions
All authors made a significant contribution to the work reported, whether in the conception, study design, execution, acquisition of data, analysis, and interpretation, or in all these areas, took part in drafting, revising, or critically reviewing the article; gave final approval of the version to be published; have agreed on the journal to which the article has been submitted; and agree to be accountable for all aspects of the work.
Funding
This project was supported by a grant from Beijing Hospital Authority Clinical Medical Development of Special Funding (XMLX202146).
Disclosure
The authors declare that they have no competing interests.
References
1. Bagcchi S. WHO’s global tuberculosis report 2022. Lancet Microbe. 2023;4(1):e20. doi:10.1016/S2666-5247(22)00359-7
2. Chakaya J, Petersen E, Nantanda R, et al. The WHO Global Tuberculosis 2021 Report - not so good news and turning the tide back to End TB. Int J Infect Dis. 2022;124 Suppl 1:S26–S29. doi:10.1016/j.ijid.2022.03.011
3. World Health Organization. WHO Consolidated Guidelines on Tuberculosis: Module 4: Treatment - Drug-Resistant Tuberculosis Treatment, 2022 Update. Geneva: World Health Organization; 2022.
4. Kaul G, Kapoor E, Dasgupta A, Chopra S. Management of multidrug-resistant tuberculosis in the 21st century. Drugs Today. 2019;55(3):215–224. doi:10.1358/dot.2019.55.3.2927587
5. Bastos ML, Lan Z, Menzies D. An updated systematic review and meta-analysis for treatment of multidrug-resistant tuberculosis. Eur. Respir J. 2017;49(3):1600803. doi:10.1183/13993003.00803-2016
6. Guglielmetti L, Chiesi S, Eimer J, et al. Bedaquiline and delamanid for drug-resistant tuberculosis: a clinician’s perspective. Future Microbiol. 2020;15(9):779–799. doi:10.2217/fmb-2019-0309
7. Korzeniewska-Koseła M. Gruźilica: aktualne problem rozpoznawania i leczenia [Tuberculosis: actual problems with diagnosis and treatment]. Wiad Lek. 2016;69(2 Pt 1):145–150. Polish.
8. Maduskar P, Hogeweg L, de Jong PA, et al. Cavity contour segmentation in chest radiographs using supervised learning and dynamic programming. Med Phys. 2014;41(7):071912. doi:10.1118/1.4881096
9. Wáng YXJ, Chung MJ, Skrahin A, Rosenthal A, Gabrielian A, Tartakovsky M. Radiological signs associated with pulmonary multi-drug resistant tuberculosis: an analysis of published evidences. Quant Imaging Med Surg. 2018;8(2):161–173. doi:10.21037/qims.2018.03.06
10. Li Y, Wang B, Wen L, et al. Machine learning and radiomics for the prediction of multidrug resistance in cavitary pulmonary tuberculosis: a multicentre study. Eur Radiol. 2023;33(1):391–400. doi:10.1007/s00330-022-08997-9
11. Ralph AP, Ardian M, Wiguna A, et al. A simple, valid, numerical score for grading chest x-ray severity in adult smear-positive pulmonary tuberculosis. Thorax. 2010;65(10):863–869. doi:10.1136/thx.2010.136242
12. Gillies RJ, Kinahan PE, Hricak H. Radiomics: images are more than pictures, they are data. Radiology. 2016;278(2):563–577. doi:10.1148/radiol.2015151169
13. Kang Y, Jo EJ, Eom JS, et al. Treatment outcomes of patients with multidrug-resistant tuberculosis: comparison of pre- and post-public-private mix periods. Tuberc Respir Dis. 2021;84(1):74–83. doi:10.4046/trd.2020.0093
14. Bommart S, Charriot J, Nagot N, et al. Differentiating between active and latent tuberculosis with chest computed tomography. Diagn Interv Imaging. 2021;102(10):605–610. doi:10.1016/j.diii.2021.05.011
15. Takasaka N, Seki Y, Fujisaki I, et al. Impact of emphysema on sputum culture conversion in male patients with pulmonary tuberculosis: a retrospective analysis. BMC Pulm Med. 2020;20(1):287. doi:10.1186/s12890-020-01325-1
16. Mirzayev F, Viney K, Linh NN, et al. World Health Organization recommendations on the treatment of drug-resistant tuberculosis, 2020 update. Eur Respir J. 2021;57(6):2003300. doi:10.1183/13993003.03300-2020
17. World Health Organization. WHO Consolidated Guidelines on Drug-Resistant Tuberculosis Treatment. Geneva: World Health Organization; 2019.
18. Hewison C, Bastard M, Khachatryan N, et al. Is 6 months of bedaquiline enough? Results from the compassionate use of bedaquiline in Armenia and Georgia. Int J Tuberc Lung Dis. 2018;22(7):766–772. doi:10.5588/ijtld.17.0840
19. Long R. Drug-resistant tuberculosis. CMAJ. 2000;163(4):425–428.
20. Perrin FM, Woodward N, Phillips PP, et al. Radiological cavitation, sputum mycobacterial load and treatment response in pulmonary tuberculosis. Int J Tuberc Lung Dis. 2010;14(12):1596–1602.
21. Li Y, Xu Z, Lv X, et al. Radiomics analysis of lung CT for multidrug resistance prediction in active tuberculosis: a multicentre study. Eur Radiol. 2023. doi:10.1007/s00330-023-09589-x
22. Yan Q, Wang W, Zhao W, et al. Differentiating nontuberculous mycobacterium pulmonary disease from pulmonary tuberculosis through the analysis of the cavity features in CT images using radiomics. BMC Pulm Med. 2022;22(1):4. doi:10.1186/s12890-021-01766-2
23. Sauer CM, Sasson D, Paik KE, et al. Feature selection and prediction of treatment failure in tuberculosis. PLoS One. 2018;13(11):e0207491. doi:10.1371/journal.pone.0207491
 © 2023 The Author(s). This work is published and licensed by Dove Medical Press Limited. The
full terms of this license are available at https://www.dovepress.com/terms
and incorporate the Creative Commons Attribution
- Non Commercial (unported, 3.0) License.
By accessing the work you hereby accept the Terms. Non-commercial uses of the work are permitted
without any further permission from Dove Medical Press Limited, provided the work is properly
attributed. For permission for commercial use of this work, please see paragraphs 4.2 and 5 of our Terms.
© 2023 The Author(s). This work is published and licensed by Dove Medical Press Limited. The
full terms of this license are available at https://www.dovepress.com/terms
and incorporate the Creative Commons Attribution
- Non Commercial (unported, 3.0) License.
By accessing the work you hereby accept the Terms. Non-commercial uses of the work are permitted
without any further permission from Dove Medical Press Limited, provided the work is properly
attributed. For permission for commercial use of this work, please see paragraphs 4.2 and 5 of our Terms.