")
Back to Journals » Diabetes, Metabolic Syndrome and Obesity » Volume 14
Using Metabolic and Biochemical Indicators to Predict Diabetic Retinopathy by Back-Propagation Artificial Neural Network
Authors Su B
Received 11 June 2021
Accepted for publication 24 August 2021
Published 15 September 2021 Volume 2021:14 Pages 4031—4041
DOI https://doi.org/10.2147/DMSO.S322224
Checked for plagiarism Yes
Review by Single anonymous peer review
Peer reviewer comments 2
Editor who approved publication: Dr Konstantinos Tziomalos
Bo Su
Department of Endocrinology, Aviation General Hospital, Beijing, 100012, People’s Republic of China
Correspondence: Bo Su
Department of Endocrinology, Aviation General Hospital, China Medical University, Beijing, 100012, People’s Republic of China
Tel +8613439927892
Email [email protected]
Purpose: Timely diagnosis of diabetic retinopathy (DR) can significantly improve the prognosis of patients. In this study, we established a prediction model by analyzing the relationship between diabetic retinopathy and related metabolic and biochemical indicators.
Methods: A total of 427 type 2 diabetes mellitus (T2DM) patients were selected from the datadryad website data. Logistic regression (MLR) was used to input layer variables of the model were screened. Then, Tan-Sigmoid was selected as the transfer function of the hidden layer node, and the linear function was used as the output layer function to establish the back propagation artificial neural network (BP-ANN) model. The model was applied to 183 patients with type 2 diabetes mellitus (T2DM) in our hospital to predict DR.
Results: A total of 167 patients (39.2%) with DR were obtained from the Datadryad database. Input variables were screened by MLR model, and it was concluded that the age, sex, albumin and creatinine, diabetes course were independently associated with the occurrence of DR. The above variables were used to establish BP-ANN model. The area under receiver operating characteristic curve (AUC) was significantly higher than that of MLR model (0.88 vs 0.74, P< 0.05), the probability threshold of the model was 0.3. Type 2 diabetes mellitus (T2DM) were selected in our hospital, including 92 patients with DR (50.2%). The above BP-ANN model was used to predict the incidence of DR, and the AUC area was significantly higher than that of the MLR model (0.77 vs 0.70, P< 0.05), the probability threshold was 0.7.
Conclusion: We established the BP-ANN model and applied it to diagnose DR. Taking diabetic course, age, sex, albumin and creatinine as the inputs of BP-ANN, the existence of DR could be well predicted. Meanwhile, the generalization ability of the model could be improved by selecting different probability thresholds in different ROC curves.
Keywords: diabetic retinopathy, type 2 diabetes, probability threshold, BP-ANN
Introduction
Type 2 diabetic retinopathy (DR) is a microvascular disease caused by the long-term influence of high blood sugar, high blood lipid and other factors, which can cause retinal damage. According to the epidemiological data recently shared by the American Academy of Ophthalmology, the prevalence of diabetic retinopathy in patients with type 2 diabetes is 25.1%, of which about 25% ~30% are expected to develop vision threatening diabetic macular edema.1 Early detection and timely intervention are the keys to avoid the blindness caused by diabetic retinopathy.
In Chinese diabetic population, the prevalence of DR in rural areas (34.0%) is higher than that in urban areas (18.7%), suggesting that it is necessary to carry out DR screening for diabetic population, especially in rural and underdeveloped areas.2 However, due to economic reasons and medical conditions, it is more difficult to carry out early screening in areas with high incidence of DR.3 Therefore, it is crucial to establish a simple and easily popularized model for DR screening to improve the prognosis of the disease. The introduction of artificial intelligence (AI) diabetic retinopathy early warning system can be a short and effective screening of diabetic retinopathy. At present, data mining technology is widely used. Recognize fundus images through deep learning, so that high specificity and sensitivity can be obtained in the diagnosis of DR.4 However, the model still needs to perform fundus examination and obtain relevant images, which limits the popularization of the model. In China, Litong Yao applied BP neural network to diagnose and predict the classification of diabetic retinopathy. When the Waist-to-hip ratio, glycated hemoglobin (HbA1c), duration of diabetes and the family history of diabetes were used as input data, better prediction results could be obtained without ophthalmic examination.5 However, there is no external verification in this study, and the sample size and related biochemical indicators are small, so the generalization ability of the model cannot be well evaluated. BP-ANN algorithm is a multi-layer feedforward network trained by error back propagation algorithm, and it is one of the most widely used neural network models at present.6 In the model, the initial weight threshold and the number of hidden layers have been discussed by many researches, but the probability threshold is rarely discussed. In this study, we introduced clinical data from different hospitals in China for model training and external validation. Considering the course of disease, age, sex, hypertension, glycated hemoglobin, blood lipid and other data are easy to obtain in primary hospitals. The above data were screened, and the data related to the incidence of DR were used as input layer variables to establish the BP neural network prediction model. This model can well predict the occurrence of DR. At the same time, selecting different probability thresholds in ROC curves of different hospitals can improve the generalization ability. This model is simple and effective without more economic investment, which is beneficial to saving medical resources and improving patient compliance. Part of the data in this study was selected from the datadryad database, which has been used in many7,8 studies.
Materials and Methods
Participants in this study were 427 Chinese residents with type 2 diabetes aged 18 years or older, selected from the datadryad database (available for download at datadryad.org/stash). The datadryad database includes personal information such as age, sex, smoking, alcohol consumption status and medical history. Biochemical indicators include fasting blood glucose (FPG), HbA1c, total cholesterol (TC), low density lipoprotein cholesterol, triglyceride (TG), albumin and creatinine. At the same time, 183 patients who were hospitalized and outpatient in Aviation General Hospital from August 2015 to August 2020 were selected. The subjects’ age, sex, smoking, drinking status, medical history and other personal information were extracted from the case records. The biochemical indexes were determined as fasting (8 hours) venous blood. The biochemical parameters measured included fasting blood glucose (FPG) alanine aminotransferase (ALT) albumin (AST) albumin (ALB) glycosylated hemoglobin (HbA1c) total cholesterol (TC) and low density lipoprotein cholesterol triglyceride (TG) albumin and creatinine. Type 2 diabetes was defined as FPG greater than or equal to 7.0mmol/L, or blood glucose at 2 hours postprandial greater than or equal to 11.1mmol/ L, self-administered antidiabetic medication, or type 2 diabetes diagnosed by a doctor. Hypertension is defined as systolic blood pressure greater than or equal to 140mmHg or diastolic blood pressure greater than or equal to 90mmHg or use of any antihypertensive medication. Drinking was defined as five or more drinks (12 grams of pure alcohol per drink) for men and four or more drinks at least once a week for women. According to the 1997 WHO definition of smoking, in a lifetime of continuous or associated smoking for 6 months or more.9 DR was diagnosed as pupil dilation after viewing from 2 visual fields (one centered on the optic disc); Fundus images (Canon CR6-45nm). According to the Early Treatment Study for Diabetic Retinopathy (ETDRS) criteria, if there are any characteristic lesions, such as microaneurysm hemorrhage, lint plaque, abnormal hard microvessel exudate, venous bleeding and neovascularization, the diagnosis of DR is made.10 This study is in accordance with the Declaration of Helsinki. This study is a retrospective study. As the identity of the patients is anonymous, the signing of the informed consent is exempted. At the same time, this study has been approved by the Ethics Committee of Aviation General Hospital.
Statistical Analysis
Social science statistical software (SPSS, Version 20.0, IBM) was used for statistical analysis and the neural network toolbox in MATLAB 2018 software was used to establish the BPANN model. The independent sample t-test or rank sum test was used for continuous variable analysis, and the chi-square test or rank sum test was used for categorical variable analysis. A multivariate regression model was established based on the training data, and the new data were extrapolated by the maximum likelihood estimation. Univariate and multivariate analyses were conducted using DR as the dependent variable. The odds ratio (OR) of each factor to the corresponding 95% confidence interval (95% CI) was calculated. Neural network was established by using neural network toolbox for data in Datadryad database. The number of hidden layers was selected as 7, and the probability threshold was 0.3, that is, when P>0.3 believes diagnosing DR. The probability threshold of the neural network model in our hospital is selected as 0.7. For all tests, a P value less than 0.05 is considered significant. The ROC of the prediction results was drawn, and the area under the curve and the sensitivity and specificity under different probabilities were analyzed to evaluate the prediction performance of the model. The areas under the ROC curve are compared by the Z test of the formulas.
Results
A total of 427 patients with T2DM were selected from the Datadryad database and divided into two groups, including 259 (60.7%) non-DR type 2 diabetes controls and 167 (39.2%) type 2 diabetes participants with DR (Table 1). Dependent sample t test and rank sum analysis showed that gender hypertension history Cr, Bun, Alt, AST, Alb, HDL-C, LDL-C, Chol had statistically significant difference between the two subgroups (P<0.05). Age and course of disease in DR group were significantly higher than those in non-DR group (P<0.05).183 patients with type 2 diabetes (T2D) were selected in our hospital, and the study population was divided into two subgroups, including 91 (49.8%) non-DR type 2 diabetes control group and 92 (50.2%) type 2 diabetes participants with DR (Table 2). Independent sample t-test and rank sum analysis showed that there was a statistically significant difference in the history of hypertension, Cr, BUN, AchE, between the two subgroups (P<0.05). The course of disease in DR group was significantly higher than that in non-DR group (P<0.05).
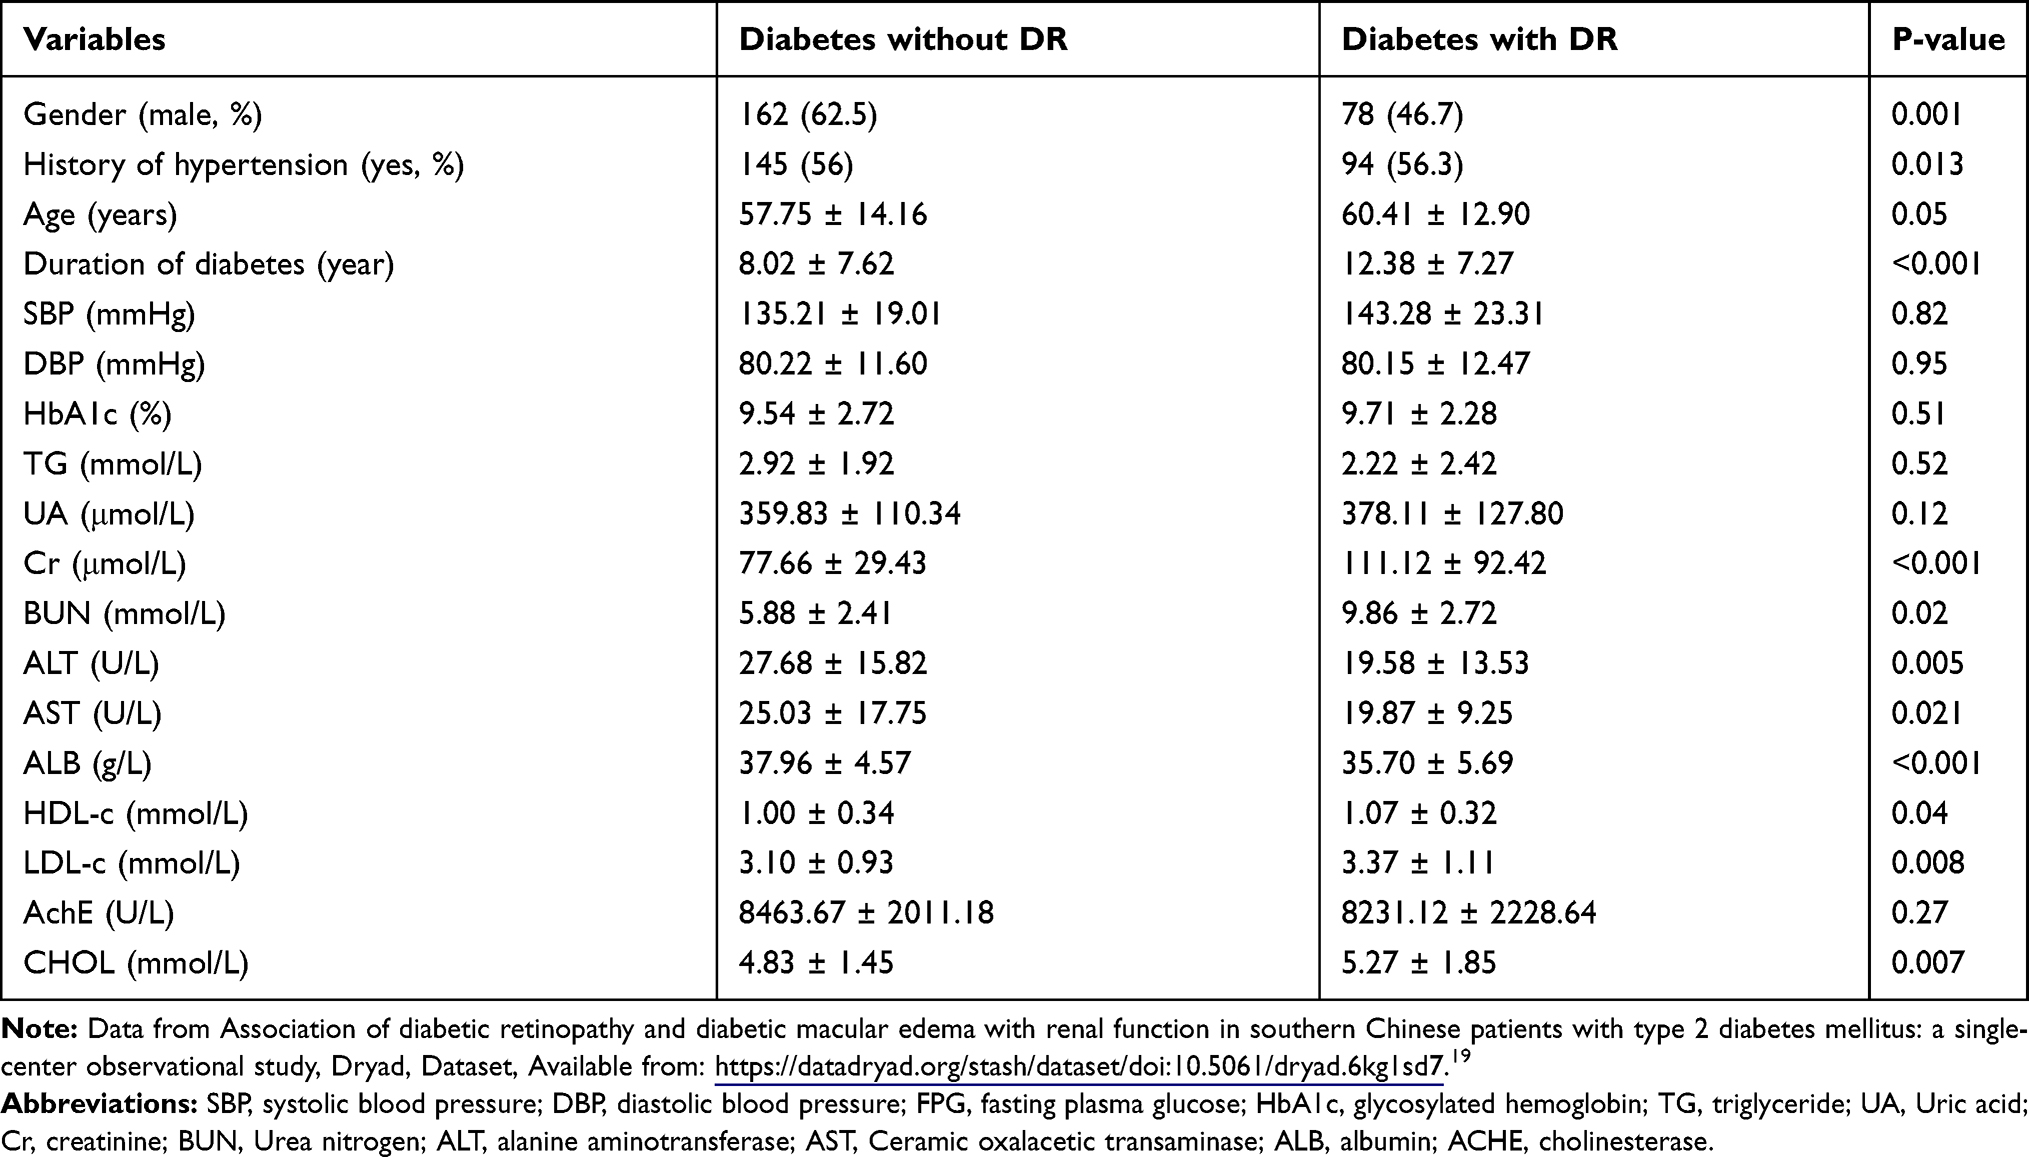 |
Table 1 Characteristics of Participants (datadryad website data) |
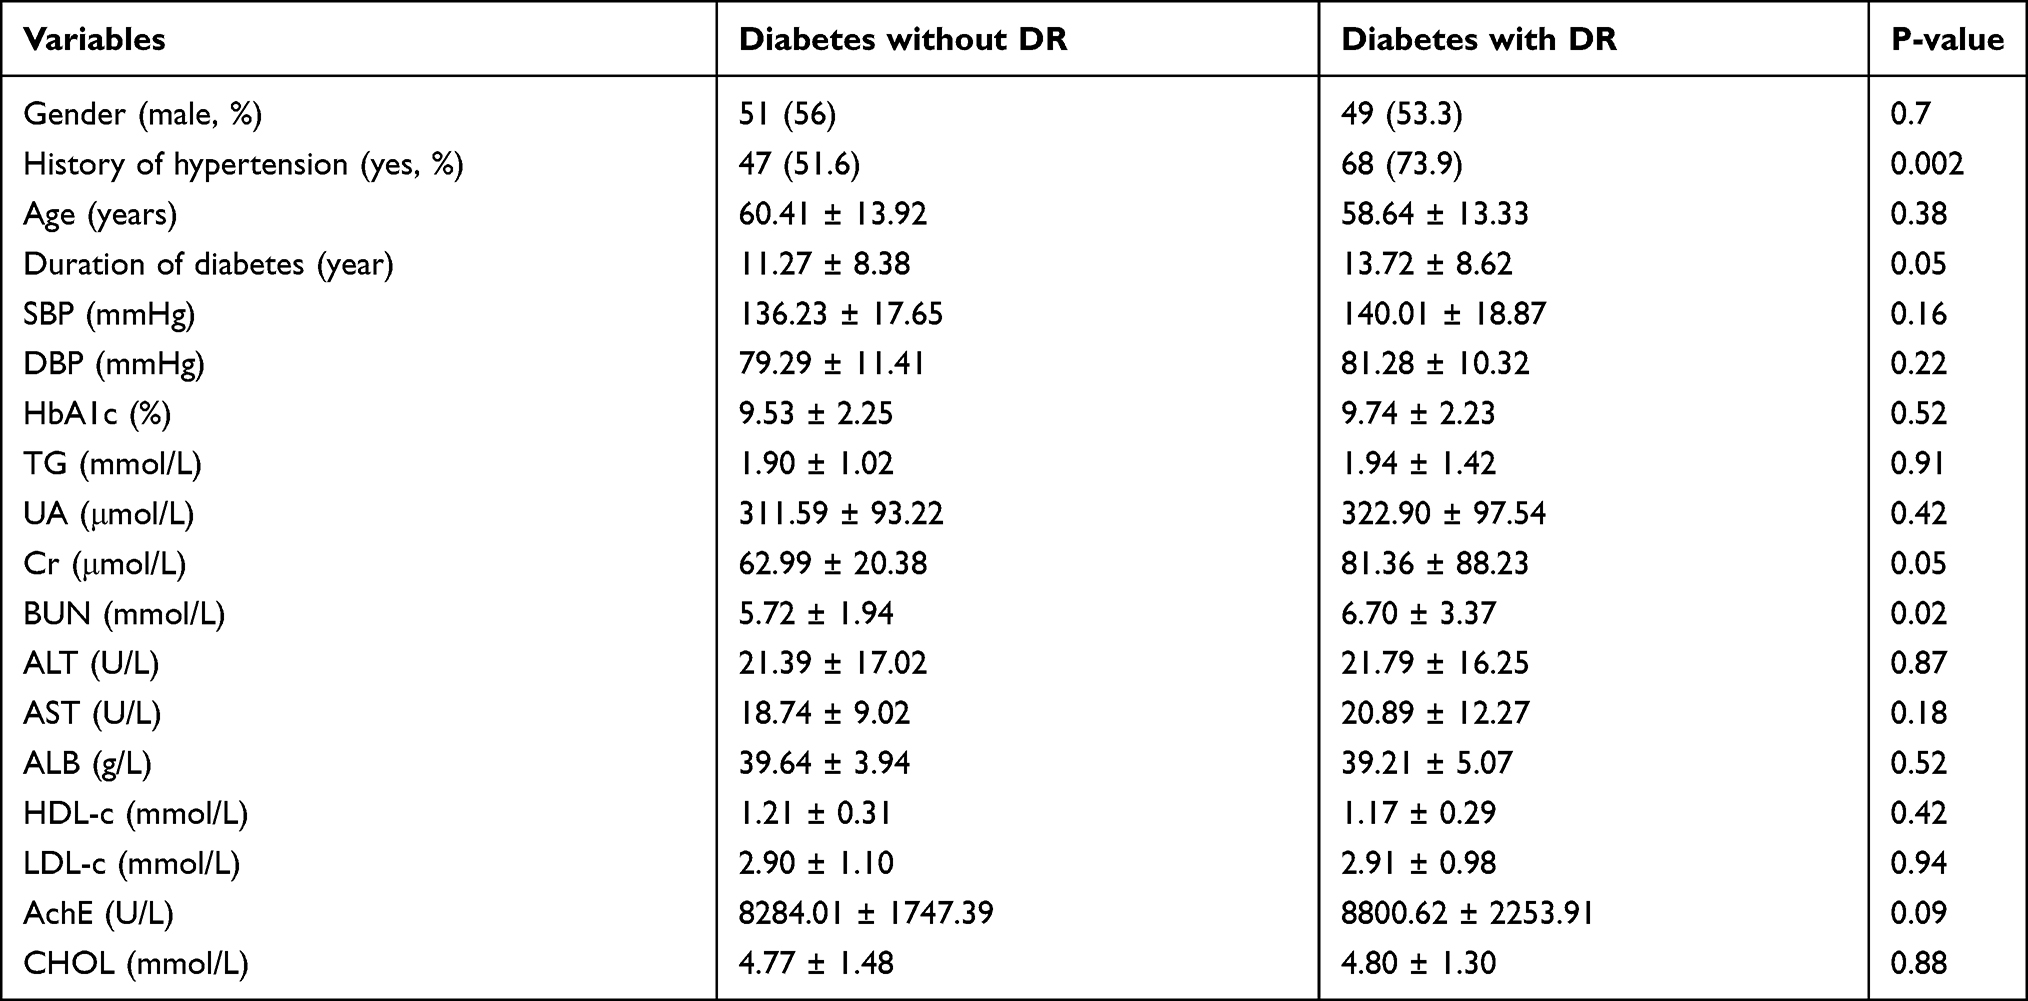 |
Table 2 Characteristics of Participants (database of our hospital) |
Unconditional Binary Logistic Regression Analysis
After univariate Logistic regression analysis of DR (all participants without DR as control group), the age, sex, and Cr, ALB of the diabetes course data in the Datadryad database may be associated with DR (Table 3). In the data of our hospital, the course of diabetes, history of hypertension, age and AST may be related to DR (Table 4).
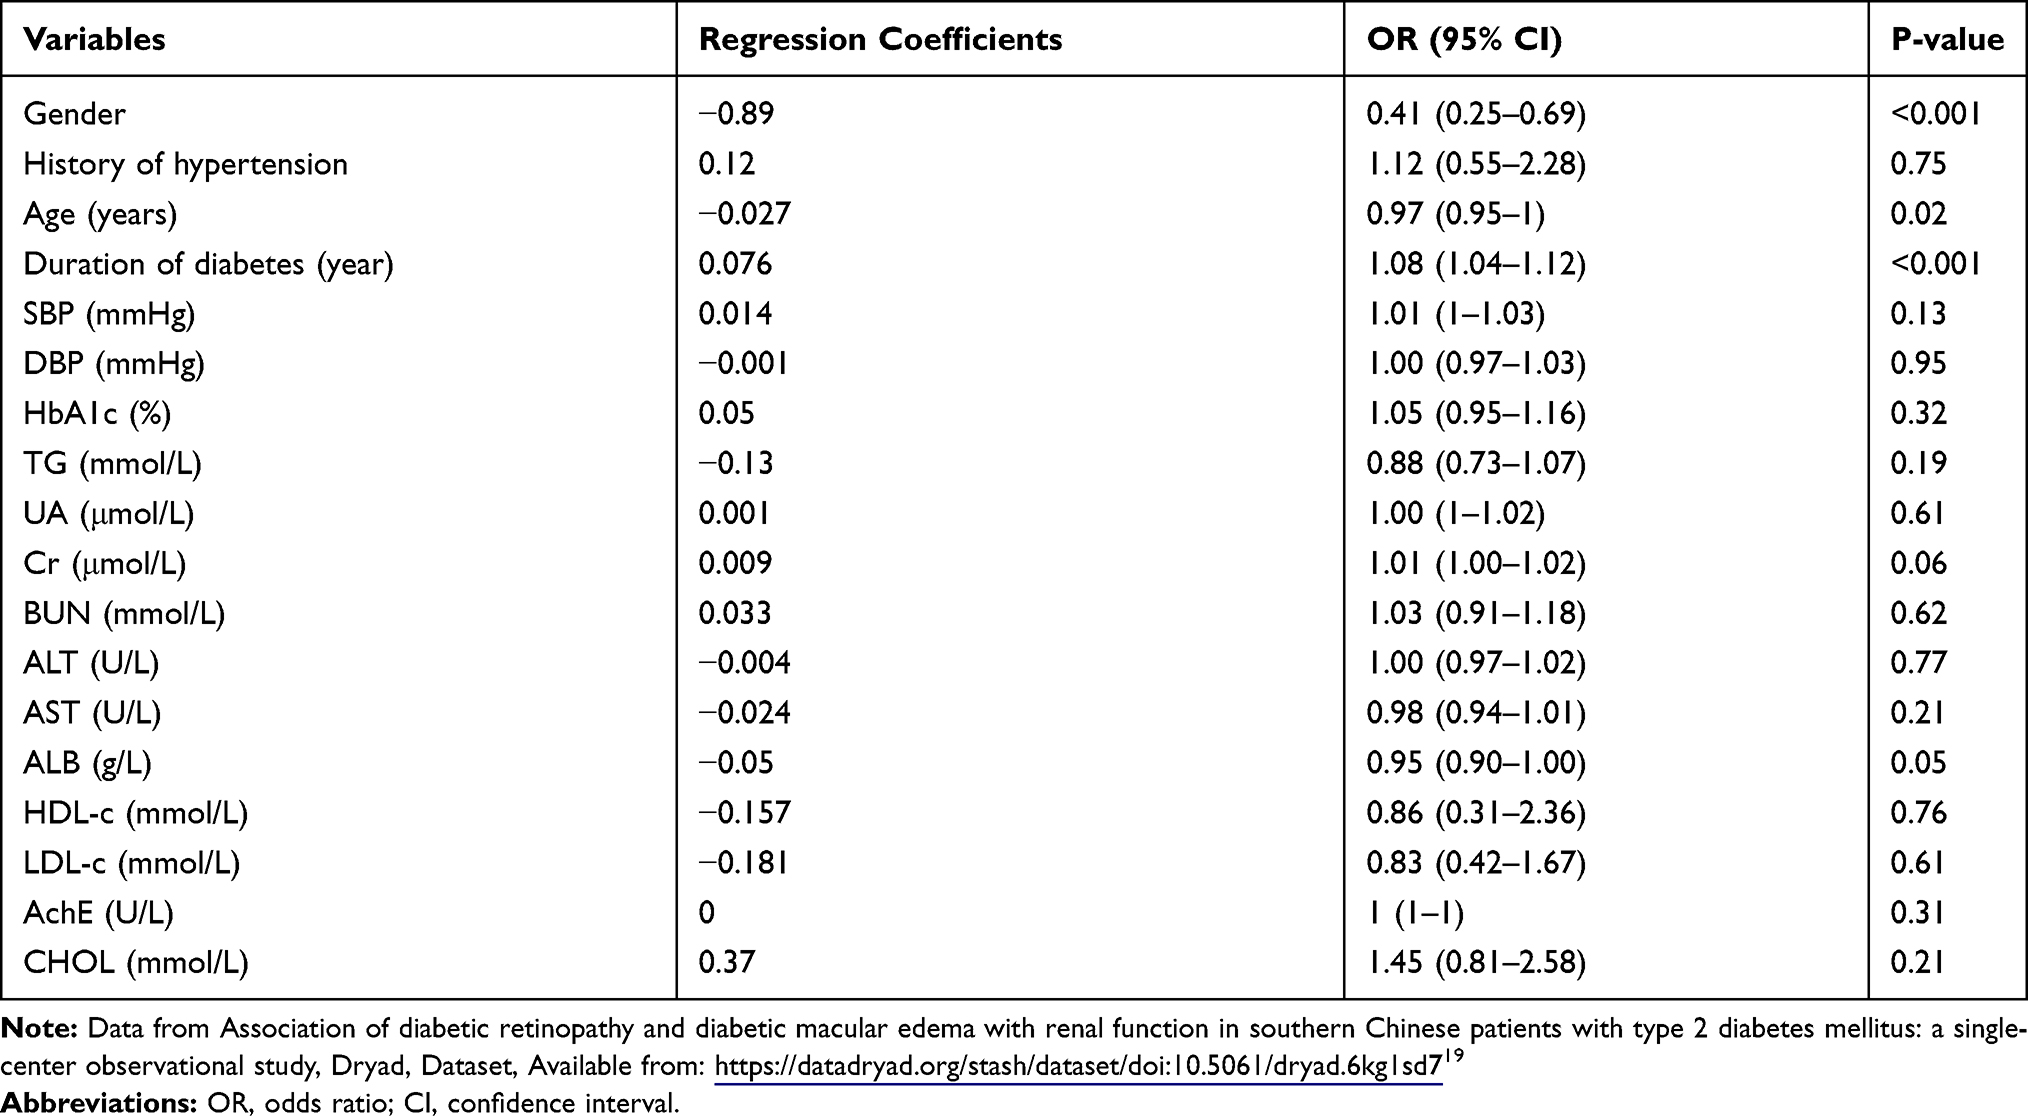 |
Table 3 Factors Associated with the Development of Diabetic Retinopathy (datadryad website data) |
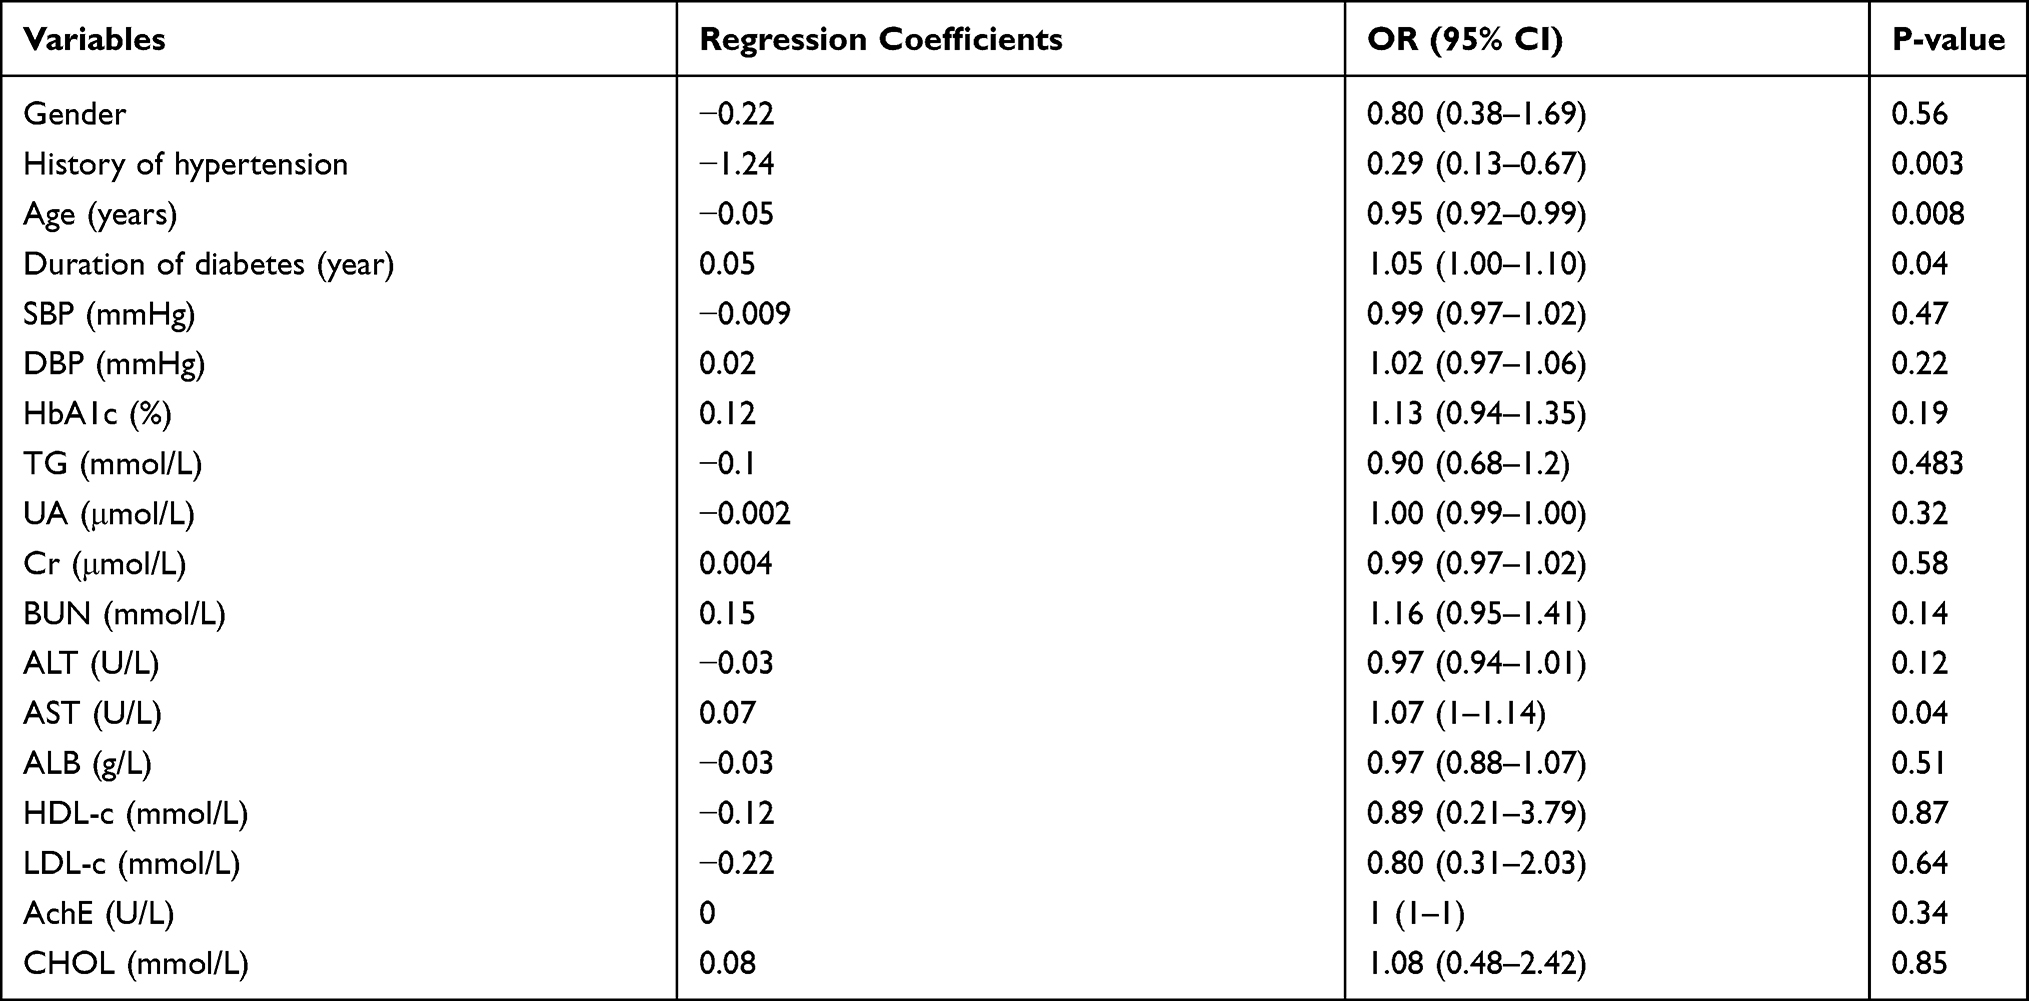 |
Table 4 Factors Associated with the Development of Diabetic Retinopathy (database of our hospital) |
Multivariable Logistic Regression
By multivariate Logistic regression analysis, the age and sex, Cr, ALB of diabetes course in Datadryad database were independently correlated with the occurrence of DR (Table 5). The ROC curve was drawn according to the probability value obtained by Logistic regression (Figure 1). AUC 0.74 (95% CI: 0.69 ~ 0.79). When the probability threshold is 0.5, the maximum Youden index is 0.4, the sensitivity is 0.52, and the specificity is 0.88.
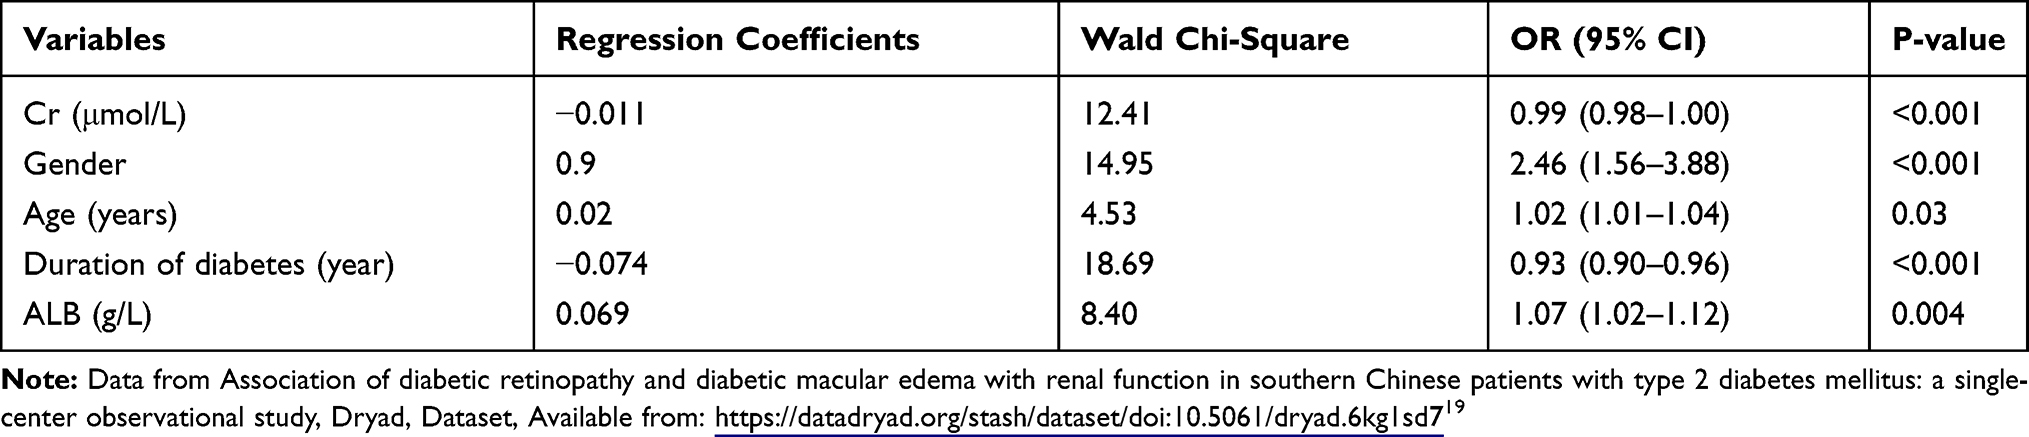 |
Table 5 Multivariable Logistic Regression Analysis Results of DR Related Factors (datadryad website data) |
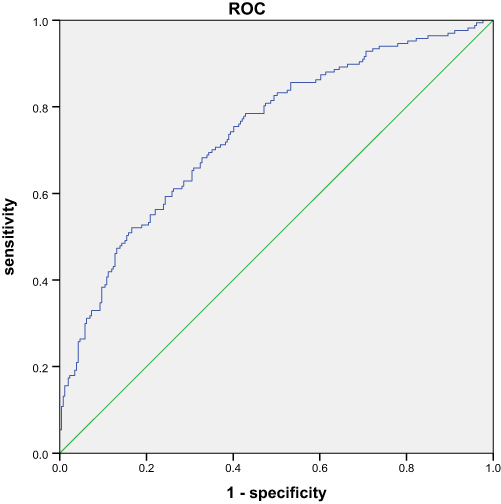 |
Figure 1 ROC curve of DR predicted by logistics regression model (Datadryad database). |
In the database of our hospital, the course of diabetes, age and history of hypertension were independently correlated with the occurrence of DR (Table 6). The ROC curve was drawn according to the probability value obtained by Logistic regression (Figure 2). AUC 0.70 (95% CI: 0.62 ~ 0.77). When the probability threshold is 0.5, the maximum Youden index is 0.34, the sensitivity is 0.66, and the specificity is 0.68.
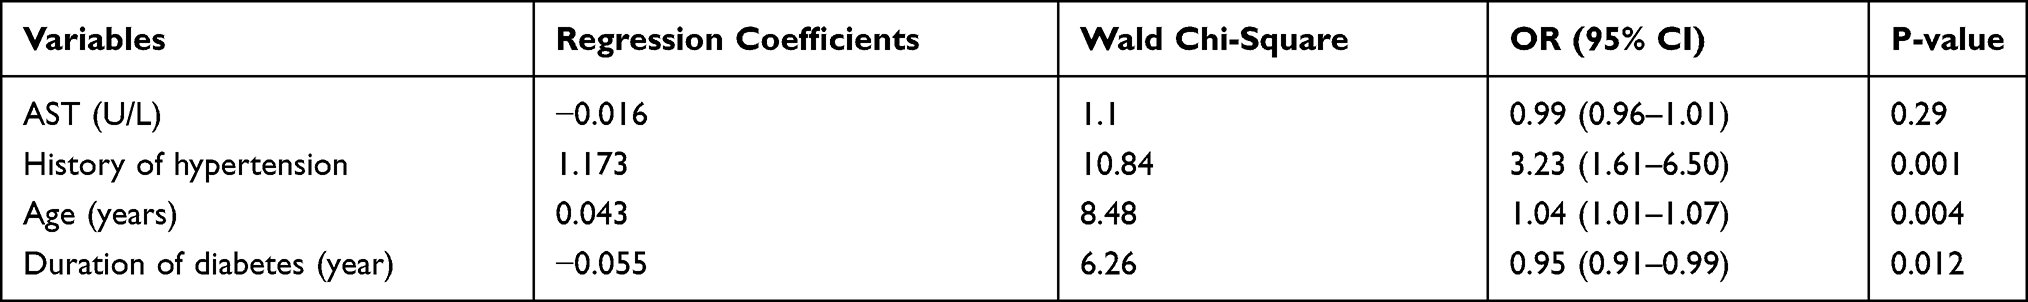 |
Table 6 Multivariable Logistic Regression Analysis Results of DR Related Factors (database of our hospital) |
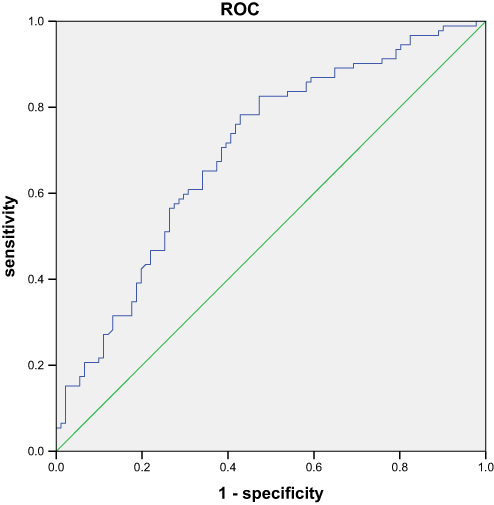 |
Figure 2 ROC curve of DR predicted by logistics regression model (database of our hospital). |
BP-ANN Model
The data selected from the datadryad database were used to build the BP-ANN model by using the neural network toolbox (Matlab2018α). Related parameters of THE BP-ANN model are explained as follows: Input layer: Receive external input samples, such as different biochemical and metabolic indicators in this study. Output layer: Predict the output value of the model. Hidden layer: In addition to the input layer and the output layer of other layers are called hidden layer, hidden layer does not directly accept the signal of the outside world, also do not directly send signals to the outside world. In this study, the number of hidden layers was selected as 1. number of nodes in the hidden layer: Number of hidden layer neurons. Probability threshold: If the output value of the prediction model is greater than the threshold value, it can be considered as positive (DR diagnosis is valid). Activation function: It’s a function that runs on a neuron in an artificial neural network, mapping the input to the output of the neuron.
Input variables include diabetes course age sex and Cr, ALB (all the above values are normalized). The data was divided into the training set validation set in a ratio of 3:1. The number of neurons in the hidden layer of the input layer and the output layer was set as 5-n-1.5 input variables (age, sex, and Cr, ALB), n neurons as the hidden layer (1–13), and 1 neuron as the output layer (whether to diagnose DR) were used for inverse normalization of the output results. The internal random sampling is performed by randomly setting random numbers. The transfer functions of the hidden layer and the output layer are tan-sigmoid and linear, respectively. The number of nodes in the hidden layer is calculated as  , where m is the number of nodes in the hidden layer, n is the number of nodes in the input layer, l is the number of nodes in the output layer, a is a constant from 1 to 10, and the final number of hidden layers is selected as 7.11 The Levenberg–Marquardt method was used for parameter iteration, and the stopping performance was measured by means of mean square error. Adjust the probability threshold according to Youden index. The probability threshold of output data in datadryad database is 0.3, and that in our hospital database is 0.7. See Figures 3 and 4 for specific training.
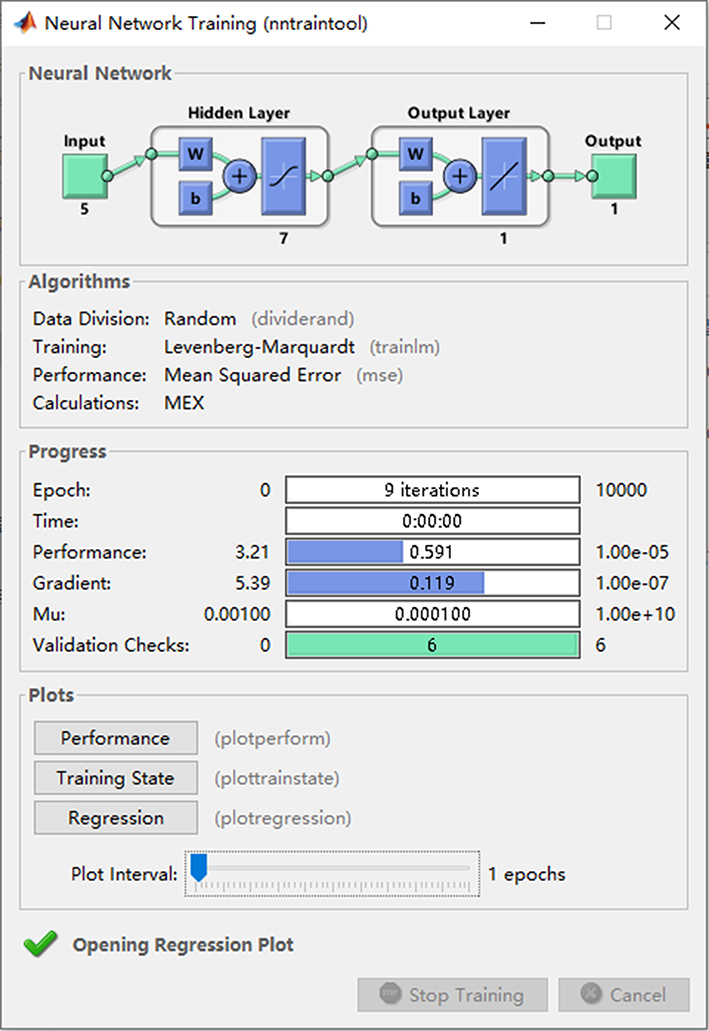 |
Figure 3 The BP-ANN training process. |
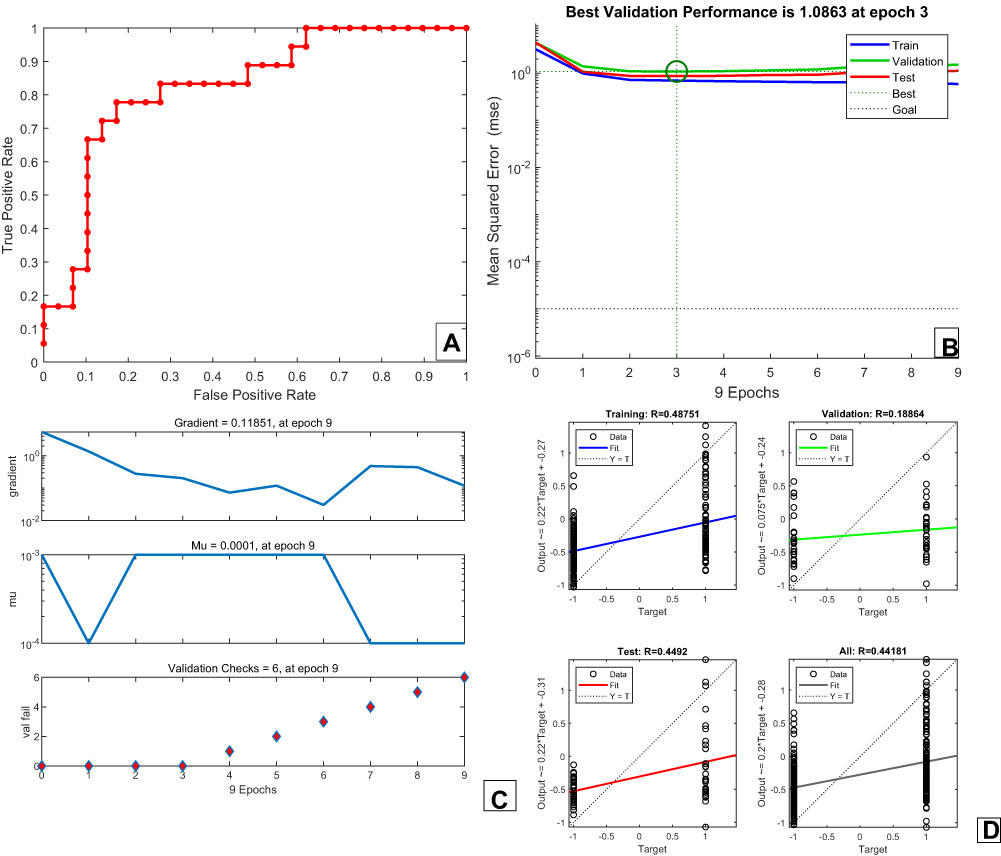 |
Figure 4 (A)The covariate-adjusted ROC curve by BP-ANN model to predict DR; (B) fitting performance of the BP-ANN (7 nodes hidden layer); (C) changes in parameters of the BP-ANN (7 nodes hidden layer); (D) regression performance of BP-ANN (7 nodes hidden layer). |
The AUC of BPANN model after training in datadryad database was 0.88 (95% CI: 0.78–0.91), which was higher than that of Logistic regression (Z=3.02, P<0.05). The sensitivity, specificity and Youden index were 0.73, 0.83 and 0.56, all of which were higher than the Logistic regression model (0.48), indicating that the constructed neural network had a good prediction effect on DR in this population. Save the network parameters of the model training.46 patients with type 2 diabetes were randomly selected from 183 patients with type 2 diabetes in our hospital. The model after BPANN training was applied, The input variables were still age, sex and duration of diabetes, Cr, ALB (All the above values are normalized), the output data is inverse normalized. With a probability threshold of 0.7, the AUC obtained was 0.77 (95% CI:0.72~0.88), Higher than Logistic regression (Z=2.93, P<0.05). The sensitivity, specificity and Youden index were 0.66, 0.89 and 0.55 respectively, which were all higher than those of Logistic regression model (0.34). It shows that the constructed neural network has a good prediction effect on DR of this population (Figure 5).
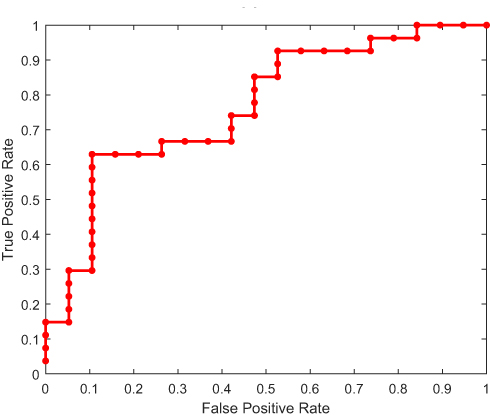 |
Figure 5 ROC curve of DR predicted by BP-ANN model (data of our hospital). |
Discussion
The current model of DR diagnosis through artificial intelligence, The main research focus is convolutional neural network, but this model still requires fundus imaging examination, which limits the application of this model in primary hospitals, especially in economically underdeveloped areas.12 There are also relevant literature reports on the prediction model of BPANN, but the sample size of the model is small, the specificity and sensitivity and other indicators are controversial, and the discussion on the generalization ability is lack.13 In this study, we first selected Chinese patients with type 2 diabetes from an open database. These included patients with a combination of DR. In order to facilitate the promotion of the model, we selected biochemical and metabolic indexes that were easy to obtain in primary hospitals as input variables of the model. Logistic regression was applied to screen out age, sex, albumin and creatinine of diabetes course according to their correlation with DR as input variables. The prediction model of BP-ANN was established. The BP-ANN model divided the data into the training set validation set, and the number of hidden layer nodes was set as 7. When the training target was 1×10⁻⁵, the performance was good at the ninth step (R=0.44), and the AUC of this model was significantly higher than that of the MLR model (0.88 vs 0.74, P<0.05), the higher specificity and sensitivity can be obtained when the probability threshold is 0.3, indicating that the model can be used for better diagnostic prediction. In order to verify the generalization ability of the model, we conduct external validation of the model. 183 patients with type 2 diabetes mellitus (T2D) were selected in our hospital, among which 92 patients with DR (50.2%) were enrolled. Using the same covariable, the above BPANN model was applied to patients in our hospital to predict the diagnosis of DR. Under the same probability threshold, the model has poor generalization ability, although the area under the receiver operating characteristic curve is significantly higher than that of the MLR model (0.77 vs 0.70, P<0.05), but the specificity and sensitivity are low. After we adjust the probability threshold according to the performance of the prediction model, the model can get better results (When the probability threshold was 0.7, the sensitivity, specificity and Youden index were 0.66, 0.89 and 0.55, which were all higher than those of the Logistic regression model (0.34)). Previous discussion of BPANN model mainly focused on the selection of initial threshold and weight and the number of hidden layer nodes. In this study, we discussed the influence of the selection of different probability thresholds on the generalization ability of the model. It should be noted that the discussion on the probability threshold of machine learning is mainly based on the same ROC curve to illustrate the model generalization ability,14 In this study, the ROC curves predicted by the model were different due to the difference in patients in different hospitals and the different data distribution despite the same model input variables. So the analysis of the probability threshold is the selection under different ROC curves and we notice that, the correlation between age, sex, albumin and creatinine in the course of diabetes mellitus and the incidence of DR was indicated by case data from Datadryad database. The data of our hospital showed that the history of hypertension, age and course of diabetes were correlated with the incidence of DR. However, we took the age, sex, albumin and creatinine of the course of diabetes as the input variables, trained the data in the DATADRYAD database, and completed the establishment of the BPANN model. When the model is applied to patients in our hospital, the input variables are unchanged, and the better prediction effect can still be obtained by adjusting the probability threshold.
At present, the prediction models established by machine learning fail to achieve the desired sensitivity specificity and generalization ability. The main reason is that if the model is simple, it can get better generalization ability, but the specificity and sensitivity of the model are poor. However, if the model is more complex and has more selected parameters, the sensitivity specificity can be improved, but the generalization ability is poor.15 In this study, we only applied a simple and mature BPANN model. Without increasing the complexity of the model, we improved the generalization ability of the model by adjusting the probability threshold value, thus avoiding the above shortcomings.
At the same time, we noted that the risk factors of diabetic retinopathy reported in the literature include long duration of diabetes mellitus, poor blood glucose control, hypertension and hyperlipidemia.16–18 This is not completely the same as the results of data analysis in this study, and it may be related to the specific conditions of patients in each hospital, such as the influence of related drugs and regional economy. However, this difference is more in line with the status quo of patient treatment in China, and the prediction model established by this method is more helpful for popularization and application.
It is significant to increase the AUC value to improve the prediction ability of the model. During data collection and processing, We found that the introduction of 24h urinary protein as a covariable increased the AUC value. Specific research process: we deleted the cases where urine protein was not examined. After the deletion, 39 cases of DR and 48 cases without DR are retained in the our hospital database. The AUC of the area under ROC curve under the logistic prediction model was 0.72.BP neural network prediction model was used to add 24 h urinary protein as the input variable, The AUC of the area under ROC curve was 0.82. Unfortunately, in the cases collected in our hospital, the 24-h urinary protein deficiency value was excessive. No 24-hour urine protein was collected in the Datadryad database. Therefore, the predictive model of 24-hour urinary protein as a covariable cannot be presented in this paper. As mentioned above, you can effectively increase the AUC value if you can add meaningful covariables. In addition, since this paper mainly studies the screening of Dr, in data processing, we found that adjusting the probability threshold can improve sensitivity and reduce missed diagnosis. Although specificity is reduced at the same time, the model can still be used as a screening tool for clinical work by adjusting the threshold when the AUC is low.
However, although the BPANN model has a good predictive performance, the specific biological significance of the parameters trained by the model is still unclear, which limits the specific biological interpretation of the model. Although the sample size of this study is larger than that of previous studies, the study scale still needs to be increased. If the specific staging of diabetic retinopathy can be introduced into the model, the practical significance of the model can be improved. But our hospital lacks such data.
Conclusion
Our study demonstrates the prospect of using BPANN model to recognize DR in disease diagnosis, and discusses how to improve the model generalization ability. Using age and sex albumin and creatinine as input parameters, the BPANN model can well predict the presence of diabetic retinopathy in Chinese community residents. Selecting different probability thresholds is helpful to improve the generalization ability of the model.
Acknowledgments
Li Hui’s translation of this article.
Disclosure
The author reports no conflicts of interest in this work.
References
1. Wilkinson-Berka JL, Miller AG. Update on the treatment of diabetic retinopathy. Sci World J. 2008;8:98–120. doi:10.1100/tsw.2008.25
2. Deng YX, Ye WQ, Sun YT, Zhou ZY, Liang YB. [A meta-analysis of prevalence of diabetic retinopathy in China]. Zhonghua Yi Xue Za Zhi. 2020;100(48):3846–3852. Chinese.
3. Hu H, Sawhney M, Shi L, et al. A systematic review of the direct economic burden of type 2 diabetes in china. Diabetes Ther. 2015;6(1):7–16. doi:10.1007/s13300-015-0096-0
4. Hunt MS, Kihara Y, Lee AY. Novel low-shot deep learning approach for retinal image classification with few examples. JAMA Ophthalmol. 2020;138(10):1077–1078. doi:10.1001/jamaophthalmol.2020.3256
5. Yao L, Zhong Y, Wu J, et al. Multivariable logistic regression and back propagation artificial neural network to predict diabetic retinopathy. Diabetes Metab Syndr Obes. 2019;12:1943–1951. doi:10.2147/DMSO.S219842
6. Wang J, Wang F, Liu Y, et al. Multiple linear regression and artificial neural network to predict blood glucose in overweight patients. Exp Clin Endocrinol Diabetes. 2016;124(1):34–38. doi:10.1055/s-0035-1565175
7. Patel CJ, Pho N, McDuffie M, et al. A database of human exposomes and phenomes from the US National Health and Nutrition Examination Survey. Sci Data. 2016;3:160096. doi:10.1038/sdata.2016.96
8. Gao F, Huang XL, Jiang XP, et al. Independent effect of alanine transaminase on the incidence of type 2 diabetes mellitus, stratified by age and gender: a secondary analysis based on a large cohort study in China. Clin Chim Acta. 2019;495:54–59. doi:10.1016/j.cca.2019.03.1636
9. Mostofsky E, Chahal HS, Mukamal KJ, Rimm EB, Mittleman MA. Alcohol and immediate risk of cardiovascular events: a systematic review and dose-response meta-analysis. Circulation. 2016;133(10):979–987. doi:10.1161/CIRCULATIONAHA.115.019743
10. Solomon SD, Goldberg MF. ETDRS grading of diabetic retinopathy: still the gold standard. Ophthalmic Res. 2019;62(4):190–195. doi:10.1159/000501372
11. Xu JF, Xu J, Li SZ, et al. Transmission risks of schistosomiasis japonica: extraction from back-propagation artificial neural network and logistic regression model. PLoS Negl Trop Dis. 2013;7(3):e2123. doi:10.1371/journal.pntd.0002123
12. Dai L, Fang R, Li H, et al. Clinical report guided retinal microaneurysm detection with multi-sieving deep learning. IEEE Trans Med Imaging. 2018;37(5):1149–1161. doi:10.1109/TMI.2018.2794988
13. Johnsson J, Björnsson O, Andersson P, et al. Artificial neural networks improve early outcome prediction and risk classification in out-of-hospital cardiac arrest patients admitted to intensive care. Crit Care. 2020;24(1):474. doi:10.1186/s13054-020-03103-1
14. Weng SF, Reps J, Kai J, Garibaldi JM, Qureshi N. Can machine-learning improve cardiovascular risk prediction using routine clinical data. PLoS One. 2017;12(4):e0174944. doi:10.1371/journal.pone.0174944
15. Deo RC. Machine learning in medicine. Circulation. 2015;132(20):1920–1930. doi:10.1161/CIRCULATIONAHA.115.001593
16. Tsao HY, Chan PY, Su EC. Predicting diabetic retinopathy and identifying interpretable biomedical features using machine learning algorithms. BMC Bioinform. 2018;19(Suppl 9):283. doi:10.1186/s12859-018-2277-0
17. UK Prospective Diabetes Study Group. Tight blood pressure control and risk of macrovascular and microvascular complications in type 2 diabetes: UKPDS 38. BMJ. 1998;317(7160):703–713. doi:10.1136/bmj.317.7160.703
18. Yau JW, Rogers SL, Kawasaki R, et al. Global prevalence and major risk factors of diabetic retinopathy. Diabetes Care. 2012;35(3):556–564. doi:10.2337/dc11-1909
19. Association of diabetic retinopathy and diabetic macular edema with renal function in southern Chinese patients with type 2 diabetes mellitus: a single-center observational study, Dryad, Dataset, Available from: https://datadryad.org/stash/dataset/doi:10.5061/dryad.6kg1sd7.
 © 2021 The Author(s). This work is published and licensed by Dove Medical Press Limited. The full terms of this license are available at https://www.dovepress.com/terms.php and incorporate the Creative Commons Attribution - Non Commercial (unported, v3.0) License.
By accessing the work you hereby accept the Terms. Non-commercial uses of the work are permitted without any further permission from Dove Medical Press Limited, provided the work is properly attributed. For permission for commercial use of this work, please see paragraphs 4.2 and 5 of our Terms.
© 2021 The Author(s). This work is published and licensed by Dove Medical Press Limited. The full terms of this license are available at https://www.dovepress.com/terms.php and incorporate the Creative Commons Attribution - Non Commercial (unported, v3.0) License.
By accessing the work you hereby accept the Terms. Non-commercial uses of the work are permitted without any further permission from Dove Medical Press Limited, provided the work is properly attributed. For permission for commercial use of this work, please see paragraphs 4.2 and 5 of our Terms.