Back to Journals » Journal of Inflammation Research » Volume 17
Unveiling Atherosclerotic Plaque Heterogeneity and SPP1+/VCAN+ Macrophage Subtype Prognostic Significance Through Integrative Single-Cell and Bulk-Seq Analysis
Authors Xu X ![]() , Qiu F, Yang M
, Qiu F, Yang M ![]() , Liu X, Tao S
, Liu X, Tao S ![]() , Zheng B
, Zheng B
Received 11 January 2024
Accepted for publication 9 April 2024
Published 23 April 2024 Volume 2024:17 Pages 2399—2426
DOI https://doi.org/10.2147/JIR.S454505
Checked for plagiarism Yes
Review by Single anonymous peer review
Peer reviewer comments 3
Editor who approved publication: Professor Ning Quan
Xiang Xu,1,2 Fuling Qiu,2 Man Yang,3 Xiaoyong Liu,2 Siming Tao,4,* Bingrong Zheng1,*
1School of Medicine, Yunnan University, Kunming City, Yunnan Province, People’s Republic of China; 2Department of Cardiology, The Second Affiliated Hospital of Kunming Medical University, Kunming City, Yunnan Province, People’s Republic of China; 3School of Medicine, Dali University, Dali City, Yunnan Province, People’s Republic of China; 4Department of Cardiology, The Affiliated Hospital of Yunnan University, Kunming City, Yunnan Province, People’s Republic of China
*These authors contributed equally to this work
Correspondence: Bingrong Zheng; Siming Tao, Email [email protected]; [email protected]
Background: Dysregulated macrophages are important causes of Atherosclerosis (AS) formation and increased plaque instability, but the heterogeneity of these plaques and the role of macrophage subtypes in plaque instability have yet to be clarified.
Methods: This study integrates single-cell and bulk-seq data to analyze atherosclerotic plaques. Unsupervised clustering was used to reveal distinct plaque subtypes, while survival analysis and gene set variation analysis (GSVA) methods helped in understanding their clinical outcomes. Enrichment of differential expression of macrophage genes (DEMGs) score and pseudo-trajectory analysis were utilized to explore the biological functions and differentiation stages of macrophage subtypes in AS progression. Additionally, CellChat and the BayesPrism deconvolution method were used to elucidate macrophage subtype interaction and their prognostic significance at single-cell resolution. Finally, the expression of biomarkers was validated in mouse experiments.
Results: Three distinct AS plaque subtypes were identified, with cluster 3 plaque subtype being particularly associated with higher immune infiltration and poorer prognosis. The DEMGs score exhibited a significant elevation in three macrophage subtypes (SPP1+/VCAN+ macrophages, IL1B+ macrophages, and FLT3LG+ macrophages), associated with cluster 3 plaque subtype and highlighted the prognostic significance of these subtypes. Activation trajectory of the macrophage subtypes is divided into three states (Pre-branch, Cell fate 1, and Cell fate 2), and Cell fate 2 (SPP1+/VCAN+ macrophages, IL1B+ macrophages, and FLT3LG+ macrophages dominant) exhibiting the highest DEMGs score, distinct interactions with other cell components, and relating to poorer prognosis of ischemic events. This study also uncovered a unique SPP1+/VCAN+ macrophage subtype, rare in quantity but significant in influencing AS progression. Machine learning algorithms identified 10 biomarkers crucial for AS diagnosis. The validation of these biomarkers was performed using Mendelian Randomization analysis and in vitro methods, supporting their relevance in AS pathology.
Conclusion: Our study provides a comprehensive view of AS plaque heterogeneity and the prognostic significance of macrophage subtypes in plaque instability.
Keywords: atherosclerosis, macrophage subtypes, single-cell analysis, plaque heterogeneity, biomarkers, pseudo-trajectory analysis
Graphical Abstract:

Introduction
Atherosclerosis (AS) is a chronic inflammatory disease marked by disruptions in lipid metabolism and immune response, resulting from lipid-laden macrophages accumulating in arterial walls.1 This disease is characterized by the formation of plaques within arterial walls, which can lead to life-threatening events such as heart attacks, and strokes.2 Stroke, a consequence of AS with high mortality and disability rates worldwide, affects 30 million people and poses a significant threat to human health. Approximately 795,000 people in the United States experience a new or recurrent stroke annually, 87% of which are ischemic strokes.3 Ischemic strokes, are caused by advanced atherosclerotic plaque (AAS), surface erosion, and rupture, often without warning,4 lead to significant adverse ischemic events (IE). Hence, early detection and prediction of AS plaque instability are crucial. With the deepening of AS-related research, we noticed that the biological properties of macrophages are key to determining lesion size, composition, and instability in AS plaque.5 There are significant differences in immune cell infiltration between early atherosclerotic plaque (EAS) and advanced atherosclerotic plaque. Macrophages in AS plaques demonstrate significant variability and adaptability, modulating their microenvironment through mechanisms such as elevated lipid concentrations, deregulated cytokine functions, hypoxia, apoptosis, and necroptosis.6 Furthermore, oxidative stress and inflammation are interconnected processes that establish a strong feed-forward cycle, accelerating the progression of atherosclerotic plaque.7 A previous study has indicated that excessive mitochondrial reactive oxygen species (mtROS), a byproduct of oxidative stress, inflict damage on mitochondrial DNA (mtDNA), proteins, and lipids. These damages have been observed to escalate during AS progression, influencing whether the system activates or remains unresponsive and ultimately affecting the stability of AS plaques.8 Additionally, the risk of plaque rupture is significantly influenced by inflammatory responses, which are driven by interactions among lipoproteins, monocytes, and various macrophage subtypes. It’s crucial to acknowledge a significant dilemma in current AS research, namely, the evident heterogeneity within the atherosclerotic plaque microenvironment. This heterogeneity primarily stems from the diverse biological functions of macrophage subtypes.9 Simply classifying them as M1/M2 types cannot adequately elucidate the mechanism of action of macrophage subtypes in AAS and is likely to produce deviation.10 Therefore, it is urgent to conduct in-depth research on more effective classification characteristics of AS plaque subtypes and macrophage subtypes, in order to accurately identify patients who will suffer from adverse ischemic events.
Conventional imaging techniques, focusing on plaque appearance and size, are insufficient for predicting rupture risk and acute thrombotic events.11 Macrophage heterogeneity within AS plaques has become a focal point of recent research.12 High-throughput sequencing technologies such as transcriptome analysis (bulk-seq) and single-cell RNA sequencing (scRNA-seq) have provided deep insights into the complexity and dynamic nature of atherosclerotic lesions. In contrast to bulk RNA-seq, which focuses primarily on identifying differentially expressed genes (DEGs) in different groups, scRNA-seq offers diverse perspectives on heterogeneity, cellular interactions, and transcriptome changes, crucial for understanding disease progression. It also enables the identification of distinct cell populations, including various immune cell subtypes within the disease, and offers an in-depth understanding of their roles in disease progression.13–15 However, scRNA-seq’s high cost, small sample size, and limited clinical follow-up information may bias results. Bulk-seq complements single-cell analysis, providing a comprehensive view of gene expression patterns across large cell populations within atherosclerotic tissue. Integrating data from both single-cell and bulk-seq allows for a more holistic understanding of the pathological processes in AS. It also aids in identifying key biomarkers and therapeutic targets for predictive diagnostics, targeted prevention, and personalized treatment strategies, in line with the Predictive, Preventive, and Personalized Medicine (PPPM) model. Partial scRNA-seq analysis has elucidated the transcriptomic profiles of immune cell subpopulations in AS.16,17 However, the prognostic significance of macrophage subtypes and their cellular interactions during AS progression, especially in unstable plaque subtypes, remain poorly understood. Therefore, examining the metabolic features and phenotypic changes in dysregulated macrophage subpopulations linked to AS plaque subtypes, along with identifying more robust diagnostic biomarkers, holds significant clinical importance. Such research could provide a potential treatment for AS by targeting the plaque macrophage microenvironment strategy.
Applying machine learning algorithms, such as weighted correlation network analysis (WGCNA), least absolute shrinkage and selection operator (LASSO), support vector machine (SVM-RFE), and random forest algorithm (RF), to screen for signature genes can further elucidate the characteristic distribution links between macrophage-related biomarkers and inflammatory immune cells, particularly in macrophage subtypes.18 Additionally, a diagnostic model based on these biomarkers has been developed to detect unstable plaques and mitigate AS. The efficacy of this model was assessed using ten machine learning algorithms. This research aims to identify a new characteristic of AS plaque subtype and enhance our understanding of macrophage subtypes in AS, offering insights into their distinct roles and origins, finding reliable biomarkers for diagnosing AS plaque progression, and revealing new molecular mechanisms for AS detection and treatment.
Materials and Methods
Data Collection
The gene expression profiling data and corresponding clinical information for AS were retrieved from the Gene Expression Omnibus (GEO, https://www.ncbi.nlm.nih.gov/geo/) database. Seven GSE datasets (GSE159677, GSE155512, GSE21545, GSE41571, GSE43292, GSE28829, and GSE163154) were selected for further analysis. scRNA-seq data for AS were obtained from GSE159677 and GSE155512, including six carotid atherosclerotic samples and three proximally adjacent vascular samples. The “Seurat” package was utilized to integrate samples from these two datasets, both derived from Illumina sequencing platforms. GSE21545 comprised 223 AS samples with corresponding prognosis information, while GSE41571 included 11 AS samples, with prognosis information available for six samples. GSE28829 included 13 EAS and 16 AAS plaque samples, while GSE43292 comprised 32 EAS and 32 AAS plaque samples. Due to methodological and design similarities between GSE21545 and GSE41571, as well as between GSE28829 and GSE43292, we merged these two pairs of datasets separately for expression analysis. Batch effects were directly adjusted using the combat function of the “sva” package. GSE163154 contained 16 EAS and 27 AAS plaque samples. Probe expression matrices were converted to gene expression matrices using platform annotation files for GSE21545, GSE41571, GSE43292, GSE28829, and GSE163154 datasets. Principal component analysis (PCA) was conducted to assess the effectiveness of the batch effect correction using the combat function. Furthermore, 585 immune-related marker genes (IRGs) were obtained from a previously published article,19 Supplementary Table 1 provides detailed characteristics of the seven datasets.
The Landscape of Immune Cell Infiltrations and Analysis in Bulk Dataset
Single-sample gene set enrichment analysis (ssGSEA) was conducted using the “GSVA” package to quantify the relative infiltration scores of 28 types of immune cells in the GSE21545−41571 dataset.20,21 Kaplan-Meier survival curve were employed to analyze the differences in ischemic event-free survival among AS groups with high and low macrophage infiltration scores. Additionally, the hallmark gene set (h.all.v7.5.1.symbols.gmt) was obtained from the Molecular Signatures Database (MSigDB, http://www.gsea-msigdb.org/gsea/msigdb/index.jsp). Spearman correlation was utilized to assess the relationship between macrophage infiltration scores and various hallmark gene sets. The “limma” package was used to identify DEGs between high and low macrophage infiltration score groups in AS, with a filter criterion of |logFC| > 0.4 and adjusted p-value < 0.05. Visualization was performed using the “ggstatsplot”, “IOBR”, and “ggplot2” packages.
Identification of AS Plaque Subtypes and It’s Biofunction
Based on the expression profiles of 130 DEIRGs in the GSE21545-41571 dataset, we used unsupervised k-means clustering analysis in the “ConsensusClusterPlus” package to divide AS plaques into three clusters. The number of repetitions was set to 1000 to ensure the stability of clustering. Survival analyses and PCA were performed to evaluate prognostic values and the distribution within three clusters. Meanwhile, we performed an ssGSEA algorithm to quantify the infiltration scores of the various immune cells among three clusters, and the hallmark gene set was used to assess the biological function differences among three clusters. Furthermore, Gene Set Variation Analysis (GSVA) was applied using the “GSVA” and “limma” packages to evaluate the pathway activities in these clusters (adjusted p-value < 0.05 and |t-value| > 1 were selected). The gene expression of immune checkpoints was quantified between these clusters. Immune checkpoints were collected from the literature.22
Weighted Gene Co-Expression Network Analysis
WGCNA was used to construct highly correlated co-expressed gene modules associated with cluster 3 plaque subtype. Briefly, the adjacency matrix was established based on the soft power value ß and the similarity matrix was calculated by Pearson correlation analysis between each gene. Then, with a threshold soft power of 8 in the GSE21545-41571 dataset, the adjacency matrix was transformed into a topological overlap matrix (TOM) and the corresponding dissimilarity (1-TOM). Next, genes with similar expression profiles were classified into modules to further build a hierarchical clustering dendrogram (minModuleSize = 80, mergeCutHeight = 0.25). Finally, we calculated the gene significance (GS) and module membership (MM) through WGCNA. This study focused on gene modules significantly associated with the cluster 3 plaque subtype.
Define DEMGs and Enrichment Analysis
Differentially Expressed Macrophage-Related Genes (DEMGs) were identified through the intersection of WGCNA gene modules correlated with the cluster 3 plaque subtype and the previously identified 130 DEIRGs. Gene Ontology (GO) annotation and Kyoto Encyclopedia of Genes and Genomes (KEGG) enrichment analysis were conducted on the DEMGs. Enrichment analyses were performed based on the “clusterProfiler” package with a p-value < 0.05 as the cutoff criterion. Visualization was achieved using the “circlize”, “ComplexHeatmap”, and “ggplot2” packages.
ScRNA-Seq Data Processing
The “Seurat” package was used to analyze the scRNA-seq data. First, quality control was conducted by filtering out cells satisfying the following criteria: cells with > 200 and < 4000, and a percentage of mitochondrial and ribosomal genes < 10%. Next, a global-scaling normalization method (“LogNormalize”) was applied to equalize the total gene expression in each cell, with a set scale factor of 10,000. The top 2000 variably expressed genes were returned for downstream analysis using the “vst” method. The ScaleData and RunPCA functions to obtain the number of principal components (PCs), and the top 30 PCs were further used for downstream integration. Afterwards, the data were processed by homogenization using the “harmony” package.23 Clustering analysis was conducted utilizing edge weights between individual cells, generating a shared nearest-neighbor graph via the Louvain algorithm, seamlessly integrated into the FindNeighbors and FindClusters functions. The cell cluster/sub-cluster analysis with the resolution set to 0.4 and 1. The identified clusters were visualized using the Uniform Manifold Approximation and Projection (UMAP) method. The cell clusters were labeled as different major cell types based on DEGs and classical marker genes. For sub-clustering analysis, we performed the second-round PCA reduction, harmony homogenization and UMAP projection separately on cells within myeloid cell. The second-round dimension reduction and clustering revealed 10 distinct myeloid subtypes. Cell types were visualized using UMAP plots, displayed by the “scRNAtoolVis” package. We obtained DEGs of different macrophages subtypes using the FindAllMarkers function, and the Wilcoxon rank sum test algorithm was used to calculate the marker genes (logFC > 0.25; p-value < 0.05; min.pct > 0.1). Furthermore, we use the CellMarker2 database (http://bio-bigdata.hrbmu.edu.cn/CellMarker/index.html) and the “SingleR” package to assist with annotation cell types. The “ggplot2”, “ggalluvial”, and “pheatmap” package were used to display the cellular composition and correlation between normal and AS groups.
Evolutionary Trajectory Analysis
To investigate dynamic biological processes, such as interconversion and evolutionary trajectories of macrophages. We first extracted macrophage subtype objects for trajectory analysis using the “Monocle2” package. 2500 significantly pseudotime-dependent genes were identified by the differentialGeneTest function and used for cell ordering. Then we used the “DDRTree” method to reduce cell dimensions and calculated the cell differentiation state types using the reduceDimension function. Finally, we used the plotCellTrajectory function to visualize the differentiation trajectory of DEMGs score/macrophage subtypes/ in the three-state differentiation process (Pre-branch, Cell fate 1, Cell fate 2) for the macrophage subtypes, and the plot_pseudotime_heatmap function was used to visualize the expression patterns of 43 DEMGs in different macrophage subtypes. Branched Expression Analysis Modeling (BEAM) analysis was used to identify DEGs associated with differentiated macrophage states (q-value < 1e-200 were selected), which were then visualized using the plot genes branched heatmap function. Based on the enrichment scores of Cell fate 2’s DEGs calculated using the “GSVA” package, we conducted survival analysis. Furthermore, we conducted enrichment analysis to clarify the biological functions of DEGs associated with differentiated macrophage states (p-value < 0.05). CytoTRACE scores were calculated using the “CytoTRACE” package (version 0.3.5) to verify the linear transitions inferred by Monocle. The CytoTRACE algorithm can infer developmental initiation stages of macrophage subtypes from scRNA-Seq data based on stemness scores.24 The “ggridges” package was used to analyze the distribution of macrophage subtypes across different groups/states along the pseudotime axis.
Identification of DEMGs Score and Pathways Activities in Different Cell Types/States
For scRNA-seq data, we calculated DEMGs enrichment scores at a single-cell resolution using the AddModuleScore function in the “Seurat” package. Additionally, the “ggpubr” package was used for visualizing DEMGs scoring across different states generated with Monocle. We also assessed whether fifty hallmark gene sets were enriched in myeloid subtypes using the RRA method of the “irGSEA” package. Signature genes of hypoxia, angiogenesis, cholesterol homeostasis, and fatty acid metabolism were obtained from fifty hallmark gene sets in MSigDB. Inflammatory genes included TNF, CCL2, CCL3, CCL4, CXCL10, S100A8, S100A9, CXCL1, and MPO. And then, the AUCell algorithm with default settings was used to infer these three AS-related pathways (hypoxia, inflammatory, and fatty acid metabolism) score for myeloid subtypes embedding the UMAP plot. Furthermore, the Ucell algorithm in the “Ucell” package was used to evaluate the enrichment scores of the AS-related pathways in different groups/states, as pseudo-trajectory time progressed.
SCENIC Analysis
The Single-Cell Regulatory Network Inference and Clustering (SCENIC) method was employed to define regulons, which are complexes consisting of a transcription factor (TF), its potential targets, and their activity levels. Macrophage subtypes in different states confirmed using Monocle were further included in SCENIC, and they were then sorted based on states. This process begins with a count matrix representing gene abundances across all macrophage subtypes and unfolds in three steps. Initially, co-expression modules are deduced using “GRNBoost2”, a regression approach targeting individual genes. Further, “cisTarget” is utilized to remove indirect targets from these modules by identifying cis-regulatory motifs. The final step involves quantifying regulon activity by calculating an enrichment score for the target genes of the regulon (AUCell). We employed the “pySCENIC” package, a Python-based tool of the SCENIC pipeline, to analyze TF activity. This study utilized its command-line version, databases for cis-target (hg38_10kbp_up_10kbp_down_full_tx_v10_clust.genes_vs_motifs.rankings.feather), and TF motifs (motifs-v10nr_clust-nr.hgnc-m0.001-o0.0), along with specific command-line parameters. All 1892 TFs with available motifs in the database were included as input. Lastly, the “CalcRSS” function was employed to pinpoint regulons with high Regulon Specificity Scores (RSS), facilitating the identification of macrophage subtypes/states-specific regulons based on RSS ranking, and regulon modules are identified according to connection specificity index (CSI).25 Further details of the SCENIC analysis are described in a previous study.26
Metabolism Pathways Analysis at the Single-Cell Resolution
To assess metabolic activity at the single-cell level, “scMetabolism” package, a novel computational framework for single-cell metabolic activity quantification, was used.27 This method calculates a metabolic activity score for each cell across various metabolic pathways using a single-cell matrix and the Vision algorithm. This package is preloaded with KEGG pathways and Reactome entries. The Vision algorithm also calculates the metabolic score. We compared metabolic activities across different groups/states in various pathways to identify significant differences. For this analysis, we employed the “VISION” method using KEGG metabolic gene sets. Visualization of the results was achieved using the DotPlot.metabolism and BoxPlot.metabolism functions.
Intercellular Communication Analysis
The “CellChat” package was used to infer and visualize the intercellular communication networks between macrophage subtypes and other immune cells at the single-cell levels. This method can predict major signaling inputs and outputs for macrophage subtypes and how those ligand–receptor interactions and specific signaling pathways for functions using network analysis and pattern recognition approaches. The “CellChat” was conducted as described previously,28 and the “circlize” package was used for visualization.
Deconvolution of Cell Type and Gene Expression in AS
The BayesPrism model was employed to construct a matrix from the scRNA-seq of AS as a reference to deconvolute the immune cell abundances of macrophage subtypes in the bulk-seq datasets of AS plaque.29 The scRNA-seq reference were obtained from GSE159677-155512. Default parameters were used for the deconvolution analysis. The BayesPrism model showed the best overall performance and robustness compared to eight other deconvolution methods when deconvolving granular immune lineages, as demonstrated in previously research.30 Spearman correlation of macrophage subtypes abundances was evaluated using the “corrplot” package. Kaplan-Meier survival curves were employed to analyze the differences in ischemic event-free survival between groups with high and low macrophage subtypes abundances in AS plaques. Visualization was performed using the “ggstatsplot” and “ggplot2” packages.
To Explore the Diagnostic Value of Biomarkers in AS by Multiple Machine Learning Algorithms
We used Venn diagram to intersect marker genes identified through scRNA-seq datasets and DEMGs in the bulk-seq. Thus, we obtained biomarkers highly associated with the macrophage subtype in the cluster 3 plaque subtype. The diagnostic value of biomarkers in AS was determined via integrated analysis using three machine learning algorithms: LASSO, RF, and SVM-RFE. Moreover, ROC curve analysis using the “pROC” package to assessed the diagnostic value of biomarkers in multiple GEO datasets. Subsequently, the diagnosis biomarkers were used to construct a diagnostic model in AS, and the model’s performance was evaluated by 10 machine learning algorithms using the “mlr3verse” package. Additionally, the reliability of diagnostic model was validated using the GSE21545-41571 and GSE163154 datasets. The expression of biomarkers in different groups and their correlation with 28 types of immune cells were calculated and visualized using the “ggpubr” and “circlize” packages. Kaplan–Meier survival analysis curves for high versus low biomarker gene expression groups in AS plaques were generated using the “survival” package.
Mendelian Randomization Analysis in AS
Additionally, for biomarkers exhibiting an area under curve (AUC) < 0.6, we executed a two-sample Mendelian Randomization (MR) analysis using the “TwoSampleMR” and “coloc” packages. This analysis was aimed to investigate whether the genetic determinants (eQTLs) associated with these low-AUC biomarkers play a causal role in the advancement of AS. eQTLs linked to AS were identified using the publicly accessible genome-wide association study (GWAS) datasets from the IEU OpenGWAS database (https://gwas.mrcieu.ac.uk/). We extracted eQTLs related to the biomarker as the exposure factor from public databases.31 Significant SNPs were selected as instrumental variables by setting a p-value < 5×10⁻⁸ and performing population stratification. F-statistics were calculated for the selected eQTLs to assess the strength of instrumental variables. Only eQTLs with F-statistics greater than 10 were retained for further analysis.32 In case of multiple instruments, the inverse variance weighting (IVW) method was used, which uses information on all instruments. Additionally, assessments for reverse causality and colocalization analysis were conducted to determine the pleiotropy between FLT3LG’s eQTL and AS shared the same genetic variation.
Mice Atherosclerotic Experiments
Twelve male ApoE−/− mice, aged 20 weeks, were obtained from Wuhan Servicebio Technology Co., Ltd., for animal experiments. After acclimating for four weeks with a standard chow diet (SCD) (SCD obtained from Jiangsu Xietong Pharmaceutical Bio-engineering Co., Ltd., Nanjing, China) and water, six ApoE−/− mice were switched from SCD to an atherogenic high-cholesterol diet (HCD) (20% kcal protein, 40% kcal fat, and 40% kcal carbohydrate; Beijing Hfk Bioscience Co. Ltd., Beijing, China) for a 16-week long feeding period. Six additional mice, serving as a negative control group, were fed SCD for 16 weeks. In the final stage of the study, all mice were sacrificed by intraperitoneal injection of sodium pentobarbital (60 mg/kg) and euthanized to obtain aortic samples.
Quantitative Real-Time Polymerase Chain Reaction and Western Blot
Biomarker expression was detected by qPCR to validate our bioinformatics results. Total RNA extraction and qPCR were conducted as previously described.33 Glyceraldehyde 3-phosphate dehydrogenase (GAPDH) was used as an internal control gene. The relative expression level of the target gene was calculated using the 2−ΔΔCt method. The qPCR forward and reverse primer sequences are as follows: (1) GAPDH, CCTCGTCCCGTAGACAAAATG, and TGAGGTCAATGAAGGGGTCGT; (2) CD36, GGAACTGTGGGCTCATTGCT, and CAACTTCCCTTTTGATTGTCTTCTC; (3) FCER1G, CCGTGATCTTGTTCTTGCTCCT, and GGCTCGGAGAGAATTAGAAGTGG; (4) VAMP8, CTGCCTTGGGTGGAAACAGA, and TTGTTTCGGAGGTGGTCCAG. Western blotting (WB) was performed as previously described17 with primary antibodies against HSP70 (GB12241, Servicebio, China), CD36 (GB112562, Servicebio, China), and FCER1G (BS-13167R, Bioss, China). Western blots were quantified by densitometric analysis with ImageJ software V1.53a.
Multiplex Immunofluorescence Staining
Tissue slices of mouse arterial tissues were obtained from samples set in paraffin. A multiplex immunofluorescence staining assay was conducted as previously described.17 Primary antibodies included anti-CD68 (1:3000, GB113109, Servicebio, China), anti-FCER1G (1:200, BS-13167R, Bioss, China). Slides were counterstained with DAPI (1:5, G1012, Servicebio, China) at room temperature for 10 min. Multispectral images were acquired and performed using a fluorescence microscope (Nikon Eclipse C1, Nikon, Japan) and ImageJ software V1.53a.
Statistical Analysis
The bioinformatics analysis was conducted with R software (version 4.2.1). Survival differences between groups were assessed using Kaplan-Meier curves and Log rank tests. p-value < 0.05 was considered statistically significant. Correlation analysis was performed by Pearson and Spearman correlation. P-value < 0.05 was deemed statistically significant in all cases. Statistical analyses and graphs were performed using GraphPad Prism (version 8 GraphPad Software, La Jolla, CA, USA).
Results
Identification and Analysis of High Infiltration Macrophage-Score DEGs in AS
We combined the gene expression matrices GSE21545 and GSE41571 after removing batch effects and standardization, resulting in a total of 229 AS samples with prognostic information related to ischemic events. Supplementary Figure 1 demonstrates the absence of apparent batch effects between the two pairs of datasets after batch removal. Applying a deconvolution method based on ssGSEA, we evaluated the infiltration scores of 28 immune cell types in 229 AS samples (Figure 1A). AS samples were then categorized into high and low macrophage score groups based on the median value of macrophage infiltration scores. As anticipated, survival analysis showed significantly lower ischemic event-free survival in the high macrophage score group compared to the low group (Figure 1B, p-value < 0.05). Further, we identified 1438 up-DEGs in the high macrophage score group (Figure 1C). Utilizing the hallmark gene set from MsigDB, we conducted Spearman correlation analysis to assess the relationship between high macrophage infiltration scores and various hallmark gene sets. A significant positive correlation was found between high macrophage infiltration scores and multiple immune signaling pathways, including inflammation response, pyroptosis, and autophagy (Figure 1D and E). Conversely, a negative correlation was noted with epithelial-mesenchymal transition (EMT) and cholesterol homeostasis. Previous studies have shown that as inflammatory macrophages are continuously activated, the microenvironment within atherosclerotic plaques experiences increasingly intense and complex inflammatory responses.34–36 Combine our results above suggest a complex interplay of immune-inflammatory reactions associated with macrophage infiltration. To clarify the immune-related functions of up-DEGs, we intersected them with 585 IRGs identified in a prior study.19 This process yielded 130 distinct differentially expressed immune-related genes (DEIRGs) (Figure 1F).
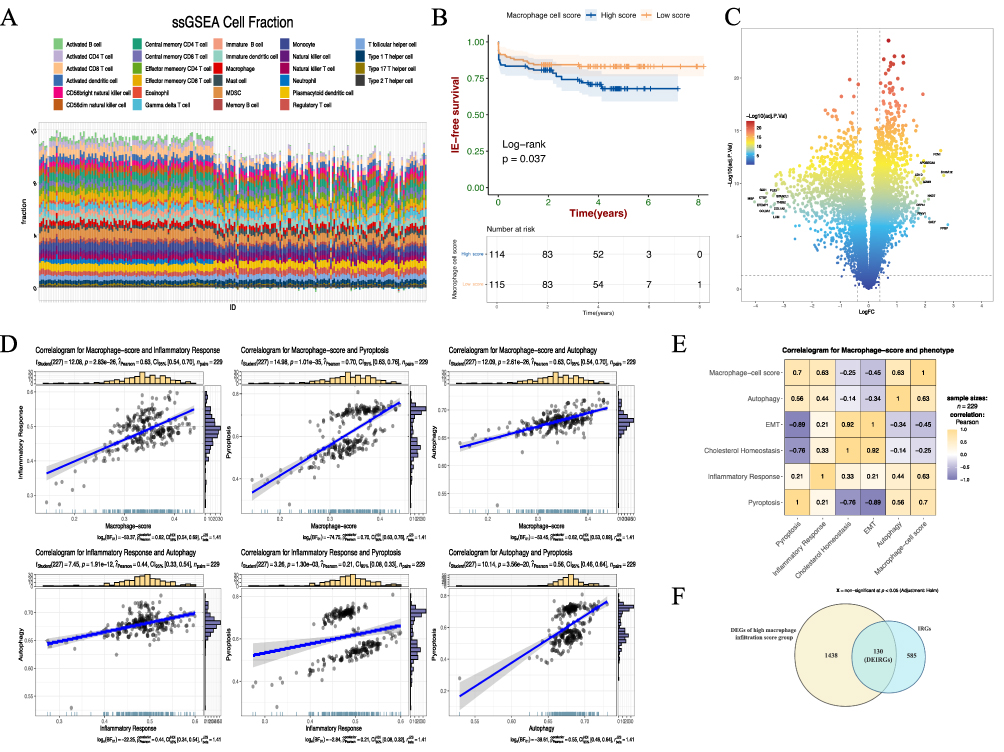 |
Figure 1 Identification of 130 DEIRGs in high macrophage infiltration AS samples. (A) Infiltration scores of 28 immune cell types in 229 AS samples. (B) Kaplan–Meier analysis showed the differences between AS samples with high and low macrophage infiltration scores. (C) Volcano plot of mRNA expression between high and low macrophage infiltration score groups in AS. (D) Scatter plot of correlation between macrophage infiltration score and immune-related pathways with the linear model. (E) Heatmap of the correlations between macrophage infiltration score and five pathways. (F) Venn plot of 130 DEIRGs based on up-DEGs from high macrophage infiltration score groups and IGRs. |
Distinguishing Characteristics and Functional Attributes Indicative of a Poorer Prognosis in AS Plaques Subtypes
To further unravel potential mechanisms and subtype characteristics of AS plaques, we applied unsupervised clustering to 130 previously identified DEIRGs. This analysis revealed distinct clustering of 131 carotid atherosclerotic plaques into three clusters: cluster 1, cluster 2, and cluster 3. Intriguingly, DEIRGs demonstrated significantly increased expression in the cluster 3 plaque subtype. Notably, most plaques linked to ischemic events were categorized within this cluster. Furthermore, DEIRGs showed reduced expression in cluster 2, whereas cluster 1 exhibited expression levels intermediate to both clusters (Figure 2A). This finding has not been observed in prior similar studies.16,17 Survival analysis demonstrated significant prognostic differences among the three subtypes, with cluster 3 plaque subtype exhibiting markedly lower ischemic event-free survival (p-value < 0.01) (Figure 2B). PCA results further indicated distinct separation among the three clusters, suggesting diverse features and functions among three plaque subtypes (Figure 2C). Through ssGSEA of the immune landscape, we observed increased infiltration of 28 immune cell types in the cluster 3 plaque subtype. In contrast, the lowest infiltration was noted in cluster 2, with cluster 1 exhibiting intermediate levels (Figure 2D). This variation in immune cell infiltration corresponded with the DEIRGs expression patterns across three AS plaque subtypes, suggesting a potential link between the cluster 3 subtype and more prevalent immune inflammatory responses. Moreover, by employing hallmark gene sets, we evaluated the biological functions of the different plaque subtypes. Consistently, the cluster 3 subtype showed increased expression in several immune-inflammatory signatures, such as apoptosis, autophagy, ferroptosis, pyroptosis, complement activation, fatty acid metabolism, hypoxia, and inflammation (p-value < 0.05). Conversely, no significant differences or lower expression were observed in signatures related to cholesterol homeostasis and EMT (Figure 2E). Given the evident biological functional differences between cluster 3 and the other two clusters, we designated cluster 3 as the Differentially Expressed Macrophage-Related Genes (DEMGs) cluster, while clusters1 and 2 were defined as non-DEMGs clusters. GSVA analysis revealed that the DEMGs cluster was implicated in various immune cell-related signaling pathways, while non-DEMGs clusters were associated with EMT-related signaling pathways, such as vascular smooth muscle contraction and cell adhesion aggregation (Figure 2F and Supplementary Figure 2). Additionally, we assessed the expression of immune checkpoint-related genes in the DEMGs and Non-DEMGs clusters, and as anticipated, multiple immune checkpoint genes were upregulated in the DEMGs cluster, suggesting a more intense immune cell response and inflammatory gene expression in this cluster (Figure 2G).
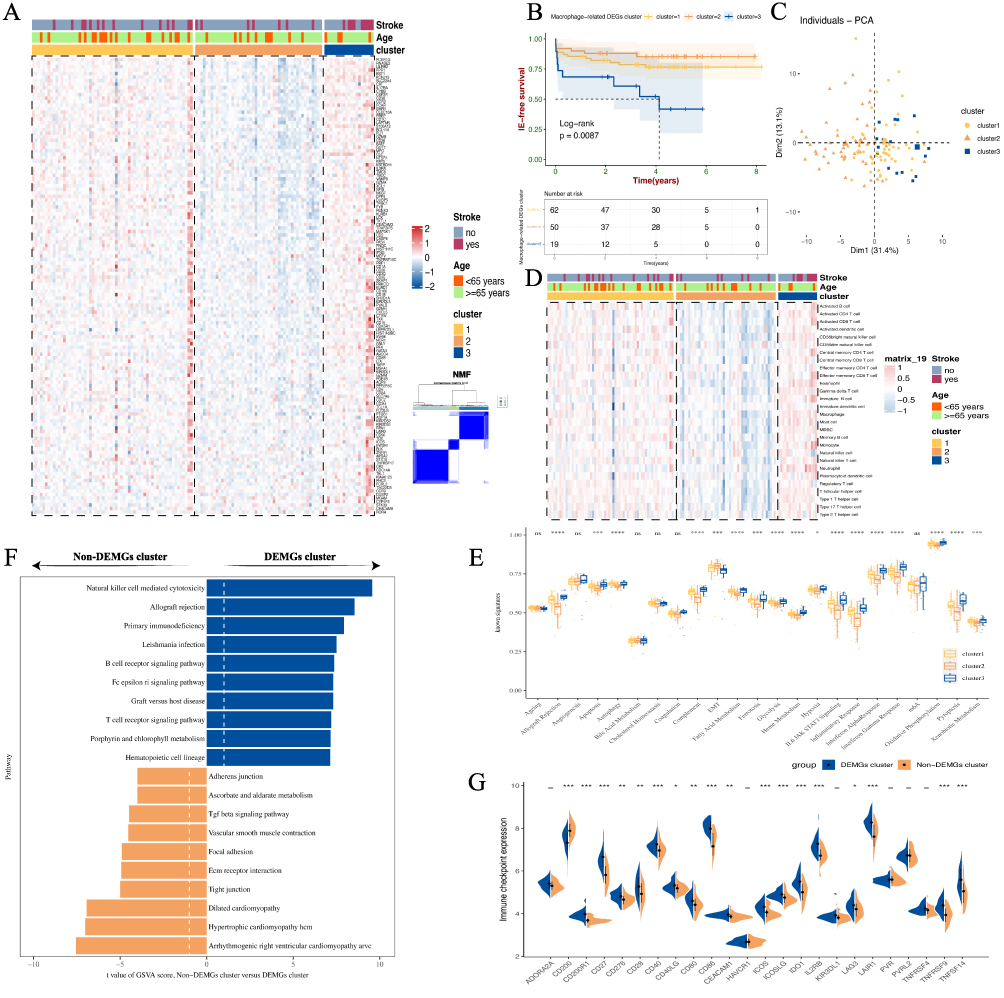 |
Figure 2 The consensus clustering of 130 DEIGRs indicated prognostic differences among AS plaque subtypes. (A) The mRNA expression pattern of 130 DEIGRs were observed across the three AS plaque subtypes. (B) Kaplan‐Meier analysis revealed poorer prognosis in the cluster 3 plaque subtype compared to clusters 1 and 2 in AS. (C) PCA analyses showed that the three clusters were fine isolated. (D) Three AS plaque subtypes have different Immune cell infiltration pattern. (E) Three AS plaque subtypes had different biofunction through using the ssGSEA algorithm of well-known signatures. (F) Top 10 KEGG pathways ranked by GSVA score differences between non-DEMGs cluster vs DEMGs cluster. (G) The differences of expression patterns of immune checkpoint-related genes between non-DEMGs cluster vs DEMGs cluster. *p < 0.05; **p < 0.01; ***p < 0.001; and ****p < 0.0001. “ns” indicates not significant (p > 0.05). |
Identification of DEMGs in AS Plaque Subtypes Through WGCNA
The WGCNA was employed to determine the association of the 1438 up-DEGs with the cluster 3 plaque subtype. Illustrated in Figure 3A, we set the optimal soft threshold for WGCNA at 8. The black and brown gene modules showed a positive correlation with the cluster 3 plaque subtype, with correlation coefficients of 0.28 and 0.35, respectively (Figure 3B and C, both p-values < 0.05). Moreover, the gene significance of the black and brown modules within cluster 3 exhibited correlation coefficients of 0.6 and 0.37, with p-values < 0.01 (Figure 3D). These results suggest a strong positive correlation between the genes in the black and brown modules and the cluster 3 plaque subtype. Gene modules within the black and brown categories of the WGCNA, which intersect with the previously identified 130 DEIRGs, were defined as DEMGs (Figure 3E). This intersection yielded 43 DEMGs that exhibited a high correlation with the cluster 3 plaque subtype. Consequently, these genes were designated as pivotal in the differential macrophage expression associated with the cluster 3 plaque subtype. GO enrichment analysis of these 43 DEMGs indicated their involvement in positive immune regulation functions, such as the positive regulation of inflammatory effector process, positive regulation of macrophage cytokine production, regulation of platelet activation, and regulation of inflammatory responses (Figure 3F). KEGG analysis revealed that these DEMGs are implicated in immune-inflammatory and lipid metabolism-related signaling pathways, including platelet activation, digestion and absorption of fats, cholesterol metabolism, lipid and atherosclerosis, PI3K-Akt signaling pathway, NF-κB signaling pathway, inflammatory factor interactions, and cell autophagy (Figure 3G). Both GO and KEGG enrichment analyses collectively suggest the participation of these DEMGs in the formation of cluster 3 subtype plaques and their involvement in intricate immune-inflammatory activities within the plaque.
 |
Figure 3 Identification of DEGs correlated with the cluster plaque subtype based on WGCNA. (A) Selection of the soft threshold powers when the scale-free fit index reaches 0.8 and the mean connectivity for various soft threshold powers. (B) Establishment of co-expressed gene modules based on a hierarchical clustering algorithm. (C) Correlations between the gene modules and three AS plaque subtypes. The number at the top of each square indicates the correlation coefficients and the p-values shown in the brackets below (red indicates a positive correlation, blue indicates a negative correlation, and the depth of the color indicates the degree of correlation). (D) Scatter plot of correlation of MM with GS in black and brown modules, respectively. (E) Venn plot of 43 DEMGs based on WGCNA genes and 130 DEIRGs. (F) Circle plots of GO annotation (BP, CC, and MF) of 43 DEMGs in AS. (G) KEGG pathways enriched by 43 DEMGs in AS. |
A Single-Cell Transcriptomic Atlas of Paired Human Carotid Artery and Carotid Atherosclerotic Plaque
To provide a more comprehensive understanding of the immune cell composition and potential intercellular connectivity patterns within the cluster 3 plaque subtype, we integrated data from a total of nine single-cell samples sourced from two datasets, GSE159677 and GSE155512. These samples included six carotid atherosclerotic plaques and three adjacent normal vascular tissues. Following data processing and quality control procedures, a total of 54,701 single cells were subjected to subsequent analysis. The major cell-type annotation was performed based on the “SingleR” package and classical gene markers to identify cell types. Ultimately, we identified eight major cell types, including B cells, myeloid cells, endothelial cells, fibroblasts, smooth muscle cells, T cells, NK cells, and mast cells (Figure 4A). The major cell-type atlas showed a significant increase in myeloid cells within the AS group (Figure 4B), and the quality control results for the nine single-cell samples indicated no apparent heterogeneity between samples. The mRNA quantity and mitochondrial ratio in each sample were controlled within a reasonable range (Figure 4C). Additionally, we observed significant changes in cell distribution in the AS compared to the normal group: myeloid cells and T cells increased markedly, whereas endothelial cells and fibroblasts showed a notable decrease in distribution proportions (Figure 4D and E). To assess the impact of gene changes in major cell types between the AS and normal groups, hierarchical clustering was performed based on the expression changes of major cell type genes relative to the normal group. The results clearly indicated an aggregation of these eight major cell types in the AS group (Figure 4F). Moreover, there were similar transcriptional features between the AS and normal groups, further confirming the accuracy of our cell-type annotation. Furthermore, using the 43 DEMGs, we calculated enrichment scores for eight major cell types employing the “AddModuleScore” function. Notably, the DEMGs score exhibited a significant elevation in myeloid cells (Figure 4G). This finding aligning with previous studies,36,37 suggests that the polarization of subtype cells in myeloid cells may be a crucial factor contributing to plaque instability.
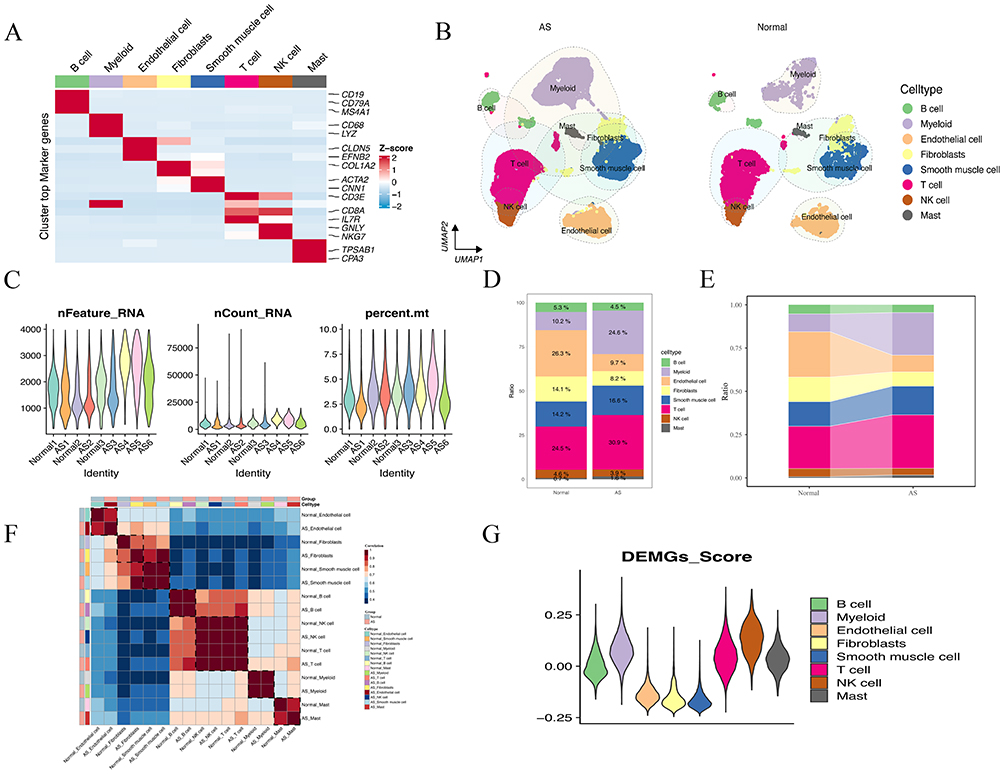 |
Figure 4 Single-cell profile between AS and normal groups. (A) Heatmap plot visualizes the classical markers for each cell type. (B) UMAP plot visualizing eight major cell types identified from scRNA-seq in AS vs normal groups. (C) Violin plot of quality for nine samples in scRNA-seq data. (D) Bar graph showing the percentages of eight major cell types in AS vs normal groups. (E) The percentage of eight major cell types according to their origins from AS tissue. (F) The hierarchical clustering heatmap shows the correlation between eight major cell types in AS vs normal groups. (G) Violin plot shows the DEMGs score for eight major cell types. |
Identification of Macrophages Subtypes Related to DEMGs Score in AS at a Single Cell Resolution
We further isolated 11,584 myeloid cells for secondary clustering and annotation. Through literature searches and the identification of classical gene markers, we successfully annotated a total of ten myeloid subtypes. These include classical monocytes, DC1 cells, DC2 cells, DC3 cells, SPP1+/VCAN+ macrophages (Mac-C1-SPP1/VCAN), SPP1+ macrophages (Mac-C2-SPP1), IL1B+ macrophages (Mac-C3-IL1B), TREM2+ macrophages (Mac-C4-TREM2), FLT3LG+ macrophages (Mac-C5-FLT3LG), and monocyte-like macrophages (Monolike Mac). As illustrated in Figure 5A, we employed multiple classical gene markers to annotate these ten myeloid subtypes. Notably, the classical gene markers for SPP1+/VCAN+ macrophages and SPP1+ macrophages exhibited significantly higher expression in the AS group, suggesting these two macrophages may be AS-induced. Previous literature has reported the unique functions of SPP1+ macrophages, including slowed cholesterol clearance, enhanced vascularization, and glycosylation effects.16,38,39 Interestingly, the gene expression profile of Mac-C1-SPP1/VCAN not only include the classical gene markers of SPP1+ macrophage but also includes inflammatory, angiogenesis and lipid generation-related genes, such as EREG, VCAN, and AQP9. These results implied that Mac-C1-SPP1/VCAN may represent a novel macrophage subtype with more intense inflammatory and angiogenesis reactions based on SPP1+ macrophage subtype. Additionally, the single-cell atlas indicates that Mac-C1-SPP1/VCAN is closer in distance to Mac-C3-IL1B and Mac-C5-FLT3LG, suggesting potential functional similarities and closer cell connections among these three subtypes (Figure 5B). Concurrently, as depicted in Supplementary Figure 3, the distribution of Mac-C1-SPP1/VCAN, Mac-C3-IL1B, and Mac-C5-FLT3LG gradually increases in AS. However, the distribution patterns of these subtypes in nine single-cell samples suggest a decrease in these three macrophage subtypes in AS. We attribute this result to these three macrophage subtypes being relatively rare cell types in AS4, AS5, and AS6 samples, with an uneven proportion of each AS sample compared to normal groups. The higher number of AS samples may have statistically diluted the proportion of these rare macrophage subtypes (Figure 5C). Based on the previously identified 43 DEMGs, we conducted a subsequent enrichment scoring for these ten myeloid subtypes (Figure 5D). Interestingly, we observed a significant upregulation of DEMGs scores in Mac-C1-SPP1/VCAN, Mac-C3-IL1B, and Mac-C5-FLT3LG, suggesting that these three macrophage subtypes may contribute to the increased instability of plaques. Single-cell pathway enrichment analysis was conducted on fifty hallmark gene sets, focusing on the ten identified subtypes of myeloid cells. The results indicate that Mac-C1-SPP1/VCAN is significantly upregulated in angiogenesis, while oxidative phosphorylation and oxygen responses are significantly downregulated. Mac-C3-IL1B is significantly upregulated in angiogenesis, NF-κB signaling pathway, inflammatory response, and IL6-JAK-STAT3 signaling pathway. Mac-C5-FLT3LG is significantly upregulated in NF-κB signaling pathway and apoptosis (Figure 5E). These findings suggest that these three macrophage subtypes may primarily exert biological functions such as angiogenesis, regulation of immune inflammatory responses, and apoptosis. We also conducted enrichment scoring for three AS-related pathways embedded in the UMAP plot: fatty acid metabolism, inflammation, and hypoxia. Interestingly, the high-enrichment regions of these three pathways correspond one-to-one with the regions of the three macrophage subtypes mentioned above (Figure 5F).
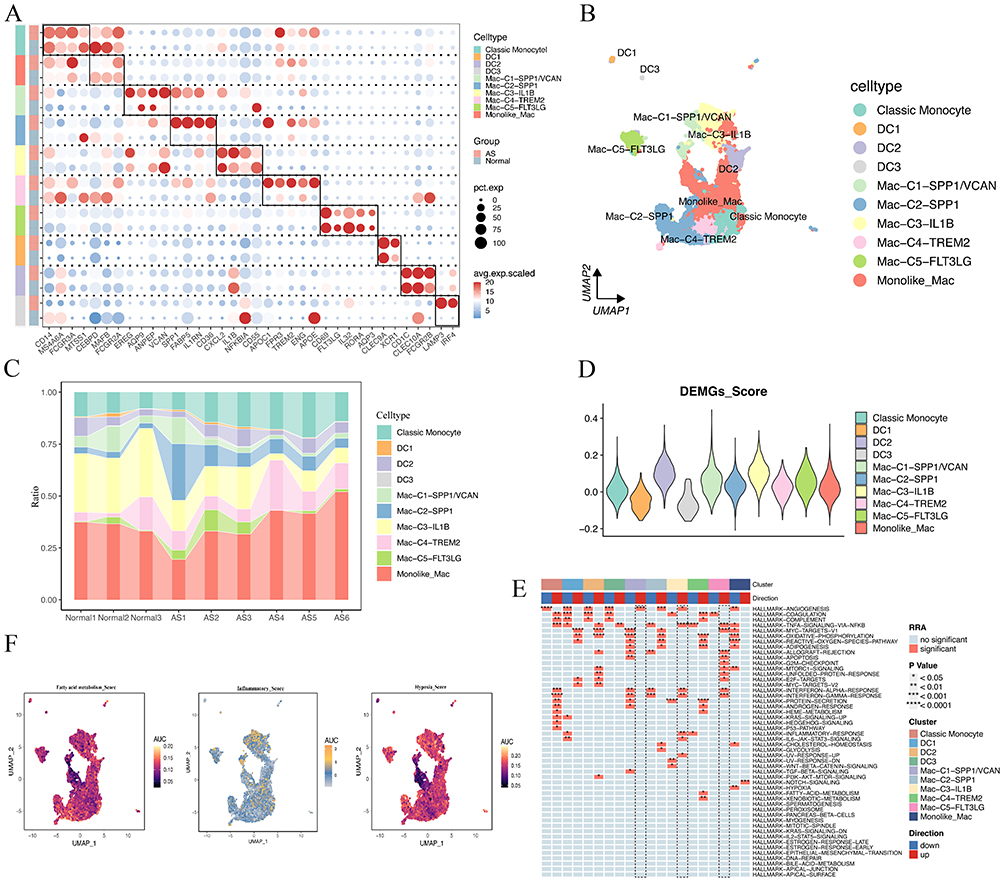 |
Figure 5 Characterization of macrophage subtypes in AS. (A) Bubble plot shows the average expression of the classical markers for 10 myeloid subtypes in AS vs normal groups. (B) UMAP plot visualizing 10 myeloid subtypes identified from scRNA-seq. (C) The percentages of 10 myeloid subtypes across nine samples. (D) Violin plot shows the DEMGs score for 10 myeloid subtypes. (E) Enrichment scores of fifty hallmark gene sets for 10 myeloid subtypes in AS vs normal groups. (F) UMAP plot showing the enrichment regions of three AS-related pathways using the AUCell algorithm. |
Evolutionary Trajectory Analysis of Macrophages Subtypes in AS
Due to the proximity observed on the UMAP plot among three subtypes of macrophages, namely Mac-C1-SPP1/VCAN, Mac-C3-IL1B, and Mac-C5-FLT3LG. We conducted further pseudo-trajectory analysis to investigate the dynamic immune states and cellular differentiation trajectories of these macrophage subtypes. Simultaneously, we utilized two algorithms, “CytoTRACE” and “Monocle2”, to mutually validate and infer the developmental initiation stages of the macrophages. Impressively, two distinct activation paths emerged, suggesting a three-state differentiation process for the macrophage subtypes, namely state1, state2, and state3 (Figure 6A). Both algorithms indicated that state2 represents the initiation stage of development, characterized by generally high stemness scores and the earliest development onset. State2 then differentiates into state1 and state3 via node1. We defined these three states inferred from the trajectory distribution as Pre-branch, Cell fate 1, and Cell fate 2. Notably, significant differences in the distribution of macrophage subtypes were observed under different activation paths. Specifically, Pre-branch was mainly dominated by Monolike Mac and Mac-C4-TREM2, Cell fate 1 was mainly dominated by Mac-C1-SPP1/VCAN and Mac-C2-SPP1, and Cell fate 2 was mainly dominated by Mac-C1-SPP1/VCAN, Mac-C3-IL1B, and Mac-C5-FLT3LG (Figure 6A). Ridgeline plot indicates that among the macrophage subtypes, those in the Pre-branches show the earliest activation in development time. In contrast, the subtype under Cell Fate 1 exhibits the latest activation. The subtype (Mac-C1-SPP1/VCAN, Mac-C3-IL1B, and Mac-C5-FLT3LG) associated with Cell Fate 2, on the other hand, displays activation at a mid-to-late stage in the development timeline (Figure 6B). Consistent with expectations, pseudo-trajectory analysis of the AS-related pathways revealed that as pseudo-trajectory time progressed, AS group showed increasing expression scores in four pathways: angiogenesis, fatty acid metabolism, cholesterol homeostasis, and hypoxia. In contrast, the normal group exhibited the opposite trend. Interestingly, Cell fate 2 also demonstrated the highest expression scores in these four pathways, showing a similar expression trend to the AS group (Figure 6C). This finding suggests a key role of these three macrophage subtypes within Cell fate 2 in AS formation. Furthermore, we assessed the enrich trends of DEMGs scores across the three stages. Surprisingly, the DEMGs scores gradually increased along the activation trajectory of Cell fate groups and were significantly higher in Cell fate 2 than in Cell fate 1/Pre-branch (p < 0.0001) (Figure 6D). Subsequently, we investigated the transcriptional changes associated with the differentiation state of DEMGs and observed that, except for DPP4, PTGS1, LAPTM5, and TMC6, the gene expression trends of other DEMGs gradually upregulated with pseudo-trajectory time change, mirroring the expression trend of Mac-C1-SPP1/VCAN, Mac-C3-IL1B, and Mac-C5-FLT3LG macrophage subtypes (Figure 6E). Additionally, our SCENIC analysis of macrophage subtypes revealed that their regulons can be categorized into five distinct modules, as shown in Figure 6F. Each specific macrophage subtype exhibited unique TF regulons. Notably, TFs such as E2F3/6/7, ATF2/4, JUNB, IRF1/7, FOS, and ELF1known for their involvement in cell cycle regulation, cellular stress responses, IFN signaling pathways, and immune modulation, were found to be highly activated in Cell fate 2 (Figure 6G). This suggests a nuanced regulatory landscape in these macrophage subtypes, emphasizing their functional diversity in cellular processes. Collectively, tracing gene fluctuations along the bifurcated trajectory, Cell fate 2 appears to play a key role in pathways closely associated with AS, such as angiogenesis, lipid metabolism, and hypoxia. Additionally, DEMGs score exhibit the highest in Cell fate 2, suggesting selective high expression in Mac-C1-SPP1/VCAN, Mac-C3-IL1B, and Mac-C5-FLT3LG macrophage subtypes. These macrophage subtypes in Cell fate 2 may be key cell types leading to plaque rupture in AS, resulting in decreased ischemic event-free survival.
 |
Figure 6 Activation trajectory of macrophage subtypes in AS. (A) The development trajectory of macrophage subtypes is colored by cell subtypes, cell states, pseudotime orders, and CytoTRACE scores. (B) Ridgeline plot shows the distribution of the pseudotime-ordered macrophage subtypes among three states. (C) Two-dimensional plots show the expression pattern for signature genes related to hypoxia, angiogenesis, cholesterol homeostasis, and fatty acid metabolism in different groups/states, along with the pseudotime. (D) Right: DEMGs score is enriched along the evolutionary trajectory of macrophage subtypes. Left: The box plot shows the comparison of DEMGs scores among three states. *p < 0.05; **p < 0.01; ***p < 0.001; and ****p < 0.0001. (E) Heatmap shows the expression pattern of DEMGs, gradually upregulated in Mac-C1-SPP1/VCAN, Mac-C3-IL1B, and Mac-C5-FLT3LG, along with the pseudotime. (F) Macrophage subtypes can be classified into five modules according to the cooperation of different transcription factors. (G) Heatmap shows the activity of TF regulons among different macrophage subtypes/states. |
Identification of the Function and Prognostic Significance of Cell fate 2 Group in AS
Previously, we found significant association between Cell fate 2 and DEMGs scores. Thus, we utilized BEAM analysis to identify the DEGs associated with Cell fate 2. The GO Term results reveal that DEGs with Cell fate 2 are predominantly expressed in pathways related to immune-inflammatory responses, including immune cell receptor signaling pathways, positive regulation of the immune response, and the NF-κB signaling pathway (Figure 7A). Concurrently, Cell fate 1’s DEGs were found to be linked to cell recognition, cell signal transduction, and ATP synthesis. Further survival analysis demonstrated that high enrichment scores of Cell fate 2’s DEG could predict the occurrence of ischemic events in the AS patient cohort, suggesting that these macrophages within the Cell fate 2 can markedly reduce the prognosis of cardiovascular disease patients (Figure 7B). We further investigated the tissue distribution of these macrophages within the Cell fate 2 using a large pair of samples. Intriguingly, in two independent datasets of AAS, a higher enrichment score of Cell fate 2 was observed in AAS (Figure 7C). Additionally, through bulk-seq analysis, significant expression differences were observed among the 41 DEGs of Cell fate 2 across different AS plaque subtypes. Specifically, in the cluster 3 plaque subtype, Cell fate 2’s DEGs exhibited high expression, whereas they exhibited low expression in the cluster 2 subtype and intermediate expression in the cluster 1 subtype (Figure 7D). This finding suggests that these macrophages within Cell fate 2 are likely crucial components of the cluster 3 plaque subtype. Subsequently, we conducted a metabolic pathway analysis for these three states of macrophage subtypes. The results indicated significant upregulation of fatty acid synthesis, fatty acid elongation, and fatty acid degradation pathways in the Cell fate 2 (Figure 7E and F). Furthermore, GO enrichment analysis revealed that Mac-C1-SPP1/VCAN has relevant functions in both inflammation and lipid metabolism (Figure 7E and G). We implied that the inflammatory response of these macrophages within the Cell fate 2 group is one of the factors contributing to the overactivation of lipid metabolism. Existing research indicates a correlation between excessive fatty acid elongation and the development of AS, where fatty acids in the body can transform into pro-inflammatory metabolites, triggering inflammation and exacerbating vascular wall damage.6 In summary, these results support the likelihood that macrophage subtypes within Cell fate 2 accumulate in lesions and play a crucial role in the progression and prognosis of atherosclerosis. Additionally, these results suggest a close association between cluster 3 plaque subtype and the macrophage subtypes within Cell fate 2.
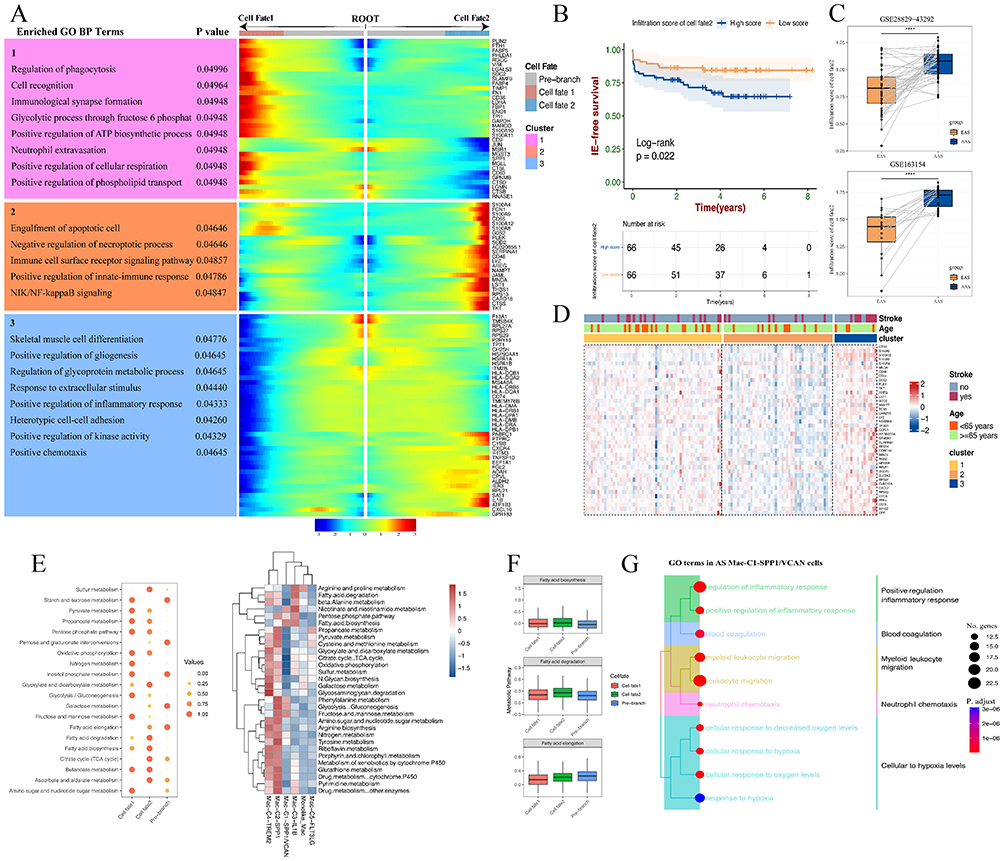 |
Figure 7 Identification of DEGs with Cell fate 2 and its prognostic significance. (A) Heatmap exhibits the expression dynamics of DEGs with differentiated macrophage states. (B) Kaplan‐Meier analysis shows that high enrichment scores of Cell fate 2’s DEGs lead a poorer prognosis in AS. (C) Box plot shows the difference between high and low-enrichment scores of Cell fate 2’s DEGs in the GSE28829-43292 dataset and GSE163154 dataset. ****p < 0.0001. (D) The mRNA expression patterns of Cell fate 2’s DEGs in three AS plaque subtypes. (E) Heatmap shows the differences in metabolic pathways among different macrophage subtypes/states. (F) Box plot shows the differences in three fatty-metabolic pathways among different macrophage states. (G) Top 10 GO-BP terms of Mac-C1-SPP1/VCAN in AS. |
Transcriptome Characterization of Subtype Macrophages in the AS Plaque Subtype
To investigate macrophage subtype proportion changes in AS plaque subtypes, we employed the BayesPrism model trained using referenced literature on scRNA-seq of AS. Subsequently, we inferred proportional cell type fractions and gene expression levels in each cell type from the bulk-seq samples of AS plaque. Figure 8A depicts the proportions of various cell types (at the single-cell level) in 131 bulk-seq samples from carotid artery plaques. A heatmap of intercellular correlations reveals a significant positive correlation (p-value < 0.05) between Mac-C1-SPP1/VCAN and Mac-C3-IL1B, in line with expectations (Figure 8B). Notably, a positive correlation is observed between Mac-C1-SPP1/VCAN and NK cells and mast cells, suggesting potential immunoregulatory and cytotoxic functions, consistent with prior findings (Figure 7G). Interestingly, survival analysis based on the proportion of Mac-C1-SPP1/VCAN indicates a marked reduction in the ischemic event-free survival for high cell proportion (p-value < 0.0001) (Figure 8C). Furthermore, the clustering heatmap of AS plaque subtypes reveals that Mac-C1-SPP1/VCAN, Mac-C3-IL1B, and Mac-C5-FLT3LG exhibit high infiltration proportions in cluster 3 plaques, low infiltration proportions in cluster 2 plaques, and moderate infiltration proportions in cluster 1 plaques, consistent with our earlier findings (Figures 8D and 7D). Subgroup statistics based on AS plaque subtypes for these three macrophage subtypes indicate that, except for Mac-C5-FLT3LG cells showing no statistically significant difference, Mac-C1-SPP1/VCAN and Mac-C3-IL1B cell proportions are highest in cluster 3 plaques (p-value < 0.0001) (Figure 8E). In summary, we have identified the transcriptional features of these three macrophage subtypes in cluster 3 plaques and discovered that the high infiltration proportions of two macrophage subtypes (Mac-C1-SPP1/VCAN and Mac-C3-IL1B) are a crucial factor contributing to plaque instability. Finally, we selected 17 marker genes by intersecting DEMGs from bulk-seq analysis and DEGs from these three macrophage subtypes in scRNA-seq analysis for subsequent validation (Figure 8F).
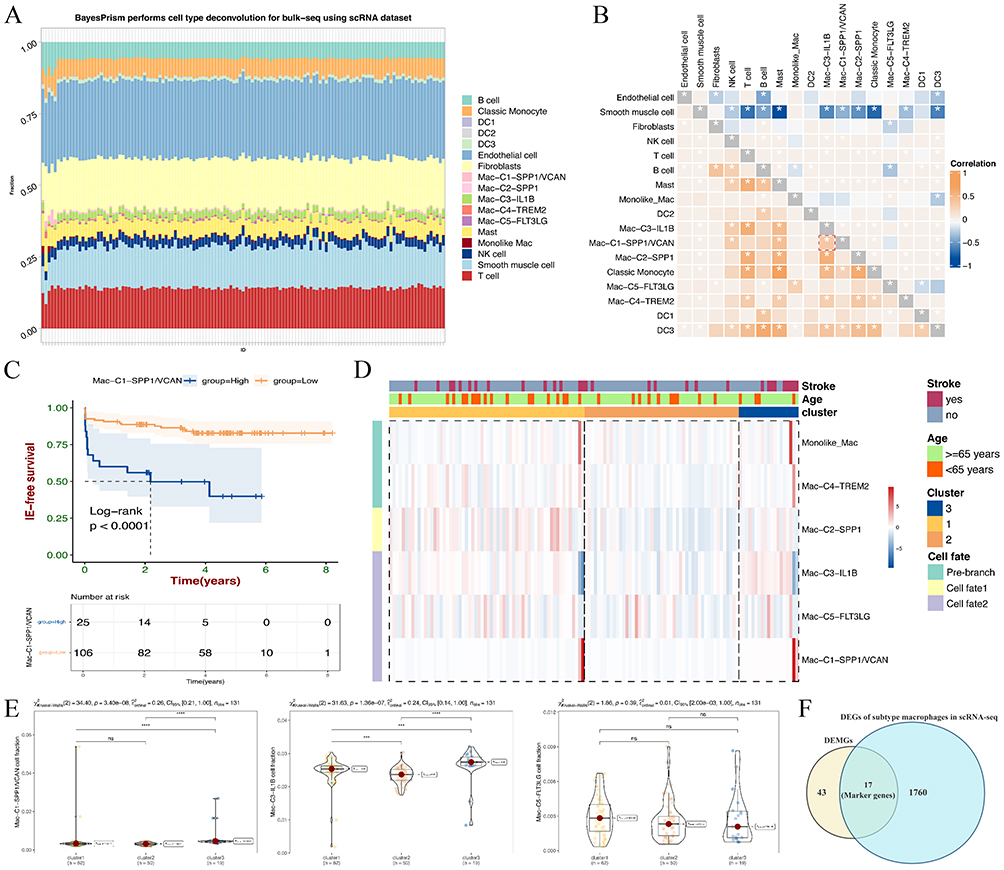 |
Figure 8 The cell type percentage from bulk-RNA seq of AS plaque subtypes deconvoluted by BayesPrism. (A) Bar plots show the percentage of each cell type in the bulk-seq of AS plaque deconvolution by BayesPrism. (B) Correlation of the infiltration of pairwise 17 cell types in the bulk-seq of AS plaque deconvoluted by BayesPrism. *p < 0.05 was considered statistically significant. (C) The Kaplan–Meier analysis shows overall survival analyses for low and high percentages of Mac-C1-SPP1/VCAN. (D) Three AS plaque subtypes have different macrophage subtype infiltration patterns. (E) Violin plot shows the comparison of percentages among three AS plaque subtypes in Mac-C1-SPP1/VCAN, Mac-C3-IL1B, and Mac-C5-FLT3LG, respectively. *p < 0.05; **p < 0.01; ***p < 0.001; and ****p < 0.0001. “ns” indicates not significant (p > 0.05). (F) Venn plot of 17 marker genes based on DEGs with macrophage subtypes and 43 DEMGs. |
Comparison of the Cellular Interaction in AS
We utilized CellChat to unravel ligand-receptor interactions among distinct cell subtypes in AS. We observed heightened interactions among macrophage subtypes, particularly noting that interactions involving Mac-C1-SPP1/VCAN, Mac-C3-IL1B, and Mac-C5-FLT3LG were highly similar to those in Cell fate 2 (Figure 9A and B). In group comparison, we found significantly augmented interactions among macrophage subtypes in AS, particularly for Mac-C1-SPP1/VCAN, Mac-C3-IL1B, and Mac-C5-FLT3LG (Figure 9C). Subsequently, we delved into exploring the ligand-receptor pairs involving Mac-C1-SPP1/VCAN, Mac-C3-IL1B, Mac-C5-FLT3LG, and other macrophage subtypes. We found a significant upregulation of ligand-receptor pairs inducing inflammatory responses and participating in immune regulation and angiogenesis in AS, such as SPP1 and its partners, MIF and its partners, and ANXA1-FRP1 (Figure 9D). Notably, SPP1, as a cytokine, plays a vital role in the type-I immune response by enhancing the production of IFN and IL12 and reducing the production of IL10.39,40 The expression of its ligand-receptor pairs in Mac-C1-SPP1/VCAN is significantly higher than in the other two macrophage subtypes. Similar trends were observed for MIF and its partners. MIF, a pivotal regulatory protein in the immune system, stimulates inflammation and immune responses, participates in the directed movement of immune cells, and regulates cell proliferation, impacting endothelial cell growth and differentiation.41 These findings support the inference that Mac-C1-SPP1/VCAN cells exhibit more inflammatory responses and angiogenesis. Additionally, we investigated the roles of different cells in the SPP1 signaling pathway, ANNEXIN signaling pathway, and MIF signaling pathway. This revealed that Mac-C1-SPP1/VCAN tends to act as a ligand cell in these three pathways, while Mac-C3-IL1B and Mac-C5-FLT3LG tend to act as ligands in the ANNEXIN signaling pathway and as receptors in the other two pathways (Figure 9E–G).
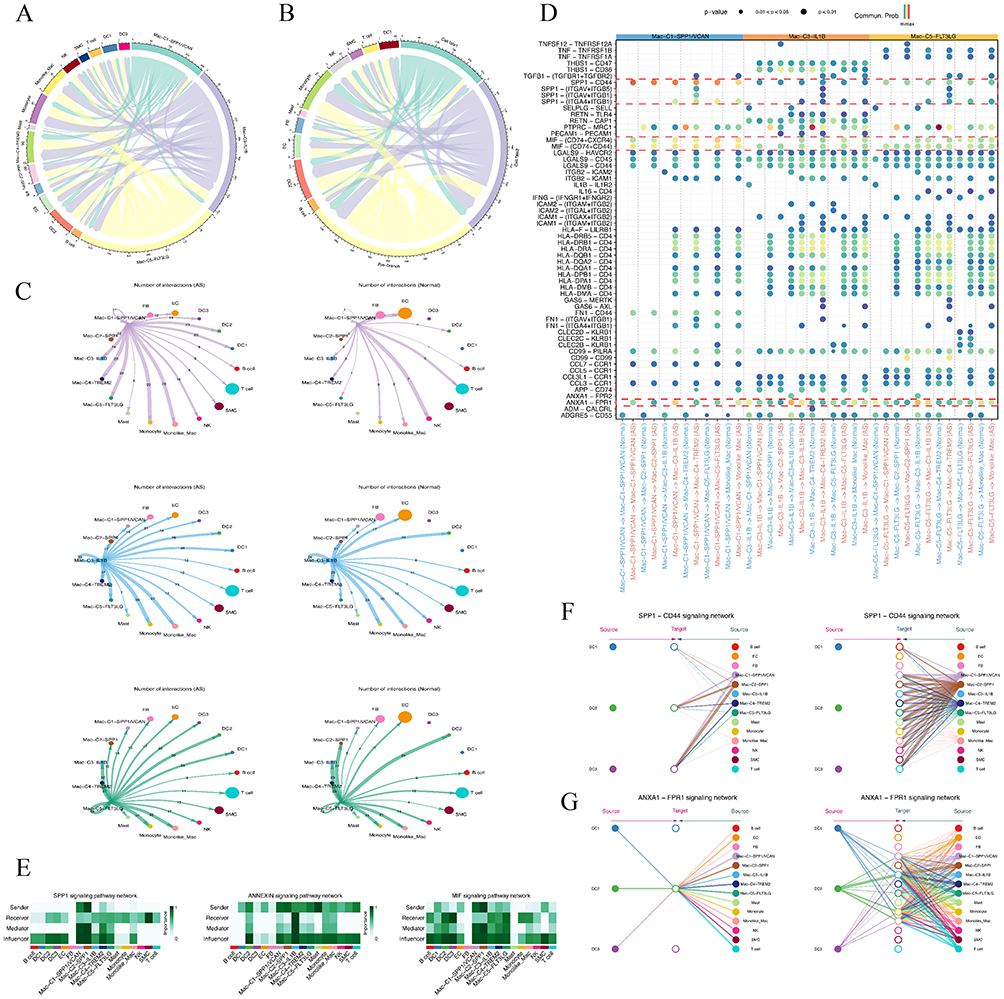 |
Figure 9 Cell-cell communications analysis in AS. (A-B) Chord plots shows interactions between among different macrophage states/subtypes. Each node indicated a different cell type; each width of the edge indicated a number of interaction pairs between cell types. (C) Circle plots displayed the significant ligand-receptor pairs between AS versus normal groups, which contribute to the signaling from Mac-C1-SPP1/VCAN, Mac-C3-IL1B, and Mac-C5-FLT3LG to other cells. (D) Bubble plots showing the ligand- receptor pairs of Mac-C1-SPP1/VCAN, Mac-C3-IL1B, and Mac-C5-FLT3LG as ligands and all macrophage subtypes as receptors between AS and Normal groups. (E) Macrophage cell subtypes with three immune-related signaling pathways (SPP1, ANNEXIN, and MIF signaling pathways) play different roles in AS. (F-G) Macrophage cell subtypes have diverse ligand-receptor patterns in SPP1-CD44 signaling, and ANXA1-FPR1 signaling pathways. |
Screening of Biomarker in AS Based on Machine Learning and Two Sample MR Analysis
We employed three machine learning algorithms, SVM-RFE, LASSO, and RF, to individually screen 17 marker genes to identify biomarkers with diagnostic features (Figure 10A–C). By intersecting the results from these three algorithms, a total of ten biomarkers were selected: CD36, CSF3R, DUSP2, FCER1G, FLT3LG, FRP1, IL17RA, LILRB2, RNASE2, and VAMP8. AUC curves based on three independent datasets indicated good diagnostic performance of these biomarkers in distinguishing between high macrophage-infiltrated plaques and active AS plaques, with FLT3LG being the exception (Figure 10D). To elucidate the diagnostic efficacy of FLT3LG in AS, we applied a two-sample MR analysis. Our results indicated a significant causal association between the eQTL of FLT3LG and AS, using two datasets. The forward MR analysis showed a positive association, while the reverse MR analysis did not reveal significant associations, further strengthening the causal link between FLT3LG’s eQTL and AS (Supplementary Figure 4). Furthermore, we developed a diagnostic model using these ten biomarkers, employing the GSE21545-41571 dataset as the test set and GSE28829-43292 and GSE163154 as validation sets. The diagnostic efficacy of the model was evaluated through the application of ten different machine learning algorithms. The results showed excellent diagnostic efficacy of this diagnostic model in the test set (AUC > 0.8), with the generalized linear regression model demonstrating the best diagnostic performance (Figure 10E). Validation in two additional datasets confirmed the reliable and robust diagnostic performance of this diagnostic model (Figure 10F). Furthermore, we presented gene expression profiles of these biomarkers across different groups, showing high expression in both high macrophage infiltration score and AAS groups (Figure 10G).
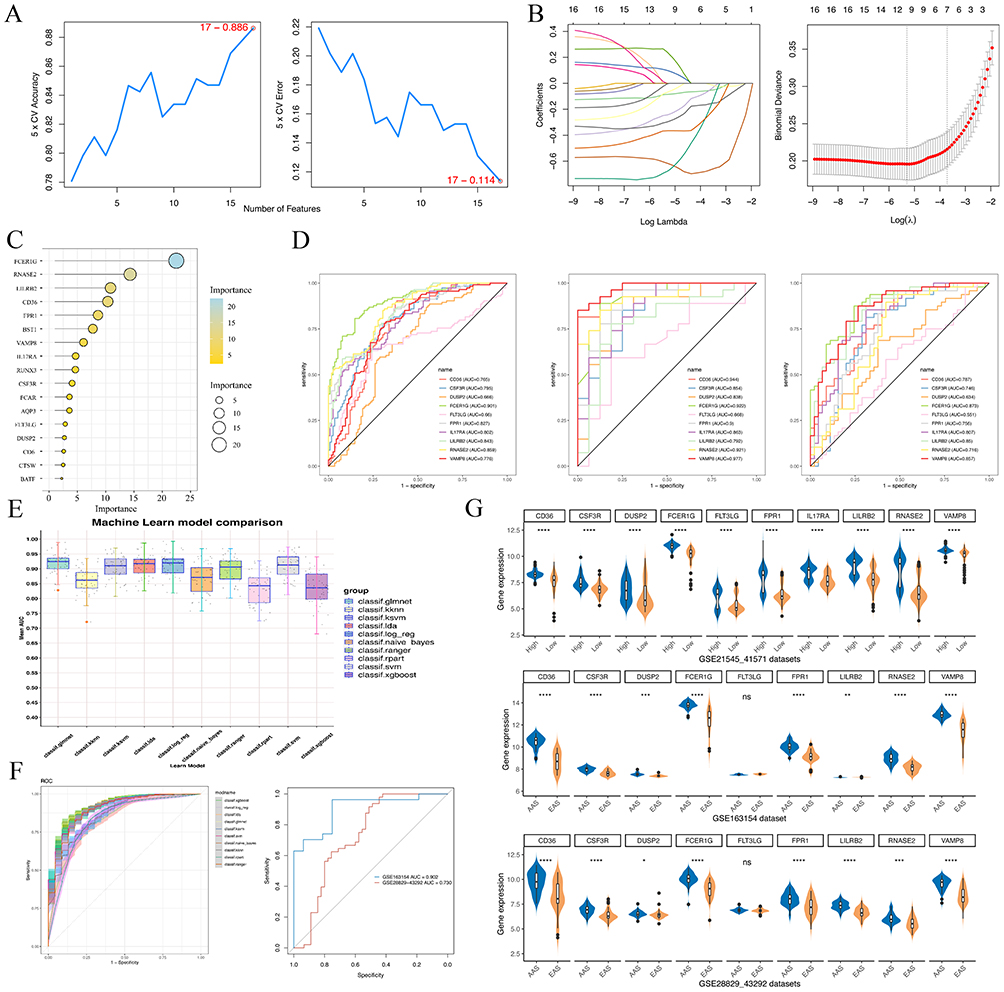 |
Figure 10 Screening of biomarkers via multiple machine-learning algorithms. (A) Characteristic marker genes were selected using the SVM-RFE algorithm. (B) Characteristic marker genes were selected using the LASSO regression algorithm. (C) Characteristic marker genes were selected using the RF algorithm. (D) ROC curve for 10 biomarkers in GSE21545-41571, GSE28829-43292, and GSE163154 dataset, respectively. (E) Box plots shows the performance of the diagnostic model base on biomarkers by using 10 marine learning algorithms. (F) Left: ROC curve validated the reliability of the diagnostic model by using 10 marine learning algorithms. Right: ROC curve validated the reliability of the diagnostic model by using other two datasets. (G) Violin plot shows the comparison of biomarker’s expression levels between AS and normal in different datasets, respectively. *p < 0.05; **p < 0.01; ***p < 0.001; and ****p < 0.0001. “ns” indicates not significant (p > 0.05). |
Validation of Macrophage-Related Biomarkers Expression in AS Mice Model
Circular heatmaps revealed a clear positive correlation between ten biomarkers and macrophages (Figure 11A). To further support our findings, we utilized qPCR to assess the expression of three biomarkers (CD36, FCER1G, and VAMP8) in atherosclerotic tissues from six ApoE−/− mice fed a high-cholesterol diet (HCD) and six ApoE−/− mice fed a standard chow diet (SCD). The results demonstrated that the elevated expression patterns of the three biomarkers in AS mice were consistent with our bioinformatic data (CD36, p-value = 0.0145; FCER1G, p-value = 0.0130; VAMP8, p-value = 0.0350) (Figure 11B). Survival analysis indicated that the high-expression group of these three biomarker genes significantly diminished the prognosis of AS patients (Figure 11C). Similar results were observed at the protein levels using WB (Figures 11D). Multiplex immunofluorescence of atherosclerotic tissues in mice revealed the colocalization of FCER1G with CD68-positive macrophages in atherosclerotic plaques (Figure 11E).
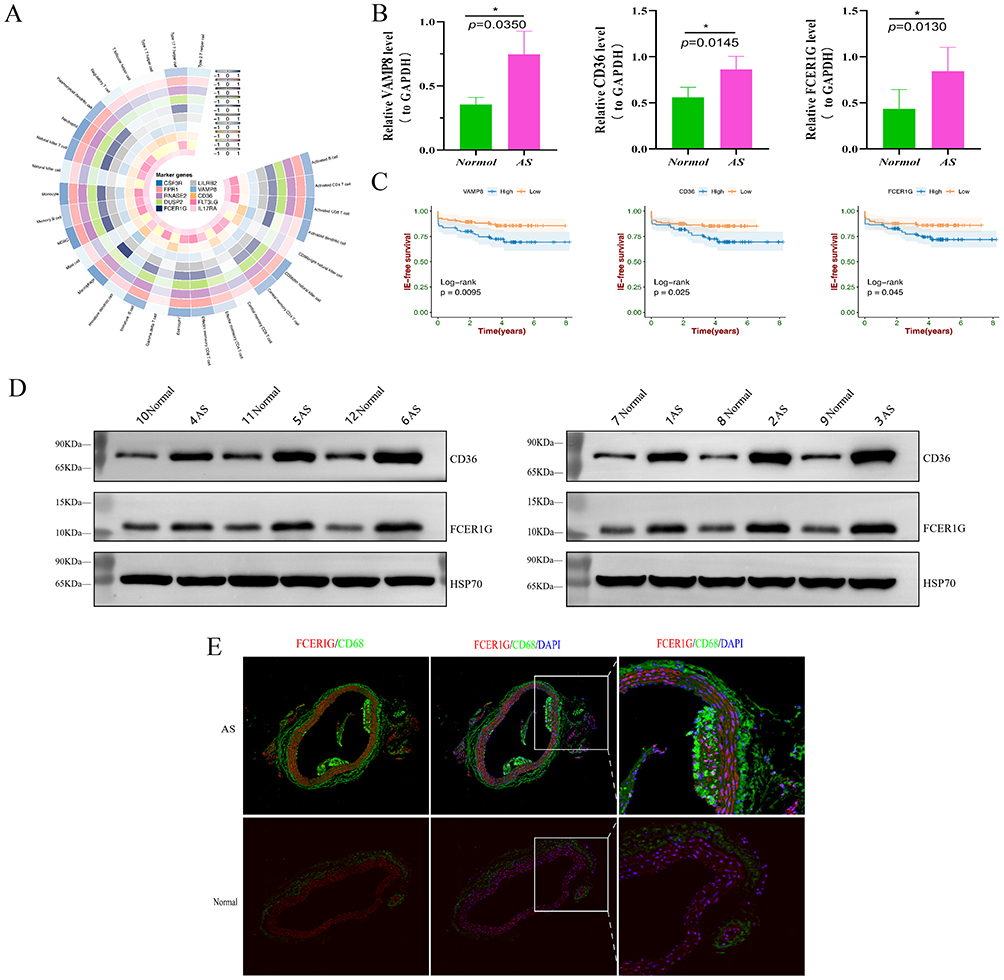 |
Figure 11 The expression of Top three characteristic biomarkers in mice atherosclerotic tissues. (A) Circle-heatmap plots displayed the correlation between biomarkers’ expression level and infiltration scores of 28 immune cell types. (B) qPCR results showed that Top three characteristic biomarkers expression were high in mice atherosclerotic tissues. The reference is GAPDH, *p < 0.05, **p < 0.01, ***p < 0.001. (C) Kaplan–Meier analysis showed the differences between high and low Top three characteristic biomarkers expression groups in AS samples, respectively. (D) WB results showed that Top three characteristic biomarkers expression were high in mice atherosclerotic tissues. (E) mIF validation co-stained for FCER1G (red) and CD68 (green) in AS. |
Discussion
This study integrates single-cell and bulk-seq data to unveil the heterogeneity of atherosclerotic plaques and the roles of macrophage subtypes in unstable plaques. Previous studies on AS systematically explored the composition of different cell clusters in various groups, particularly focusing on T cells and NK cells. Our approach, blending single-cell and bulk data, has clarified the molecular phenotyping of AS plaques linked to ischemic events and highlighted the prognostic significance of certain macrophage subtypes.
Macrophages, key to plaque instability, have been extensively studied over the past decade. Earlier research centered on macrophage polarization, exploring biological functions, inflammatory genes, and signaling pathways of M1 or M2 macrophages.42,43 However, as research on AS deepened, the complexity of macrophage heterogeneity in AS requires moving beyond this binary classification. The detailed mechanism underlying how macrophage subtypes affect the microenvironment has been a prominent topic in recent years. We should notice that the AS plaque microenvironments present a complex landscape, especially when considering the transformational capabilities of macrophages. At the heart of this complexity lies the dynamic transformation between the M1 and M2 macrophage phenotypes. Some research has illuminated that the Kruppel-like factor (KLF) 2 plays a critical role in the transition of M2 macrophages from an anti-inflammatory to a pro-inflammatory state.9 This transformational process further complicates the identification of unstable plaque characteristics. Moreover, traditional beliefs posited that macrophages originated solely from the differentiation of monocytes. However, recent studies have unveiled a more nuanced narrative. These studies suggest that resident macrophages are not merely byproducts of differentiation but are actively present at various stages within the plaque microenvironment.44 The behavior of these macrophage subtypes is intriguing: under steady-state conditions, they exhibit low levels of proliferation. Yet, when faced with inflammatory challenges, they demonstrate a marked increase in proliferation rates, significantly contributing to the accumulation of macrophages in plaques.44 Lastly, the phenotypic classification of macrophages has traditionally relied on the identification of surface markers and their associated functions. However, the issue arises from the fact that many of these markers are shared across different macrophage subtypes, with only a few being unique to specific phenotypes.45 This overlap not only blurs the functional distinctions between the subtypes but also introduces a degree of ambiguity and complexity in understanding their distinct roles in plaque formation and progression. In the present analysis, our results reveal different biological functions (eg, hypoxia, fatty acid metabolism, inflammatory response, cholesterol homeostasis) and clinical outcomes for macrophage subtypes, particularly in previously identified cluster 3 plaque subtypes. Although identifying macrophage subtypes’ biological functions in AS is crucial, it’s more important to understanding which subtypes contribute to plaque instability and to identify common traits of these macrophages in unstable plaque subtypes. Here, we identified three AS plaque subtypes using unsupervised clustering in bulk-seq data. revealing prognostic differences and transcriptomic characteristics linked to high immune cell infiltration and inflammatory response pathways in cluster 3 subtypes through survival analysis and GSVA methods. Additionally, we discovered that cluster 3 plaques exhibit high expression selectively associated with a specific macrophage subtype. This highlights the importance of actively identifying the molecular characteristics of different AS plaques in inflammation-targeted therapies, which could benefit patients with ischemic events-related plaques.
Furthermore, using DEMGs as a bridge, three macrophage subtypes significantly associated with DEMGs score were identified (Mac-C1-SPP1/VCAN, Mac-C3-IL1B, and Mac-C5-FLT3LG). Pseudo-trajectory analysis further revealed various differentiation stages and specific biological functions of these macrophage subtypes. The Cell fate 2 group, marked by the highest DEMGs score, represents a differentiation stage formed by the aggregation of these three subtypes. It’s appeared crucial for AS progression, as patients with high Cell fate 2 DEGs expression had poorer prognoses. The BayesPrism deconvolution method confirmed the high activity of these three macrophage subtypes and characteristic genes in cluster 3 plaque subtypes, validating our analysis. Our study also traced the origins of macrophage subtypes and the biofunctions of Cell fate 2. Consensus suggests that most macrophage subtypes likely originate from activated monocyte-like macrophages,46 as indicated by the trajectory from Pre-branch to Cell fate 2/Cell fate 1. Interestingly, our study revealed that Cell fate 2 macrophages are significantly enriched in pathways related to fatty lipid synthesis, hypoxia, apoptosis, and NF-κB signaling pathways, with most DEMGs being highly expressed in these macrophage subtypes. This underscores their role in immune-inflammatory responses and their selectivity for pro-inflammatory and oxidized LDL (OxLDL)-related metabolic processes during differentiation. Previous studies have demonstrated that hypoxia can activate immune cells and increase energy demands of resident cells, creating a hypoxic microenvironment and mitochondrial dysfunction.47 This leads to an increase in reactive oxygen species, oxidative stress, and the activation of inflammation and NF-κB signaling pathways, which in turn, may secrete pro-inflammatory cytokines and matrix metalloproteinases, undermining plaque stability through extracellular matrix degradation.48 Oxidative stress also leads to the oxidation of both lipid and protein components in OxLDL, which plays a crucial role in AS formation due to its pro-inflammatory, chemotactic, and procoagulant properties.49 Moreover, OxLDL is pivotal in macrophage differentiation and foam cell formation, which are key processes in AS progression.7,49 Conversely, Cell fate 1’s DEGs were found to be linked to cell recognition, cell signal transduction, and ATP synthesis, suggests a pivotal role in initial inflammatory responses, potentially contributing to the recruitment of further immune cells and the establishment of an inflammatory milieu conducive to plaque development. Our current findings and these previous studies help consolidate the evidence for a potential causal relationship between inflammation and AS and further explore potential macrophage subpopulations that may play an important role in the process of inflammation. Targeting specific macrophage states or modulating their evolutionary trajectories could offer novel strategies for treating AS. For example, therapies designed to inhibit the transition to Cell fate 2 or stay in the Pre-branch state could mitigate plaque progression or encourage plaque stabilization, respectively. Additionally, we identified a unique Mac-C1-SPP1/VCAN cell, rare in quantity but exhibiting high expression of AS-related genes (CD36, AQP9, EREG). Unlike traditional SPP1+ macrophage, it expresses both SPP1 and VCAN genes, known to influence tumor invasion, metastasis, and recruit macrophages as inflammatory factors, while VCAN plays a vital role in angiogenesis in tumor invasion and heterogeneity. A previous study on tumor-infiltrating myeloid cells also identified angiogenesis-associated macrophages in 8 cancer types, marked by SPP1 expression.50 These findings suggest the existence of other functional SPP1+macrophages subtypes. In our study, Mac-C1-SPP1/VCAN was not only highly expressed in cluster 3 plaque subtypes but also found to significantly lower the survival of ischemic events-free in AS. Cell communication analysis also revealed enhanced inter-macrophage interactions in AS. We noticed that Mac-C1-SPP1/VCAN likely plays a pivotal role in regulating the entire inflammatory response and angiogenesis through pathways like SPP1 and MIF significantly intensified. Macrophage migration inhibitory factor (MIF) is a prominent atypical chemokine (ACK), an evolutionarily conserved multifunctional inflammatory mediator that is structurally distinct from other cytokines.51,52 MIF may enhance the recruitment of atherogenic leukocytes via CXC motif chemokine receptor-4 (CXCR4),53–55 promoting atherosclerosis. Current data have indicated that MIF activates activated mitogen-activated protein kinases (MAPKs), including extracellular signal-regulated kinases in synoviocytes and p38 MAPK, resembling other proinflammatory cytokines. MAPK activation can be well characterized as a feature of atherosclerotic inflammation.56,57 Furthermore, MIF is the only known cytokine that directly downregulates p53 expression and function, especially under cellular stress. If a small molecule MIF inhibitor can be developed, it could represent a new category of direct anti-cytokine drugs that would have potential utility in inflammatory diseases. Our findings align with these conclusions that MIF-related signaling pathways are actively expressed in pro-inflammatory, especially in Mac-C1-SPP1/VCAN as ligand, Mac-C3-IL1B, and Mac-C5-FLT3LG as receptors. Furthermore, in the ANXA1-FPR1 signaling pathway, inflammatory stimulation of the P2X7 receptors on macrophages leads to the release of the phospholipid-binding protein membrane associate protein A1 (ANXA1), which binds to the G protein-coupled receptor (GPCR)-formyl peptide receptor 2 (FPR2) and exerts anti-inflammatory effects by promoting apoptosis and inhibiting the transport capacity of leukocytes effects.58 Leslie et al indicated the ANXA1-FPR1 signaling pathway could promote the maturation of macrophages and migrate them into the damaged tissue.59 Our results of activation in the ANXA1-FPR1 signaling pathway with Cell fate 2 macrophages as receptors were observed to imply that continuous inflammatory signals induce large amounts of inflammatory gene expressions in AS plaque to cause a series of inflammatory responses.
Moreover, we employed three machine learning algorithms to identify ten biomarkers expressed in plaque subtypes and macrophages, leading to the construction of a diagnostic model for AS. The reliability of the diagnostic model was assessed using ten machine learning algorithms and validation sets, with in vitro validation of three biomarkers (FCER1G, CD36 and VAMP8). By searching the literature, we found FCER1G encoding the Fc receptor γ-chain, first informed as the third subunit of the high-affinity immunoglobulin E (IgE) receptor,60–62 was abundantly expressed in different types of immune cells and involved in various types of immune responses such as phagocytosis and cytokine release. Youshi Meng et al proved63,64 that FCER1G is a hub gene significantly upregulated in AAS. However, FCER1G is still less studied in interactive mechanisms in AS. In our study, FCER1G was a highly expressed gene in Mac-C3-IL1B, proving FCER1G might be involved in inflammation-related signaling pathways by regulated Mac-C3-IL1B activity. CD36 belongs to the class B scavenger receptor family and is expressed on monocytes and macrophages.65 CD36, a pattern recognition receptor, is an important signaling molecule for the uptake of oxidized low-density lipoprotein (ox-LDL), foam cell formation, cytoskeleton dynamics, and macrophage migration. Although uptake of ox-LDL by CD36 has been verified to be a critical step in foam cell formation, the mechanism regulating ligand-induced CD36 internalization and its corresponding downstream signaling remains unclear, so clarification of this regulatory mechanism may unexpectedly find the one of discovery of the emerging therapeutic strategies for AS.66 Data from the study by Sai Kuchibhotla et al67 indicated that CD36 deficiency not only reduced the level of lipid accumulation in macrophages to retard the progression of atherosclerosis but also reduced the secretion of reactive oxygen species (ROS). This pro-inflammatory cytokine affects plaque instability due to macrophage migration. These results are consistent with our findings and support the pro-atherogenic effect of CD36.68 VAMP8 is a SNARE protein that has been found in a variety of important cellular activities,69 which is critical for the fusion between the autophagosomes and lysosomes.70 Youwei Lu et al suggested that VAMP8 may promote the development of AS and be a new biomarker for diagnosing and treating AS.71 In previous studies, no single-cell data confirmed that VAMP8, FGER1G could be effective biomarkers in diagnosing AS. Our in vitro study illustrated that VAMP8, FCER1G, and CD36, in carotid AS plaque were related to macrophages.
In conclusion, our comprehensive analysis delineates macrophage subtypes within the context of AS, offering insights into their distinct roles and origins. Here, we present several findings from our research that are significantly novel compared to previously published papers16,17 (Supplementary Table 2). This study not only sheds light on the potential mechanisms driving macrophage diversity in AS but also emphasizes their impact on disease progression and clinical outcomes. However, there are still some limitations that need to be addressed. First, our analysis includes both carotid plaques and aortic plaques. The plaques used for validation are also aortic plaques. Different types of plaques may have mechanisms of disease that are not entirely consistent, and we need more data of AS samples to evaluation and validation ours finding. Second, further experimental validation is necessary to confirm the specific functions of each macrophage subtype in AS, and investigate how interaction such as AS plaque sites are responses with observed macrophage subtypes. Collectively, our findings lay a foundation for targeted macrophage-based therapies in AS.
Data Sharing Statement
Publicly available datasets were analyzed in this study. This data can be found here: The processed scRNA-seq dataset was deposited at the Gene expression omnibus (GEO) data repository under the accession code GSE159677 and GSE155512. The bulk RNA-seq dataset of the AS and AAS cohort could be downloaded from GEO under the accession numbers GSE21545, GSE41571, GSE43292, GSE28829, and GSE163154. The remaining data are available from the authors upon reasonable request.
Ethics Statement
The study was approved by The Second Affiliated Hospital of Kunming Medical University (No. PJ-2022-14) and was carried out in accordance with the Declaration of Helsinki. The animal experimental protocols were reviewed and approved by the Laboratory Animal Welfare Ethics Committee of Yunnan University (approval no. YNU20220411). This animal study complies with The Guide for the Care and Use of Laboratory Animals.
Acknowledgments
We would like to acknowledge reviewers and editors for their helpful comments on this paper.
Author Contributions
All authors contributed to data analysis, drafting or revising the article, have agreed on the journal to which the article will be submitted, gave final approval of the version to be published, and agree to be accountable for all aspects of the work.
Funding
This study was supported by grants from the Yunnan Province high-level personnel Training support program (No. YNWR-MY-2020-024), Major Project of Yunnan Science and Technology Program (202002AA100007, 202102AA100007-3), Scientific Research Project of The Second Affiliated Hospital of Kunming Medical University (No. 2021yk13), and Medical Reserve Personnel Training Program of Yunnan Provincial Health and Family Planning Commission (No. H-2017019).
Disclosure
The authors declare that the research was conducted in the absence of any commercial or financial relationships that could be construed as a potential conflict of interest.
References
1. Kassiteridi C, Cole JE, Griseri T, et al. CD200 limits monopoiesis and monocyte recruitment in atherosclerosis. Circ Res. 2021;129(2):280–295. doi:10.1161/circresaha.119.316062
2. Ahmadi A, Argulian E, Leipsic J, Newby DE, Narula J. From subclinical atherosclerosis to plaque progression and acute coronary events: JACC state-of-the-art review. J Am Coll Cardiol. 2019;74(12):1608–1617. doi:10.1016/j.jacc.2019.08.012
3. Tsao CW, Aday AW, Almarzooq ZI, et al. Heart disease and stroke statistics-2022 update: a report from the American heart association. Circulation. 2022;145(8):e153–e639. doi:10.1161/cir.0000000000001052
4. López-Melgar B, Fernández-Friera L, Oliva B, et al. Short-term progression of multiterritorial subclinical atherosclerosis. J Am Coll Cardiol. 2020;75(14):1617–1627. doi:10.1016/j.jacc.2020.02.026
5. Lacy M, Bürger C, Shami A, et al. Cell-specific and divergent roles of the CD40L-CD40 axis in atherosclerotic vascular disease. Nat Commun. 2021;12(1):3754. doi:10.1038/s41467-021-23909-z
6. Hou P, Fang J, Liu Z, et al. Macrophage polarization and metabolism in atherosclerosis. Cell Death Dis. 2023;14(10):691. doi:10.1038/s41419-023-06206-z
7. Forstermann U, Xia N, Li H. Roles of vascular oxidative stress and nitric oxide in the pathogenesis of atherosclerosis. Circ Res. 2017;120(4):713–735. doi:10.1161/CIRCRESAHA.116.309326
8. YU EP, Reinhold J, Yu H, et al. Mitochondrial respiration is reduced in atherosclerosis, promoting necrotic core formation and reducing relative fibrous cap thickness. Arterioscler Thromb Vasc Biol. 2017;37(12):2322–2332. doi:10.1161/ATVBAHA.117.310042
9. van Tits LJ, Stienstra R, van Lent PL, Netea MG, Joosten LA, Stalenhoef AF. Oxidized LDL enhances pro-inflammatory responses of alternatively activated M2 macrophages: a crucial role for Kruppel-like factor 2. Atherosclerosis. 2011;214(2):345–349. doi:10.1016/j.atherosclerosis.2010.11.018
10. McArdle S, Buscher K, Ghosheh Y, et al. Migratory and dancing macrophage subsets in atherosclerotic lesions. Circ Res. 2019;125(12):1038–1051. doi:10.1161/circresaha.119.315175
11. Langley SR, Willeit K, Didangelos A, et al. Extracellular matrix proteomics identifies molecular signature of symptomatic carotid plaques. J Clin Invest. 2017;127(4):1546–1560. doi:10.1172/jci86924
12. Hajkarim MC, Won KJ. Single Cell RNA-sequencing for the study of atherosclerosis. J Lipid Atheroscler. 2019;8(2):152–161. doi:10.12997/jla.2019.8.2.152
13. Fernandez DM, Rahman AH, Fernandez NF, et al. Single-cell immune landscape of human atherosclerotic plaques. Nature Med. 2019;25(10):1576–1588. doi:10.1038/s41591-019-0590-4
14. Alsaigh T, Evans D, Frankel D, Torkamani A. Decoding the transcriptome of calcified atherosclerotic plaque at single-cell resolution. Commun Biol. 2022;5(1):1084. doi:10.1038/s42003-022-04056-7
15. Lin P, Ji HH, Li YJ, Guo SD. Macrophage plasticity and atherosclerosis therapy. Front Mol Biosci. 2021;8:679797. doi:10.3389/fmolb.2021.679797
16. Xiong J, Li Z, Tang H, et al. Bulk and single-cell characterisation of the immune heterogeneity of atherosclerosis identifies novel targets for immunotherapy. BMC Biol. 2023;21(1):46. doi:10.1186/s12915-023-01540-2
17. Xu J, Zhou H, Cheng Y, Xiang G. Identifying potential signatures for atherosclerosis in the context of predictive, preventive, and personalized medicine using integrative bioinformatics approaches and machine-learning strategies. EPMA J. 2022;13(3):433–449. doi:10.1007/s13167-022-00289-y
18. Jia XY, Liu YM, Wang YF, An JY, Peng KL, Wang H. Bibliometric study of soluble guanylate cyclase stimulators in cardiovascular research based on web of science from 1992 to 2021. Front Pharmacol. 2022;13:963255. doi:10.3389/fphar.2022.963255
19. Bindea G, Mlecnik B, Tosolini M, et al. Spatiotemporal dynamics of intratumoral immune cells reveal the immune landscape in human cancer. Immunity. 2013;39(4):782–795. doi:10.1016/j.immuni.2013.10.003
20. Barbie DA, Tamayo P, Boehm JS, et al. Systematic RNA interference reveals that oncogenic KRAS-driven cancers require TBK1. Nature. 2009;462:7269):108–12. doi:10.1038/nature08460
21. Subramanian A, Tamayo P, Mootha VK, et al. Gene set enrichment analysis: a knowledge-based approach for interpreting genome-wide expression profiles. Proc Natl Acad Sci U S A. 2005;102(43):15545–15550. doi:10.1073/pnas.0506580102
22. Auslander N, Zhang G, Lee JS, et al. Robust prediction of response to immune checkpoint blockade therapy in metastatic melanoma. Nat Med. 2018;24(10):1545–1549. doi:10.1038/s41591-018-0157-9
23. Korsunsky I, Millard N, Fan J, et al. Fast, sensitive and accurate integration of single-cell data with Harmony. Nat Methods. 2019;16(12):1289–1296. doi:10.1038/s41592-019-0619-0
24. Gulati GS, Sikandar SS, Wesche DJ, et al. Single-cell transcriptional diversity is a hallmark of developmental potential. Science. 2020;367:6476):405–411. doi:10.1126/science.aax0249
25. Suo S, Zhu Q, Saadatpour A, Fei L, Guo G, Yuan GC. Revealing the critical regulators of cell identity in the mouse cell atlas. Cell Rep. 2018;25(6):1436–1445 e3. doi:10.1016/j.celrep.2018.10.045
26. Tang-Huau TL, Gueguen P, Goudot C, et al. Human in vivo-generated monocyte-derived dendritic cells and macrophages cross-present antigens through a vacuolar pathway. Nat Commun. 2018;9(1):2570. doi:10.1038/s41467-018-04985-0
27. Wu Y, Yang S, Ma J, et al. Spatiotemporal immune landscape of colorectal cancer liver metastasis at single-cell level. Cancer Discov. 2022;12(1):134–153. doi:10.1158/2159-8290.CD-21-0316
28. Jin S, Guerrero-Juarez CF, Zhang L, et al. Inference and analysis of cell-cell communication using CellChat. Nat Commun. 2021;12(1):1088. doi:10.1038/s41467-021-21246-9
29. Chu T, Wang Z, Pe’er D, Danko CG. Cell type and gene expression deconvolution with BayesPrism enables Bayesian integrative analysis across bulk and single-cell RNA sequencing in oncology. Nat Cancer. 2022;3(4):505–517. doi:10.1038/s43018-022-00356-3
30. Tran KA, Addala V, Johnston RL, et al. Performance of tumour microenvironment deconvolution methods in breast cancer using single-cell simulated bulk mixtures. Nat Commun. 2023;14(1):5758. doi:10.1038/s41467-023-41385-5
31. Li J, Yang M, Luo P, Wang G, Dong B, Xu P. Type 2 diabetes and glycemic traits are not causal factors of delirium: a two-sample Mendelian randomization analysis. Front Genet. 2023;14:1087878. doi:10.3389/fgene.2023.1087878
32. Brion MJ, Shakhbazov K, Visscher PM. Calculating statistical power in Mendelian randomization studies. Int J Epidemiol. 2013;42(5):1497–1501. doi:10.1093/ije/dyt179
33. Wu Z, Lei K, Xu S, He J, Shi E. Establishing a prognostic model based on ulceration and immune related genes in melanoma patients and identification of EIF3B as a therapeutic target. Front Immunol. 2022;13:824946. doi:10.3389/fimmu.2022.824946
34. Ridker PM, Everett BM, Thuren T, et al. Antiinflammatory therapy with canakinumab for atherosclerotic disease. N Engl J Med. 2017;377(12):1119–1131. doi:10.1056/NEJMoa1707914
35. Khallou-Laschet J, Varthaman A, Fornasa G, et al. Macrophage plasticity in experimental atherosclerosis. PLoS One. 2010;5(1):e8852. doi:10.1371/journal.pone.0008852
36. Jinnouchi H, Guo L, Sakamoto A, et al. Diversity of macrophage phenotypes and responses in atherosclerosis. Cell Mol Life Sci. 2020;77(10):1919–1932. doi:10.1007/s00018-019-03371-3
37. Xie Y, Chen H, Qu P, Qiao X, Guo L, Liu L. Novel insight on the role of Macrophages in atherosclerosis: focus on polarization, apoptosis and efferocytosis. Int Immunopharmacol. 2022;113(Pt A):109260. doi:10.1016/j.intimp.2022.109260
38. Liu X, Qin J, Nie J, et al. ANGPTL2+cancer-associated fibroblasts and SPP1+macrophages are metastasis accelerators of colorectal cancer. Front Immunol. 2023;14:1185208. doi:10.3389/fimmu.2023.1185208
39. Wu J, Shen Y, Zeng G, Liang Y, Liao G. SPP1(+) TAM subpopulations in tumor microenvironment promote intravasation and metastasis of head and neck squamous cell carcinoma. Cancer Gene Ther. 2023. doi:10.1038/s41417-023-00704-0
40. Ye Q, Xu G, Xue C, et al. Urinary SPP1 has potential as a non-invasive diagnostic marker for focal segmental glomerulosclerosis. FEBS Open Bio. 2023;13(11):2061–2080. doi:10.1002/2211-5463.13704
41. Liao Y, Wu C, Li Y, Wen J, Zhao D. MIF is a critical regulator of mononuclear phagocytic infiltration in hepatocellular carcinoma. iScience. 2023;26(8):107273. doi:10.1016/j.isci.2023.107273
42. Kis-Toth K, Rajani GM, Simpson A, et al. Recombinant factor VIII Fc fusion protein drives regulatory macrophage polarization. Blood Adv. 2018;2(21):2904–2916. doi:10.1182/bloodadvances.2018024497
43. Cucak H, Grunnet LG, Rosendahl A. Accumulation of M1-like macrophages in type 2 diabetic islets is followed by a systemic shift in macrophage polarization. J Leukoc Biol. 2014;95(1):149–160. doi:10.1189/jlb.0213075
44. Honold L, Nahrendorf M. Resident and monocyte-derived macrophages in cardiovascular disease. Circ Res. 2018;122(1):113–127. doi:10.1161/CIRCRESAHA.117.311071
45. Chinetti-Gbaguidi G, Colin S, Staels B. Macrophage subsets in atherosclerosis. Nat Rev Cardiol. 2015;12(1):10–17. doi:10.1038/nrcardio.2014.173
46. Ruder AV, Wetzels SMW, Temmerman L, Biessen EAL, Goossens P. Monocyte heterogeneity in cardiovascular disease. Cardiovasc Res. 2023;119(11):2033–2045. doi:10.1093/cvr/cvad069
47. Zhao M, Wang S, Zuo A, et al. HIF-1alpha/JMJD1A signaling regulates inflammation and oxidative stress following hyperglycemia and hypoxia-induced vascular cell injury. Cell Mol Biol Lett. 2021;26(1):40. doi:10.1186/s11658-021-00283-8
48. Kumano-Kuramochi M, Shimozu Y, Wakita C, et al. Identification of 4-hydroxy-2-nonenal-histidine adducts that serve as ligands for human lectin-like oxidized LDL receptor-1. Biochem J. 2012;442(1):171–180. doi:10.1042/BJ20111029
49. Roy P, Orecchioni M, Ley K. How the immune system shapes atherosclerosis: roles of innate and adaptive immunity. Nat Rev Immunol. 2022;22(4):251–265. doi:10.1038/s41577-021-00584-1
50. Cheng S, Li Z, Gao R, et al. A pan-cancer single-cell transcriptional atlas of tumor infiltrating myeloid cells. Cell. 2021;184(3):792–809 e23. doi:10.1016/j.cell.2021.01.010
51. Calandra T, Roger T. Macrophage migration inhibitory factor: a regulator of innate immunity. Nat Rev Immunol. 2003;3(10):791–800. doi:10.1038/nri1200
52. Morand EF, Leech M, Bernhagen J. MIF: a new cytokine link between rheumatoid arthritis and atherosclerosis. Nat Rev Drug Discov. 2006;5(5):399–410. doi:10.1038/nrd2029
53. Sinitski D, Kontos C, Krammer C, Asare Y, Kapurniotu A, Bernhagen J. Macrophage migration inhibitory factor (MIF)-based therapeutic concepts in atherosclerosis and inflammation. Thromb Haemost. 2019;119(4):553–566. doi:10.1055/s-0039-1677803
54. Bernhagen J, Krohn R, Lue H, et al. MIF is a noncognate ligand of CXC chemokine receptors in inflammatory and atherogenic cell recruitment. Nat Med. 2007;13(5):587–596. doi:10.1038/nm1567
55. Zernecke A, Bernhagen J, Weber C. Macrophage migration inhibitory factor in cardiovascular disease. Circulation. 2008;117(12):1594–1602. doi:10.1161/circulationaha.107.729125
56. Santos LL, Lacey D, Yang Y, Leech M, Morand EF. Activation of synovial cell p38 MAP kinase by macrophage migration inhibitory factor. J Rheumatol. 2004;31(6):1038–1043.
57. Leech M, Lacey D, Xue JR, et al. Regulation of p53 by macrophage migration inhibitory factor in inflammatory arthritis. Arthritis Rheum. 2003;48(7):1881–1889. doi:10.1002/art.11165
58. Vecchi L, Mota STS, Zóia MAP, et al. Interleukin-6 signaling in triple negative breast cancer cells elicits the annexin A1/Formyl peptide receptor 1 axis and affects the tumor microenvironment. Cells. 2022;11(10):1705. doi:10.3390/cells11101705
59. Leslie J, Millar BJ, Del Carpio Pons A, et al. FPR-1 is an important regulator of neutrophil recruitment and a tissue-specific driver of pulmonary fibrosis. JCI Insight. 2020;5:4.
60. Dong K, Chen W, Pan X, et al. FCER1G positively relates to macrophage infiltration in clear cell renal cell carcinoma and contributes to unfavorable prognosis by regulating tumor immunity. BMC Cancer. 2022;22(1):140. doi:10.1186/s12885-022-09251-7
61. Fu L, Cheng Z, Dong F, et al. Enhanced expression of FCER1G predicts positive prognosis in multiple myeloma. J Cancer. 2020;11(5):1182–1194. doi:10.7150/jca.37313
62. Küster H, Thompson H, Kinet JP. Characterization and expression of the gene for the human Fc receptor gamma subunit. Definition of a new gene family. J Biol Chem. 1990;265(11):6448–6452. doi:10.1016/S0021-9258(19)39347-0
63. Meng Y, Zhang C, Liang L, et al. Identification of potential key genes involved in the carotid atherosclerosis. Clin Interv Aging. 2021;16:1071–1084. doi:10.2147/cia.S312941
64. Centa M, Jin H, Hofste L, et al. Germinal center-derived antibodies promote atherosclerosis plaque size and stability. Circulation. 2019;139(21):2466–2482. doi:10.1161/circulationaha.118.038534
65. Park YM. CD36, a scavenger receptor implicated in atherosclerosis. Exp Mol Med. 2014;46(6):e99. doi:10.1038/emm.2014.38
66. Luo Y, Duan H, Qian Y, et al. Macrophagic CD146 promotes foam cell formation and retention during atherosclerosis. Cell Res. 2017;27(3):352–372. doi:10.1038/cr.2017.8
67. Kuchibhotla S, Vanegas D, Kennedy DJ, et al. Absence of CD36 protects against atherosclerosis in ApoE knock-out mice with no additional protection provided by absence of scavenger receptor A I/II. Cardiovasc Res. 2008;78(1):185–196. doi:10.1093/cvr/cvm093
68. Hu YW, Wu SG, Zhao JJ, et al. VNN1 promotes atherosclerosis progression in apoE-/- mice fed a high-fat/high-cholesterol diet. J Lipid Res. 2016;57(8):1398–1411. doi:10.1194/jlr.M065565
69. Chen Y, Meng D, Wang H, et al. VAMP8 facilitates cellular proliferation and temozolomide resistance in human glioma cells. Neuro Oncol. 2015;17(3):407–418. doi:10.1093/neuonc/nou219
70. Kondkar AA, Bray MS, Leal SM, et al. VAMP8/endobrevin is overexpressed in hyperreactive human platelets: suggested role for platelet microRNA. J Thromb Haemost. 2010;8(2):369–378. doi:10.1111/j.1538-7836.2009.03700.x
71. Lu Y, Zhang X, Hu W, Yang Q. The identification of candidate biomarkers and pathways in atherosclerosis by integrated bioinformatics analysis. Comput Math Methods Med. 2021;2021:6276480. doi:10.1155/2021/6276480
 © 2024 The Author(s). This work is published and licensed by Dove Medical Press Limited. The
full terms of this license are available at https://www.dovepress.com/terms
and incorporate the Creative Commons Attribution
- Non Commercial (unported, 3.0) License.
By accessing the work you hereby accept the Terms. Non-commercial uses of the work are permitted
without any further permission from Dove Medical Press Limited, provided the work is properly
attributed. For permission for commercial use of this work, please see paragraphs 4.2 and 5 of our Terms.
© 2024 The Author(s). This work is published and licensed by Dove Medical Press Limited. The
full terms of this license are available at https://www.dovepress.com/terms
and incorporate the Creative Commons Attribution
- Non Commercial (unported, 3.0) License.
By accessing the work you hereby accept the Terms. Non-commercial uses of the work are permitted
without any further permission from Dove Medical Press Limited, provided the work is properly
attributed. For permission for commercial use of this work, please see paragraphs 4.2 and 5 of our Terms.