")
Back to Journals » Diabetes, Metabolic Syndrome and Obesity » Volume 16
Ultrasound Assessment of the Gastrocnemius Muscle as a Potential Tool for Identifying Sarcopenia in Patients with Type 2 Diabetes
Authors Wei W , Xie C, Cao R, Que Y, Zhong X, Chen Z , Lv F , Kang Q , Lin R , Cao B, Lai X, Tu M
Received 15 August 2023
Accepted for publication 25 October 2023
Published 30 October 2023 Volume 2023:16 Pages 3435—3444
DOI https://doi.org/10.2147/DMSO.S435517
Checked for plagiarism Yes
Review by Single anonymous peer review
Peer reviewer comments 2
Editor who approved publication: Dr Konstantinos Tziomalos
Wen Wei,1,2,* Chengwen Xie,3,* Ronghua Cao,4,* Yanwen Que,3 Xuejing Zhong,5 Zheyuan Chen,6 Fenyan Lv,6 Qianqian Kang,6 Ruiyu Lin,6 Baozhen Cao,7 Xiaomin Lai,7 Mei Tu1
1Department of Endocrinology, Fujian Longyan First Hospital, Longyan First Affiliated Hospital of Fujian Medical University, Longyan, 364000, People’s Republic of China; 2Department of Endocrinology, Zhujiang Hospital, Southern Medical University, Guangzhou, 510280, People’s Republic of China; 3Department of Ultrasonography, Fujian Longyan First Hospital, Longyan First Affiliated Hospital of Fujian Medical University, Longyan, 364000, People’s Republic of China; 4Department of Nuclear Medicine, Fujian Longyan First Hospital, Longyan First Affiliated Hospital of Fujian Medical University, Longyan, 364000, People’s Republic of China; 5Department of Science and Education, Fujian Longyan First Hospital, Longyan First Affiliated Hospital of Fujian Medical University, Longyan, 364000, People’s Republic of China; 6Department of Endocrinology, Fujian Longyan First Hospital, Fujian Medical University, Fuzhou, 350004, People’s Republic of China; 7Department of Pulmonary and Critical Care Medicine, Fujian Longyan First Hospital, Longyan First Affiliated Hospital of Fujian Medical University, Longyan, 364000, People’s Republic of China
*These authors contributed equally to this work
Correspondence: Mei Tu, Department of Endocrinology, Fujian Longyan First Hospital, Longyan First Affiliated Hospital of Fujian Medical University, Longyan, 364000, People’s Republic of China, Tel +86 5972958989, Fax +86 5972292374, Email [email protected]
Objective: This study aims to examine the clinical significance of ultrasound evaluation of the gastrocnemius muscle (GM) in identifying sarcopenia in patients with type 2 diabetes (T2D).
Methods: One hundred and fifty-three patients with T2D were included in this study. We measured the appendicular skeletal muscle mass index (ASMI), handgrip strength, and 6-meter walking speed. The US-derived muscle thickness (MT), cross-sectional area (CSA), and shear wave ultrasound elastography (SWE) of GM were also measured. We assessed the correlations between clinical indicators and US features. The model for screening sarcopenia was established using stepwise logistic regression. Stepwise linear regression was used to identify a set of variables that jointly estimated ASMI. The model’s ability to identify sarcopenia and low muscle mass was assessed by receiver operating characteristic (ROC) curve analysis.
Results: The prevalence of sarcopenia in this study was 24.2%. The CSA, MT and SWE values of the patients with sarcopenia were lower than those of patients without sarcopenia (all p < 0.05). ASMI was positively correlated with CSA (r = 0.56, p < 0.001) and MT (r = 0.39, p < 0.001). Handgrip strength was positively correlated with CSA (r = 0.45, p < 0.001), MT (r = 0.25, p < 0.001), and SWE (r = 0.26, p = 0.002). A diagnostic model for sarcopenia was established with a sensitivity of 81.1%, specificity of 75.0%, and an area under the curve (AUC) of 0.800. The estimated ASMI equation was developed and found to have a positive correlation with actual ASMI (r = 0.70, p < 0.001). It was also effective in diagnosing low muscle mass, with an AUC of 0.787 for males and 0.783 for females.
Conclusion: Ultrasonographic assessment of the gastrocnemius muscle was found to be a useful and convenient method for detecting sarcopenia in patients with T2D.
Keywords: sarcopenia, ultrasound, shear wave elastography, gastrocnemius muscle, T2D
Introduction
Sarcopenia is an age-associated syndrome characterized by a decline in skeletal muscle mass, strength, and function.1 Its prevalence has reached 20% or even higher in individuals with diabetes.2,3 The overall prevalence of sarcopenia varied from 10.4% to 28.8% among type 2 diabetic patients in China.4–6 Sarcopenia is associated with poor outcomes in patients with diabetes, including chronic kidney disease (CKD), diabetic retinopathy (DR), diabetic peripheral neuropathy (DPN), atherosclerosis, cognitive impairment, infection, and mortality.7–10 Therefore, early recognition and intervention of sarcopenia are essential to improve the prognosis of patients with diabetes.
According to the Asian Working Group for Sarcopenia (AWGS), computed tomography (CT), magnetic resonance imaging (MRI), dual-energy X-ray absorptiometry (DEXA), and bioelectrical impedance analysis (BIA) are used to measure muscle mass.1 However, these methods have limitations, such as exposure to radiation, lack of cost-effectiveness, and susceptibility to hydration status and water distribution in the body.11,12 In this context, ultrasound (US) is widely available, inexpensive, radiation-free, and useful because it can provide information on muscle quantity and quality. In previous studies, the measurement of muscle thickness (MT), cross-sectional area (CSA), fascicle length (FL), pennation angle (PA), and echogenicity have been proposed as measures to assess sarcopenia.13–15 Shear wave ultrasound elastography (SWE), a recently developed ultrasound technology, can provide quantitative information on tissue elasticity, allowing for the indirect assessment of biomechanical properties.16 Elastography has been proven to be reliable in assessing musculoskeletal tissues in various clinical settings. For example, it has been used to measure tongue muscle stiffness in patients with obstructive sleep apnea, diaphragm and rectus femoris stiffness in patients with Chronic Obstructive Pulmonary Disease (COPD), and vastus lateralis stiffness in community-dwelling individuals.17–20 Recently, Chen et al suggested that ultrasound imaging of the femoris muscle and SWE might be useful for assessing sarcopenia in elderly patients with type 2 diabetes.21
Previous studies on sarcopenia have analyzed different muscles, such as the biceps brachii, triceps brachii, thenar muscle, quadriceps, tibialis anterior, rectus abdominis, diaphragm, and so on. It is known that age-related muscle loss is not uniform throughout the body, and sarcopenia affects those with rich type II (fast-twitch) muscle fibers, such as the quadriceps, gastrocnemius and psoas major. However, there is some difficulty in exposing the patient’s thigh in a clinical setting when using ultrasound to assess the quadriceps femoris. The gastrocnemius muscle (GM) is easier to obtain than the quadriceps, and because it is a pennate muscle, it allows for the assessment of structural parameters such as FL and PA. Therefore, this study aimed to determine the clinical value of ultrasound assessment, including SWE of the gastrocnemius muscle in identifying sarcopenia in patients with type 2 diabetes.
Methods
Study Population
The cross-sectional study included adult inpatients (≥18 years of age) who were diagnosed with T2DM according to the criteria set by the American Diabetes Association (ADA) at Longyan First Affiliated Hospital of Fujian Medical University, Fujian, China, between December 2021 and December 2022. Patients with other types of diabetes and pregnant women were excluded. We also excluded patients with ketoacidosis, hyperosmolar status, acute severe infection, kidney diseases requiring hemodialysis, severe cardiac insufficiency, autoimmune disease, neurological diseases and orthopedic diseases causing mobility impairment, and incomplete clinical parameters such as muscle mass, muscle strength, and physical performance. Eventually, 153 patients were included (Figure 1). The study complied with the Declaration of Helsinki and was approved by the Institutional Ethics Research Committee of Longyan First Affiliated Hospital of Fujian Medical University (approval number LYREC2021-014-01). All patients provided written informed consent to participate in the study.
 |
Figure 1 Flowchart of participants through the study. |
Data Collection and Clinical Definition
Demographic variables and health information, including age, sex, smoking status, drinking status, and history of diagnosed diseases, were collected via a standard questionnaire by our trained staff. Self-reported health conditions included physician-diagnosed history of hypertension, stroke, coronary artery disease (CAD), congestive heart failure (CHF), chronic obstructive pulmonary disease (COPD) and other diseases. Clinical features and biochemical examination data such as blood glucose, glycosylated hemoglobin (HbA1c), serum albumin, serum creatinine, etc., were obtained from the electronic medical record system. Height, weight, and blood pressure (BP) were assessed by the nurse upon admission using a standardized form. Venous blood samples were collected in the early morning after an overnight fast.
Body mass index (BMI) is calculated by dividing weight (kg) by the square of height (m). The estimated glomerular filtration rate (eGFR) was calculated based on serum creatinine using the Chronic Kidney Disease Epidemiology Collaboration (CKD-EPI) 2009 equation.22
Muscle Mass, Grip Strength, and Physical Performance Assessment
The patient was placed in the supine position. We obtained appendicular skeletal muscle mass (ASM) by analyzing the muscle content of the entire body using the Hologic Discovery Wi dual-energy X-ray bone densitometer (Hologic Discovery QDR Series). The Appendicular Skeletal Muscle Mass Index (ASMI) was calculated using the following formula:  . Low muscle mass was defined as ASMI <7.0 kg/m2 for men and <5.4 kg/m2 for women.23
We used the Camry electronic grip strength meter (EH101; Camry Scale) to measure grip strength. The patients extended their arms for measurement while standing. Grip strength was measured in the sitting position if the patient was unable to stand independently. The dominant hand contracted twice with full force at equal distances. The tester recorded the highest value as the maximum grip strength. Low muscle strength was defined as handgrip strength <28 kg for men and <18 kg for women.23
This study defined low physical performance based on a 6-meter walk. We measured the time taken to walk 6 meters at a normal pace from a moving start, without deceleration, and recorded the average result of at least 2 trials as the measured speed. We used automatic timing for the trials. Low physical performance was 6-meter walk speed <1.0 m/s.23
The definition of sarcopenia followed the guidelines from the Asian Working Group for Sarcopenia (AWGS) 2019, which include low muscle mass, low muscle strength, or poor physical performance. Severe sarcopenia was defined as having both low muscle mass and low muscle strength, as well as poor physical performance.23
Ultrasound Measurements
All US and SWE assessments were performed by a single sonographer with 5 years of experience in musculoskeletal ultrasound. The US device (Siemens ACUSON Sequoia, Germany) was equipped with an Acoustic Radiation Force Impulse (ARFI) imaging system. All images were obtained using the same linear-array transducer (frequency range: 4–9 MHz) with pre-set “musculoskeletal (MSK)” parameters.
CSA of the GM was measured on the posterior side of the right shank, specifically at a point 30% proximal between the popliteal fossa and the posterior calcaneus. The measurements were taken while the participants were in the prone position, with their legs extended and their feet hanging off the side of the examination table. The distance between the deep and superficial aponeurosis of the GM, measured at this location, was MT.24 The angle at which the fibers of the GM muscle insert into the deep aponeurosis was measured on the longitudinal view by rotating the probe parallel to the medial head of the sural muscle. This measurement was taken at the same position where we measured MT. The angle was recorded as PA.25 The length of the fascicle measured between the deep and superficial aponeurosis was FL. All data were measured three times, and the average value was used for further analysis.
Gastrocnemius measurements for SWE were performed under static and passive stretch conditions. We set the size of the region of interest (ROI) for SWE (diameter = 10 mm) within a predefined square sampling box.26 The diameter and inspection depth of the ROI were set to 3 mm and 1–2 cm, respectively. ROI values were calculated in kPa, and the SWE was color-coded in dark blue (less than 36 kPa), light blue (36–72 kPa) and green, yellow and red (greater than 180 kPa).27 The measurement indicators were SWEstraight and SWEbent. Each patient was measured three times, and the average was calculated.
Statistical Analysis
Continuous variables were expressed as mean ± standard deviation (SD) or median (interquartile range, IQR), and categorical variables were expressed as frequency counts and percentages. For comparisons between groups, the χ2 test or Fisher’s exact test was used for categorical variables, and the two-sample independent t-test was used for continuous variables.
The relationships between clinical indicators and US characteristics were evaluated using Spearman correlation coefficient analysis. The link between US characteristics and sarcopenia was investigated using univariable and multivariable logistic regression. Stepwise logistic regression was used to build a model to screen for sarcopenia. A set of factors that jointly calculated ASMI was identified using univariable linear regression, multiple linear regression, and stepwise regression. Variables put into the model were carefully chosen based on variables having p-values less than 0.05 in the baseline or in univariable regression analysis. The merit of the equations was judged according to the Akaike information criterion (AIC). The ability of the models to identify sarcopenia and low muscle mass was evaluated using receiver operating characteristic (ROC) curve analysis. The Yoden index of score was calculated by sensitivity plus specificity. The cut-off value was obtained by the maximum value of the Youden index. The calibration of the models was described by the Hosmer–Lemeshow test.
All analyses were performed using R, version 4.2.1 software (R Foundation for Statistical Computing, Vienna, Austria). A two-sided p value <0.05 indicated significance for all analyses.
Results
Patient Characteristics
The mean age of the 153 enrolled patients was 57.8 years, and 91 (59.5%) were males. The mean height was 162.59 cm, mean weight was 65.77 kg, mean BMI was 24.75 kg/m2, mean serum albumin (ALB) was 40.33 g/L, and mean serum creatinine (Cr) was 0.82 mg/dL. The mean actual ASMI was 6.60 kg/m2, mean handgrip strength was 28.37 kg, and mean time taken to walk 6 meters was 5.98s. The mean CSA of GM was 13.53 cm2, mean MT was 2.18 cm, mean FL was 3.98 cm, and mean PA was 24.28°. The median SWEstraight was 10.60 with a range of 8.90 to 12.40 kPa, and median SWEbent was 17.95 with a range of 13.77 to 22.15 kPa.
The prevalence of sarcopenia was 24.2%, of which 7 cases were severe sarcopenia among 37 patients, accounting for 18.9%. The prevalence of low muscle mass was 49.0%. Patients with sarcopenia were older, had lower weight, lower ALB, and higher cystatin C (CYSC) levels than those without sarcopenia (all p < 0.05). The CSA, MT, FL, SWEstraight and SWEbent values in patients with sarcopenia were lower than those in patients without sarcopenia (all p < 0.05). Study population characteristics are summarized in Table 1.
 |
Table 1 Baseline Characteristics of Patients with and without Sarcopenia |
Correlations Between Clinical Indicators and US Features
Spearman correlation coefficient analysis showed that ASMI was significantly and positively correlated with CSA (r = 0.56, p < 0.001), MT (r = 0.39, p < 0.001), FL (r = 0.27, p < 0.001) and PA (r = 0.22, p < 0.001). Handgrip strength was significantly and positively correlated with CSA (r = 0.45, p < 0.001), MT (r = 0.25, p < 0.001), FL (r = 0.21, p = 0.002), PA (r = 0.16, p = 0.021) and SWEstraight (r = 0.26, p = 0.002) (Table 2).
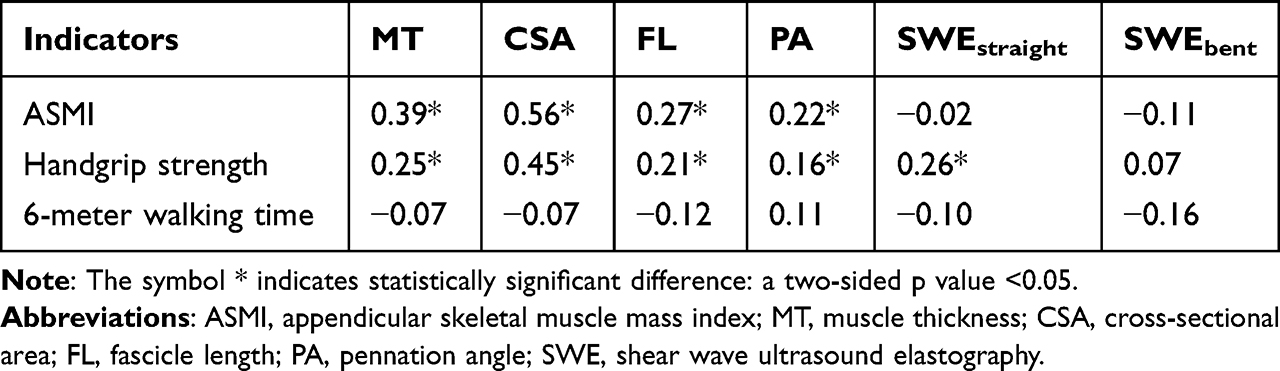 |
Table 2 Correlation Between Clinical Indicators and US Features |
Validity of US Screening for Sarcopenia
The patients’ basic characteristics (age and weight), laboratory examination (serum ALB and serum CYSC) and US features (CSA, MT, FL and SWEstraight) that were statistically significant in univariable logistic regression were inputted into multivariable logistic regression, and then variables with p-value <0.05 in the multivariable regression were inputted into stepwise regression analysis. Finally, the independent indicators for identifying sarcopenia were age, CSA and SWEstraight (Table 3). A logistic regression equation was established as follows:  . The model achieved 81.1% sensitivity, 75.0% specificity, an area under the curve (AUC) of 0.800 (95% confidence interval [CI]: 0.718 to 0.882) (cutoff value = 0.25), and a Hosmer–Lemeshow χ2 statistic of 9.20 (p = 0.326) (Figure 2). The diagnostic value of the model in male and female, respectively, was also shown in Figure 2. The results of ROC of age, CSA, and SWEstraight in identifying sarcopenia are shown in Supplementary Figure 1.
 |
Table 3 Stepwise Regression of Sarcopenia |
 |
Figure 2 The results of ROC curve of the model in identifying sarcopenia. (A) The AUC, sensitivity and specificity of the model in total participants. (B) The AUC, sensitivity and specificity of the model in male. (C) The AUC, sensitivity and specificity of the model in female. |
Validity of US Screening for Low Muscle Mass
The patients’ basic characteristics (age, sex, height and weight), laboratory examination (serum Cr) and US features (CSA, MT and FL) that were statistically significant in univariable linear regression were inputted into multivariable linear regression, and then variables with p-value <0.05 in the multivariable regression were inputted into stepwise regression analysis. Finally, the estimated ASMI equation for estimating ASMI included weight, Cr and MT (Table 4). A linear regression equation was established as follows: estimated ASMI = 0.625 + 0.049 × weight + 0.987 × Cr + 0.762 × MT. The estimated ASMI was significantly positively correlated with the actual ASMI (r = 0.70, p < 0.001) (Figure 3). The model achieved 69.6% sensitivity, 84.8% specificity, and an AUC of 0.787 (95% CI: 0.702 to 0.872) (cutoff value = 6.52 kg/m2) in male. In female, the AUC was 0.783 (95% CI: 0.680 to 0.885), and at a cutoff of 5.70 kg/m2, the model exhibited a sensitivity of 77.3% and a specificity of 73.0% for detecting low muscle mass (Figure 4).
 |
Table 4 Stepwise Regression of ASMI |
 |
Figure 3 Correlations between the estimated ASMI and actual ASMI. |
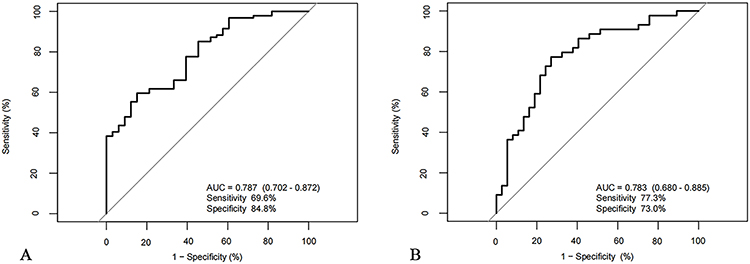 |
Figure 4 The results of ROC curve of the model in identifying low muscle mass. (A) The AUC, sensitivity and specificity of the model in male. (B) The AUC, sensitivity and specificity of the model in female. Abbreviations: ROC, receiver operating characteristic; AUC, area under the curve; ASMI, appendicular skeletal muscle mass index. |
Discussion
The present study was the first to explore the value of ultrasound assessment including SWE of the gastrocnemius muscle in identifying sarcopenia in patients with type 2 diabetes. The study demonstrated that CSA and SWEstraight of the gastrocnemius muscle were independently associated with sarcopenia, while MT was independently associated with low muscle mass in type 2 diabetic patients. We developed the equation including age, CSA and SWEstraight which could identify sarcopenia with high sensitivity and specificity. Furthermore, the estimated ASMI equation using weight, Cr and MT to estimate ASMI was also developed. The equation can relatively accurately estimate ASMI and identify low muscle mass in type 2 diabetic patients.
Muscle ultrasound is a new diagnostic tool for sarcopenia. Previous studies have shown that muscle ultrasound can be used successfully to detect changes in both muscle mass and quality in a variety of clinical conditions, such as chronic kidney disease, cirrhosis, rheumatoid arthritis, and hip fracture.28–31 So far, there have been two studies on the use of muscle ultrasound in diabetic patients. Tan et al found that muscle thicknesses of rectus femoris (RF), vastus intermedius (VI), vastus medialis (VM) and vastus lateralis (VL) and pennate angle of VI and VM were significantly lower in type 1 diabetes than in the control group.32 Chen et al showed that in elderly patients with type 2 diabetes, patients with sarcopenia had smaller muscle CSA and lower stiffness of RF than patients without sarcopenia. They also used age, CSA and SWE to develop a diagnostic model for sarcopenia.21 Previous studies demonstrated that ultrasound measurement of gastrocnemius muscle could identify sarcopenia in hospitalized patients older than 60 years.33 Considering that the gastrocnemius muscle was more readily available than the quadriceps, we chose gastrocnemius muscle as the measured muscle. Similarly, we found that type 2 diabetic patients with sarcopenia had lower CSA, MT and SWE values than patients without sarcopenia, and we also developed a diagnostic model for sarcopenia using age, CSA and SWE.
In addition, our study demonstrated that FL of gastrocnemius muscle was lower in patients with sarcopenia, and that CSA, MT and FL were positively correlated with ASMI. However, there was no significant difference in PA values between patients with and without sarcopenia, which may be partly explained by the small sample size. Ultrasound-measured MT of gastrocnemius muscle correlated well with ASMI assessed by DXA.34 The correlation between MT and ASMI was also confirmed in our study. What made our study different was that we also combined available clinical values: weight and Cr with ultrasonic parameter: MT to develop estimated ASMI equation that could identify low muscle mass in type 2 diabetic patients.
MT and CSA are two common ultrasound parameters of muscle mass, which have been widely used in the study of sarcopenia.35 The loss of muscle mass is manifested by a decrease in muscle thickness and muscle cross-sectional area. According to the results of our regression analysis, MT and CSA were entered into two models, respectively, which were also consistent with the theory and previous studies. It is well known that a loss of muscle mass leads to decline in muscle strength. Therefore, MT and CSA could indirectly reflect handgrip strength. Our study also showed that handgrip strength was positively correlated with CSA and MT. SWE is an ultrasound imaging method based on detecting the propagation of shear waves in tissues. The method uses the inversion algorithms to map the waves into elastograms and determine the stiffness of the tissue by measuring the shear modulus.36,37 In previous studies and in our studies, SWE was lower in patients with sarcopenia than in patients without sarcopenia. It may be due to a decrease in the number of muscle fibers and an increase in the amount of connective tissue such as adipose and extracellular matrix in patients with sarcopenia, resulting in a more significant decrease in muscle stiffness in patients with sarcopenia.33,38 SWE, which spatially represents soft tissue stiffness and measures muscle quality, appears to be a reliable technique for assessing muscle fibrosis in sarcopenia. Cr is an endogenous product released by muscle, and its blood concentration depends on muscle mass.39 The entry of Cr into the estimated ASMI equation is understandable and reasonable.
The current study has several limitations. First, the study did not measure MT, CSA and FL under passive stretch condition of gastrocnemius muscle. However, we measured SWE of gastrocnemius muscle under static and passive stretch conditions and developed the relatively accurate equations. Second, there was relatively small sample size in the study. However, we referred to the previous literature and estimated the sample size before the study. Future investigations with a larger number of subjects are needed to verify the generalizability. Third, we did not perform the internal and external validation of our models, which should be done in the future research. Finally, the study was limited to inpatients with type 2 diabetes, and whether the findings can be applied to outpatients or community dwelling ones with type 2 diabetes remains unknown. These will be studied in the future.
Conclusion
In conclusion, ultrasound assessment including SWE of the gastrocnemius muscle may be useful in detecting sarcopenia in type 2 diabetic patients. The models developed in our study based on available clinical values and muscle ultrasonic parameters should be confirmed in the future large sample research. In addition, it is also necessary to further study the application value of muscle ultrasound in different populations and to compare muscle ultrasound with the gold standard.
Data Sharing Statement
Data relevant to this study are available from the corresponding authors upon reasonable request.
Ethics Approval and Consent to Participate
The study was approved by the Institutional Ethics Research Committee of Longyan First Affiliated Hospital of Fujian Medical University. All participants provided written informed consent prior to enrolment.
Consent for Publication
All authors support the submission to this journal.
Author Contributions
All authors made a significant contribution to the work reported, whether that is in the conception, study design, execution, acquisition of data, analysis and interpretation, or in all these areas; took part in drafting, revising or critically reviewing the article; gave final approval of the version to be published; have agreed on the journal to which the article has been submitted; and agree to be accountable for all aspects of the work.
Funding
This work was supported by the Longyan City Science and Technology Plan Project (Grant number 2022LYF17044) and Startup Fund for scientific research, Fujian Medical University (Grant number 2021QH1331).
Disclosure
The authors declare that they have no competing interests for this work.
References
1. Cruz-Jentoft AJ, Bahat G, Bauer J, et al. Sarcopenia: revised European consensus on definition and diagnosis. Age Ageing. 2019;48(1):16–31. doi:10.1093/ageing/afy169
2. Chung SM, Moon JS, Chang MC. Prevalence of sarcopenia and its association with diabetes: a meta-analysis of Community-Dwelling Asian Population. Front Med. 2021;8:681232. doi:10.3389/fmed.2021.681232
3. Ai Y, Xu R, Liu L. The prevalence and risk factors of sarcopenia in patients with type 2 diabetes mellitus: a systematic review and meta-analysis. Diabetol Metab Syndr. 2021;13(1):93. doi:10.1186/s13098-021-00707-7
4. Chen F, Xu S, Wang Y, et al. Risk factors for sarcopenia in the elderly with type 2 diabetes mellitus and the effect of metformin. J Diabetes Res. 2020;2020:3950404. doi:10.1155/2020/3950404
5. Fu Q, Zhang Z, Hu W, Yang Y. The correlation of triglyceride/high-density lipoprotein cholesterol ratio with muscle mass in type 2 diabetes patients. BMC Endocr Disord. 2023;23(1):93. doi:10.1186/s12902-023-01349-8
6. Cui M, Gang X, Wang G, et al. A cross-sectional study: associations between sarcopenia and clinical characteristics of patients with type 2 diabetes. Medicine. 2020;99(2):e18708. doi:10.1097/MD.0000000000018708
7. Yang Q, Zhang Y, Zeng Q, et al. Correlation between diabetic peripheral neuropathy and sarcopenia in patients with type 2 diabetes mellitus and diabetic foot disease: a cross-sectional study. Diabetes Metab Syndr Obes. 2020;13:377–386. doi:10.2147/DMSO.S237362
8. Nakanishi S, Iwamoto M, Shinohara H, Iwamoto H, Kaneto H. Impact of sarcopenia on glycemic control and atherosclerosis in Japanese patients with type 2 diabetes: cross-sectional study using outpatient clinical data. Geriatr Gerontol Int. 2020;20(12):1196–1201. doi:10.1111/ggi.14063
9. Zhang Y, Weng S, Huang L, Shen X, Zhao F, Yan S. Association of sarcopenia with a higher risk of infection in patients with type 2 diabetes. Diabetes Metab Res Rev. 2022;38(1):e3478. doi:10.1002/dmrr.3478
10. Miyake H, Kanazawa I, Tanaka K-I, Sugimoto T. Low skeletal muscle mass is associated with the risk of all-cause mortality in patients with type 2 diabetes mellitus. Ther Adv Endocrinol Metab. 2019;10:2042018819842971. doi:10.1177/2042018819842971
11. Kashani KB, Frazee EN, Kukralova L, et al. Evaluating muscle mass by using markers of kidney function: development of the sarcopenia index. Crit Care Med. 2017;45(1):e23–e29. doi:10.1097/CCM.0000000000002013
12. Ozturk Y, Deniz O, Coteli S, et al. Global Leadership Initiative on Malnutrition criteria with different muscle assessments including muscle ultrasound with hospitalized internal medicine patients. JPEN J Parenter Enteral Nutr. 2022;46(4):936–945. doi:10.1002/jpen.2230
13. Biver E, Pepe J, de Sire A, Chevalley T, Ferrari S. Associations between radius low-frequency axial ultrasound velocity and bone fragility in elderly men and women. Osteoporos Int. 2019;30(2):411–421. doi:10.1007/s00198-018-4725-0
14. Perkisas S, Bastijns S, Baudry S, et al. Application of ultrasound for muscle assessment in sarcopenia: 2020 SARCUS update. Eur Geriatr Med. 2021;12(1):45–59. doi:10.1007/s41999-020-00433-9
15. Zhu S, Lin W, Chen S, et al. The correlation of muscle thickness and pennation angle assessed by ultrasound with sarcopenia in elderly Chinese Community Dwellers. Clin Interv Aging. 2019;14:987–996. doi:10.2147/CIA.S201777
16. Sendur HN, Cindil E, Cerit MN, Kilic P, Gultekin II, Oktar SO. Evaluation of effects of aging on skeletal muscle elasticity using shear wave elastography. Eur J Radiol. 2020;128:109038. doi:10.1016/j.ejrad.2020.109038
17. Chu CA, Chen YJ, Chang KV, Wu WT, Ozcakar L. Reliability of sonoelastography measurement of tongue muscles and its application on obstructive sleep apnea. Front Physiol. 2021;12:654667. doi:10.3389/fphys.2021.654667
18. Xu JH, Wu ZZ, Tao FY, et al. Ultrasound shear wave elastography for evaluation of diaphragm stiffness in patients with stable COPD: a pilot trial. J Ultrasound Med. 2021;40(12):2655–2663. doi:10.1002/jum.15655
19. Deng M, Zhou X, Li Y, et al. Ultrasonic elastography of the rectus femoris, a potential tool to predict sarcopenia in patients with chronic obstructive pulmonary disease. Front Physiol. 2021;12:783421. doi:10.3389/fphys.2021.783421
20. Maeda A, Yamagishi M, Otsuka Y, et al. Characteristics of the passive muscle stiffness of the vastus lateralis: a feasibility study to assess muscle fibrosis. Int J Environ Res Public Health. 2021;18(17):8947.
21. Chen ZT, Jin FS, Guo LH, et al. Value of conventional ultrasound and shear wave elastography in the assessment of muscle mass and function in elderly people with type 2 diabetes. Eur Radiol. 2023;33(6):4007–4015. doi:10.1007/s00330-022-09382-2
22. Seidu S, Barrat J, Khunti K. Clinical update: the important role of dual kidney function testing (ACR and eGFR) in primary care: identification of risk and management in type 2 diabetes. Prim Care Diabetes. 2020;14(4):370–375. doi:10.1016/j.pcd.2020.02.006
23. Chen LK, Woo J, Assantachai P, et al. Asian Working Group for Sarcopenia: 2019 consensus update on sarcopenia diagnosis and treatment. J Am Med Dir Assoc. 2020;21(3):300–307 e2. doi:10.1016/j.jamda.2019.12.012
24. Wang J, Hu Y, Tian G. Ultrasound measurements of gastrocnemius muscle thickness in older people with sarcopenia. Clin Interv Aging. 2018;13:2193–2199. doi:10.2147/CIA.S179445
25. Narici M, Franchi M, Maganaris C. Muscle structural assembly and functional consequences. J Exp Biol. 2016;219(Pt 2):276–284. doi:10.1242/jeb.128017
26. Alfuraih AM, Tan AL, O’Connor P, Emery P, Wakefield RJ. The effect of ageing on shear wave elastography muscle stiffness in adults. Aging Clin Exp Res. 2019;31(12):1755–1763. doi:10.1007/s40520-019-01139-0
27. Yoo MH, Kim HJ, Choi IH, et al. Shear wave elasticity by tracing total nodule showed high reproducibility and concordance with fibrosis in thyroid cancer. BMC Cancer. 2020;20(1):118. doi:10.1186/s12885-019-6437-z
28. Wilkinson TJ, Gore EF, Vadaszy N, Nixon DGD, Watson EL, Smith AC. Utility of ultrasound as a valid and accurate diagnostic tool for sarcopenia: sex-specific cutoff values in Chronic Kidney Disease. J Ultrasound Med. 2021;40(3):457–467. doi:10.1002/jum.15421
29. Tandon P, Low G, Mourtzakis M, et al. A model to identify sarcopenia in patients with cirrhosis. Clin Gastroenterol Hepatol. 2016;14(10):1473–1480 e3. doi:10.1016/j.cgh.2016.04.040
30. Dos Santos LP, Do Espirito Santo RC, Pena E, et al. Morphological parameters in quadriceps muscle were associated with clinical features and muscle strength of women with rheumatoid arthritis: a cross-sectional study. Diagnostics. 2021;11(11):2014.
31. Sanz-Paris A, Gonzalez-Fernandez M, Hueso-Del Rio LE, et al. Muscle thickness and echogenicity measured by ultrasound could detect local sarcopenia and malnutrition in older patients hospitalized for hip fracture. Nutrients. 2021;13(7);2401.
32. Tan S, Gunendi Z, Meray J, Yetkin I. The evaluation of muscle strength and architecture in type 1 diabetes mellitus: a cross-sectional study. BMC Endocr Disord. 2022;22(1):153. doi:10.1186/s12902-022-01062-y
33. Xu X, Chen Y, Cai W, et al. A multivariable model based on ultrasound imaging features of gastrocnemius muscle to identify patients with sarcopenia. J Ultrasound Med. 2023. doi:10.1002/jum.16223
34. Neira Alvarez M, Vazquez Ronda MA, Soler Rangel L, et al. Muscle assessment by ultrasonography: agreement with Dual-Energy X-Ray Absorptiometry (DXA) and relationship with physical performance. J Nutr Health Aging. 2021;25(8):956–963. doi:10.1007/s12603-021-1669-4
35. Fu H, Wang L, Zhang W, Lu J, Yang M. Diagnostic test accuracy of ultrasound for sarcopenia diagnosis: a systematic review and meta-analysis. J Cachexia Sarcopenia Muscle. 2023;14(1):57–70. doi:10.1002/jcsm.13149
36. Athanasiou A, Tardivon A, Tanter M, et al. Breast lesions: quantitative elastography with supersonic shear imaging--preliminary results. Radiology. 2010;256(1):297–303. doi:10.1148/radiol.10090385
37. Bercoff J, Tanter M, Fink M. Supersonic shear imaging: a new technique for soft tissue elasticity mapping. IEEE Trans Ultrason Ferroelectr Freq Control. 2004;51(4):396–409. doi:10.1109/tuffc.2004.1295425
38. Xu J, Fu SN, Hug F. Age-related increase in muscle stiffness is muscle length dependent and associated with muscle force in senior females. BMC Musculoskelet Disord. 2021;22(1):829. doi:10.1186/s12891-021-04519-8
39. Baxmann AC, Ahmed MS, Marques NC, et al. Influence of muscle mass and physical activity on serum and urinary creatinine and serum cystatin C. Clin J Am Soc Nephrol. 2008;3(2):348–354. doi:10.2215/CJN.02870707
 © 2023 The Author(s). This work is published and licensed by Dove Medical Press Limited. The full terms of this license are available at https://www.dovepress.com/terms.php and incorporate the Creative Commons Attribution - Non Commercial (unported, v3.0) License.
By accessing the work you hereby accept the Terms. Non-commercial uses of the work are permitted without any further permission from Dove Medical Press Limited, provided the work is properly attributed. For permission for commercial use of this work, please see paragraphs 4.2 and 5 of our Terms.
© 2023 The Author(s). This work is published and licensed by Dove Medical Press Limited. The full terms of this license are available at https://www.dovepress.com/terms.php and incorporate the Creative Commons Attribution - Non Commercial (unported, v3.0) License.
By accessing the work you hereby accept the Terms. Non-commercial uses of the work are permitted without any further permission from Dove Medical Press Limited, provided the work is properly attributed. For permission for commercial use of this work, please see paragraphs 4.2 and 5 of our Terms.