")
Back to Journals » International Journal of General Medicine » Volume 16
TRIM5 Promotes Systemic Lupus Erythematosus Through CD4(+) T Cells and Macrophage
Authors Pan Z, Yang Q, Zhang X, Xu X, Sun Y, Zhou F, Wen L
Received 17 May 2023
Accepted for publication 3 August 2023
Published 18 August 2023 Volume 2023:16 Pages 3567—3580
DOI https://doi.org/10.2147/IJGM.S416493
Checked for plagiarism Yes
Review by Single anonymous peer review
Peer reviewer comments 2
Editor who approved publication: Dr Woon-Man Kung
Zhaobing Pan,1– 3,* Qiaoshan Yang,1– 3,* Xiaojing Zhang,1– 3 Xiaoqing Xu,1– 3 Yao Sun,1– 3 Fusheng Zhou,1– 4 Leilei Wen1– 3
1Department of Dermatology, The First Affiliated Hospital, Anhui Medical University, Hefei, Anhui, People’s Republic of China; 2Institute of Dermatology, Anhui Medical University, Hefei, Anhui, People’s Republic of China; 3Key Laboratory of Dermatology (Anhui Medical University), Ministry of Education, Hefei, Anhui, People’s Republic of China; 4Inflammation and Immune Mediated Diseases Laboratory of Anhui Province, Hefei, Anhui, People’s Republic of China
*These authors contributed equally to this work
Correspondence: Fusheng Zhou; Leilei Wen, Department of Dermatology, The First Affiliated Hospital, Anhui Medical University, No. 218, Jixi Road, Shushan District, Hefei, 230000, Anhui, People’s Republic of China, Tel +86-138-5698-5934 ; +86-183-5609-9275, Fax +86-0551-63633742, Email [email protected]; [email protected]
Purpose: Systemic lupus erythematosus (SLE) is a typical autoimmune disease characterized by the involvement of multiple organs and the production of antinuclear antibodies. This study aimed to investigate the molecular mechanism of SLE.
Patients and Methods: We retrieved genome-wide gene expression levels from five public datasets with relatively large sample sizes from the Gene Expression Omnibus (GEO), and we compared the expression profiles of peripheral blood mononuclear cells (PBMCs) from SLE patients and healthy controls (HCs). The expression of seven target genes in PBMCs from 25 cases and 3 HCs was further validated by reverse-transcription quantitative PCR (RT‒qPCR). Flow cytometry was used for verifying the proportion of naive CD4(+) T cells and M2 macrophages in PBMCs from 5 cases and 4 HCs.
Results: We found 14 genes (TRIM5, FAM8A1, SHFL, LHFPL2, PARP14, IFIT5, PARP12, DDX60, IRF7, IF144, OAS1, OAS3, RHBDF2, and RSAD2) that were differentially expressed among all five datasets. The heterogeneity test under the fixed effect model showed no obvious heterogeneity of TRIM5, FAM8A1, and SHFL across different populations. TRIM5 was positively correlated with the remaining 13 genes. By separating patient samples into TRIM5-high and TRIM5-low groups, we found that up-regulated genes in the TRIM5-high group were mainly enriched in virus-related pathways. Immune cell proportion analysis and flow cytometry revealed that naive CD4(+) T cells were significantly decreased while M2 macrophages were increased in the SLE group. TRIM5 expression levels were negatively correlated with naive CD4(+) T cells but positively correlated with M2 macrophages.
Conclusion: Our data indicated that TRIM5 might be a key factor that modulates SLE etiology, possibly through naive CD4(+) T cells and M2 macrophages.
Keywords: differential gene expression analysis, gene, virus, autoimmune disease
Introduction
Systemic lupus erythematosus (SLE) is a typical autoimmune disease characterized by impaired apoptotic clearance, innate and adaptive immune system activation, complement activation, immune complex formation, and tissue inflammation, which culminate in a self-sustained autoimmune process.1 Genetic, environmental, hormonal, and immunoregulatory factors are involved in its pathogenesis,2 while the exact molecular mechanisms have not been fully revealed.
In SLE, there is a familial aggregation of SLE, RA, and autoimmune disease in general.3,4 With the rapid development of modern genetic technologies, more than 100 valuable SLE susceptibility genes/regions have been identified through genome-wide association studies (GWAS) and whole exome microarray studies.5 The products of these susceptibility genes have significantly altered functions in SLE and contribute to the pathogenic process. For example, deficiencies in the human complement factors C1q, C2, or C4 cause a large percentage of individuals to develop systemic lupus erythematosus or lupus-like symptoms. The genes encoding complement factors C2 and C4 are located within the gene cluster of MHC III class loci that have been identified as SLE-susceptible loci.6,7 The majority of the identified SLE susceptibility genes encode products of innate and adaptive immunity, and three key immune pathways specifically participate in SLE pathogenesis: clearance of apoptotic cells and immune complexes; activation of Toll-like receptor (TLR), type I interferon (IFN) and NF-κB signaling pathways; and multiple dysfunctions in T-/B-cell signaling.8
Gene expression studies, together with genetic linkage and association studies, greatly facilitated our understanding of the pathogenesis of SLE.9 The use of transcriptomic sequencing and RNA microarray techniques has become an indispensable tool for monitoring the levels of gene expression in a given organism through the organization, analysis, interpretation, and utilization of biological sequences.10 Immune cells, including macrophages, neutrophils, dendritic cells (DCs), basophils, and lymphocytes, play important roles in the pathogenesis of SLE. Even with a great number of studies, the exact extent to which these factors promote the onset of SLE is largely unknown. Combining gene expression data with immune cells by immune cell analysis may help us to explore the relationship between genetics and autoimmunity and better illustrate the pathogenesis of SLE.
Viruses are considered as a major environmental factor that triggers the autoimmune phenomenon in genetically susceptible individuals. Quite a few studies suggest that viruses are implicated in the pathogenesis of SLE.11–16 It has long been known that certain sources of infection may lead to the development of autoimmunity, especially SLE, and these sources of infection include Epstein‒Barr virus (EBV), cytomegalovirus (CMV), human endogenous retrovirus (HERV) and others.17,18 Ultraviolet (UV) light is a known trigger of skin and possibly systemic inflammation in SLE. UVB-induced HERV-associated dsRNA transcription and subsequent activation of the innate antiviral RIG-I/MDA5/IRF7 pathway led to downstream transcription of interferon-stimulated genes, which promotes type I IFN production.19 In SLE patients, dysregulation of HERV-E members has been found to mimic viral infection and further stimulate IFN response and the production of antibodies against nuclear components.20 The immune system is capable of maintaining tight control of Human Herpes Virus (HHV) infections in immune competent individuals, and cell-mediated immunity is fundamental in this regard.21 Clinical, epidemiological, and molecular data suggest the involvement of HPV infection in the pathogenesis of SLE. The possibility of an immune cross-reaction is supported by the large peptide identity of the HPV L1 protein to the human protein associated with SLE.22
Although there has been a large number of studies on SLE, the exact mechanism of the pathogenesis of SLE is not very clear. Here, by exploring public GEO datasets, we aim to investigate the genes involved in the pathogenesis of SLE and how they contribute to the development of SLE, expanding our understanding of disease initiation and development.
Materials and Methods
Patient Selection
Thirty sex-, ethnicity- and age-matched SLE patients and seven HCs were recruited at the First Affiliated Hospital of Anhui Medical University (Supplementary Table S1). Patients met the 2012 Systemic Lupus Collaborating Clinics for SLE. All subjects were female, 38±20 years old, with SLEDAI scores ranging from 4 to 14 in SLE patients. The study was conducted in accordance with the Declaration of Helsinki and approved by the Biomedical Ethics Committee of Anhui Medical University (Approval number 20180217). All participants provided written, informed consent.
Dataset Collection
We searched the NCBI Gene Expression Omnibus (GEO) database and selected GSE45291, GSE61635, GSE100163, GSE110169, and GSE121239, which have relatively larger sample sizes, for further analysis. Raw expression data of human blood cells from SLE patients and healthy controls were obtained from the publicly accessible GEO repository. Data on Sjogren’s syndrome and dermatomyositis were obtained from two classic blood transcriptional datasets: GSE84844 (30 cases with Sjogren’s syndrome, 30 HCs) and GSE100152 (40 cases with Juvenile dermatomyositis, 9 HCs). Clinical features, including age, sex, grade, and histological type, were also extracted from GEO.23
Differential Gene Expression Analysis
We compared the gene expression of PBMCs from SLE patients and healthy subjects in each GEO dataset separately using differential expression analysis. For each dataset, we applied the same criteria: FDR-adjusted P value was analyzed to correct for false-positive results. “Adjusted P < 0.05 and Fold Change >1.5” were defined as the thresholds, and genes were defined as differentially expressed genes (DEGs). We then overlapped the DEGs from all five datasets and ultimately identified genes as the core gene list. The heterogeneity tested in the fixed effect model was performed by R Package DExMA.
For the TRIM5 function analysis, we separated the SLE samples from GSE45291 into 25% quartile high and low expression samples and then compared the expression levels between the TRIM5-high and TRIM5-low groups. The R package Limma (version: 3.40.2) was used for identifying the differentially expressed genes.
Functional Gene Characterization and Pathway Identification
We characterized the up-regulated genes utilizing publicly available information from databases including the Kyoto Encyclopedia of Genes and Genomes (KEGG) pathway and the Gene Ontology (GO) Database. The R ClusterProfiler package (version: 3.18.0) in R was employed to analyze the GO function of potential targets and perform KEGG pathway enrichment. A volcano plot was constructed with log2 (FC) on the X-axis against -log10 (FDR adjusted P value). Each dot represents a single individual. A heatmap plot was drawn by the R pheatmap package.
Immune Cell Enrichment Analysis
The xCell algorithm was used for evaluating the abundance and types of immune cell cells in the selected three datasets. The xCell algorithm allowed us to perform the enrichment analysis of 64 immune and stromal cell types (including CD4(+) T cells, CD8(+) T cells, B cells, NK cells, neutrophils, and macrophages). Webtool was used for constructing a statistical model to analyze the immune cell subtypes, and it is a signature-based method that has been trained on thousands of pure cell types from various sources.24 The three selected GSE datasets were used for distinguishing the content of various cells and their relationship to SLE (GSE45291, GSE110169, GSE121239).
RNA Extraction and Reverse-Transcription Quantitative PCR (RT‒qPCR)
Total RNA was extracted from PBMCs and reverse-transcribed with a MonScriptTM RTLLL ALL-in-One kit (MR05101M, Monad Biotech Co., Ltd, Wuhan, China). The expression of mRNA was determined using MonAmpTM ChemoHS qPCR Mix (SYBR Green, Low ROX) (MQ00401S, Monad Biotech Co., Ltd, Wuhan, China) according to the manufacturer’s instructions. The relative expression levels of the target genes were calculated using the comparative Ct method. GAPDH was used as an internal control to normalize the sample differences (detailed sequences of primers are shown in Table 1). The RT‒qPCR was conducted as follows: 95°C for 10 minutes, a total of 40 cycles of 95°C for 10 seconds, and 60°C for 30 seconds. The relative gene expression levels were evaluated by the 2−∆∆CT method.
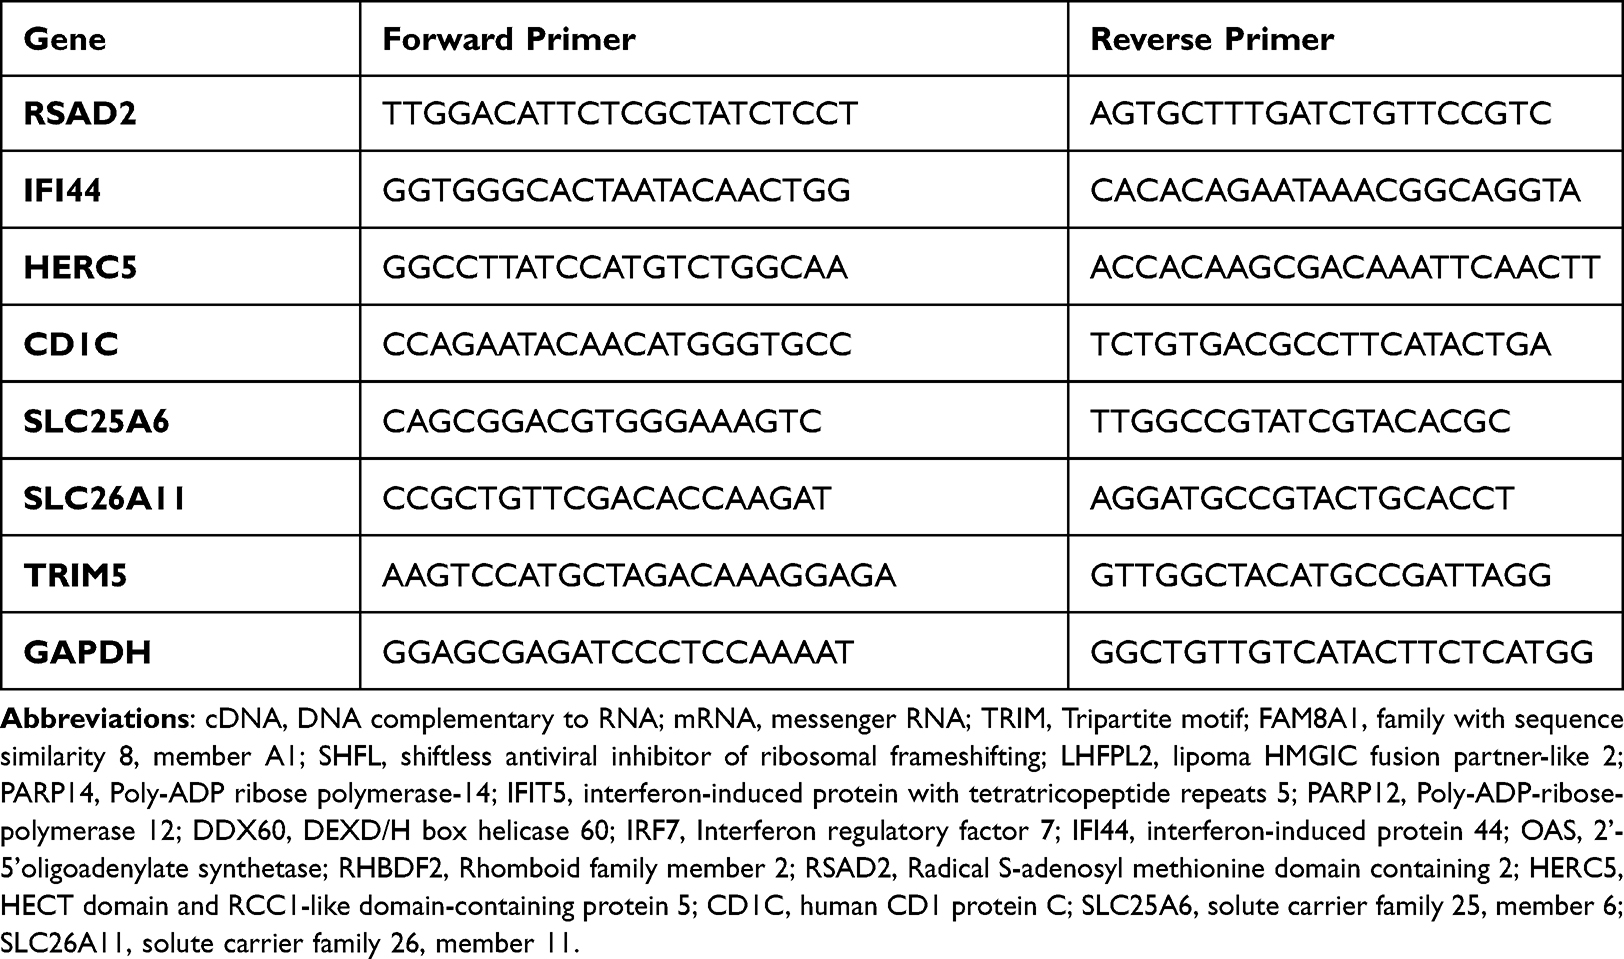 |
Table 1 Detailed Sequences of Primers |
Flow Cytometry
PBMCs were isolated from blood treated with the anticoagulant EDTA by layering over Ficoll lymphocyte fluid (17-1140-02 Ficoll PaqueTM PLUS, GE Healthcare, Sweden) and density gradient centrifugation at 400 × g. Two hundred microlitres of PBMC samples were then stained with a set of specific monoclonal antibodies (mAbs) (FITC Rat Anti-CD11b [M1/70, 561688, BD Pharmingen]; Alexa Fluor 647 Rat Anti-Human CCR7 [CD197, 3D12, 557734, BD Pharmingen]; PE-Cy7 Mouse Anti-Human CD45RA [HI100, 560675, BD Pharmingen]; PE Mouse Anti-Human CD206 [19.2, 555954, BD Pharmingen]; PerCP-Cy5.5 Mouse Anti-Human CD3[SP34-2, 552852, BD Pharmingen]; BV510 Mouse Anti-Human CD4[SK3, 562970, BD Pharmingen]) against surface markers and incubated at 4 °C for 30 minutes. The red blood cells (RBCs) in the mixture were lysed using Lysing Buffer solution (BD Biosciences, San Jose, CA, USA). Then, 250 µL of the reagent from the Sulfixation/Permeabilization Kit (BD Biosciences, San Jose, CA, USA) was added and incubated in the dark at 4 °C for 40 minutes. Finally, an intracellular staining antibody against CD68 (BV421 Mouse Anti-Human CD68[Y1/82A, 564943, BD Pharmingen]) was added and incubated in the dark at 4 °C for 45 minutes. The residual white blood cells were analyzed by flow cytometry, and the percentage of these immune cells was calculated by FlowJo10.8.1 data analysis software (FlowJo, Ashland, OR USA). All statistical analyses were performed using R Version 4.1.2.
Results
Data Mining Revealed That TRIM5 Was Associated with SLE
We first retrieved five genome-wide gene expression datasets from public GEO databases. In all, a total of 593 SLE and 161 control samples were included. To identify SLE-related differentially expressed genes, we separately compared the expression patterns between the patient and control groups. Using FDR-adjusted P < 0.05 and Fold Change >1.5 filtering strategy, we finally observed 341, 1108, 1422, 466, and 384 DEGs in GSE121239, GSE100163, GSE61635, GSE45291, and GSE110169, respectively. By overlapping five DEG panels, 14 genes (TRIM5, FAM8A1, SHFL, LHFPL2, PARP14, IFIT5, PARP12, DDX60, IRF7, IFI44, OAS1, OAS3, RHBDF2, and RSAD2) showed the same up-regulation trend and were identified as the core gene list (Figure 1A and B). The five GEO samples were from different ethnic populations, and they potentially exhibited heterogeneity among studies. We further carried out the heterogeneity analysis to minimize confounding factors. For the 14 genes, the TRIM5, FAM8A1, and SHFL genes showed no obvious heterogeneity across the five databases (I2 = 0, P > 0.05, Figure 1B). We selected TRIM5 for further analysis in that it was the top gene without heterogeneity (P = 0.56). Interestingly, TRIM5 showed a positive correlation with the remaining 13 genes in the largest database GSE45291 (correlation coefficient > 0.5), suggesting that these 14 genes might cooperatively play roles in disease development (Figure 1C). We then asked whether TRIM5 was uniquely constricted in SLE etiology. We extracted TRIM5 expression data from two other types of connective diseases, Sjogren’s syndrome and dermatomyositis. In Sjogren’s syndrome (GSE84844), TRIM5 was substantially down-regulated in the patient group (P = 3.0E-6), while in dermatomyositis (GSE100152), TRIM5 was significantly up-regulated in the patient group, suggesting that TRIM5 was not commonly associated with connective diseases (Figure 1D). In summary, we found that the high expression of TRIM5 contributed to the pathogenesis of SLE.
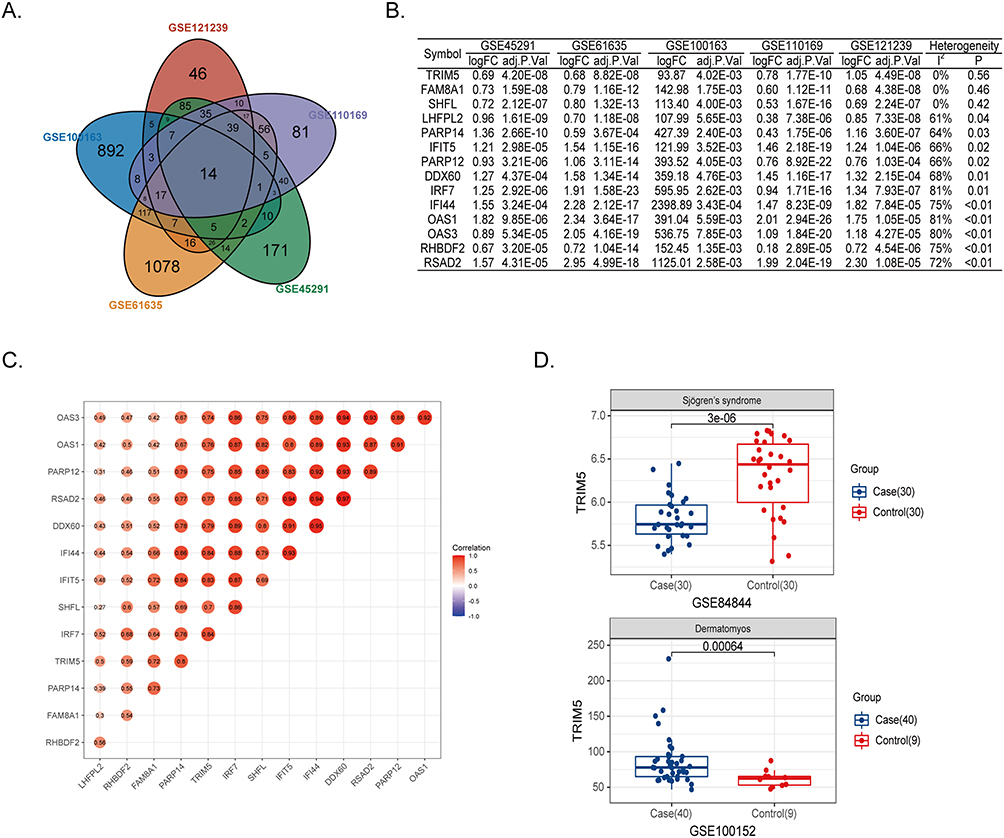 |
Figure 1 TRIM5 was associated with SLE. (A) Venn plot showed 14 core genes with increased expression in SLE patients from GSE121239, GSE100163, GSE61635, GSE110169, and GSE45291. (B) The logFC and adjusted P values of 14 core genes in five public datasets were shown. The heterogeneity test was under the fixed effect model. The genes were ranked by decreasing heterogeneity. (C) The correlation scores between the 14 target genes were shown. (D) The expression levels of TRIM5 were compared between cases and controls. GSE84844 and GSE100152 are for Sjogren’s syndrome and dermatomyositis, respectively. |
TRIM5-Related Genes are Associated with Virus Infection Pathways
We then investigated the function of TRIM5 and the associated signaling pathways using the GSE45291 dataset. Two hundred and ninety-two SLE samples were divided into four quartiles. The differentially expressed genes were identified with higher TRIM5 expression (top 25% quartile) and those with lower TRIM5 expression (bottom 25% quartile) (Supplementary Table S2). We found 251 up-regulated genes and 93 down-regulated genes in the upper 25% quartile samples (Figure 2A). The top three up-regulated genes were RSAD2 (log(FC) = 4.98, Padjusted = 6.03E-50), IFI44 (log(FC) = 4.21, Padjusted = 3.04E-49) and HERC5 (log(FC) = 3.96, Padjusted = 3.04E-49). The top three down-regulated genes were CD1C (log(FC) = −1.17, Padjusted = 4.08E-14), SLC25A6 (log(FC) = −0.85, Padjusted = 8.99E-14) and SLC26A11 (log(FC) = −0.86, Padjusted = 2.26E-13) (Supplementary Table S3). The heatmap revealed that the top 50 up- and down-regulated genes can successfully separate TRIM5-high and TRIM5-low samples, indicating that these genes can be considered as good markers for group separation (Figure 2B). KEGG pathways showed that the 263 up-regulated genes were significantly enriched in “Viral protein interaction with cytokine and cytokine receptor” and some virus-associated signaling pathways, such as “Influenza”, “Herpes simplex virus 1 infection”, “Epstein−Barr virus infection” and others. This phenomenon was confirmed by the enriched GO terms “viral life cycle”, “type I interferon signaling pathway” and “response to virus” (Figure 2C and D). When analyzing the KEGG and GO enrichment results of the SLE-associated up-regulated genes, we found that these virus-associated pathways or GO terms were also shown in GSE121239, suggesting that the TRIM5-high group reflects some features of SLE (Supplementary Table S4, Supplementary Figures S1–S2). Gene Set Enrichment Analysis (GSEA) analysis also showed ‘Viral protein interaction with cytokine and cytokine receptor’ pathway was enriched in the TRIM5-high group (Figure 2E, P = 0.03). Furthermore, TRIM5 expression clearly separated case and control groups with AUC = 0.93 in GSE45291 (Figure 2F).
 |
Figure 2 Expression profiles of TRIM5-high and -low groups in GSE45291. (A) The volcano plot showed differentially expressed genes (DEGs) between TRIM5 25% quartile higher samples and 25% quartile lower samples. The green dots represent DEGs with fold change <-1.5, red dots represent DEGs with fold change >1.5, adjust P <0.05. (B) Heatmap indicates the top 50 up-regulated and down-regulated DEGs significantly separate SLE and control groups. (C and D) KEGG and GO enrichment analysis. The x-axis represents the enrichment ratio, which is the ratio of the number of target genes belonging to a pathway divided by the number of all the annotated genes located in the pathway. The size of the dot indicates the number of target genes in the pathway. (E) GSEA enrichment analysis showed the “Viral protein interaction with cytokine and cytokine receptor” pathway was significantly enriched in the TRIM5-high group. (F) Receiver operating characteristic (ROC) analysis was used for assessing the diagnostic value of TRIM5 in GSE45291 (AUC score = 0.93). |
Differentially Expressed Genes Were Confirmed by RT-qPCR
To verify our findings, we first collected RNA of PBMC from 3 controls and 25 SLE patients, and further separated patients into TRIM5-higher and TRIM5-lower groups according to the expression level of TRIM5. The up-regulated expression of RSAD2, IFI44, and HERC5, as well as the down-regulated expression of CD1C and SLC25A6 in the TRIM5-higher group of SLE, was confirmed in validation samples (Figure 3). However, SLC26A11 showed increased expression in the TRIM5-higher group, which disagreed with public datasets. Interestingly, the expression of some TRIM5-related DEGs presented a similar trend in SLE patients, such as the most prominent genes, RSAD2, IFI44, IFIT5, OAS3, and OAS1, indicating that TRIM5 dysfunction reflects some features of SLE pathogenesis (Figure 4).
 |
Figure 3 Expression of the top up-regulated and down-regulated genes. The gene expression levels of (A) IFI44, (B) RSAD2, (C) SLC26A11, (D) CD1C, (E) SLC25A6 and (F) HERC5 in TRIM5-higher and TRIM5-lower group of SLE patients. *P <0.05, **P<0.01 by Student’ t-test. |
 |
Figure 4 Differential expression of 5 selected genes (RSAD2, IFI44, IFIT5, OAS3, and OAS1) in TRIM5-lower, TRIM5-higher, SLE, and control groups from three datasets. (A-C) Differential expression of RSAD2, (D-F) Differential expression of IFI44, (G-I) Differential expression of IFIT5, (J-L) Differential expression of OAS3, (M-O) Differential expression of OAS1. The X-axis represents different groups, and the Y-axis represents the gene expression levels of selected genes. GSE110169 (left), GSE61635 (middle) and GSE45291 (right) were shown. **P<0.01, ***P<0.001, ****P<0.0001 by Student’ t-test. |
TRIM5 Was Associated with Decreased Naive CD4(+) T Cells and Increased M2 Macrophages
SLE is a type of autoimmune disorder with strongly aberrant immune cells. PBMCs are composed of a variety of heterogeneous cells, which distinguish the content of various cells and their relationship to SLE. Understanding the cellular heterogeneity in PBMCs will help us better reveal disease etiology. To determine the function of TRIM5, we performed immune cell analysis using the xCell algorithm to enrich more than thirty types of immune or stromal cells from the RNA expression dataset. We first calculated immune cell abundance for these thirty-six cell types and finally obtained immune scores for samples in GSE45291, GSE121239, and GSE110169 (Supplementary Tables S5-S7). In all three datasets, the proportion of naive CD4(+) T cells was decreased while that of M2 macrophages was increased in SLE samples (Figure 5A). Specifically, the proportions of naive CD4(+) T cells were 4.2% ± 3.4% and 6.8% ± 2.6% in SLE and control groups from GSE45291 (PGSE45291 = 3.2E-4). The decreased proportion of naive CD4(+) T was further confirmed in GSE121239 and GSE110169 (PGSE121239 = 3.2E-4 and PGSE110169 = 1.1E-10 respectively). The proportions of M2 macrophages in GSE45291 were 1.6% ± 1.8% and 0.3% ± 0.8% in case and control groups (PGSE45291 = 8.0E-7). The increased proportion of M2 macrophages was also observed in GSE121239 and GSE110169 datasets (PGSE121239 = 4.4E-12 and PGSE110169 = 1.8E-10 respectively).
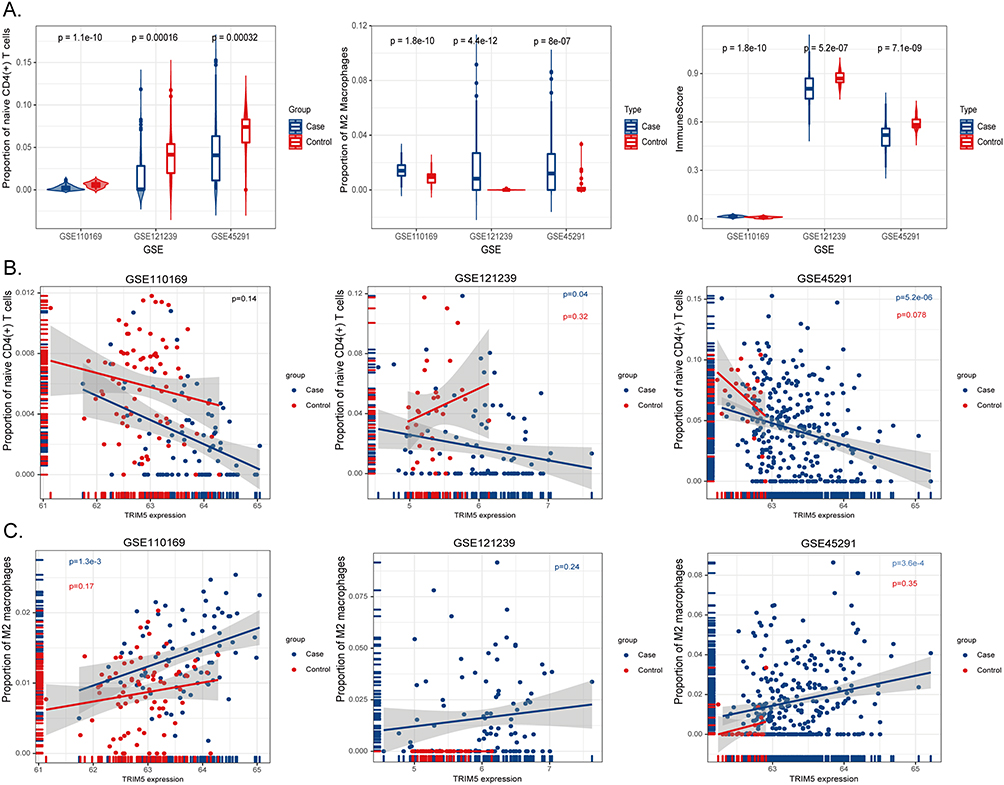 |
Figure 5 Immune cell enrichment analysis in three selected GSE files. (A) X-axis represents GSE datasets, Y-axis indicates the proportions of naive CD4(+) T cells (left), M2 macrophages (middle), and immune scores (right). Blue bins represent cases, and red represent healthy controls. (B) X-axis showed the expression levels of TRIM5, Y-axis represents the proportion of naive CD4(+) T cells in GSE110169 (left), GSE121239 (middle), and GSE45291 (right). The blue dots represent the case group, and the red dots represent the control group. (C) X-axis showed the expression levels of TRIM5, Y-axis represents the proportion of M2 macrophages in GSE110169 (left), GSE121239 (middle), and GSE45291 (right). The blue dots represent the case group, and the red dots represent the control group. |
Moreover, we were surprised to find that TRIM5 expression was negatively correlated with naive CD4(+) T cells in SLE samples from almost all three datasets (PGSE45291 = 5.2E-6, PGSE121239 = 0.04, respectively, Figure 5B). Similarly, TRIM5 expression levels were positively correlated with M2 macrophages in SLE samples (PGSE45291 = 3.6E-4, PGSE110169 = 1.3E-3, Figure 5C). TRIM5 expression showed no obvious correlation with naive CD4(+) T cells or M2 macrophages in HC samples, indicating that TRIM5 might modulate disease etiology through these cells.
Altered Proportions of Naive CD4(+) T Cells and Increased M2 Were Confirmed by FACS
To confirm these findings, freshly isolated PBMCs from HCs (n = 4) and SLE patients (n = 5) were analyzed by fluorescence-activated cell sorting (FACS). We then conducted a detailed analysis of naive CD4(+) T cells and M2 macrophages in PBMCs of HCs and SLE patients (Figure 6A). Specifically, we observed increased M2 macrophages and decreased naive CD4(+) T cells in SLE patients (Figure 6B and C). The proportions of naive CD4(+) T cells among CD4(+) T cells were 26.2% ± 10.1% and 46.7% ± 7.3% in SLE and control groups. Similarly, the proportions of M2 macrophages in macrophages were 4.26% ± 2.99% and 0.84% ± 0.15% in case and control groups.
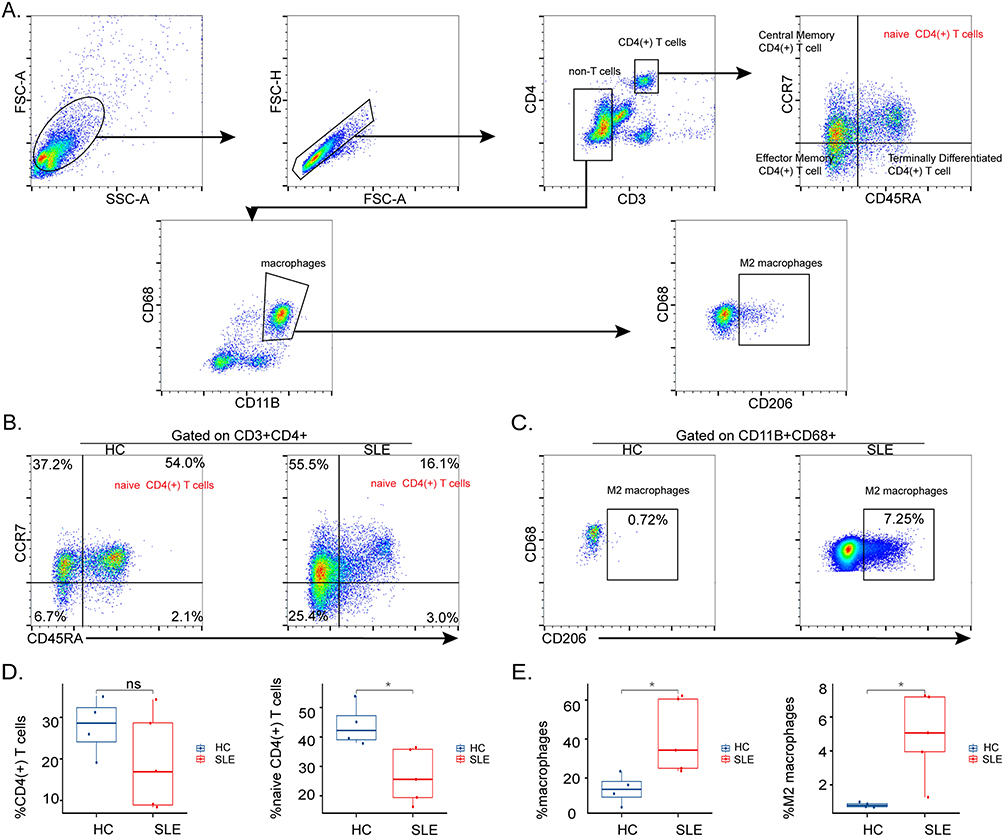 |
Figure 6 Proportions of naive CD4(+) T cells and M2 macrophages in PBMCs of SLE and control groups. (A) The gating strategy for naive CD4(+) T cells and M2 macrophages in PBMCs. CD4(+) T cells: CD3+CD4+; naive CD4(+) T cells: CD3+CD4+CD45RA+CCR7+; macrophages: CD11B+CD68+; M2 macrophages: CD11B+CD68+CD206+. Representative flow cytometry plots show naïve CD4(+) T cells (B) and M2 macrophages (C) of PBMCs in HCs (n = 4) and SLE (n = 5). Absolute numbers of CD4(+) T cells, naive CD4(+) T cells (D), and macrophages, M2 macrophages (E). *P < 0.05. Abbreviation: ns, no significance. |
Due to the FACS gating strategy, we could also check the proportions of total CD4(+) T cells, effector memory CD4(+) T cells, and total macrophages in collected samples. Interestingly, there was also an increase in the proportion of macrophages in patients with SLE, but the decrease in total CD4(+) T cells was not statistically significant (Figure 6D and E). In addition, the proportion of effector memory CD4(+) T cells was increased in SLE patients (Supplementary Figure S3). The proportion of CD4(+) T cell subsets in SLE was significantly changed.
Discussion
In this study, we found that TRIM5 was highly expressed in PBMCs of SLE patients. The expression of TRIM5 was positively correlated with the other 13 indicated genes, and TRIM5 might be associated with viral infection. Deconvolution of the immune cell revealed the high expression of TRIM5 in SLE was associated with the decrease of naive CD4(+) T cells and the increased M2 macrophages.
The tripartite motif protein family (TRIM) constitutes a class of immune-regulated proteins with antiviral, immune, cancer, and other properties reminiscent of those ascribed to autophagy. Trim proteins directly antagonize viruses by targeting viral components.25 Trim5 proteins, including Trim5-alpha and Trim-Cyp, are known to possess antiretroviral activity against many different retroviruses.26 As an antiviral restriction factor, TRIM5 prevents retroviral infection shortly after the virion core enters the cytoplasm, mainly by recognizing the capsid protein of the virus with its PRYSPRY domain in Trim5-alpha.27 Previous studies revealed that TRIM5 functions as a ubiquitin E3 ligase, which acts with the E2 ligase ubiquitin-conjugating enzyme UBC13–UEV1A (also known as UBE2N–UBE2V1) to catalyse the synthesis of unattached K63-linked ubiquitin chains that activate the TAK1 (MAP3K7) kinase, NF-κB, and AP-1 signaling, leading to the transcription of inflammatory cytokines and chemokines that are involved in the regulation of autoimmune diseases, such as SLE. Moreover, TRIM5-induced transcriptional activity was enhanced by retroviral infection and interaction with the capsid lattice.28 TRIM5 might also promote K48-linked ubiquitination and proteasomal degradation by acting with the viral protease NS2B/3.29 Several studies have revealed that the Trim protein is involved in modulating TLR- and cGAS-STING-related pathways, and human type I IFN can induce the expression of TRIM5-alpha in human cell lines.25,30 These pathways have been implicated in SLE immunity.31
Our study also suggested that RSAD2, IFI44, and HERC5 were up-regulated, while CD1C, SLC25A6, and SLC26A11 were down-regulated in the TRIM5-high group. In a previous study, IFI44, HERC5, and RSAD2 played vital roles in the pathogenesis of lymph nodes, while these genes were mainly enriched in the defense response to the virus and type I interferon signaling pathway.32 In addition, CD1C has been demonstrated to have a lower expression level in the peripheral B-cell transcriptomes of patients with quiescent lupus than in B-cell transcriptomes from healthy controls.33 A study of a weighted gene coexpression network analysis (WGCNA) on publicly available CD4+ T-cell microarray datasets for pemphigus and lupus confirmed that RSAD2 was significantly up-regulated as a hub gene in both diseases.34 In the comparison between SLEDAI > 6 lupus patients and subjects without lupus, the interferon-related genes IFI44 and RSAD2 were hypomethylated; the analysis of RT‒qPCR gene expression data confirmed these findings and showed that the epigenetic susceptibility to lupus may be related to the SLEDAI score.35 Given the correlation between TRIM5 and these genes in our study, TRIM5 may be involved in the pathogenesis of SLE by regulating the expression of genes related to the type I interferon signaling pathway.
Based on the potential relationship between SLE and viral infection, we suspected that autoimmunity might be triggered by the cumulative effect of repeated infections. Several pathogenic mechanisms are thought to trigger the activation of autoreactive T cells and B cells, and it is speculated that these mechanisms are mediated by a variety of infectious agents.36 Changes in specific microRNA expression in infected B lymphocytes may lead to the production of autoantibodies.37 Several studies indicate that increased infectious exposure during infancy may be associated with an increased likelihood of being ANA positive in adult life.38 Repeated viral infection may enhance the transcriptional activity of TRIM5, which induces and enhances the expression of lupus-related genes (RSAD2, IFI44, and HERC5) and promotes SLE autoimmunity.
Findings from other groups suggested that TRIM family members might modulate SLE development by impairing the immune system. For example, the expression of TRIM21 in the PBMCs of SLE patients is increased. The central role of TRIM21 in the regulation of inflammatory cytokines and type I IFN production suggests that it may be a central player in the establishment of autoimmunity.39 TRIM scores were reported to be significantly associated with immune cells, especially follicular helper T cells, CD8(+) T cells, activated NK cells, and M1 and M2 macrophages, in cancer.40 Immune cells play a crucial role in viral infection, and given that the TRIM5-encoding protein is associated with viruses, TRIM5 may function in SLE through the regulation of immune cells. TRIM5’s restriction role was in a cell-type specific manner, which has been revealed by HIV-1 infection.41 We analyzed the proportion of immune cells in SLE and found that naive CD4(+) T cells were significantly decreased, while M2 macrophages were increased in the SLE group. Although a low percentage of naive CD4(+) T cells has been described, little is known about M2 macrophages in SLE.42 Further analysis revealed that TRIM5 showed a negative correlation with the proportion of naive CD4(+) T cells and a positive correlation with the proportion of M2 macrophages. Monocytes/macrophages contribute to autoimmune events in rheumatic diseases, such as rheumatoid arthritis (RA) or systemic lupus erythematosus (SLE).43
It seems that TRIM5 may regulate the development of SLE through M2 macrophages. In previous studies, M2 macrophages have been considered anti-inflammatory regulatory cells that are well characterized in lupus pathogenesis. M2 macrophages ensure the inhibition of ongoing autoimmunity in SLE patients by secreting anti-inflammatory cytokines such as TGF-β, IL-10, and IL-13. M2 macrophages are more prominent in patients with inactive SLE and can reduce the severity of SLE.44,45 Interestingly, in allergy, there are some pieces of evidence that basophils may contribute to M2 polarization, which may contribute to CD4 polarization and concomitant (auto) antibody production, and basophils have been shown to play a role in SLE.46,47 Some TRIM genes (TRIM14/PUB, TRIM20/MEFV, TRIM35/MAIR) have been reported to be expressed in macrophages and are suggested to be involved in immune responses.48 How TRIM5 is associated with macrophages has not been clearly investigated, but recent findings indicated that macrophages differentiated from TRIM5 knockout induced pluripotent stem cells (iPSCs) were more sensitive to HIV infection in vitro.49 This finding leads us to think TRIM5 plays dynamic roles in a cell-type specific manner.
SLE involves immune abnormalities in a wide variety of cell populations, including B and T lymphocytes, monocytes, and natural killer cells.9 A decrease or increase in the expression of a gene may occur because of differences in cell populations between the SLE patients and normal controls, instead of the expression differences of the gene itself. The intragroup differences in the expression of target genes (RSAD2, IFI44, HERC5, CD1C, SLC25A6, and SLC26A11) in the RT‒qPCR results may be due to the correlation between these genes and TRIM5, which is expressed at different levels in different SLE samples. In this study, due to the limitations of short sample storage time and a large volume of blood required, RT‒qPCR and flow cytometry could not be performed on the same sample, resulting in the inability to properly verify the correlation between TRIM5 and immune cells. These limitations also led to a restricted number of SLE patients (n=30) and HCs (n=7). We have successfully demonstrated the correlation between TRIM5 and SLE, but how TRIM5 works in SLE has not yet been confirmed. Single-cell sequencing of SLE patients and healthy controls could further elucidate the role of M2 macrophages and naive CD4(+) T cells in SLE. Gene knockout animal models can be used to correctly validate our hypothesis and to explore the mechanism by which TRIM5 functions in SLE.
Conclusion
We identified the correlation between TRIM5 and SLE disease as well as several up-regulated genes IFI44, HERC5, and RSAD2 in the group with high expression of TRIM, and TRIM5 is associated with the defense response to the virus and the type I interferon signaling pathway. Analysis of expression data from the blood of SLE patients revealed that TRIM5 may regulate the occurrence of SLE by activating M2 macrophages and inhibiting naive CD4(+) T cells.
Data Sharing Statement
All GEO data used in this study was available from the GEO website (https://www.ncbi.nlm.nih.gov/geo/).
Acknowledgments
We would like to thank all patients for supporting this research.
Author Contributions
All authors made a significant contribution to the work reported, whether that is in the conception, study design, execution, acquisition of data, analysis and interpretation, or in all these areas; took part in drafting, revising or critically reviewing the article; gave final approval of the version to be published; have agreed on the journal to which the article has been submitted; and agree to be accountable for all aspects of the work.
Funding
This work was supported by the National Natural Science Foundation of China [81803117]. The sponsor provided financial support for the experiments included in the study.
Disclosure
Dr Leilei Wen reports grants from National Natural Science Foundation of China, outside the submitted work. The author reports no other conflicts of interest in this work.
References
1. Fava A, Petri M. Systemic lupus erythematosus: diagnosis and clinical management. J Autoimmun. 2019;96:1–13. doi:10.1016/j.jaut.2018.11.001
2. Tsokos GC. Systemic lupus erythematosus. A disease with a complex pathogenesis. Lancet. 2001;358(Suppl):S65–S65. doi:10.1016/S0140-6736(01)07077-5
3. Harley JB, Kelly JA, Kaufman KM. Unraveling the genetics of systemic lupus erythematosus. Springer Semin Immunopathol. 2006;28(2):119–130. doi:10.1007/s00281-006-0040-5
4. Alarcon-Segovia D, Alarcon-Riquelme ME, Cardiel MH, et al. Familial aggregation of systemic lupus erythematosus, rheumatoid arthritis, and other autoimmune diseases in 1177 lupus patients from the GLADEL cohort. Arthritis Rheum. 2005;52(4):1138–1147. doi:10.1002/art.20999
5. Yin X, Kim K, Suetsugu H, et al. Meta-analysis of 208370 East Asians identifies 113 susceptibility loci for systemic lupus erythematosus. Ann Rheum Dis. 2021;80(5):632–640. doi:10.1136/annrheumdis-2020-219209
6. Cook HT, Botto M. Mechanisms of disease: the complement system and the pathogenesis of systemic lupus erythematosus. Nat Clin Pract Rheumatol. 2006;2(6):330–337. doi:10.1038/ncprheum0191
7. Wu YL, Yang Y, Chung EK, et al. Phenotypes, genotypes and disease susceptibility associated with gene copy number variations: complement C4 CNVs in European American healthy subjects and those with systemic lupus erythematosus. Cytogenet Genome Res. 2008;123(1–4):131–141. doi:10.1159/000184700
8. Dai C, Deng Y, Quinlan A, et al. Genetics of systemic lupus erythematosus: immune responses and end organ resistance to damage. Curr Opin Immunol. 2014;31:87–96. doi:10.1016/j.coi.2014.10.004
9. Han GM, Chen SL, Shen N, et al. Analysis of gene expression profiles in human systemic lupus erythematosus using oligonucleotide microarray. Genes Immun. 2003;4(3):177–186. doi:10.1038/sj.gene.6363966
10. Tabassum R, Jeong NY, Chung H-J. Big data differential analysis of microglial cell responses in neurodegenerative diseases. Anat Cell Biol. 2019;52(4):469–477. doi:10.5115/acb.19.048
11. Wucherpfennig KW. Mechanisms for the induction of autoimmunity by infectious agents. J Clin Invest. 2001;108(8):1097–1104. doi:10.1172/JCI200114235
12. Wucherpfennig KW. Structural basis of molecular mimicry. J Autoimmun. 2001;16(3):293–302. doi:10.1006/jaut.2000.0499
13. Lehmann PV, Forsthuber T, Miller A, et al. Spreading of T-cell autoimmunity to cryptic determinants of an autoantigen. Nature. 1992;358(6382):155–157. doi:10.1038/358155a0
14. Scherer MT, Ignatowicz L, Winslow GM, et al. Superantigens: bacterial and viral proteins that manipulate the immune system. Annu Rev Cell Biol. 1993;9(1):101–128. doi:10.1146/annurev.cb.09.110193.000533
15. Poole BD, Scofield RH, Harley JB, et al. Epstein-Barr virus and molecular mimicry in systemic lupus erythematosus. Autoimmunity. 2006;39(1):63–70. doi:10.1080/08916930500484849
16. Harley JB, Harley ITW, Guthridge JM, et al. The curiously suspicious: a role for Epstein-Barr virus in lupus. Lupus. 2006;15(11):768–777. doi:10.1177/0961203306070009
17. Barzilai O, Sherer Y, Ram M. Epstein-Barr virus and cytomegalovirus in autoimmune diseases - Are they truly notorious? A preliminary report. In: Shoenfeld Y, Gershwin ME, editors. Autoimmunity, Pt D: Autoimmune Disease, Annus Mirabilis. The New York Academy of Sciences; 2007:567–577.
18. Janahi EMA, Das S, Bhattacharya SN, et al. Cytomegalovirus aggravates the autoimmune phenomenon in systemic autoimmune diseases. Microb Pathog. 2018;120:132–139. doi:10.1016/j.micpath.2018.04.041
19. Min X, Zheng M, Yu Y, et al. Ultraviolet light induces HERV expression to activate RIG-I signalling pathway in keratinocytes. Exp Dermatol. 2022;31(8):1165–1176. doi:10.1111/exd.14568
20. Talotta R. Interaction between long noncoding RNAs and syncytin-1/syncytin-2 genes and transcripts: how noncoding RNAs may affect pregnancy in patients with systemic lupus erythematosus. Int J Mol Sci. 2023;24(3):2259. doi:10.3390/ijms24032259
21. Draborg AH, Rasmussen NS, Larsen JL, et al. Immune responses to an early lytic cytomegalovirus antigen in systemic lupus erythematosus patients: t-cell responses, cytokine secretions and antibody status. PLoS One. 2018;13(3):e0193244. doi:10.1371/journal.pone.0193244
22. Segal Y, Calabro M, Kanduc D, et al. Human papilloma virus and lupus: the virus, the vaccine and the disease. Curr Opin Rheumatol. 2017;29(4):331–342. doi:10.1097/BOR.0000000000000398
23. Myers KS, Place M, Noguera DR, et al. COnTORT: COmprehensive Transcriptomic ORganizational Tool for simultaneously retrieving and organizing numerous gene expression data sets from the NCBI gene expression omnibus database. Microbiol Resour Announc. 2020;9(25). doi:10.1128/MRA.00587-20
24. Aran D, Hu Z, Butte AJ. xCell: digitally portraying the tissue cellular heterogeneity landscape. Genome Biol. 2017;18220. doi:10.1186/s13059-017-1349-1
25. Shen Z, Wei L, Yu Z-B, et al. The roles of TRIMs in antiviral innate immune signaling. Front Cell Infect Microbiol. 2021;11:628275.
26. Lukic Z, Campbell EM. The cell biology of TRIM5 alpha. Curr HIV/AIDS Rep. 2012;9(1):73–80. doi:10.1007/s11904-011-0102-8
27. Gruetter MG, Luban J. TRIM5 structure, HIV-1 capsid recognition, and innate immune signaling. Curr Opin Virol. 2012;2(2):142–150. doi:10.1016/j.coviro.2012.02.003
28. Pertel T, Hausmann S, Morger D, et al. TRIM5 is an innate immune sensor for the retrovirus capsid lattice. Nature. 2011;472(7343):361–365. doi:10.1038/nature09976
29. Chiramel AI, Meyerson NR, McNally KL, et al. TRIM5 alpha()restricts flavivirus replication by targeting the viral protease for proteasomal degradation. Cell Rep. 2019;27(11):3269. doi:10.1016/j.celrep.2019.05.040
30. Carthagena L, Parise MC, Ringeard M, Chelbi-Alix MK, Hazan U, Nisole S. Implication of TRIMalpha and TRIMCyp in interferon-induced anti-retroviral restriction activities. Retrovirology. 2008;5:59.
31. Curran CS, Gupta S, Sanz I, et al. PD-1 immunobiology in systemic lupus erythematosus. J Autoimmun. 2019;97:1–9. doi:10.1016/j.jaut.2018.10.025
32. Shen L, Lan L, Zhu T, et al. Identification and validation of IFI44 as key biomarker in lupus nephritis. Front Med. 2021;8:762848.
33. Garaud J-C, Schickel J-N, Blaison G, et al. B cell signature during inactive systemic lupus is heterogeneous: toward a biological dissection of lupus. PLoS One. 2011;6(8):e23900. doi:10.1371/journal.pone.0023900
34. Sezin T, Vorobyev A, Sadik CD, et al. Gene expression analysis reveals novel shared gene signatures and and candidate molecular mechanisms between pemphigus and systemic lupus erythematosus in CD4(+) T cells. Front Immunol. 2018;8:1992.
35. Joseph S, George NI, Green-Knox B, et al. Epigenome-wide association study of peripheral blood mononuclear cells in systemic lupus erythematosus: identifying DNA methylation signatures associated with interferon-related genes based on ethnicity and SLEDAI. J Autoimmun. 2019;96:147–157. doi:10.1016/j.jaut.2018.09.007
36. Esposito S, Bosis S, Semino M, et al. Infections and systemic lupus erythematosus. Eur J Clin Microbiol Infect Dis. 2014;33(9):1467–1475. doi:10.1007/s10096-014-2098-7
37. Sebastiani GD, Galeazzi M. Infection-genetics relationship in systemic lupus erythematosus. Lupus. 2009;18(13):1169–1175. doi:10.1177/0961203309345737
38. Edwards CJ, Syddall H, Goswami R, et al. Infections in infancy and the presence of antinuclear antibodies in adult life. Lupus. 2006;15(4):213–217. doi:10.1191/0961203306lu2286oa
39. Smith S, Gabhann JN, McCarthy E, et al. Estrogen receptor alpha regulates tripartite motif-containing protein 21 expression, contributing to dysregulated cytokine production in systemic lupus erythematosus. Arthritis Rheumatol. 2014;66(1):163–172. doi:10.1002/art.38187
40. Gao Y, Pan T, Xu G, et al. Pan-cancer illumination of TRIM gene family reveals immunology regulation and potential therapeutic implications. Hum Genomics. 2022;16(1):65. doi:10.1186/s40246-022-00441-9
41. Sebastian S, Sokolskaja E, Luban J. Arsenic counteracts human immunodeficiency virus type 1 restriction by various TRIM5 orthologues in a cell type-dependent manner. J Virol. 2006;80(4):2051–2054. doi:10.1128/JVI.80.4.2051-2054.2006
42. Ugarte-Gil MF, Sanchez-Zuniga C, Gamboa-Cardenas RV, et al. Circulating naive and memory CD4(+) T cells and metabolic syndrome in patients with systemic lupus erythematosus: data from a primarily Mestizo population. Rheumatology. 2015;54(7):1302–1307. doi:10.1093/rheumatology/keu434
43. Cutolo M. Macrophages as effectors of the immunoendocrinologic interactions in autoimmune rheumatic diseases. Ann N Y Acad Sci. 1999;876(1):32–41; discussion 41–2. doi:10.1111/j.1749-6632.1999.tb07620.x
44. Li F, Yang Y, Zhu X, et al. Macrophage polarization modulates development of systemic lupus erythematosus. Cell Physiol Biochem. 2015;37(4):1279–1288. doi:10.1159/000430251
45. Labonte AC, Kegerreis B, Geraci NS, et al. Identification of alterations in macrophage activation associated with disease activity in systemic lupus erythematosus. PLoS One. 2018;13(12):e0208132. doi:10.1371/journal.pone.0208132
46. Egawa M, Mukai K, Yoshikawa S, et al. Inflammatory monocytes recruited to allergic skin acquire an anti-inflammatory M2 phenotype via basophil-derived interleukin-4. Immunity. 2013;38(3):570–580. doi:10.1016/j.immuni.2012.11.014
47. Dossybayeva K, Abdukhakimova D, Poddighe D. Basophils and systemic lupus erythematosus in murine models and human patients. Biology-Basel. 2020;9(10):308. doi:10.3390/biology9100308
48. Rajsbaum R, Stoye JP, O’Garra A. Type I interferon-dependent and -independent expression of tripartite motif proteins in immune cells. Eur J Immunol. 2008;38(3):619–630. doi:10.1002/eji.200737916
49. Iwamoto Y, Seki Y, Taya K, et al. Generation of macrophages with altered viral sensitivity from genome-edited rhesus macaque iPSCs to model human disease. Mol Ther Methods Clin Dev. 2021;21:262–273. doi:10.1016/j.omtm.2021.03.008
 © 2023 The Author(s). This work is published and licensed by Dove Medical Press Limited. The full terms of this license are available at https://www.dovepress.com/terms.php and incorporate the Creative Commons Attribution - Non Commercial (unported, v3.0) License.
By accessing the work you hereby accept the Terms. Non-commercial uses of the work are permitted without any further permission from Dove Medical Press Limited, provided the work is properly attributed. For permission for commercial use of this work, please see paragraphs 4.2 and 5 of our Terms.
© 2023 The Author(s). This work is published and licensed by Dove Medical Press Limited. The full terms of this license are available at https://www.dovepress.com/terms.php and incorporate the Creative Commons Attribution - Non Commercial (unported, v3.0) License.
By accessing the work you hereby accept the Terms. Non-commercial uses of the work are permitted without any further permission from Dove Medical Press Limited, provided the work is properly attributed. For permission for commercial use of this work, please see paragraphs 4.2 and 5 of our Terms.