Back to Journals » Journal of Pain Research » Volume 14
Treatment Patterns in Patients with Diagnostic Imaging for Low Back Pain: A Retrospective Observational Study
Authors Di Gangi S ![]() , Bagnoud C, Pichierri G
, Bagnoud C, Pichierri G ![]() , Rosemann T
, Rosemann T ![]() , Plate A
, Plate A
Received 6 July 2021
Accepted for publication 22 September 2021
Published 7 October 2021 Volume 2021:14 Pages 3109—3120
DOI https://doi.org/10.2147/JPR.S328033
Checked for plagiarism Yes
Review by Single anonymous peer review
Peer reviewer comments 2
Editor who approved publication: Dr Michael Schatman
Stefania Di Gangi,1 Christophe Bagnoud,2 Giuseppe Pichierri,1 Thomas Rosemann,1 Andreas Plate1
1Institute of Primary Care, University and University Hospital Zurich, Zürich, Switzerland; 2Groupe Mutuel, Martigny, Switzerland
Correspondence: Stefania Di Gangi
Institute of Primary Care, University and University Hospital Zurich, Pestalozzistrasse 24, Zürich, CH-8091, Switzerland
Tel +41 44 255 75 02
Fax +41 44 255 90 97
Email [email protected]
Purpose: Low back pain (LBP) is one of the most frequent reasons for medical consultations. Literature suggests a large evidence-performance gap, especially regarding pain management. Therefore, the monitoring of treatment patterns is important to ensure high quality of treatment. This study aimed to describe treatment patterns specific to patients with diagnostic imaging of the spine for LBP.
Patients and Methods: The study was retrospective observational and based on health claims data from 2015 to 2019 provided by a Swiss health insurance company covering around 12% of the population. Patients, ≥ 18 years of age, with diagnostic imaging of the spine were included and observed 12 months before and after imaging. Patients with back surgery or comorbidities associated with the use of pain medications were excluded.
Results: In total, 60,822 patients (mean age: 53.5 y, 56.1% female) were included and 85% received at least one pain medication. Of these, non-steroidal anti-inflammatory drugs, paracetamol, or opioids were prescribed in 88.6%, 70.7%, and 40.3% of patients, respectively. Strong opioids were used in 17% of patients given opioids. Patients with combinations of diagnostic imaging methods had the highest odds of receiving pain medication prescriptions (1.81, 95% CI: 1.66, 1.96, P < 0.001). Prescribed defined daily doses corresponded to short-term therapies.
Conclusion: Although the majority of patients received non-opioid short-term therapies, we found a substantial use of opioids, and in particular, a relative high usage of strong opioids. Our results highlighted the importance of both patient and healthcare provider awareness regarding the prudent treatment of LBP.
Keywords: low back pain medication, radiology, diagnostic imaging, NSAIDs, opioids, non-pharmacologic therapies
Introduction
Low back pain (LBP) is one of the most common complaints of the general population1 and a frequent reason for medical consultations.2 Most international guidelines recommend pain medication therapy with non-steroidal anti-inflammatory drugs (NSAIDs) and, only if necessary, opioids.3 However, a large evidence-performance gap can be observed in clinical practice regarding guideline-compliance.4,5 Of particular interest is treatment with opioids. Their generous use can easily lead to addiction and thus become a major public health problem, as can currently be observed in the USA.6,7 The monitoring of treatment quality and treatment patterns is imperative to all stakeholders involved in the maintenance and promotion of high quality of care. Studies determining treatment patterns specific to patients with diagnostic imaging of the spine are lacking. Thus, the aim of this study was to determine and characterize treatment patterns, including pain medication therapies and non-pharmacologic therapies (NPT), in patients who had undergone diagnostic imaging for LBP. First, we sought the proportion of patients receiving specific classes of pain medication depending on the time of diagnostic imaging. We then examined associations between prescriptions and diagnostic imaging methods. In addition, we investigated the effect of the most commonly used NPT on pain medication treatment.
Patients and Methods
Study Design and Database
We conducted a retrospective observational study, using medical health claim data from 2015 to 2019 provided by Groupe Mutuel (GM). GM is one of the largest health insurance companies in Switzerland; it insured around 12% of the Swiss population during our observation period. GM insured patients in all parts of Switzerland with a higher proportion of insured in the French-speaking part (up to one third of the population) compared to the German-speaking part (maximum of 16%). In Switzerland, all citizens have compulsory health insurance that covers medical treatments and thus there is no distinction between public and private systems.
Inclusion and Exclusion Criteria
Diagnostic imaging of the spine was used as a surrogate for LBP. Patients were identified by tarif medical (TARMED) codes for diagnostic imaging of the spine. In the Swiss healthcare system, TARMED codes are used to code medical procedures for billing purposes. All patients ≥18 years of age with a relevant TARMED code in 2016 or 2017 (index years) were included. The TARMED codes considered were specific for the lumbar spine (39.0150 and 39.0155 [x-ray of the lumbar spine, first image, and further images]) or unspecific for the spine (39.4100 [computed tomography (CT) of the spine], and 39.5060 (magnetic resonance imaging [MRI] of the spine)). Patients with a combination of an unspecific TARMED code (CT or MRI of the spine) and a specific TARMED code for an adjacent anatomic region were excluded (for example simultaneous codes for CT of the spine and CT of the skull) as these combinations could indicate that the pathology was not exclusively related to the lumbar spine. Patients who had undergone back surgery in the index year or the previous year were excluded. Finally, we excluded all patients with a Pharmaceutical Cost Group (PCG) code for a comorbidity which was generally associated with pain medication therapy (addiction, cancers [hormone sensitive tumors, cancer, cancer complex], rheumatism, chronic pain, and neuropathic pain). PCGs were used to identify patients with cost-intensive chronic diseases in the Swiss healthcare system. PCGs were based on the linkage between medication, defined by the Anatomical Therapeutic Chemical Classification System (ATC) codes, and specific medical diagnoses. For example, patients who had been prescribed a certain dosage of antidepressants were given the PCG code for depression. A full list of exclusion codes is listed in the Supplementary data, Appendix 1.
Data Description
Treatment patterns analyzed in this study included pain medication therapies (opioid and non-opioid) and NPT. GM provided anonymized medical data from 12 months before and up to 12 months after the index imaging. Data included basic epidemiological characteristics (age, gender, and insurance status), existing comorbidities, prescribed drugs, and usage of specific healthcare services. The latter was used to identify and define NPT: occupational therapy, physiotherapy, and chiropractic therapy. Identification of comorbidities was based on PCG codes. ATC codes were used to identify prescriptions of pain-medications (systemic NSAIDs and topical diclofenac, paracetamol, and opioids). All used ATC codes are provided within Supplementary Data, Appendix 1. Defined Daily Doses (DDD) were calculated for each ATC code.8 Regarding prescribed medication, we defined five time periods of interest: 1) Period 1, from 12 to 7 months before index imaging; 2) Period 2, from 6 months before to the day of index imaging; 3) Period 3 (only for patients with more than one index imaging in the index year), time between first and last index image in the index year; 4) Period 4, from day 1 to 6 months after index imaging; 5) Period 5, from 7 to 12 months after index imaging. Regarding the Swiss insurance model, two main groups were identified: managed care insurance, where a healthcare manager (a family doctor [family physician model], a network [network model], or a specialized telemedicine call-center [telemedicine model]) acted as a gatekeeper; or a free choice model, where insured patients had full freedom to receive treatment from doctors and specialists of their choice. Owing to applicable regulations provided by GM we analyzed a random selected subset of around 92% of all identified patients.
Statistics
Data describing basic characteristics were presented as numbers (percentage, %) or means (standard deviation, SD) where appropriate. Group comparisons according to diagnostic image were performed using chi-square tests, for categorical variables, or ANOVA test, for continuous variables. Pain medication prescriptions were reported, by time period, as a number (percentage, %), and as a median (interquartile range, IQR) per patient. Comparisons of number (percentage, %) between time before imaging (Periods 1 and 2) and after imaging (Periods 4 and 5) were performed using chi-square tests. Defined Daily Doses, (DDD) depending on time of prescription and imaging method, were shown as median (IQR). Comparisons between time period before imaging and after imaging, were performed using the Kruskal–Wallis test. Logistic regression analysis was performed to identify the association of imaging and time period (before or after imaging separately) with specific prescriptions (NSAIDs, opioids, and paracetamol). Odds ratios and confidence intervals were shown graphically. Correction for repeated measurements was not necessary, because data were summarized so that there was one observation before and one after imaging for each patient, and two separate regressions were performed. Use of NPT, described as number (percentage, %) was compared between time periods, for patients with pain medications, and between patients with and without medications using chi-square tests. For all tests, P ≤ 0.05 was considered statistically significant. All analyses were carried out using statistical package R (https://www.R-project.org).
Ethics
Analysis of full anonymized and aggregated data from healthcare insurances did not fall under the Swiss Federal Act on Research involving Human Beings (Human Research Act) and thus no ethics approval was needed.
Results
Basic Characteristics
A total of 60,822 patients (mean age: 53.5 y, 56.1% female) were included in the study (Figure 1, Table 1). MRI (44.5%) and X-ray (34%) were the most commonly performed single diagnostic imaging methods. In patients with a combination of diagnostic imaging studies (X-ray/MRI and X-ray/CT) the proportion of patients with the X-ray before, after, or on the same day as an MRI/CT was 66.4%, 15.9%, and 17.7%; and 56.1%, 18.6%, and 25.3%, respectively. In the year of imaging, 19.4% of the patients had one comorbidity and 5.6% two or more comorbidities. Patients with a CT of the spine (CT alone or in combination with an X-ray) were older on average and had more comorbidities compared to patients with an X-ray or MRI (mean age 59.32 vs 52.83 y; mean number of comorbidities 0.42 vs 0.3, P < 0.001 for both comparisons).
 |
Table 1 Basic Characteristics of 60,822 Patients with a Diagnostic Imaging for Low Back Pain |
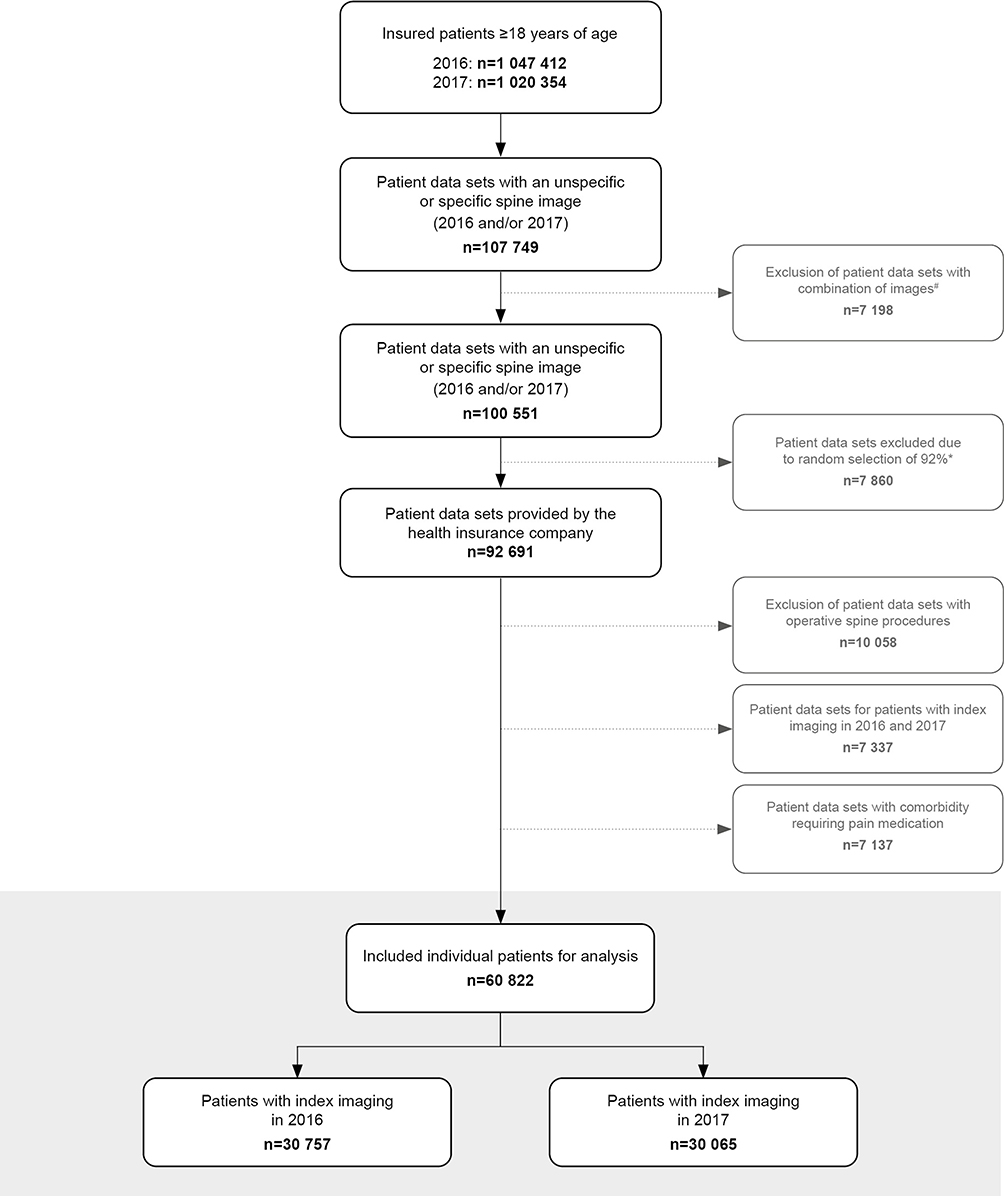 |
Figure 1 Flowchart of inclusion of 60,822 patients with low back pain. Gray shaded area: The measuring unit was individual patients (vs patient data sets, in which patients can be listed twice). #Patients with a combination of an unspecific index imaging of the spine and a specific imaging of an adjacent anatomical region, which suggested that the pathology was not exclusively in the lumbar spine, were excluded. *Due to internal regulations of the insurance company, a random sample of approximately 92% was analyzed. |
Pain Medication Therapies
Throughout the whole observation period, 51,900 patients (85.3%) received at least one pain medication and 5678 (9.3%) patients received pain medication in all periods. The proportion of patients with pain medication therapy was higher in patients with a combination of imaging studies (X-ray/MRI or X-ray/CT) compared to patients with one imaging only (P < 0.001 for all comparisons): any prescription (90.8% vs 84.6%), NSAID (82.7% vs 74.7%), paracetamol (64.6% vs 59.7%), and opioids (45.7% vs 32.8%). Patients with combinations of diagnostic imaging methods had the highest odds of pain medication prescriptions (OR: 1.81. 95% CI: 1.66, 1.96, P < 0.001). In patients with a pain medication prescription, NSAIDs, paracetamol, or opioids were prescribed in 88.6%, 70.7%, and 40.3%, respectively. Moreover, 61.9% of patients with NSAID therapy had proton pump inhibitor (PPI) co-medication. Considering only patients with an opioid prescription, 17% of patients in this group were prescribed a strong opioid. Moreover, strong opioids accounted for 30.7% of all opioid prescriptions. The odds of receiving a specific class of pain medication was dependent on the imaging method used and on the timing of prescription (Figure 2).
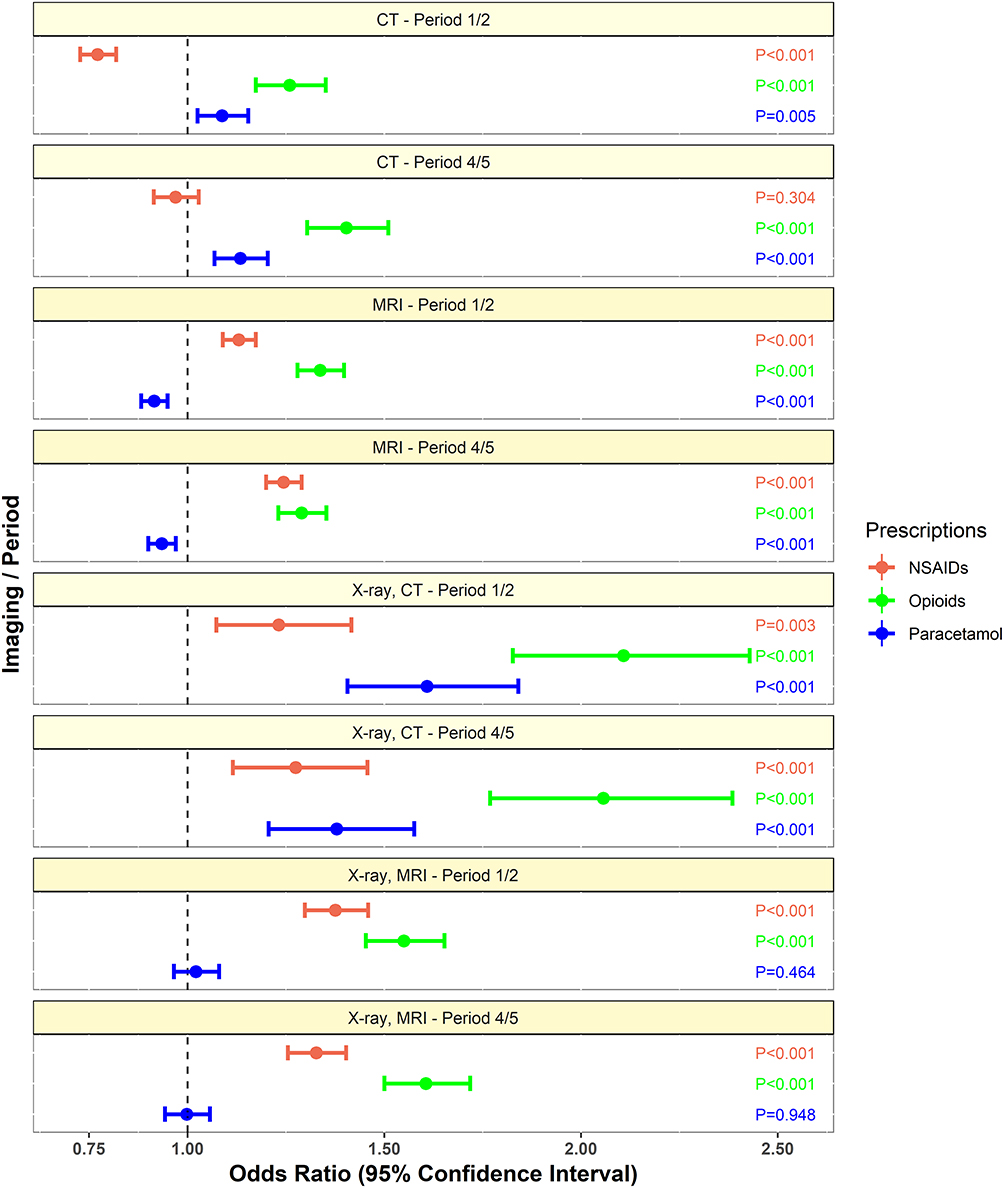 |
Figure 2 Odds ratios for prescribing pain medications dependent on the kind of diagnostic imaging method. Time periods before (Period 1 and 2) and after (Period 4 and 5) the diagnostic imaging were analyzed separately. Patients with an X-ray only were used as the reference group. P-values are labelled beside the confidence intervals. Abbreviations: NSAID, non-steroidal anti-inflammatory drug; MRI, magnetic resonance imaging; CT, computed tomography scan; NPT, non-pharmacologic therapies. |
Detailed prescription patterns for all time periods are presented in Table 2. We found that the prescription rates were stable within the whole observation period with a median of one prescription (IQR 1–2) for almost all drugs and time periods. During the whole observation period, ibuprofen, diclofenac, and mefenamic acid were the most commonly used NSAIDs and tramadol (alone and in combination with paracetamol) the most commonly used opioid. However, the relative use of different substances differed significantly in relation to the timing of prescription (Supplementary Data Table 1). In the year after a diagnostic imaging, we found that it was more common for strong opioids to be prescribed compared to the period before imaging. The most common treatment patterns regarding the use of drug classes were NSAID monotherapies and combination therapies with NSAIDs and paracetamol (Figure 3).
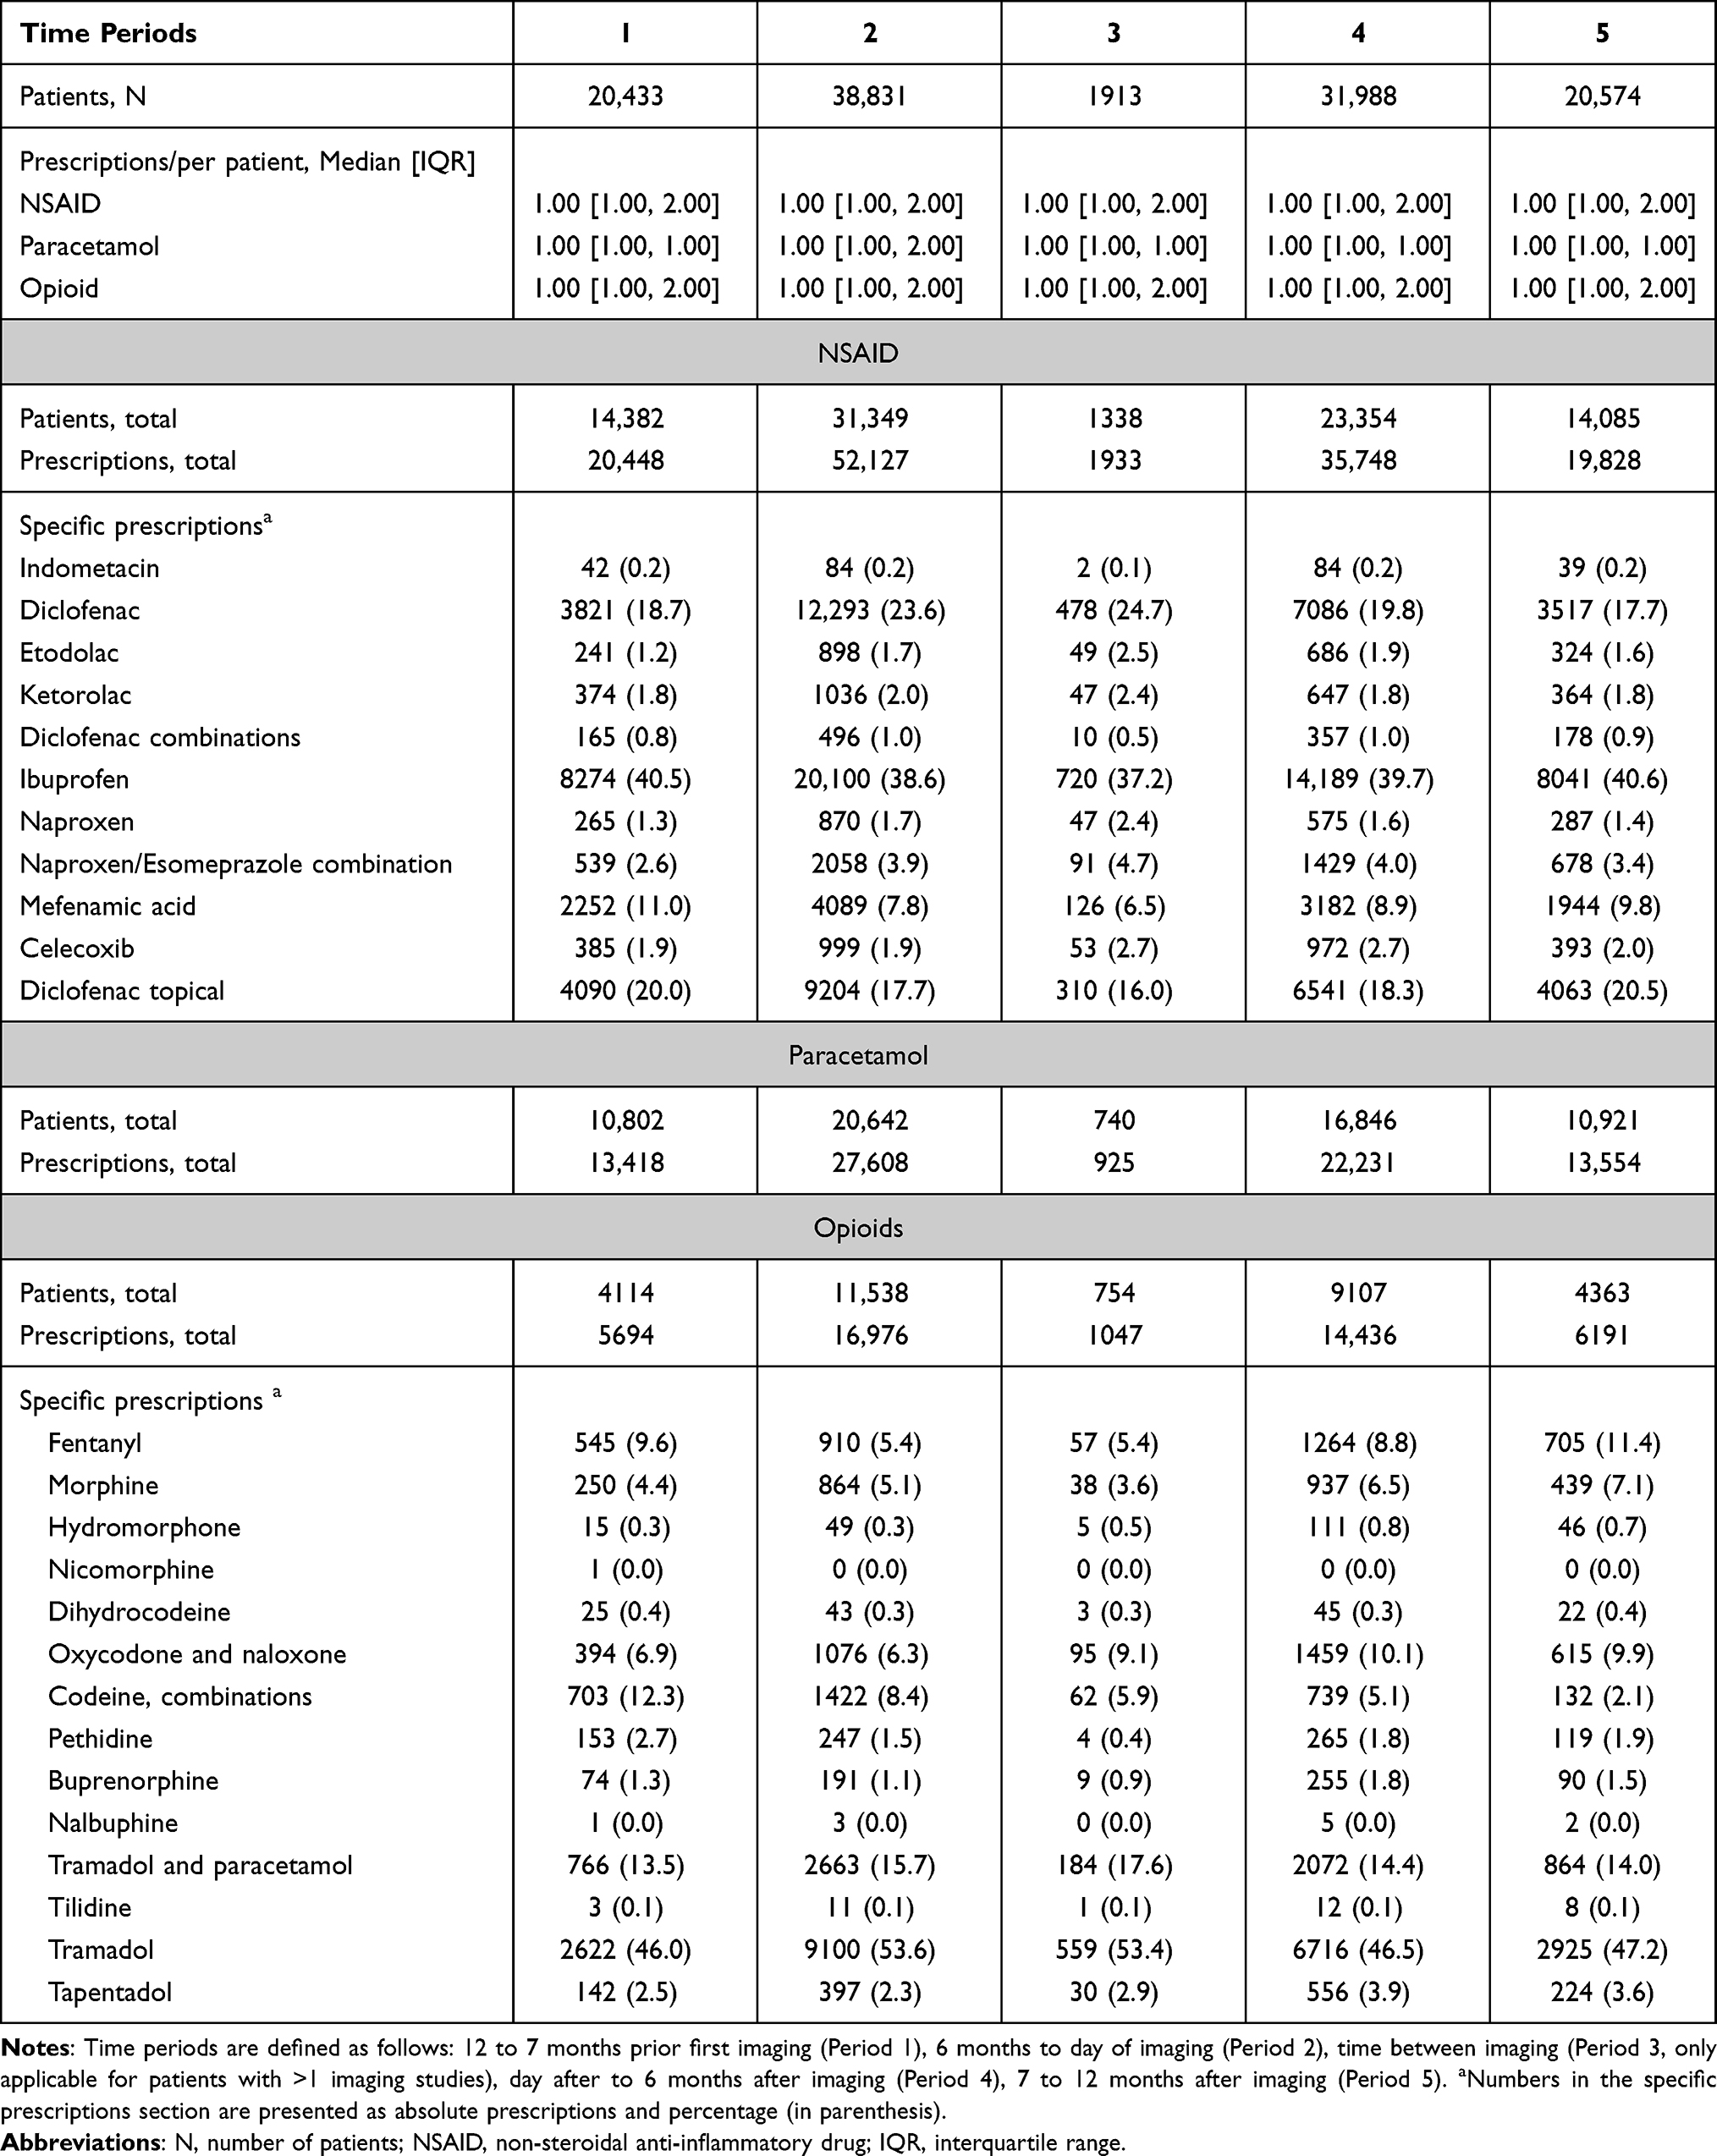 |
Table 2 Pain Medication Therapies in 51,900 Patients |
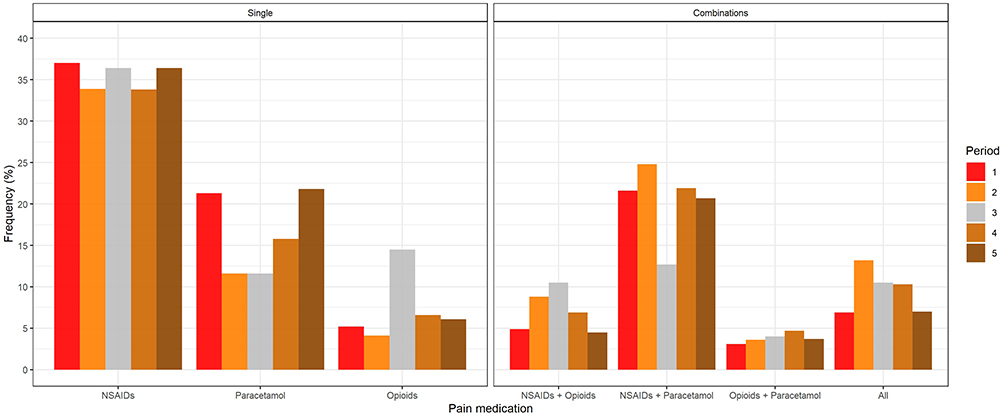 |
Figure 3 Overview of the use of different pain medications. Left part of the figure (Single) shows the usage of single pain medications and the right part of the figure (Combinations) shows the usage of combined pain medications. All bars of a specific time period sum to 100%. All: Combination of NSAID, paracetamol, and opioid. Abbreviation: NSAIDs, non-steroidal anti-inflammatory drugs. |
Regarding the dosage of prescribed drugs (Table 3), we found that the median prescribed DDDs of NSAIDs and paracetamol corresponded to two to three weeks of therapy, independently of the imaging method or observation period. In contrast, the median prescribed DDDs of opioid therapies corresponded to shorter therapy durations of approximately 5 to 10 days only. For most substances and regardless of the diagnostic imaging method used, we found significantly higher amounts of DDDs prescribed in the year after the imaging compared to the year before (Supplementary Data Table 2).
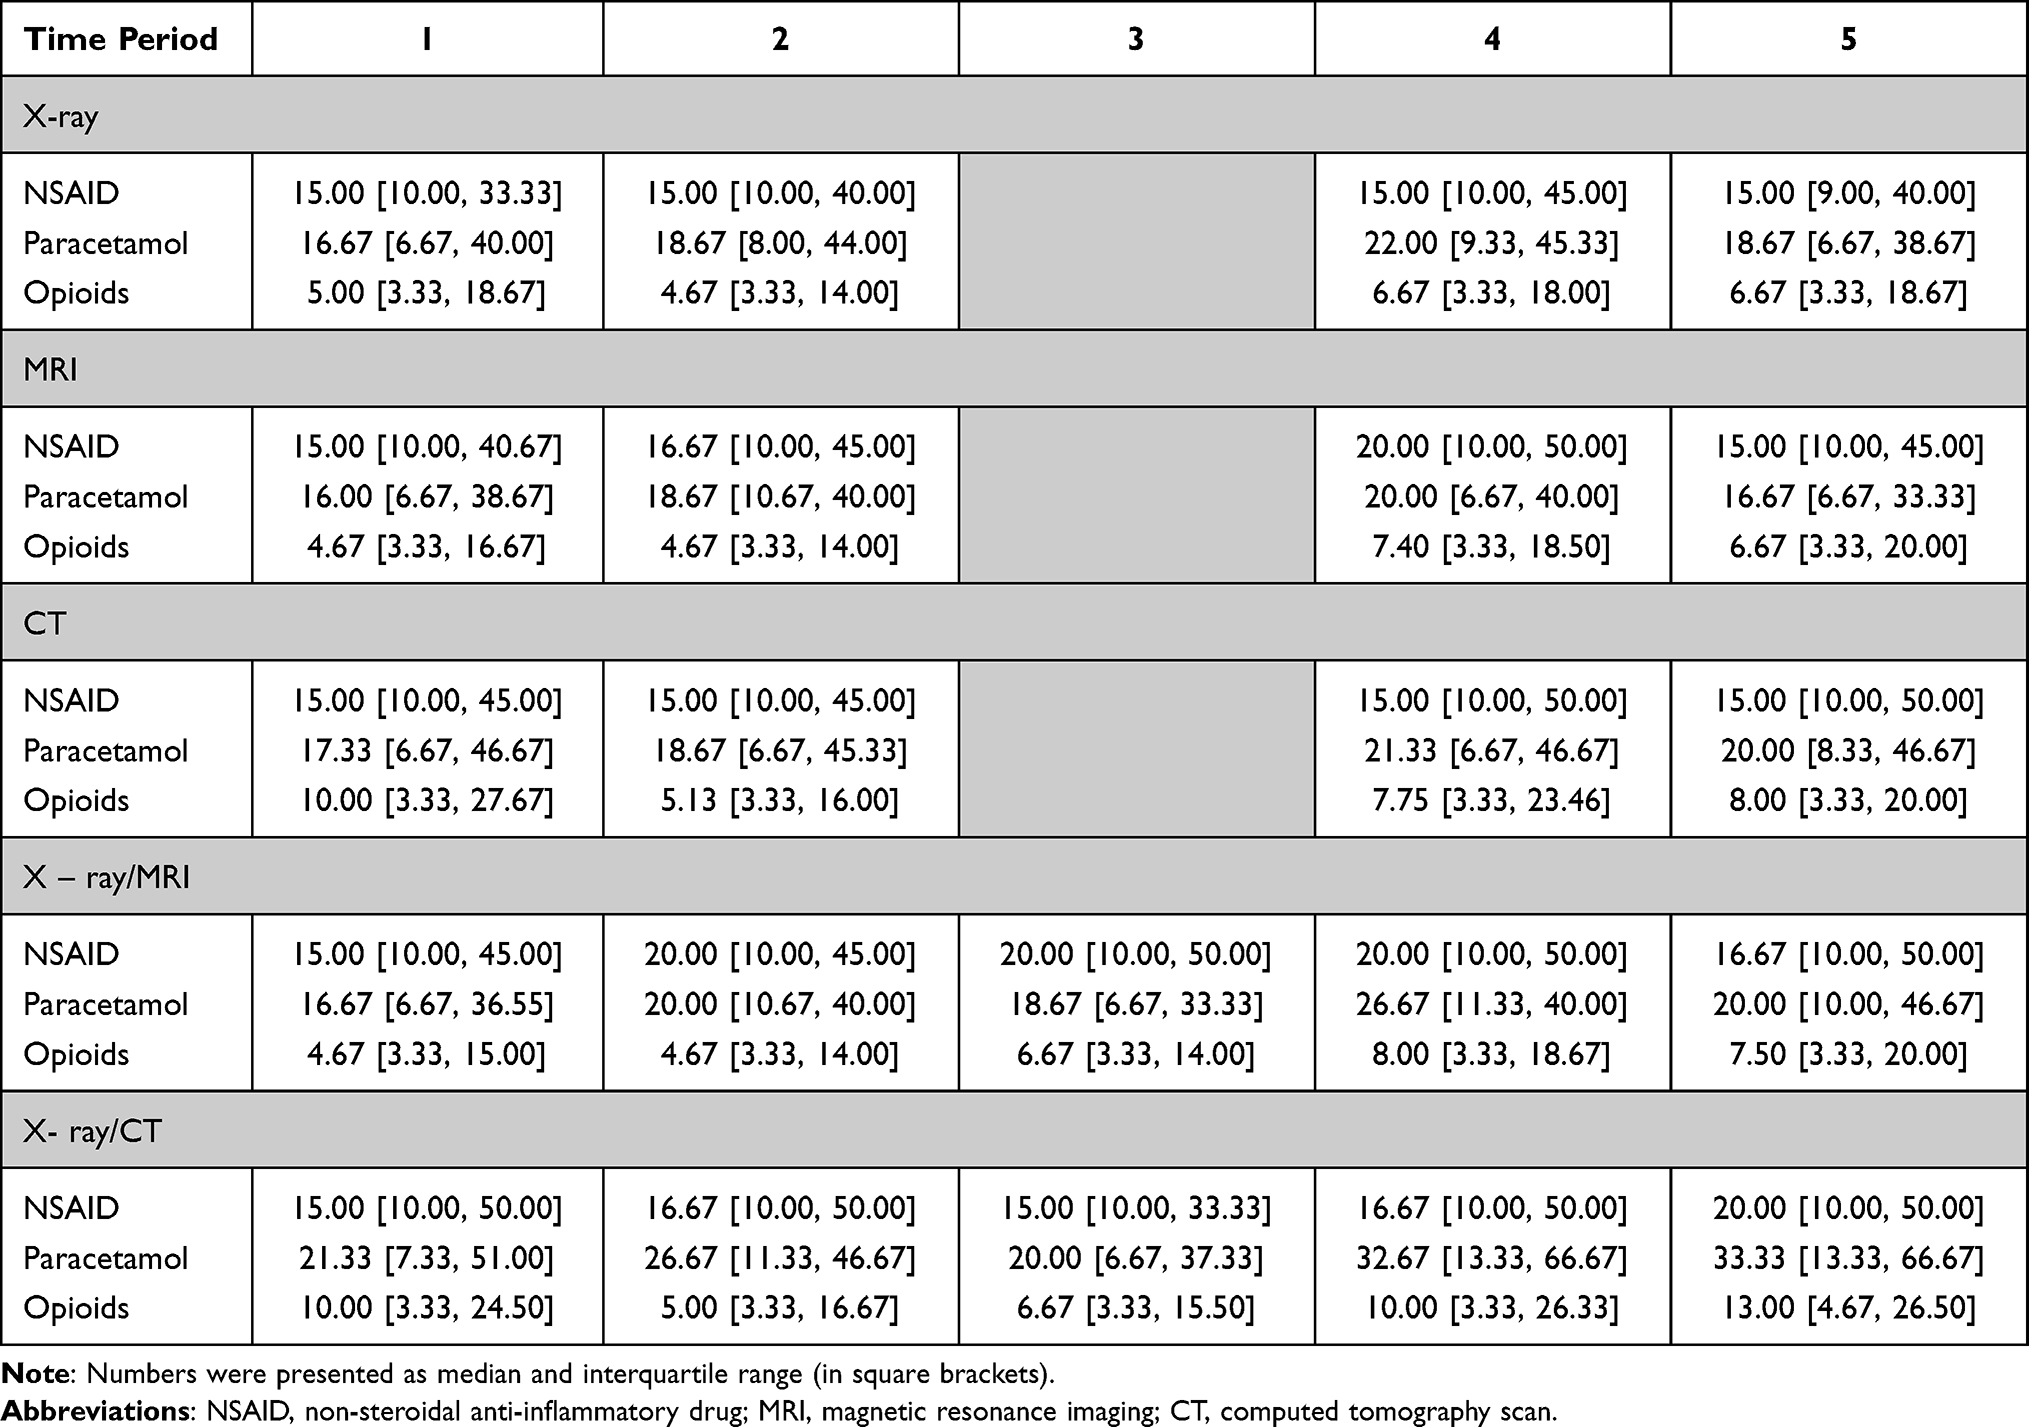 |
Table 3 Prescribed Pain Medications per Patient (in Defined Daily Doses, DDD) Depending on Time of Prescription and Imaging Method |
Information on the use of NPT was available for 60,359 patients (99.2%). Furthermore, 42,039 (69.6%) patients used at least one variety of NPT. Patients using NPT differed from patients without NPT in terms of age (mean age 54.1 vs 52.4 y), gender (female: 59.7% vs 48.6%), and the number of comorbidities (mean number: 0.34 vs 0.28) (P < 0.001 for all comparisons, Supplementary Data Table 3). Physiotherapy, chiropractic therapy, and occupational therapy were used in 65.9%, 11.3%, and 2.7% of patients, respectively. NPT were more common in patients with a concomitant pain medication therapy compared to those without (physiotherapy: 68.8% vs 49.2%, chiropractic therapy: 11.5% vs 10%, occupational therapy: 2.9% vs 1.2%; P < 0.001 for all comparisons). Independently of the prescribed pain medication class, patients with NPT received more prescriptions and higher amounts of DDDs (P ≤ 0.001 for all comparisons; Supplementary Data Table 4).
Discussion
In this study, we analyzed treatment patterns in 60,822 patients who had undergone diagnostic imaging of the spine because of LBP. We observed that only a minority of patients with pain medication therapy received different pain medications and the mean amount of prescribed pain medications corresponded to short-term therapies. We found a substantial use of opioids and within opioid prescriptions a high proportion (31%) were for strong opioids. Finally, the usage of NPT was associated with higher amounts of prescribed pain medications.
Spine Imaging and Associated Treatment Patterns
Although often inappropriate, radiological imaging of the spine is common in patients with acute LBP.5,9,10 In our study, MRI was the most common imaging method, surpassing X-ray. The relative distribution of the type of imaging used varied widely between different studies and settings and may be influenced by different national guidelines, but X-ray examinations are in general the most commonly reported modalities.3–5,11–14 However, although MRI or CT are superior to X-ray in many diagnostic issues15,16 and one could observe an increasing use of MRI/CT,17 the common use of X-rays in our study sample may have been owing to easier and more timely access to X-ray equipment. In accordance with international guidelines3 and similar to observational data from the USA or Italy,5,18 our study showed a high percentage of pain medication prescriptions (85%). Patients with combinations of diagnostic imaging methods, in particular X-ray/CT, had the highest odds of pain medication prescriptions. Indeed, combinations of diagnostic imaging methods, especially CT imaging, could represent a surrogate of more severe diseases and the severity of LBP is a known factor affecting imaging rates and prescribed medication patterns.12 In fact, patients with a CT were older on average and had more comorbidities compared to the remaining patients.
Non-Opioid Pain Medication Therapies
We noted a high percentage of NSAID use (89% of patients with any pain medication) which is in line with many international guidelines3 and national guidance,19 that recommend the use of NSAIDs as first line treatment options. Furthermore, our prescribing patterns were similar to those reported in a recent study which analyzed pharmacological treatment patterns in LBP patients in the Swiss primary care setting but regardless of diagnostic spine imaging.20 In accordance with the available national guidance,19 Ibuprofen, diclofenac, and mefenamic acid were the most commonly used medications and accounted for nearly 90% of all NSAID prescriptions. Alternative NSAIDs such as COX-2 inhibitors were only marginally used. In the observation period following the diagnostic imaging we noticed minor but significant changes in the relative use of different NSAIDs. However, the overall prescribing patterns were not affected by these minor changes. Paracetamol, which has a lower recommendation for acute LBP,3 was still prescribed in 71% of cases. Independent of the used drug and observation period, prescribing patterns seemed to be conservative, as patients with NSAID or paracetamol treatments had one prescription at the median, while the upper IQR did not surpass two prescriptions. Additionally, the median prescribed DDDs corresponded to treatment durations of two to three weeks, with slightly longer treatment durations in patients with a combination of images and in patients taking paracetamol.
Opioid Pain Medication Therapies
Despite the questionable effect of opioids in acute LBP21 and the evidence of poorer outcomes compared to non-opioid treatments,22,23 opioids are still frequently prescribed for patients with LBP.5,24–26 In our study 34% of all patients received an opioid. Comparing this percentage of opioid use to the sparse national comparative data,20 we found that the percentage in our study was almost twice as high. In addition, we discovered higher percentages of strong opioid use, although tramadol, as a weak opioid, was still the most common opioid prescribed. Our data differed from the comparative data20 because we included only LBP patients with a diagnostic imaging of the spine and not the whole population with acute LBP. The same issue is true for the international comparative data as opioid treatment rates reported from the USA are similar, but the population studied included all patients with LBP and not specifically patients with diagnostic imaging.5
Many different factors could contribute to this difference. Conversely, providers’ clinical knowledge is associated with the use of opioids27 and it is known that many diagnostic images are inappropriate. However, many different patient factors may have contributed to the increased opioid prescription rates. For example, patients who had undergone diagnostic imaging could perhaps have suffered from more intense pain than the general population of patients with acute LBP. In fact, a study from the United Kingdom showed that patients with opioid treatments suffered from higher pain intensities.23 Similarly, further patient factors such as comorbidities, distress, or the degree of mobility impairment appeared to have an impact on individual treatment patterns23,28 and may be more prevalent in patients who had undergone diagnostic imaging. However, to the best of our knowledge, there are no specific studies investigating the complex interplay between patient and provider factors, treatment patterns, and diagnostic imaging in patients with acute LBP. Nevertheless, the high rates of diagnostic imaging in acute LBP9,10 and the apparent higher rates of opioid treatments in these patients highlight the relevance of international initiatives promoting the conservative use of diagnostic imaging in acute LBP.29,30
Strong opioids were approximately one third of all opioid prescriptions in our study and we observed a shift towards strong opioid usage after diagnostic imaging, with significantly more prescriptions for strong opioids like morphine, fentanyl, or oxycodone. However, our findings that strong opioids were only used in a small group of patients and that only a few patients had monotherapies with opioids could be seen as an indication for their prudent use. Furthermore, the median prescribed DDDs corresponded to only one to two weeks of treatment and the upper IQR seldom surpassed a treatment duration of longer than three weeks. In addition to patient characteristics, provider factors and local routines may influence prescribing behavior.20,24,31,32 Thus, further studies are needed to identify patient groups at risk, and provider characteristics associated with increased and perhaps unnecessary opioid prescriptions in the Swiss healthcare setting.
Non-Pharmacologic Therapies
Physiotherapy was the most frequent treatment option although only a few international guidelines recommend physiotherapy for acute LBP3 and the evidence for efficacy is low.31 Compared to a large USA cohort, the proportion of physiotherapy use was threefold higher in our study.26 Similarly, the proportion of physiotherapy use was twofold higher compared to a representative national survey among patients with LBP.33 Significantly less frequent, when compared to physiotherapy, was the use of chiropractic therapy, the efficacy of which is also questionable.34,35 Overall, the use of NPT was higher in patients with a concomitant pain medication therapy and patients with NPT had more prescriptions and higher prescribed DDDs. In addition, patients with NPT were older on average and had more comorbidities compared to patients without NPT. Thus, it seemed that NPT were used as an additional treatment option rather than as an alternative therapy. Therefore, the association between physiotherapy and opioid prescriptions also remained unclear. In contrast to some evidence, which suggested a positive effect of physiotherapy on opioid prescriptions,36,37 we found even higher odds of receiving an opioid in patients with physiotherapy, as shown previously.38
Strengths and Limitations
To the best of our knowledge, this study was the first to perform an analysis of pain medication therapies in a large number of patients who had undergone diagnostic imaging for LBP in Switzerland. By calculating the prescribed DDDs we gained important insights into national prescribing patterns. This is relevant as the long-term use of opioids in non-cancer pain is a considerable concern; an increasing use of opioids can also be observed in Western Europe as well as the USA.39
Our study had some limitations. First, owing to our inclusion procedure, we could not definitely rule out errors during patient selection. As we could not collect any clinical data, there was a chance that patients received imaging studies not exclusively for LBP. However, a long pre-observation period of 12 months, the exclusion of all patients who had undergone back surgery, and the exclusion of patients with comorbidities associated with the use of pain medications, minimized the selection bias. At the same time, there was a risk that patients may have been incorrectly excluded. In fact, we excluded patients with an unspecific TARMED Code of the spine if they had at the same time a specific TARMED code for an adjacent anatomic region (for example simultaneous codes for CT of the spine and CT of the skull), as these combinations could indicate that the pathology was not exclusively related to the lumbar spine. We are aware of the possibility that a patient may have had a CT of the spine for LBP and at the same time, a CT for an adjacent anatomic region for another unrelated pathology.
Second, because GM is more active in the French-speaking part of Switzerland, patients from this area were overrepresented. However, the basic characteristics of our patients (age and gender) were similar to those reported in a previous study investigating LBP in the primary care setting in the German-speaking area of Switzerland.20 Third, we were unaware of any pain medications purchased by patients over the counter (OTC) which were not reimbursed by GM. Back pain is a frequent reason for OTC purchase of pain medications.40 Thus, our calculations regarding NSAIDs and paracetamol could underestimate the real intake of pain medications. However, because opioids are not available for OTC purchases, our findings regarding opioids were not affected by this bias. Finally, we were unable to consider other therapies, such as epidural injections, which may have influenced the use of oral analgesics.
Conclusion
The majority of patients who had undergone diagnostic imaging for LBP received non-opioid and short-term pain medication therapies, in accordance with international guidelines. Nevertheless, the rate of opioid use was high, particularly for strong opioids. Given the scant evidence of their effectiveness in acute LBP and the potential adverse outcomes and addiction associated with the use of opioids in non-cancer patients, the findings of our study emphasized the importance of the prudent use of opioids in patients with LBP.
Disclosure
Stefania Di Gangi and Christophe Bagnoud have co-Shared First authorship. The authors declare no conflicts of interest in this work.
References
1. GBD 2013 Mortality and Causes of Death Collaborators. Global, regional, and national age-sex specific all-cause and cause-specific mortality for 240 causes of death, 1990–2013: a systematic analysis for the Global Burden of Disease Study 2013. Lancet. 2015;385(9963):117–171. doi:10.1016/S0140-6736(14)61682-2.
2. Finley CR, Chan DS, Garrison S, et al. What are the most common conditions in primary care? Systematic review. Can Fam Physician. 2018;64(11):832–840.
3. Oliveira CB, Maher CG, Pinto RZ, et al. Clinical practice guidelines for the management of non-specific low back pain in primary care: an updated overview. Eur Spine J. 2018;27(11):2791–2803. doi:10.1007/s00586-018-5673-2
4. Williams CM, Maher CG, Hancock MJ, et al. Low back pain and best practice care: a survey of general practice physicians. Arch Intern Med. 2010;170(3):271–277. doi:10.1001/archinternmed.2009.507
5. Ivanova JI, Birnbaum HG, Schiller M, Kantor E, Johnstone BM, Swindle RW. Real-world practice patterns, health-care utilization, and costs in patients with low back pain: the long road to guideline-concordant care. Spine J. 2011;11(7):622–632. doi:10.1016/j.spinee.2011.03.017
6. Vadivelu N, Kai AM, Kodumudi V, Sramcik J, Kaye AD. The opioid crisis: a comprehensive overview. Curr Pain Headache Rep. 2018;22(3):16. doi:10.1007/s11916-018-0670-z
7. Dhalla IA, Persaud N, Juurlink DN. Facing up to the prescription opioid crisis. BMJ. 2011;343:d5142. doi:10.1136/bmj.d5142
8. WHO. ATC/ DDD Index; 2021. Available from: https://www.whocc.no/atc_ddd_index/.
9. Jenkins HJ, Downie AS, Maher CG, Moloney NA, Magnussen JS, Hancock MJ. Imaging for low back pain: is clinical use consistent with guidelines? A systematic review and meta-analysis. Spine J. 2018;18(12):2266–2277. doi:10.1016/j.spinee.2018.05.004
10. Downie A, Hancock M, Jenkins H, et al. How common is imaging for low back pain in primary and emergency care? Systematic review and meta-analysis of over 4 million imaging requests across 21 years. Br J Sports Med. 2020;54(11):642–651. doi:10.1136/bjsports-2018-100087
11. Pham HH, Landon BE, Reschovsky JD, Wu B, Schrag D. Rapidity and modality of imaging for acute low back pain in elderly patients. Arch Intern Med. 2009;169(10):972–981. doi:10.1001/archinternmed.2009.78
12. Ly DP. Evaluation and treatment patterns of new low back pain episodes for elderly adults in the United States, 2011–2014. Med Care. 2020;58(2):108–113. doi:10.1097/MLR.0000000000001244
13. Carey TS, Garrett JM. The relation of race to outcomes and the use of health care services for acute low back pain. Spine (Phila Pa 1976). 2003;28(4):390–394. doi:10.1097/01.BRS.0000048499.25275.51
14. Kim LH, Vail D, Azad TD, et al. Expenditures and health care utilization among adults with newly diagnosed low back and lower extremity pain. JAMA Netw Open. 2019;2(5):e193676. doi:10.1001/jamanetworkopen.2019.3676
15. Rao D, Scuderi G, Scuderi C, Grewal R, Sandhu SJ. The use of imaging in management of patients with low back pain. J Clin Imaging Sci. 2018;8:30. doi:10.4103/jcis.JCIS_16_18
16. Chou R, Qaseem A, Owens DK, Shekelle P. Clinical Guidelines Committee of the American College of Physicians. Diagnostic imaging for low back pain: advice for high-value health care from the American College of Physicians [published correction appears in Ann Intern Med. 2012 Jan 3;156(1 Pt 1):71]. Ann Intern Med. 2011;154(3):181–189. doi:10.7326/0003-4819-154-3-201102010-00008
17. Mafi JN, McCarthy EP, Davis RB, Landon BE. Worsening trends in the management and treatment of back pain [published correction appears in JAMA Intern Med. 2015 May;175(5):869]. JAMA Intern Med. 2013;173(17):1573–1581. doi:10.1001/jamainternmed.2013.8992
18. Piccoliori G, Engl A, Gatterer D, Sessa E, der Schmitten J, Abholz HH. Management of low back pain in general practice - is it of acceptable quality: an observational study among 25 general practices in South Tyrol (Italy). BMC Fam Pract. 2013;14:148. doi:10.1186/1471-2296-14-148
19. Sajdl H, Brüne B. Rückenbeschwerden: mediX; 2018. Available from: https://www.medix.ch/wissen/guidelines/bewegungsapparat/rueckenbeschwerden/.
20. Di Gangi S, Pichierri G, Zechmann S, Rosemann T, Plate A. Prescribing patterns of pain medications in unspecific low back pain in primary care: a retrospective analysis. J Clin Med. 2021;10(7):1366. doi:10.3390/jcm10071366
21. Deyo RA, Von Korff M, Duhrkoop D. Opioids for low back pain. BMJ. 2015;350:g6380. doi:10.1136/bmj.g6380
22. Webster BS, Verma SK, Gatchel RJ. Relationship between early opioid prescribing for acute occupational low back pain and disability duration, medical costs, subsequent surgery and late opioid use. Spine (Phila Pa 1976). 2007;32(19):2127–2132. doi:10.1097/BRS.0b013e318145a731
23. Ashworth J, Green DJ, Dunn KM, Jordan KP. Opioid use among low back pain patients in primary care: is opioid prescription associated with disability at 6-month follow-up? Pain. 2013;154(7):1038–1044. doi:10.1016/j.pain.2013.03.011
24. Raad M, Pakpoor J, Harris AB, et al. Opioid prescriptions for new low back pain: trends and variability by state. J Am Board Fam Med. 2020;33(1):138–142. doi:10.3122/jabfm.2020.01.190254
25. Kobus AM, Smith DH, Morasco BJ, et al. Correlates of higher-dose opioid medication use for low back pain in primary care. J Pain. 2012;13(11):1131–1138. doi:10.1016/j.jpain.2012.09.003.
26. Azad TD, Zhang Y, Stienen MN, et al. Patterns of opioid and benzodiazepine use in opioid-naïve patients with newly diagnosed low back and lower extremity pain. J Gen Intern Med. 2020;35(1):291–297. doi:10.1007/s11606-019-05549-8
27. Gray BM, Vandergrift JL, Weng W, Lipner RS, Barnett ML. Clinical knowledge and trends in physicians’ prescribing of opioids for new onset back pain, 2009–2017. JAMA Netw Open. 2021;4(7):e2115328. doi:10.1001/jamanetworkopen.2021.15328
28. Breckenridge J, Clark JD. Patient characteristics associated with opioid versus nonsteroidal anti-inflammatory drug management of chronic low back pain. J Pain. 2003;4(6):344–350. doi:10.1016/s1526-5900(03)00638-2
29. NASS: North American Spine Society. Choosing Wisely; 2019. Available from: http://www.choosingwisely.org/clinician-lists/nass-opioids-for-acute-or-chronic-low-back-pain/.
30. SGAIM, smarter medicine. Choosing Wisely Switzerland: ambulatory care; 2016. Available from: https://www.smartermedicine.ch/de/top-5-listen/ambulante-allgemeine-innere-medizin-2016.html.
31. Karlsson M, Bergenheim A, Larsson MEH, Nordeman L, van Tulder M, Bernhardsson S. Effects of exercise therapy in patients with acute low back pain: a systematic review of systematic reviews. Syst Rev. 2020;9(1):182. doi:10.1186/s13643-020-01412-8
32. Azad TD, Vail D, Bentley J, et al. Initial provider specialty is associated with long-term opiate use in patients with newly diagnosed low back and lower extremity pain. Spine (Phila Pa 1976). 2019;44(3):211–218. doi:10.1097/BRS.0000000000002840
33. Rheumaliga Schweiz. Rückenreport Schweiz; 2020. Available from: https://www.rheumaliga.ch/assets/doc/CH_Dokumente/medien/grosser-rueckenreport-2020/Rueckenreport-2020.pdf.
34. Rubinstein SM, Terwee CB, Assendelft WJ, de Boer MR, van Tulder MW. Spinal manipulative therapy for acute low back pain: an update of the Cochrane review. Spine (Phila Pa 1976). 2013;38(3):E158–E177. doi:10.1097/BRS.0b013e31827dd89d
35. Paige NM, Miake-Lye IM, Booth MS, et al. Association of spinal manipulative therapy with clinical benefit and harm for acute low back pain: systematic review and meta-analysis [published correction appears in JAMA. 2017 Jun 6;317(21):2239] [published correction appears in JAMA. 2017 Nov 28;318(20):2048]. JAMA. 2017;317(14):1451–1460. doi:10.1001/jama.2017.3086
36. Thackeray A, Hess R, Dorius J, Brodke D, Fritz J. Relationship of opioid prescriptions to physical therapy referral and participation for Medicaid patients with new-onset low back pain. J Am Board Fam Med. 2017;30(6):784–794. doi:10.3122/jabfm.2017.06.170064
37. Frogner BK, Harwood K, Andrilla CHA, Schwartz M, Pines JM. Physical therapy as the first point of care to treat low back pain: an instrumental variables approach to estimate impact on opioid prescription, health care utilization, and costs. Health Serv Res. 2018;53(6):4629–4646. doi:10.1111/1475-6773.12984
38. Vogt MT, Kwoh CK, Cope DK, Osial TA, Culyba M, Starz TW. Analgesic usage for low back pain: impact on health care costs and service use. Spine (Phila Pa 1976). 2005;30(9):1075–1081. doi:10.1097/01.brs.0000160843.77091.07
39. Meyer A, LeClair C, McDonald JV. Prescription opioid prescribing in Western Europe and the United States. R I Med J. 2020;103(2):45–48.
40. Wilcox CM, Cryer B, Triadafilopoulos G. Patterns of use and public perception of over-the-counter pain relievers: focus on nonsteroidal antiinflammatory drugs. J Rheumatol. 2005;32(11):2218–2224.
 © 2021 The Author(s). This work is published and licensed by Dove Medical Press Limited. The
full terms of this license are available at https://www.dovepress.com/terms
and incorporate the Creative Commons Attribution
- Non Commercial (unported, 3.0) License.
By accessing the work you hereby accept the Terms. Non-commercial uses of the work are permitted
without any further permission from Dove Medical Press Limited, provided the work is properly
attributed. For permission for commercial use of this work, please see paragraphs 4.2 and 5 of our Terms.
© 2021 The Author(s). This work is published and licensed by Dove Medical Press Limited. The
full terms of this license are available at https://www.dovepress.com/terms
and incorporate the Creative Commons Attribution
- Non Commercial (unported, 3.0) License.
By accessing the work you hereby accept the Terms. Non-commercial uses of the work are permitted
without any further permission from Dove Medical Press Limited, provided the work is properly
attributed. For permission for commercial use of this work, please see paragraphs 4.2 and 5 of our Terms.