Back to Journals » Diabetes, Metabolic Syndrome and Obesity » Volume 16
Trapa Bispinosa Roxb. Inhibits the Insulin-Dependent AKT/WNK1 Pathway to Induce Autophagy in Mice with Type 2 Diabetes
Authors Suzuki T ![]() , Sato T, Masuhara K
, Sato T, Masuhara K ![]() , Tokusanai M, Akatsuka H, Kashikawa T
, Tokusanai M, Akatsuka H, Kashikawa T ![]() , Suzuki Y
, Suzuki Y
Received 13 July 2023
Accepted for publication 4 October 2023
Published 5 October 2023 Volume 2023:16 Pages 3095—3104
DOI https://doi.org/10.2147/DMSO.S430132
Checked for plagiarism Yes
Review by Single anonymous peer review
Peer reviewer comments 2
Editor who approved publication: Dr Konstantinos Tziomalos
Takahiro Suzuki,1 Takehito Sato,2 Kaori Masuhara,2 Mizuki Tokusanai,2 Hisako Akatsuka,2 Tomohiro Kashikawa,2 Yasuyuki Suzuki1
1Department of Ophthalmology, Tokai University School of Medicine, Kanagawa, Japan; 2Department of Immunology, Tokai University School of Medicine, Kanagawa, Japan
Correspondence: Takahiro Suzuki, Department of Ophthalmology, Tokai University School of Medicine, 143 Shimokasuya, Isehara, Kanagawa, 259-1143, Japan, Tel +81-463-93-1121, Fax +81-463-91-9328, Email [email protected]
Purpose: To elucidate the antiglycation activity of Trapa bispinosa Roxb. extract (TBE) and the related mechanism using a mouse model with type 2 diabetes.
Materials and Methods: We prepared control mice by giving them a normal diet, leptin-deficient ob/ob mouse (ob/ob mice) with a normal diet (normal ob/ob mice), and ob/ob mice with a diet containing TBE (TBE ob/ob mice). The effect of TBE on diabetic retina was evaluated by immunohistochemical staining and quantitative real-time polymerase chain reaction (qPCR) analysis.
Results: In both groups with ob/ob mice, body weight and hyperglycemia levels increased over time. Immunohistochemical staining analysis revealed that glial fibrillary acidic protein (GFAP) and advanced glycation end products (AGEs) expression levels were higher in normal ob/ob mice than in control mice, and lower in the TBE ob/ob mice than in normal ob/ob mice. Light chain-3 (LC-3) expression levels reduced in normal ob/ob mice compared to the control mice, but increased in TBE ob/ob mice compared to normal ob/ob mice. In the qPCR analysis, LC-3 expression levels were significantly lower in normal ob/ob mice compared to control mice, and significantly higher in TBE ob/ob mice compared to normal ob/ob mice. Conversely, AKT1 and with-no-lysine kinases 1 (WNK1) expression levels were significantly higher in normal ob/ob mice compared to control mice, and significantly lower in TBE ob/ob mice than in normal ob/ob mice.
Conclusion: In type 2 diabetes, it was suggested that TBE inhibits the insulin-dependent AKT/WNK1 pathway to induce autophagy, and thereby might promote anti-glycation and reduce retinal damage.
Keywords: Trapa bispinosa Roxb. extract, type 2 diabetes, autophagy, insulin-dependent AKT/WNK1 pathway, advanced glycation end products, diabetic retinopathy
Introduction
Type 2 diabetes is a type of diabetes in which blood glucose levels are chronically high owing to insufficient insulin activity. One of the factors is insulin resistance caused by diet, lack of exercise, or obesity based on these factors, which leads to relative hyperinsulinemia.1 Hyperinsulinemia activates the insulin/AKT pathway. AKT regulates key biological processes, such as cell survival, growth, metabolism, and autophagy.2 A study has reported that in type 2 diabetes, autophagy functioning declines owing to reduced autophagy activity resulting from high insulin levels.3 Diabetic retinopathy (DR) is the most common microvascular complication of diabetes and a pertinent cause of visual impairment.4 Studies have shown that autophagy is involved in the pathogenesis of DR,5 and the importance of autophagy in maintaining vascular endothelial cell homeostasis6 has been reported. Thus, regulating autophagy may be a novel therapeutic target for DR. On the contrary, the number of patients with visual impairment due to DR is increasing owing to the increase in the number of patients with diabetes. Although new treatment methods have been developed, effective measures to prevent the onset of DR and reduce the number of patients with visual impairment have not yet been developed. It would be extremely useful if supplements that contain ingredients already approved as food products could be used as preventive agents.
Nonenzymatic Maillard reactivity between reducing sugars and proteins progresses in various proteins in the body, such as hemoglobin, albumin, and collagen,7 followed by the production of AGEs.8 Recent studies have found that the accumulation of AGEs in the body contributes to aging and lifestyle-related diseases, such as diabetes and arteriosclerosis.9 When diabetes develops, concentrations of Nɛ-(carboxymethyl) lysine and Nɛ-(carboxyethyl) lysine, which are AGEs, increase significantly in the body.10 It has been reported that AGEs are involved in the onset mechanism of DR,11 and the accumulation of AGEs in retinal cells is strongly related to the onset of DR.12
Trapa bispinosa Roxb. extract (TBE) is an annual aquatic grass belonging to the Trapaceae family that is widely used in Asia and worldwide as an edible and medicinal plant.13 Plants in the Trapaceae family have been reported to exhibit various physiological functions, including antioxidant,14 antibacterial,13 and hepatoprotective activities.15 Furthermore, in recent studies, TBE has been reported to exert effects, such as inhibition of α-crystallin crosslinking16 and carbonization17 in vitro. With regard to the effects of TBE on the ocular complications of diabetes, it has also been reported that TBE prevents diabetic cataracts18 and improves retinal blood flow in mice with type 2 diabetes.19 TBE is a naturally occurring compound with promising antiglycation activity; however, the mechanism of antiglycation and the preventive effect on DR are unclear. Therefore, we aimed to elucidate the antiglycation activity of TBE and the related mechanism using a mouse model of type 2 diabetes.
Materials and Methods
Chemicals
TBE (67% T. bispinosa Roxb. peel extract) was purchased from Hayashikane Sangyo Co., Ltd. (Yamaguchi Prefecture, Japan). TBE-containing diet was adjusted by mixing 250 µg TBE with 1 g mouse feed (MF), to give TBE intake of 20 mg/kg mouse bw/day. This intake is lower than that previously reported to be safe20).
Animal Experiment
For all animals used in the present study, we obtained approval from the Animal Care and Use Committee of Tokai University, and complied with the guidelines for the care and use of animals for scientific purposes at Tokai University.
We obtained wild type (+/+) and ob/ob male mice of 8 weeks of age from SLC Japan Inc. The mice were categorized into three groups (10 mice per group). Group 1 comprised control mice that were fed with a normal diet; group 2 comprised ob/ob mice fed with a normal diet; and group 3 comprised ob/ob mice fed with a diet containing TBE. In the ob/ob mice group given feed containing TBE, the mice were fed approximately 1 mg of TBE daily, assuming they were provided approximately 4 g of MF per day. The mice were kept in a clean, temperature-controlled environment with a 12-hour night–day cycle and allowed to eat and drink freely for 60 days. We measured the body weight of the mice each week and the blood glucose level each month.
Immunohistochemistry
Sternotomy was performed under general anesthesia using 3% isoflurane. The left ventricle was perfused with physiological saline solution, and after rinsing out the circulating blood, perfusion was immediately performed using 4% paraformaldehyde (PFA). The eyes were removed from the mice, after which the neural retina was separated from the cornea, sclera, crystalline lens, iris, ciliary body, and pigmented epithelium. The neural retina was left overnight in 4% PFA at 4°C. After washing twice with phosphate-buffered saline (PBS), the neural retina was embedded in Tissue-Tek OCT compound (Sakura Finetek Japan, Tokyo, Japan) and stored at –80°C until section creation. Using a cryostat (HM505, Microm, Walldorf, Germany), we generated 10 μm-thick sections. The sections were blocked with 10% normal goat serum and stained overnight at 4°C with antibodies of glial fibrillary acidic protein (GFAP; ready to use, #Z0034, Dako, Glostrup, Denmark), LC-3 (1:100; Santa Cruz Biotechnology, Inc., USA), and AGE (1:100, #07142 Sigma-Aldrich). After washing, the samples were incubated for 2 hours at room temperature with anti-rabbit immunoglobulin G (IgG) (H&L) labeled with Alexa Fluor 488 (Diluted, 1:400; Thermo Fisher Scientific). Next, the samples were incubated with DAPI (1 µg/mL) for 15 min at room temperature for nuclear staining. Subsequently, the samples were washed five times in 0.5% PBS-Tween and mounted horizontally with a mounting medium (Vectashield, Vector Laboratories, Burlingame, CA, USA). Immunofluorescence images were obtained using a Zeiss LSM 800 confocal microscope (Carl Zeiss, Berlin, Germany).
Real-Time PCR
The neural retina was homogenized in TRIzol reagent (Life Technologies) for RNA isolation. cDNA was synthesized using ReverTra Ace qPCR RT Master Mix (FSQ-201, Toyobo).
SYBR Green-based qPCR was performed with a Fast 7500 PCR system using the THUNDERBIRD qPCR Mix (QPS-101, Toyobo). Values were normalized to the housekeeping gene Ubiquitin C (Ubc). The primer sequences are presented in Table 1.
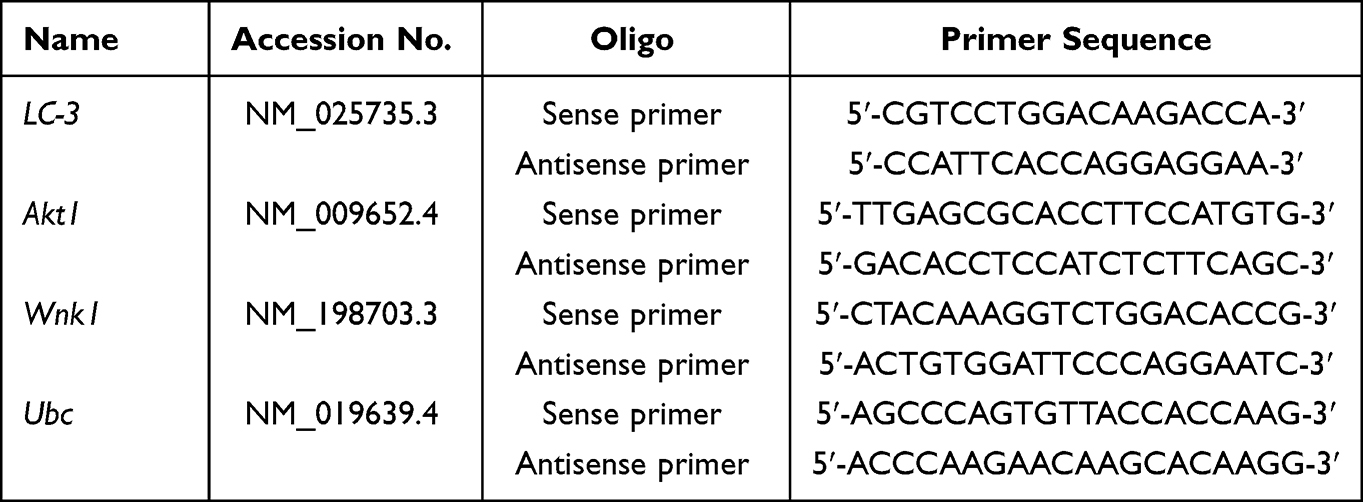 |
Table 1 Primer Sequence Used for Gene Amplification |
Statistical Analysis
Numerical values were presented as mean ± standard deviation. We analyzed the data between the three groups using one-way analysis of variance (ANOVA) to determine the significant difference. The level of statistical significance was set at P ≤ 0.05.
Results
Obesity and Hyperglycemia in Ob/Ob Mice
In leptin-deficient ob/ob mice appetite cannot be controlled, and therefore, both normal ob/ob mice and TBE ob/ob mice showed significant weight gain and elevated blood glucose level compared with the control mice; however, there was a nonsignificant difference between normal ob/ob mice and TBE ob/ob mice (Figure 1A and B; P < 0.05).
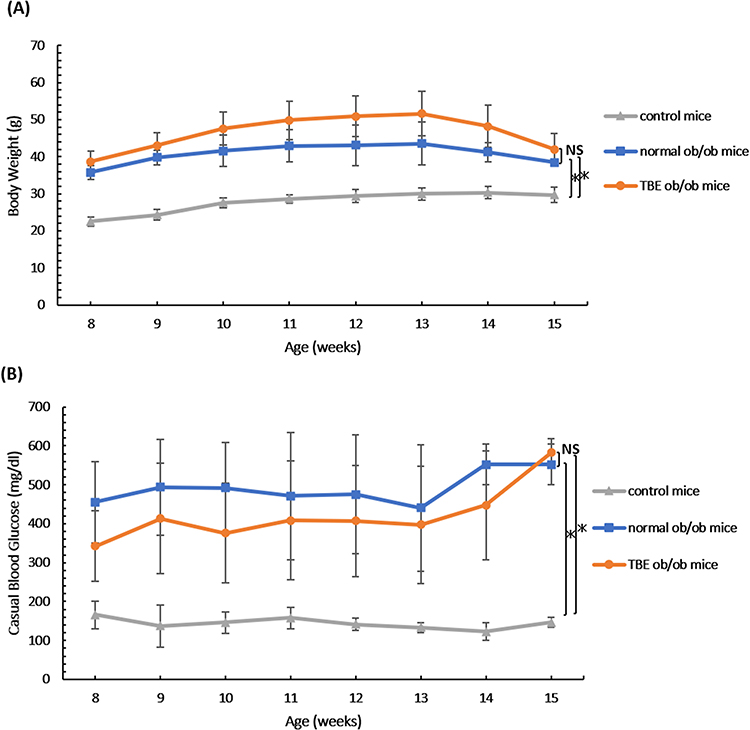 |
Figure 1 Obesity and hyperglycemia. Body weight (A) and blood glucose level (B) of the control mice, normal ob/ob mice, and TBE ob/ob mice groups from 8 weeks to 15 weeks of age. Compared with the control mice, in ob/ob mice, a significant increase in body weight was observed; however, no significant difference was observed between normal ob/ob mice and TBE ob/ob mice (A). Compared with the control mice, in ob/ob mice, a significant increase in blood glucose levels was noted; however, no significant difference was observed between normal ob/ob mice and TBE ob/ob mice (B). Values are expressed as means ± SD. *P < 0.05. Abbreviation: NS, Not significant. |
T. Bispinosa Roxb. Affects Diabetes
In immunohistochemical staining, we stained AGEs, which accumulate owing to diabetes and contribute to the onset of DR. Compared with the staining in the control mice (Figure 2A–C; P < 0.05), in normal ob/ob mice, the expression of AGEs was significantly increased along the retinal blood vessels (Figure 2D–F; P < 0.05). However, in TBE ob/ob mice, compared with normal ob/ob mice, the expression was significantly decreased (Figure 2G–I; P < 0.05).
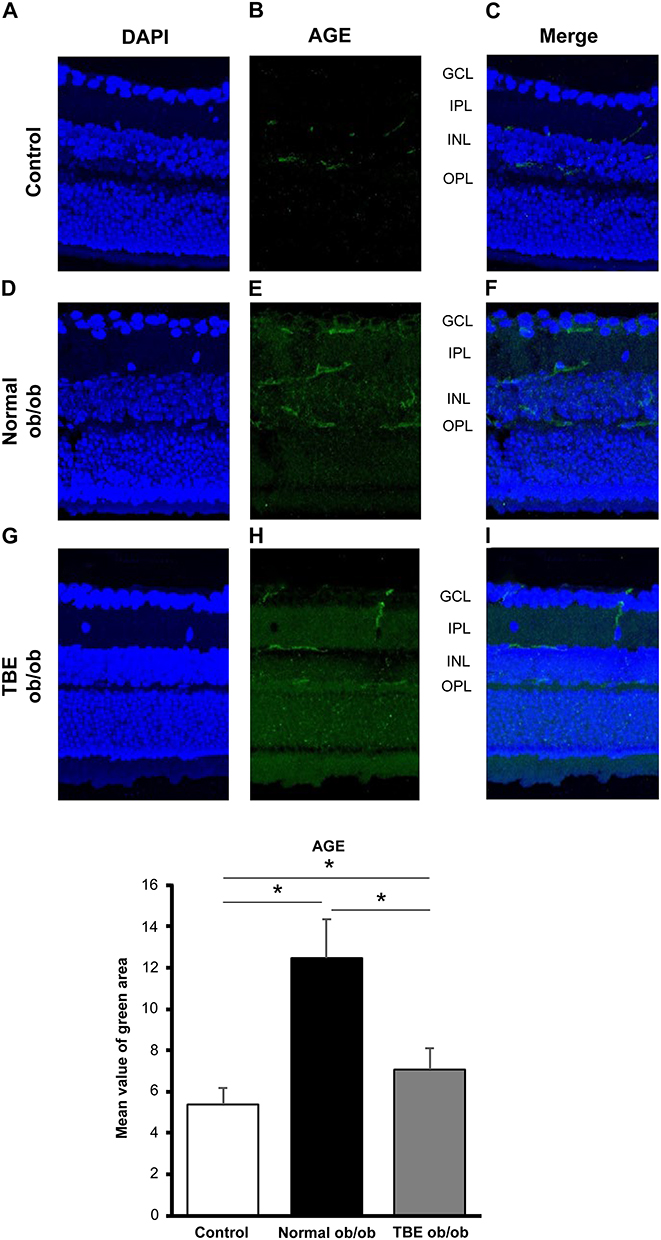 |
Figure 2 Effect of TBE on glycation. A comparison of AGE immunofluorescence (green) when the control mice (A–C) and ob/ob mice were fed with a normal diet (D–F) or diet containing TBE (G–I). AGE expression was observed along the vascular plexus of the retina; in the diabetic retina of mice fed with a normal diet, the expression was significantly increased compared with the control mice (E and F). However, in the diabetic retina of TBE ob/ob mice, AGE expression was significantly decreased compared with the normal ob/ob mice (H and I). Values are expressed as means ± SD. *P < 0.05. Nuclei were counter-stained with DAPI (blue). Abbreviations: GCL, ganglion cell layer; IPL, inner plexiform layer; INL, inner nuclear layer; OPL, outer plexiform layer. |
T. Bispinosa Roxb. Affects Autophagy
In immunohistochemical staining, we stained LC-3, a marker of autophagosomes produced by inducing autophagy. Compared with the staining in the control mice (Figure 3A–C; P < 0.05), the expression of LC-3 was significantly reduced along the inner plexiform layer (IPL) in normal ob/ob mice (Figure 3D–F; P < 0.05). However, in TBE ob/ob mice, compared with the normal ob/ob mice, LC-3 expression was significantly increased (Figure 3G–I; P < 0.05). qPCR results also showed that the mRNA expression of LC-3 was significantly reduced in normal ob/ob mice compared with the control mice; however, in TBE ob/ob mice, the expression levels were significantly increased compared with the normal ob/ob mice (Figure 3J; P < 0.05). Furthermore, we examined AKT1, an isoform of AKT activated by hyperinsulinemia. Also, WNK1, which is elevated by AKT signaling, was examined. The mRNA expression levels of AKT1 and WNK1 were significantly increased in normal ob/ob mice compared with control mice; however, the expression levels were significantly reduced in TBE ob/ob mice compared with normal ob/ob mice (Figure 3K and L; P < 0.05).
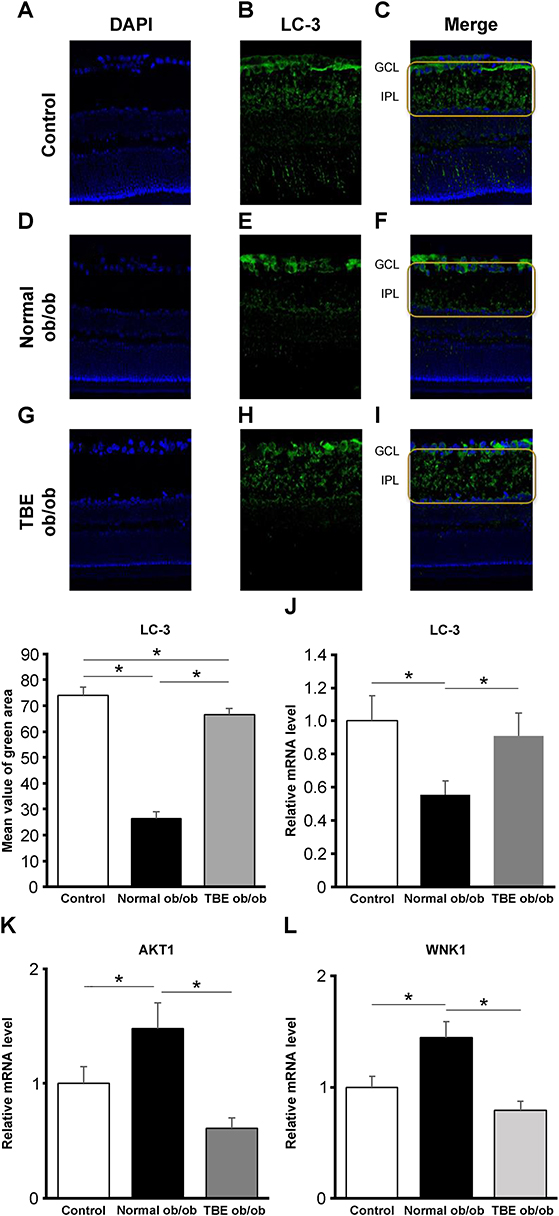 |
Figure 3 The effect of TBE on autophagy. A comparison of LC-3 immunofluorescence (green) when the control mice (A–C) and ob/ob mice were fed with a normal diet (D–F) or diet containing TBE (G–I). In the diabetic retina of mice fed with a normal diet, compared with the control mice, we found that staining in the IPL was attenuated ((E and F), within the yellow line). In the diabetic retina of TBE ob/ob mice, compared with the normal ob/ob mice, LC-3 expression was significantly increased ((H and I), within the yellow line). Retinal qPCR was examined for LC-3, AKT1, and WNK1. Compared with the control mice, in normal ob/ob mice, LC-3 expression was significantly reduced; however, in TBE ob/ob mice, compared with normal ob/ob mice, the expression was significantly increased (J). Furthermore, compared with the control mice, in normal ob/ob mice, AKT1 and WNK1 expression levels were significantly increased; however, in TBE ob/ob mice, compared with normal ob/ob mice, the expression was significantly reduced (K and L). Values are expressed as means ± SD. *P < 0.05. Nuclei were counter-stained with DAPI (blue). Abbreviations: GCL, ganglion cell layer; IPL, inner plexiform layer. |
T. Bispinosa Roxb. Affects Inflammation
In immunohistochemical staining, we stained GFAP, which reflects glial activation at the onset of DR. Compared with the staining of control mice (Figure 4A–D; P < 0.05), in normal ob/ob mice, GFAP expression was significantly increased along the IPL, and we observed more Muller cell projections in the deeper zone (Figure 4E–H; P < 0.05). On the contrary, in TBE ob/ob mice, compared with the normal ob/ob mice, expression was significantly reduced, and there were fewer Muller cell projections (Figure 4I–L; P < 0.05).
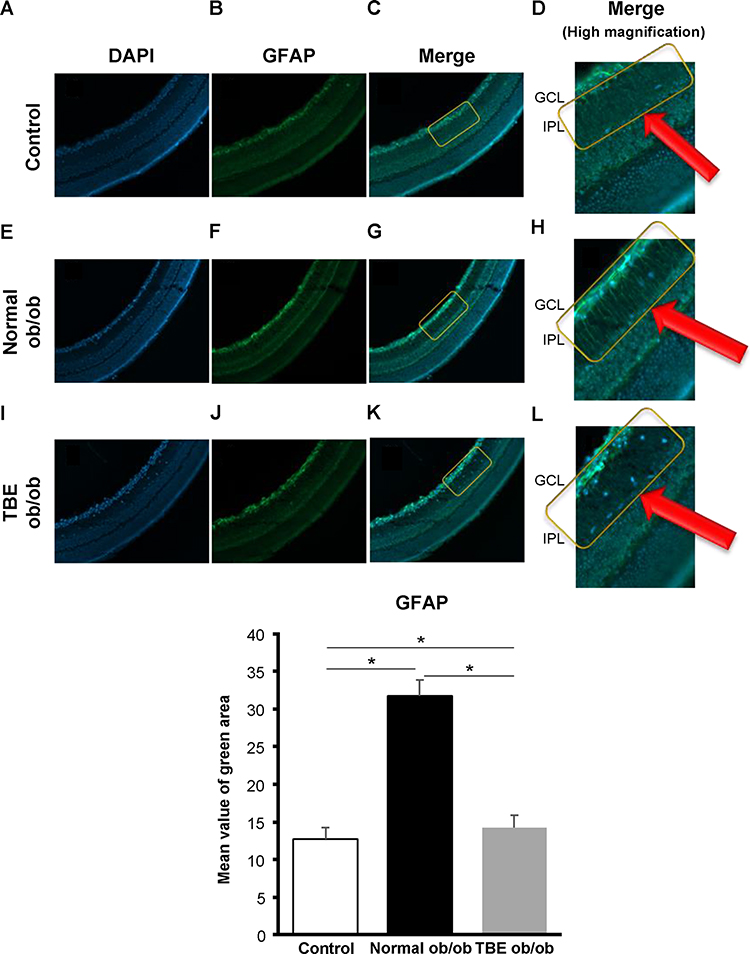 |
Figure 4 The effect of TBE on glial activation. A comparison of GFAP immunofluorescence (green) when the control mice (A–D) and ob/ob mice were fed with a normal diet (E–H) or diet containing TBE (I–L). In the diabetic retina of mice fed with a normal diet, compared with the control mice, we observed that strong staining of radial projections of Muller cells along the IPL was attenuated ((F–H) (within the yellow line, red arrows: magnified image within the yellow line)). In the diabetic retina of TBE ob/ob mice, compared with the normal ob/ob mice, GFAP expression was significantly decreased, and there were fewer Muller cell protrusions ((J–L) (within the yellow line, red arrows: magnified image within the yellow line)). Values are expressed as means ± SD. *P < 0.05. Nuclei were counter-stained with DAPI (blue). Abbreviations: GCL, ganglion cell layer; IPL, inner plexiform layer. |
Discussion
Glycation, the accumulation of AGEs due to diabetes, has been reported to be involved in lifestyle-related diseases, such as aging, diabetes, and atherosclerosis.9 In DR, a common complication of diabetes, accumulation of AGEs also causes retinal cell damage via interaction with the receptor for AGE (RAGE)21 and induces VEGF expression by binding to RAGE present in vascular endothelial cells.21,22 In this study of AGEs, the expression of AGEs in the retina of ob/ob mice was high (Figure 2), which suggests that AGEs accumulate owing to type 2 diabetes. Interestingly, AGE staining was consistent with the three-layer vascular plexus of the mouse retina (Figure 2), which suggests that AGEs accumulate in blood vessels and contribute to the progression of DR by enhancing VEGF expression via binding to RAGE present in vascular endothelial cells. Thus, antiglycation effects that inhibit the formation of AGEs may be an effective strategy to prevent the progression of diabetes.10 In our current study, we investigated the antiglycation effect of TBE,23 a highly safe herbal medicine. TBE lowered AGE (Figure 2), thereby indicating that it exerts an antiglycation effect in the retina of type 2 diabetes, which is similar to previous findings of TBE.16,17,24 However, the mechanism of activity of TBE and its efficacy on the diabetic retina are unknown. We subsequently investigated autophagy that occurs actively in the retina to elucidate these processes. Autophagy is involved in the maintenance of the visual cycle, which breaks down and reuses used photoreceptors. Age-related macular degeneration is prevented by processing accumulated lipofuscin and other substances,25,26 which has also been reported to be involved in the development of DR.27 In our study, we observed a decrease in LC-3 in the retina of ob/ob mice at sites along the IPL, including the two-layer vascular plexus, and a decrease in LC-3 mRNA expression in retinal qPCR, which was increased by TBE (Figure 3). These results imply that autophagy activity is reduced in the retina of ob/ob mice and that TBE induces autophagy and exerts an antiglycation effect that inhibits AGE accumulation. Takahashi et al similarly reported the regulation of AGE accumulation by autophagy in diabetic proximal tubular cells.28 Our study is the first to demonstrate an antiglycation effect via induction of autophagy by TBE. To further investigate the involvement of TBE in autophagy, we focused on hyperinsulinemia in type 2 diabetic mice.29 As the mechanism by which autophagy is induced, we focused on insulin-dependent AKT signaling, which is activated by hyperinsulinemia,30 and WNK1, which is upregulated by AKT signaling and is reportedly involved in autophagy regulation.31,32 We investigated the expressions of AKT1 and WNK1 using qPCR. The results showed an increase in the expressions of AKT1 and WNK1 in the retina of ob/ob mice and a decrease in the expressions of AKT1 and WNK1 by TBE (Figure 3). Regarding WNK1, Sahashi et al recently reported that urolithin A induces autophagy and exerts anti-tumor effects by regulating WNK1.33 TBE contains high levels of ellagitannins, which are hydrolyzed to produce ellagic acid,23 and the intestinal metabolite of ellagic acid is urolithin.34 The fact that the main component of TBE is closely related to urolithin is important when considering the mechanism of action of TBE. The analyses of LC-3, AKT1, and WNK1 in this study indicate that hyperinsulinemia associated with type 2 diabetes decreases autophagy activity in the retina and that the mechanism may involve insulin-dependent AKT signaling and the consequent enhancement of WNK1. Furthermore, TBE acts in an inhibitory manner on that pathway, suggesting that it induces autophagy. In addition, we also examined GFAP to determine the efficacy of TBE in the early stages of type 2 diabetes with hyperinsulinemia in diabetic retinopathy. Müller cell gliosis, as indicated by GFAP expression, is a sensitive and non-specific response to retinal damage, and even in early diabetic retinopathy, when only minor retinal changes are present, Müller cells significantly increase GFAP expression.35,36 In our study of GFAP, we found that it was increased in the diabetic retina and that TBE reduced GFAP (Figure 4).
These GFAP-related results allude that TBE can potentially alleviate retinal damage caused by diabetes.
The findings of the present study suggested that TBE might induce autophagy in the retina and that the underlying mechanism might involve ANK1 and WNK1 in ob/ob mice. Furthermore, it was observed that inducing autophagy might inhibit AGE production and, thus, alleviate retinal damage (Figure 5).
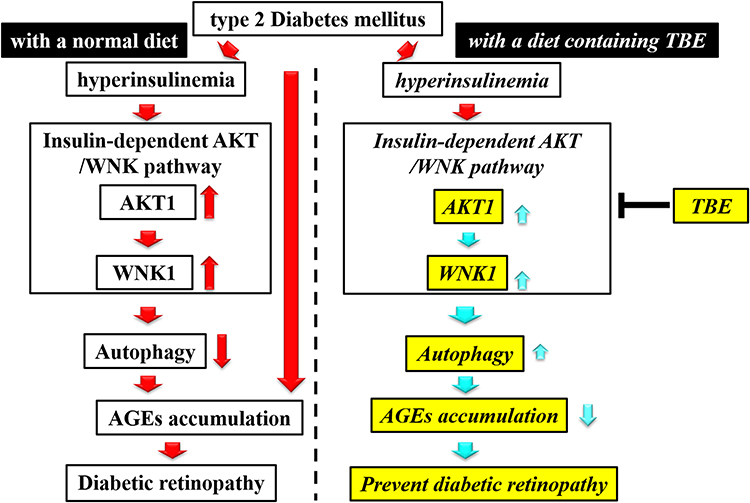 |
Figure 5 Diagram of the mechanism of activity. TBE administration inhibits the activation of AKT1 and WNK1 in the insulin-dependent AKT/WNK pathway and induces autophagy, thereby inhibiting AGE accumulation. As a result, the progression of DR is suppressed. |
Conclusions
In summary, in type 2 diabetes, TBE might have an inhibitory activity on the insulin-dependent AKT/WNK1 pathway, thereby inducing autophagy, promoting antiglycation, and alleviating retinal damage. These findings indicate that TBE is a novel therapeutic target for DR.
Acknowledgments
We thank Crimson Interactive Pvt. Ltd. (Ulatus) – www.ulatus.jp for their assistance in manuscript translation and editing.
Disclosure
The authors declare that there are no conflicts of interest in this work.
References
1. Zhang AMY, Wellberg EA, Kopp JL, Johnson JD. Hyperinsulinemia in obesity, inflammation, and cancer. Diabetes Metab J. 2021;45(3):285–311. doi:10.4093/dmj.2020.0250
2. Kloska SM, Pałczyński K, Marciniak T, et al. Queueing theory model of mTOR complexes’ impact on Akt-mediated adipocytes response to insulin. PLoS One. 2022;17:e0279573. doi:10.1371/journal.pone.0279573
3. Sakai S, Yamamoto T, Takabatake Y, et al. Proximal tubule autophagy differs in type 1 and 2 diabetes. J Am Soc Nephrol. 2019;30:929–945. doi:10.1681/asn.2018100983
4. Cheung N, Mitchell P, Wong TY. Diabetic retinopathy. Lancet. 2010;376:124–136. doi:10.1016/s0140-6736(09)62124-3
5. Feng L, Liang L, Zhang S, Yang J, Yue Y, Zhang X. HMGB1 downregulation in retinal pigment epithelial cells protects against diabetic retinopathy through the autophagy-lysosome pathway. Autophagy. 2022;18:320–339. doi:10.1080/15548627.2021.1926655
6. Okutsu M, Yamada M, Tokizawa K, et al. Regular exercise stimulates endothelium autophagy via IL-1 signaling in ApoE deficient mice. FASEB J. 2021;35:e21698. doi:10.1096/fj.202002790rr
7. Kitts DD. Antioxidant and functional activities of MRPs derived from different sugar–amino acid combinations and reaction conditions. Antioxidants. 2021;10:1840. doi:10.3390/antiox10111840
8. Tian Z, Chen S, Shi Y, Wang P, Wu Y, Li G. Dietary advanced glycation end products (dAGEs): an insight between modern diet and health. Food Chem. 2023;415:135735. doi:10.1016/j.foodchem.2023.135735
9. Zawada A, Machowiak A, Rychter AM, et al. Accumulation of advanced glycation end-products in the body and dietary habits. Nutrients. 2022;14:3982. doi:10.3390/nu14193982
10. Song Q, Liu J, Dong L, Wang X, Zhang X. Novel advances in inhibiting advanced glycation end product formation using natural compounds. Biomed Pharmacother. 2021;140:111750. doi:10.1016/j.biopha.2021.111750
11. Tao D, Ni N, Zhang T, et al. Accumulation of advanced glycation end products potentiate human retinal capillary endothelial cells mediated diabetic retinopathy. Mol Med Rep. 2019;20:3719–3727. doi:10.3892/mmr.2019.10590
12. Oshitari T. Advanced glycation end-products and diabetic neuropathy of the retina. Int J Mol Sci. 2023;24:2927. doi:10.3390/ijms24032927
13. Adkar P, Dongare A, Ambavade S, Bhaskar VH. Trapa bispinosa Roxb.: a review on nutritional and pharmacological aspects. Adv Pharmacol Sci. 2014;2014:959830. doi:10.1155/2014/959830
14. Ban I, Sugawa H, Nagai R. Protein modification with ribose generates Nδ-(5-hydro-5-methyl-4-imidazolone-2-yl)-ornithine. Int J Mol Sci. 2022;23:1224. doi:10.3390/ijms23031224
15. Hussain T, Subaiea GM, Firdous H. Hepatoprotective evaluation of trapa natans against drug-induced hepatotoxicity of antitubercular agents in rats. Pharmacogn Mag. 2018;14:180–185.
16. Takeshita S, Yagi M, Uemura T, Yamada M, Yonei Y. Peel extract of water chestnut (Trapa bispinosa Roxb.) inhibits glycation, degrades α-dicarbonyl compound, and breaks advanced glycation end product crosslinks. Glycative Stress Res. 2015;2:72–79. doi:10.24659/gsr.2.2_072
17. Uemura T, Takeshita S, Yamada M. The effectiveness of the peel extract of water chestnut (Trapa bispinosa Roxb.) in an α-crystallin glycation model with glyoxal. Glycative Stress Res. 2017;4:104–108. doi:10.24659/gsr.4.2_104
18. Kinoshita S, Sugawa H, Nanri T, et al. Trapa bispinosa Roxb. and lutein ameliorate cataract in type 1 diabetic rats. J Clin Biochem Nutr. 2020;66:8–14. doi:10.3164/jcbn.19-34
19. Hanaguri J, Yokota H, Kushiyama A, et al. Beneficial effect of long-term administration of supplement with Trapa bispinosa Roxb. and lutein on retinal neurovascular coupling in type 2 diabetic mice. Front Physiol. 2022;13:788034. doi:10.3389/fphys.2022.788034
20. Ambikar DB, Harle UN, Khandare RA, Bore VV, Vyawahare NS. Neuroprotective effect of hydroalcoholic extract of dried fruits of Trapa bispinosa Roxb on lipofuscinogenesis and fluorescence product in brain of D-galactose induced ageing accelerated mice. Indian J Exp Biol. 2010;48:378–382. PMID: 20726336.
21. Kang Q, Dai H, Jiang S, Yu L. Advanced glycation end products in diabetic retinopathy and phytochemical therapy. Front Nutr. 2022;9:1037186. doi:10.3389/fnut.2022.1037186
22. Yamamoto Y, Kato I, Doi T, et al. Development and prevention of advanced diabetic nephropathy in RAGE-overexpressing mice. J Clin Invest. 2001;108:261–268. doi:10.1172/jci11771
23. Jinno M, Nagai R, Takeuchi M, et al. Trapa bispinosa Roxb. extract lowers advanced glycation end-products and increases live births in older patients with assisted reproductive technology: a randomized controlled trial. Reprod Biol Endocrinol. 2021;19:149. doi:10.1186/s12958-021-00832-y
24. Iwaoka Y, Suzuki S, Kato N, et al. Characterization and identification of bioactive polyphenols in the Trapa bispinosa Roxb. pericarp extract. Molecules. 2021;26:5802.
25. Kim JY, Zhao H, Martinez J, et al. Noncanonical autophagy promotes the visual cycle. Cell. 2013;154:365–376. doi:10.1016/j.cell.2013.06.012
26. Sethna S, Scott PA, Giese APJ, et al. CIB2 regulates mTORC1 signaling and is essential for autophagy and visual function. Nat Commun. 2021;23:3906. doi:10.1038/s41467-021-24056-1
27. Chen Q, Tang L, Xin G, et al. Oxidative stress mediated by lipid metabolism contributes to high glucose-induced senescence in retinal pigment epithelium. Free Radic Biol Med. 2019;130:48–58. doi:10.1016/j.freeradbiomed.2018.10.419
28. Takahashi A, Takabatake Y, Kimura T, et al. Autophagy inhibits the accumulation of advanced glycation end products by promoting lysosomal biogenesis and function in the kidney proximal tubules. Diabetes. 2017;66:1359–1372. doi:10.2337/db16-0397
29. Lindström P. The physiology of obese-hyperglycemic mice [ob/ob mice]. Sci World J. 2007;7:666–685. doi:10.1100/tsw.2007.117
30. Saltiel AR. Insulin signaling in health and disease. J Clin Invest. 2021;131:131. doi:10.1172/jci142241
31. An SW, Cha SK, Yoon J, Chang S, Ross EM, Huang CL. WNK1 promotes PIP2 synthesis to coordinate growth factor and GPCR-Gq signaling. Curr Biol. 2011;21:1979–1987. doi:10.1016/j.cub.2011.11.002
32. Gallolu Kankanamalage S, Lee AY, Wichaidit C, et al. WNK1 is an unexpected autophagy inhibitor. Autophagy. 2017;13:969–970. doi:10.1080/15548627.2017.1286431
33. Sahashi H, Kato A, Yoshida M, et al. Urolithin A targets the AKT/WNK1 axis to induce autophagy and exert anti-tumor effects in cholangiocarcinoma. Front Oncol. 2022;12:963314. doi:10.3389/fonc.2022.963314
34. Gaya P, Peirotén Á, Medina M, Álvarez I, Landete JM. Bifidobacterium pseudocatenulatum INIA P815: the first bacterium able to produce urolithins A and B from ellagic acid. J Funct Foods. 2018;45:95–99. doi:10.1016/j.jff.2018.03.040
35. Lewis GP, Fisher SK. Up-regulation of glial fibrillary acidic protein in response to retinal injury: its potential role in glial remodeling and a comparison to vimentin expression. Int Rev Cytol. 2003;230:263–290. doi:10.1016/S0074-7696(03)30005-1
36. Azrad-Leibovich T, Zahavi A, Gohas MF, et al. Characterization of diabetic retinopathy in two mouse models and response to a single injection of anti-vascular endothelial growth factor. Int J Mol Sci. 2022;24:324. doi:10.3390/ijms24010324
 © 2023 The Author(s). This work is published and licensed by Dove Medical Press Limited. The
full terms of this license are available at https://www.dovepress.com/terms
and incorporate the Creative Commons Attribution
- Non Commercial (unported, 3.0) License.
By accessing the work you hereby accept the Terms. Non-commercial uses of the work are permitted
without any further permission from Dove Medical Press Limited, provided the work is properly
attributed. For permission for commercial use of this work, please see paragraphs 4.2 and 5 of our Terms.
© 2023 The Author(s). This work is published and licensed by Dove Medical Press Limited. The
full terms of this license are available at https://www.dovepress.com/terms
and incorporate the Creative Commons Attribution
- Non Commercial (unported, 3.0) License.
By accessing the work you hereby accept the Terms. Non-commercial uses of the work are permitted
without any further permission from Dove Medical Press Limited, provided the work is properly
attributed. For permission for commercial use of this work, please see paragraphs 4.2 and 5 of our Terms.
Recommended articles
Comparison of Clinical Profiles, Demographics, and Surgical Outcomes of 25-Gauge Vitrectomy for Proliferative Diabetic Retinopathy in Young Adults with Type 1 or Type 2 Diabetes
Zhang M, Zhang J, Xu G, Ruan L, Huang X
Diabetes, Metabolic Syndrome and Obesity 2023, 16:1967-1975
Published Date: 29 June 2023
Exploring the Correlation Between the Systemic Immune Inflammation Index (SII), Systemic Inflammatory Response Index (SIRI), and Type 2 Diabetic Retinopathy

Wang S, Pan X, Jia B, Chen S
Diabetes, Metabolic Syndrome and Obesity 2023, 16:3827-3836
Published Date: 24 November 2023
Correlation Between Glycolipid Metabolism Levels and Diabetic Retinopathy in Patients with Type 2 Diabetes Mellitus
Wang S, Pan X, Zhang M, Chen S
Diabetes, Metabolic Syndrome and Obesity 2024, 17:1-9
Published Date: 3 January 2024
Construction of a Nomogram-Based Prediction Model for the Risk of Diabetic Kidney Disease in T2DM
Wang X, Liu X, Zhao J, Chen M, Wang L
Diabetes, Metabolic Syndrome and Obesity 2024, 17:215-225
Published Date: 12 January 2024
Liraglutide Improves Nonalcoholic Fatty Liver Disease in Diabetic Mice by Activating Autophagy Through AMPK/mTOR Signaling Pathway
Liao Z, Huang L, Chen J, Chen T, Kong D, Wei Q, Chen Q, Deng B, Li Y, Zhong S, Huang Z
Diabetes, Metabolic Syndrome and Obesity 2024, 17:575-584
Published Date: 5 February 2024