Back to Journals » Journal of Inflammation Research » Volume 14
Transthyretin and Receptor for Advanced Glycation End Product’s Differential Levels Associated with the Pathogenesis of Rheumatoid Arthritis
Authors Monu ![]() , Agnihotri P, Saquib M, Sarkar A, Chakraborty D, Kumar U
, Agnihotri P, Saquib M, Sarkar A, Chakraborty D, Kumar U ![]() , Biswas S
, Biswas S ![]()
Received 9 July 2021
Accepted for publication 9 September 2021
Published 28 October 2021 Volume 2021:14 Pages 5581—5596
DOI https://doi.org/10.2147/JIR.S327736
Checked for plagiarism Yes
Review by Single anonymous peer review
Peer reviewer comments 2
Editor who approved publication: Professor Ning Quan
Monu,1,2 Prachi Agnihotri,1 Mohd Saquib,1,2 Ashish Sarkar,1,2 Debolina Chakraborty,1,2 Uma Kumar,3 Sagarika Biswas1
1Council of Scientific and Industrial Research -Institute of Genomics & Integrative Biology (CSIR–IGIB), Delhi, 110007, India; 2Academy of Scientific and Innovative Research (AcSIR), Ghaziabad, 201002, India; 3All India Institute of Medical Sciences, New Delhi, 110029, India
Correspondence: Sagarika Biswas
Integrative and Functional Biology Department CSIR- Institute of Genomics & Integrative Biology, Mall Road, Delhi, 110 007, India
Tel +91 11 27667602
Fax +91-11-27667471
; +9818004740
Email [email protected]
Objective: Rheumatoid arthritis (RA) is a chronic autoimmune, inflammatory joint disease. The identification of multifaceted etiological changes at the protein level in RA remains an important need. We aimed to identify differential proteins (DPs) and gene profiles to uncover inflammatory indicators and their association to RA pathogenesis.
Methods: 2-DE and SWATH-MS were used to identify DPs in RA and healthy control plasma. Fluorescence phenylboronate gel electrophoresis (Flu-PAGE) with mass spectrometry was used for protein glycation in RA plasma. Disease specificity of identified DPs was confirmed by ELISA and Western blot analysis. The gene expressions of selected DPs were evaluated by qRT-PCR in PBMCs of RA, systemic lupus erythematosus (SLE), spondyloarthritis (SpA), and osteoarthritis (OA). The functional implication of glycated protein was determined by in- silico and validated by in vitro analysis in fibroblast-like synoviocytes.
Results: A total of 150 DPs (127 increased and 23 decreased) were identified by 2-DE and SWATH-MS analysis in RA plasma compared to healthy control (HC). Nine proteins were identified as glycated by Flu-PAGE LC-MS/MS. Transthyretin (TTR), serotransferrin, and apolipoprotein-A1 (Apo-A1) were found to be differential and glycated. ELISA and Western blot results revealed the disease-specific increased expression of TTR and RAGE in RA. The qRT-PCR results signify the aberrant gene expression of TTR and RAGE, found to be associated with RA when compared with SLE, SpA, and OA PBMCs. TTR-RAGE interactions were predicted by in-silico and validated by in-vitro analysis using RA-FLS. The increased levels of pro-inflammatory cytokines IL-6, IL-1β, TNF-α, and differently expressed TTR and RAGE were confirmed in fibroblast-like synoviocytes under inflammatory conditions.
Conclusion: Our findings showed that the level of TTR was increased in RA plasma, along with an altered glycation rate. TTR and RAGE aberrant gene expression in PBMCs are the key events associated with RA, and TNF-α activates the NF-KB pathways and promote TTR and RAGE differential expressions that may have pathogenic/inflammatory significance.
Keywords: rheumatoid arthritis, differential proteins, post-translational modifications, transthyretin, advanced glycation end products, receptor for advanced glycation end products
Introduction
Rheumatoid arthritis (RA) is a chronic, systemic, autoimmune, synovium and joint inflammatory disease that affects 0.5–1.0% population.1,2 Gender, genetics, epigenetics, diet, and lifestyle have all been reported as risk factors for RA. The current diagnostic methods include Disease Activity Score-28 (DAS-28) to measure the level of disease activity, C-reactive protein (CRP), erythrocyte sedimentation rate (ESR) as an inflammatory marker and biochemical assays including rheumatoid factors (RF), and anti-cyclic citrullinated peptide antibodies (ACPAs) that has been complimented as immunological markers.3 Identifying numerous etiological events, such as post-translational modifications (PTMs), has been demonstrated to have an essential role in the development of RA.4 The involvement of both enzymatic and/or non-enzymatic process in the development of chronic inflammatory diseases has been considered earlier.5
Glycation is a non-enzymatic process that involves reducing sugar molecules, forming a covalent bond with lysine, arginine, or N-terminal amino acid residues of proteins, followed by the Maillard reaction to develop an intermediates-Schiff base, eventually resulting into a stable advanced glycation end products (AGEs) formation.6 AGEs formation has been primarily reported with an increase in the incidence of Alzheimer’s Disease (AD), and their subsequent toxic effect had also been investigated in other diseases like atherosclerosis, and inflammatory kidney disease.7 AGE is a non-degradable product that has been demonstrated to have a variety of roles in disease, including a neo-autoantigen in RA.8 Several glycated proteins such as albumin,9 fibrinogen,10 and globulins11 have been reported to decrease drug-binding ability in plasma, platelet activation, free radical production, impaired fibrinolysis, immune system modulation and inflammation generation.12
Traditionally, mass spectrometry (MS) has been used to identify glycation and differential protein expression to establish a risk indicator for disease development.13 Proteomic approaches such as sequential window acquisition of all theoretical mass spectra (SWATH-MS) and two-dimensional gel electrophoresis (2-DE) have been previously ascribed for protein identification and to identify the role of differential proteins (DPs) expression in RA pathogenesis.14 Furthermore, fluorescent phenylboronate gel electrophoresis (Flu-PAGE) combined with liquid chromatography-tandem mass spectrometry (LC-MS/MS) was used to investigate a glycation event in RA plasma.15 Our aim was to identify DPs expression, glycation, and their gene profiling to uncover inflammatory indicators associated with RA pathogenesis.
To get further understanding, it is necessary to comprehend the differential expression of glycated proteins that bind to the receptor for advanced glycation end-products (RAGE) and induce inflammatory responses in RA-FLS16 as well as their pathophysiologic response in circulating blood, which may be critical in RA. The molecular mechanism behind cellular dysfunction in RA in response to glycation and differential (elevated/reduced) protein and gene expression is not fully understood.
In the current study, we found increased plasma protein levels of transthyretin (TTR), serotransferrin, and apolipoprotein-A1 (Apo-A1) in RA with differential glycation rates identified by SWATH-MS and Flu-PAGE LC-MS. Aberrant gene expression of TTR and RAGE, as well as increased level in plasma, were observed to be correlated with RA, as validated by ELISA and western. These findings suggest that TTR may be a disease-specific target of RAGE in PBMCs and RA-FLS with a pathogenic/inflammatory mechanism significance, supporting the idea that variable protein abundance could serve as a therapeutic target underlying RA pathogenesis.
Materials and Methods
Clinical Samples
A total of 180 blood samples were collected from patients diagnosed with RA (n=100), OA (n=24), systemic lupus erythematosus (SLE) (n=3), spondylarthritis (SpA) (n=3), and healthy control (HC) (n=50) from the Department of Rheumatology, All India Institute of Medical Sciences (AIIMS), New Delhi, India, who met the revised 2010 American College of Rheumatology (ACR) and European League Against Rheumatism (EULAR) Rheumatism diagnosis criteria.17 The medical history of each patient was collected (Supplementary Table 1). The study protocol was ethically approved by AIIMS, New Delhi, India (Reg No IEC-22/04.01.2019, RP-35/2019) and the Council of Scientific and Industrial Research (CSIR)-Institute of Genomics and Integrative Biology, Delhi, India (CSIR-IGIB/IHEC/2017-18 Dt. 08.02.2018). Signed consent was obtained from each participant.
Blood Samples Processing
Blood samples were collected by venipuncture into EDTA-coated vacutainer tubes (BD, NJ, USA), handled, and transported at 4°C. Samples were centrifuged at 1300 g for 15 minutes at 4°C, immediately processed, aliquoted, and kept at −80°C for further analysis.18
Two-Dimensional Gel Electrophoresis (2-DE) and SWATH-MS Acquisition Using High-Resolution Mass Spectrometry
Three different pooled plasma (RA, and HC n=5, each) of same age and sex were used; the 2-DE gel was run using plasma protein sample (70 µg). Silver-stained spots were digested overnight at 37°C with trypsin (Promega, USA) and analyzed18,19 (details in supplementary). For SWATH-MS analysis, pooled plasma samples were taken from each group of RA and HC (n=10 each); albumin was depleted (Pierce™ Albumin depletion kit), protein concentration were estimated by Bicinchoninic Acid (BCA) and digested with trypsin. Proteins identified with two or more unique peptides with an unused score ≥2.0 were considered for SWATH-MS quantitative acquisition14 (see details in supplementary).
Flu-PAGE-LC-MS/MS Labelling, Detection, and Identification of Glycated Proteins
For glycation Flu-PAGE analysis15,20 albumin-depleted pooled plasma RA and HC (n=3) samples were run in 12% SDS-PAGE, silver-stained, scanned, trypsin digested and detected by LC-MS/MS. Two or more distinct peptides with an unused score of ≥2.0 and 1% false discovery rate (FDR) were considered for protein identification and quantitation (details in supplementary methods).
2-DE and Flu-PAGE Gel Image Analysis
PD-Quest Image Lab Software (Bio-Rad) was used for 2-DE gels for distinct spot analysis.18,19 A threshold level for DPs (high/low) level was established as a 1.5-fold increase/decrease in spot/band intensity between groups. The intensity of fluorescence for glycated proteins was compared between groups (HC and RA) by normalizing the total intensities of the bands obtained from silver-stained Flu-PAGE gel.15
Enzyme-Linked Immunosorbent Assay Analysis (ELISA)
We followed indirect and quantitative ELISA method.18,19 Plasma samples from RA, OA and HC were coated into 96-well microtiter plates (Nunc, USA), incubated with anti-TTR, anti-Serotransferrin, anti-ApoA1 and anti-RAGE antibodies (Santa Cruz, USA) separately followed by HRP-conjugated secondary antibody (Jackson, USA) incubation. For quantitative ELISA, commercialized available ELISA kit for TTR (Elabscience, E-EL-H2342), RAGE (Ray-Bio, ELH-RAGE) and ACPAs (EH4137) were used according to manufactures guideline (see details in supplementary methods).
Western Blot Analysis
For Western blot analysis, pooled plasma protein (20μg) from RA and HC (n=10 each) were used by the standard Western blot procedure described previously.19 The anti-TTR and anti-RAGE (1:2000) diluted antibodies (Santa Cruz, USA) were used and densitometry values of Western blot analysis were normalized with total protein as a loading control and experiments were repeated at least thrice.
PBMCs Isolation, Total RNA Extraction and Quantitative Real-Time PCR (qRT-PCR)
Total RNA was extracted from PBMCs of HC (n=10), RA (n=10), SLE, SpA, and OA (n=3)19 using Tri-Xtract Reagent (G-biosciences), and cDNA was synthesized using the cDNA Synthesis Kit (G-biosciences) according to the manufacturer’s procedure. The level of mRNA expression was determined using the Roche Light Cycler® 480 Instrument-II real-time PCR detection system. The results were normalised to the constitutive gene Glyceraldehyde 3-phosphate dehydrogenase (GAPDH) as an internal reference and quantitatively evaluated using 2−ΔΔCTformula. Supplementary Table 10 shows the human-specific primer sequences (Supplementary Table 10).
TTR-RAGE Molecular Docking, Validation, and Comparative In- Silico Analysis
A molecular docking study was done to better understand the functional significance of TTR and RAGE. The protein setup and ligand preparation were done (details in supplementary methods). TTR protein active site prediction was performed using computed atlas of surface topography of proteins (CASTp) at http://cast.engr.uic.edu, and for docking, the Autodock vina software was used for TTR-RAGE interaction21,22 (details in supplementary methods).
During the early stages of the advanced glycation end products (AGEs) or glycated proteins production, glucose or other reducing sugars react with the free amino group of the targeted protein to create an unstable Schiff-based complex.20,23 Many intermediate, reactive dicarbonyl molecules such as methylglyoxal (MGO), glyoxal, and glucose combine to create an irreversible molecule known as AGEs during protein glycation.8 As a result, glucose, MGO, and TTR complex were employed as ligands to better understand the glycation process. The interaction between TTR and RAGE, Hex-molecular docking server was analysed and evaluated using PYMOL in comparative research. As a positive control, S100P, a well-known human glycated protein (PDB ID: 1J55), was used for RAGE-S100P interaction analysis.22
Isolation of RA Fibroblast-Like Synoviocytes (RA-FLS), In- vitro Culture, and Co-Immunoprecipitation (IP)
RA-FLS was isolated from RA synovium and grown in the same manner as previously described,24 70–80% confluence of the cells were used for experimentations. Primary RA-FLS cells were lysed and incubated separately with agarose resin and primary antibodies anti-TTR, anti-Spectrin-II, and anti-IgG for CO-IP. The complex of amino-linked proteins was eluted, separated by SDS-PAGE gel, incubated with an anti-RAGE antibody, followed by HRP-conjugated secondary antibody, and analysed25 (details in supplementary methods).
Human Synovial Fibroblast SW982 Cell Culture and Total RNA Extraction and Quantitative Real-Time PCR (qRT-PCR)
The human synovial fibroblast SW982 cell line was obtained from The National Centre for Cell Science Pune, India, and maintained in the same manner as previously described.24 Total RNA of SW982 cells and qRT-PCR was performed as described above.19
Statistical Analysis
Graph Pad Prism (version 9.0) (https://www.graphpad.com/) was employed for statistical data analysis. To compare data from two or more groups, the Student’s t-test, including Mann–Whitney U and analysis of variance (ANOVA), and Chi-square for categorical data were employed, p<0.05 was considered significant. For correlation analysis, if both factors showed a normal distribution, the correlation was analysed using the Pearson correlation test; otherwise, it was analysed using the Spearman correlation test. Each experiment was repeated at least three times to determine the individual protein abundance of each group.
Results
Identification and Quantification of Differential Proteins in RA Plasma Using Gel-Based (2-DE) and Non-Gel-Based (SWATH-MS) Proteomic Techniques
Eleven distinct spots were obtained from 2-DE gels (Figure 1A), and eight proteins were successfully identified by LC-MS/MS in RA plasma, few of which had the same accession number, indicating that they were isoforms (Supplementary Table 2), 142 DPs (119 increased and 23 decreased) (Figure 1B), identified using SWATH-MS analysis (Supplementary Table 3). Three proteins, TTR 1.64-fold, serotransferrin 1.50-fold, and Apo-A1 1.42-fold, were found to be differentially expressed. For DPs between groups, a threshold of 1.5-fold change (high/low), an unused score ≥2.0 and a p-value of 0.05 were considered significant.
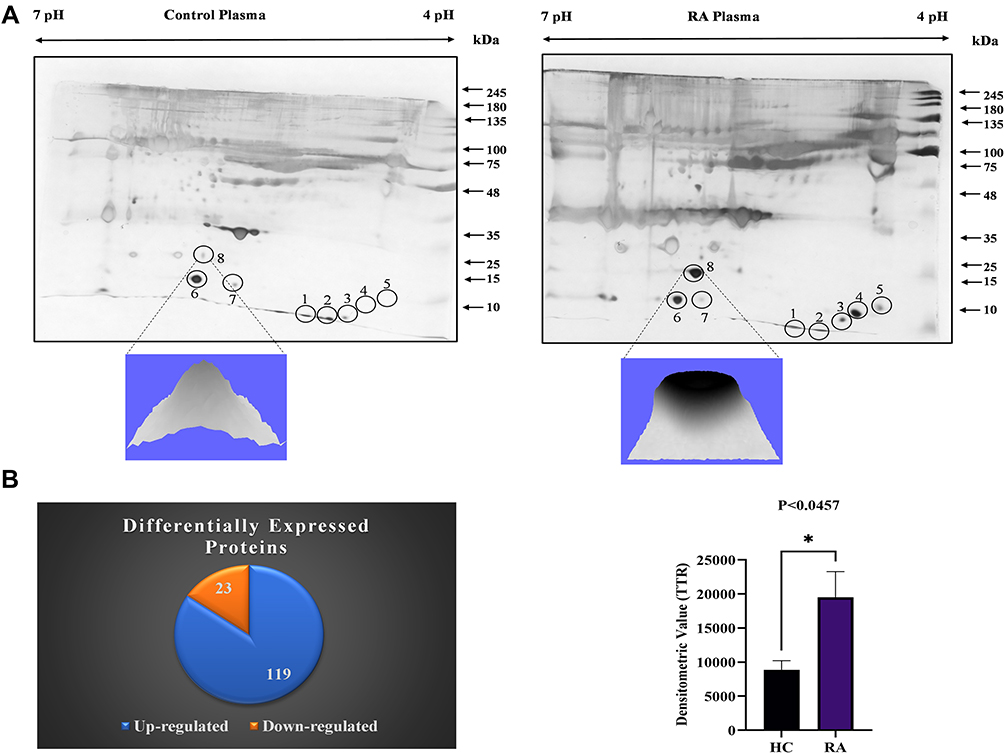 |
Figure 1 Differential proteins identification in RA plasma: (A) 2-DE analysis of DPs from RA plasma: A representative 2-DE gel image of RA and HC plasma pooled samples (n=5, each) demonstrates differential protein spot intensities. Spots no. 8 (TTR) densitometry analysis shows a substantial increase in RA compared to HC, p<0.0457. The experiment was repeated three times to assess the repeatability of individual spots between groups, the significance level indicate *p < 0.05. (B) SWATH-MS analysis of RA plasma: The distribution of differentially expressed proteins (upregulated and downregulated) in RA plasma is depicted in a pie chart. Abbreviations: TTR, transthyretin; HC, healthy control. |
Identification of Glycated Proteins by Flu-PAGE and LC-MS/MS
For detection of glycated proteins, plasma (RA and HC) was incubated with fluorescein-boronic acid (FB), the RA plasma samples showed a level of fluorescence when compared to the fluorescein control and HC lane. Nine protein bands were visualized on Flu-PAGE (Figure 2A) and glycated proteins were identified by LC-MS/MS (Supplementary Table 4). Among the identified glycated proteins, densitometric comparison between the RA and HC lanes (Figure 2B) revealed variable glycation rates of TTR (7.78%), serotransferrin (5.37%), and Apo-A1 (3.38%). TTR was found to have a higher glycation rate, therefore chosen for further study.
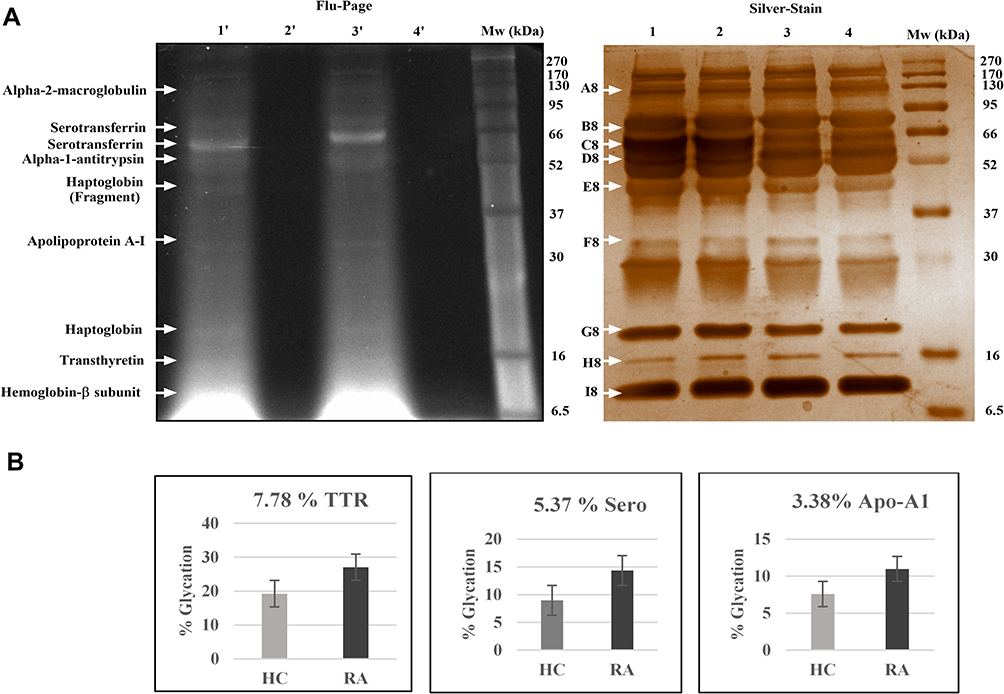 |
Figure 2 Glycated proteins detection and Identification in RA plasma: (A) Flu-PAGE analysis for detecting glycated proteins in RA plasma: The representative gel image displays glycated proteins identified by Flu-PAGE using RA and HC albumin-depleted plasma pools (n=3 each). Left panel; The representative gel image of Flu-PAGE shows glycated proteins detected in Lane-1ʹ (RA plasma incubated with fluorescein-boronic acid-treated RA-FB), Lane 2ʹ (RA plasma incubated with fluorescein control), Lane-3ʹ (healthy plasma incubated with fluorescein-boronic acid-treated HC-FB) and Lane 4ʹ (healthy plasma incubated with fluorescein control). The arrows indicate glycated proteins fluorescent bands (A8-I8) identified by mass spectrometry (MS). Right panel; shows the silver-stained proteins band of the same Flu-PAGE and loading pattern of the samples (Lanes 1–4). (B) The Flu-PAGE % glycation variation in RA and HC plasma: The fluorescent band intensities represent the percentage (%) of glycation in pooled RA and HC plasma (n=3, each) of the Flu-PAGE obtained from (A). TTR (7.78%), serotransferrin (5.37%), and apolipoprotein-A1 (3.38%) are all determined by the percentage glycation difference measured using three replicates, and the data were analysed by normalizing fluorescence intensities of Flu-PAGE to total intensities of silver-stained same gel by densitometry analysis Image Lab (Bio-Rad). Abbreviations: RA, rheumatoid arthritis; HC, healthy control; TTR, transthyretin; ApoA-1, apolipoprotein-A1. |
ELISA and Western Blot Analysis for Validation of Differential Protein in RA
ELISA was performed to confirm the differential expression of TTR, serotransferrin, and Apo-A1, in RA, OA, and HC (n=24, each) plasma. TTR was found to be significantly increased (p<0.0039) in RA (Figure 3A), serotransferrin was found to be significantly decreased (p<0.0001) in OA (Figure 3B), and Apo-A1 was found to be non-significantly decreased (p<0.273) in RA (Figure 3C). Similarly, RAGE was investigated and shown to be significantly higher (p<0.0017) in RA than in OA (Figure 3D). These findings suggest that higher levels of TTR and RAGE are more closely associated with RA. Furthermore, TTR and RAGE plasma levels were compared to the important clinical parameters, such as ACPA and the DAS28-ESR score, that are used to diagnose RA. As a result, we observed that higher TTR plasma levels showed a significant correlation with ACPA and DAS28-ESR score, with r = 0.1380, (p<0.0199) goodness of fit (Figure 3E) and r = 0.4021, (p<0.0135) (Figure 3F), respectively. However, an increased level of RAGE was not observed to be significantly correlated with DAS28-ESR, as demonstrated by r = 0.3072 and p<0.1443 (Figure 3G) in RA patients.
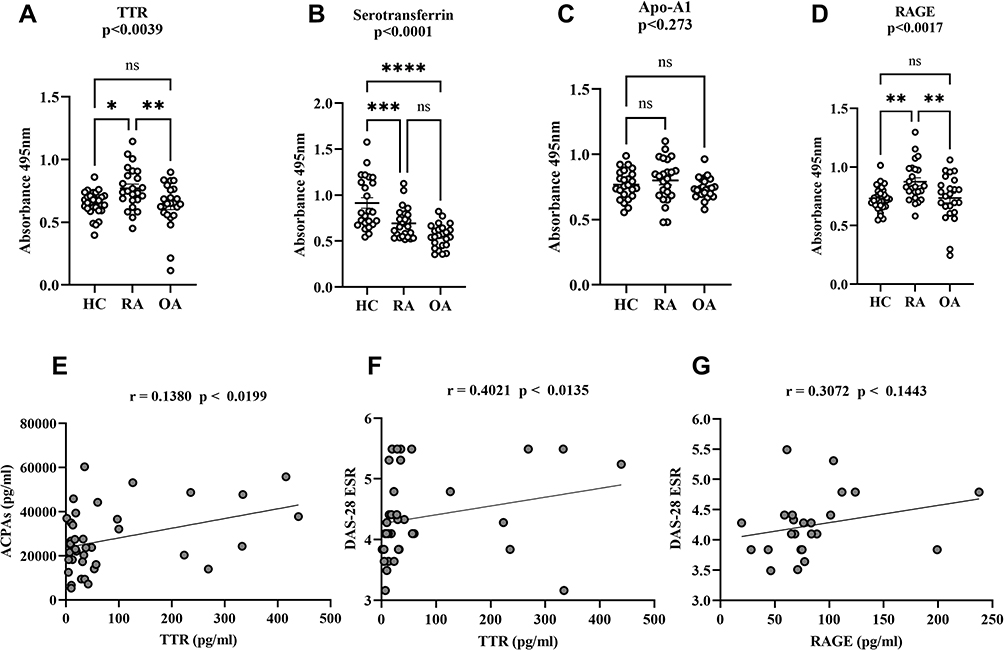 |
Figure 3 Dot plots of differential proteins TTR, serotransferrin, apolipoprotein-A and RAGE specificity in RA validation by ELISA. The multiple comparisons between groups indicate the significant and non-significant difference between HC vs RA and OA. The plasma TTR (A), serotransferrin (B) Apo-A1 (C) and RAGE (D) were compared between RA, HC and OA (n=24, each), dot plot indicates individual protein abundance of each group found higher of TTR with statistical significance p<0.0039, and significant lower serotransferrin level p<0.0001, lower non-significant Apo-A1 level p<0.234 compared between groups respectively. Similarly, RAGE result statistical significance between groups indicates significant higher-level p<0.0017 between HC and RA, whereas, no significance (ns) level in comparison between HC and OA. The data are presented mean ± SEM. The Student’s t-test was used for statistical significance difference calculation between groups. (E) Correlation analysis between ACPA and TTR: The ACPA concentration shows a positive correlation with TTR with r = 0.1380 indicates the goodness of fit with p<0.0199. (F and G) The graph shows a positive correlation between TTR and DAS-28 (ESR) score with r = 0.4021 and p<0.0135, whereas, RAGE shows non-significant (ns) correlation with r = 0.3072 and p<0.1443 in RA patients. The significance level indicates *p < 0.05; **< 0.01, **< 0.001 and ****< 0.0001. Abbreviations: ns, non-significant; RA, rheumatoid arthritis; HC, healthy control; OA, osteoarthritis; TTR, transthyretin; ApoA-1, apolipoprotein-A1; RAGE, receptors for advanced glycation end products; ACPA, anti-cyclic citrullinated peptide antibody; DAS-28 ESR, Disease Activity Score 28-ESR. |
Since TTR and RAGE were shown to be particularly elevated in RA, individual abundance was evaluated in a larger number of RA (n=100) and HC (n=50) patients, resulting in a consistent increased significant level of p<0.0001 and p<0.0003, respectively (Figure 4A and B). The estimation plots displayed 95% confidence interval for the difference between means of HC and RA for TTR (0.06358–0.1745), and RAGE (0.04118–0.1338) and area under curve (AUC) reflecting 0.732 for TTR and 0.703 for RAGE (Figure 4C and D). Quantitatively, the average increased concentration of TTR in RA plasma was 80.94598 pg/mL compared to the HC concentration of 18.37638 pg/mL, and the average increased concentration of RAGE in RA was 89.45769 pg/mL compared to the HC 59.25481 pg/mL (Figure 4E). A correlation analysis was measured, r = 0.1865 indicates the goodness of fit with p<0.0276 and suggested TTR concentration positively correlated with RAGE (Figure 4F).
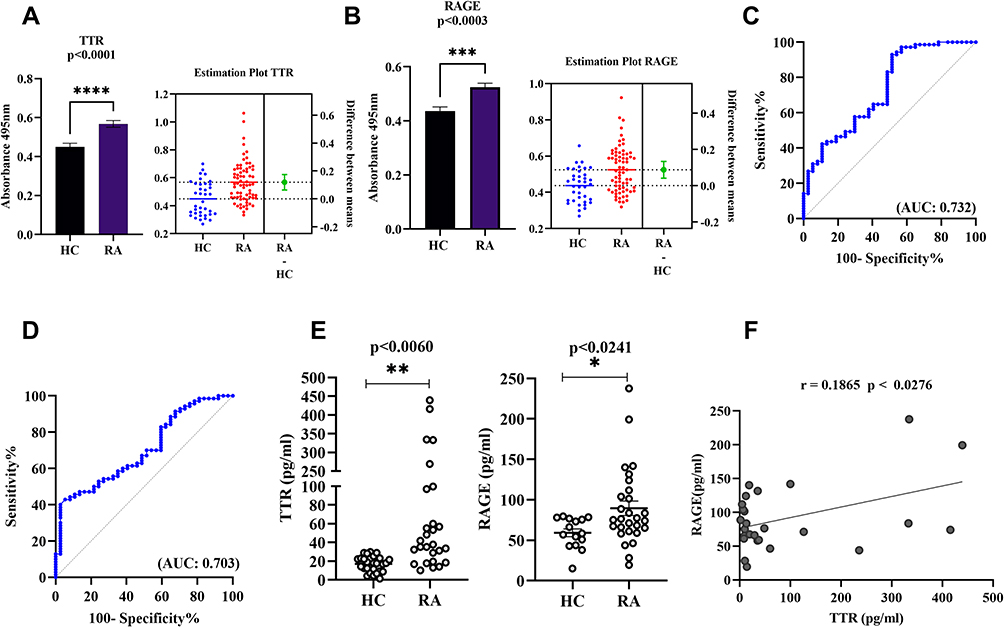 |
Figure 4 Dot plots and ROC curve of differential TTR and RAGE validation by ELISA. (A and B) The plasma TTR and RAGE protein were compared between RA (n=100) and HC (n=50). (C and D) The ROC plots indicating individual protein abundance of each group with (AUC: 0.732) for TTR, and (AUC: 0.703) for RAGE, respectively. Independent t-tests were used to determine statistical significance p<0.0001 for TTR and p<0.0003 for RAGE. (E) The dot plot indicates significant p<0.0060 with increased average levels 80.94598 pg/mL in RA than HC 18.37638 pg/mL for TTR and RAGE p<0.0241 significant increased 89.45769 pg/mL in RA compared to the 59.25481pg/mL HC concentration determined by commercially available ELISA kit in HC and RA (n=24 each). For details in the estimation plots the green dot shows the difference between the two means (HC and RA), and the green line shows the 95% confidence interval of that difference. The data are presented as mean ±SEM. (F) Correlation analysis between TTR and RAGE: The graph illustrates correlation analysis measured by Pearson with r = 0.1865 indicates the goodness of fit with p<0.0276 and RAGE concentration was found to be positively correlated with TTR using ELISA between groups. The significance level indicates *p < 0.05; **< 0.01, ***< 0.001 and ****< 0.0001. Abbreviations: RA, rheumatoid arthritis; HC, healthy control; TTR, transthyretin; RAGE, receptors for advanced glycation end products; ROC, receiver operating characteristic; AUC, area under curve. |
Furthermore, Western blot analysis for validation was used to identify the abundance of TTR and RAGE in pooled plasma of RA and HC (n=10 each) of the same age and sex. The densitometric analysis indicated a significant difference in TTR (p<0.021) (Figure 5A) and RAGE (p<0.040) (Figure 5B), with fold changes of 1.7-fold and 1.4-fold, respectively, in comparison to HC after normalization with total protein as a loading control.
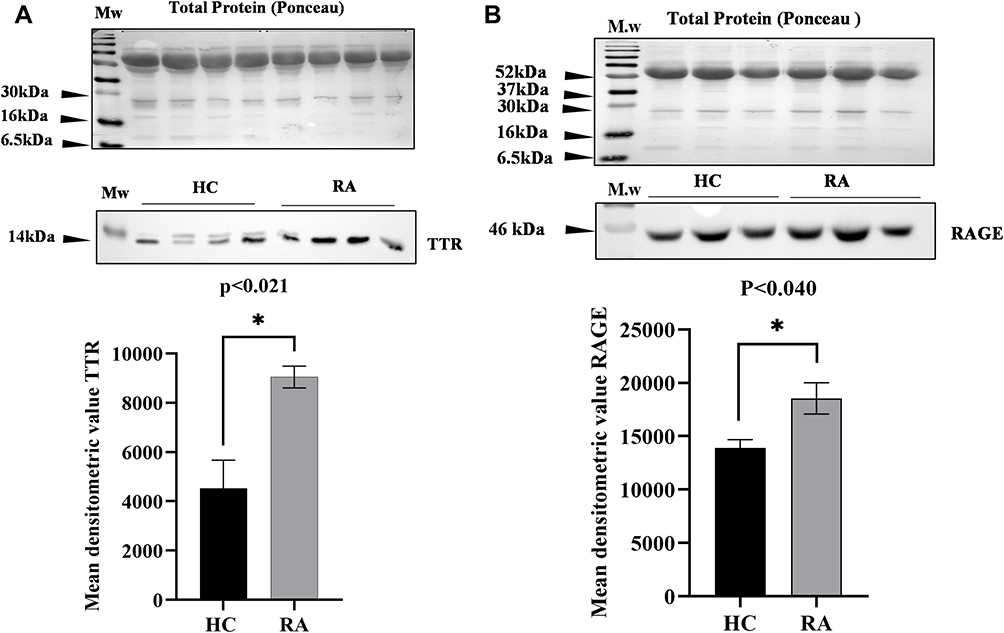 |
Figure 5 Western blot analysis of differential proteins (DPs) TTR and RAGE in RA: Western blot analysis representing the differential level of TTR and RAGE in RA (n=10) pooled plasma compared to healthy controls (n=10). (A) The mean densitometric analysis of TTR shows a significant p<0.021 increased level with fold change 1.7-fold in RA compared to HC. (B) The mean densitometric analysis of RAGE shows a significantly increased level with fold change 1.4-fold in RA compared to HC, normalizing with total protein as a loading control. Data represent mean ± SEM, and statistical significance is determined by Student’s t-test, the significance level indicate *p < 0.05. Abbreviations: RA, rheumatoid arthritis; HC, healthy control; TTR, transthyretin; RAGE, receptors for advanced glycation end products. |
qRT-PCR Analysis of Differential Gene Expression in Peripheral Blood Mononuclear cells of RA
The differential gene expression of TTR, RAGE and pro-inflammatory cytokines (IL-6 and TNF-α) was analysed in PBMCs of RA and HC (n=10 each) through qRT-PCR. The estimated results showed a significantly increased gene expression of TTR (p<0.0048), RAGE (p<0.0003), IL-6 (p<0.0004), TNF-α (p<0.0018) in PBMCs of RA compared to HC (Figure 6A–D).
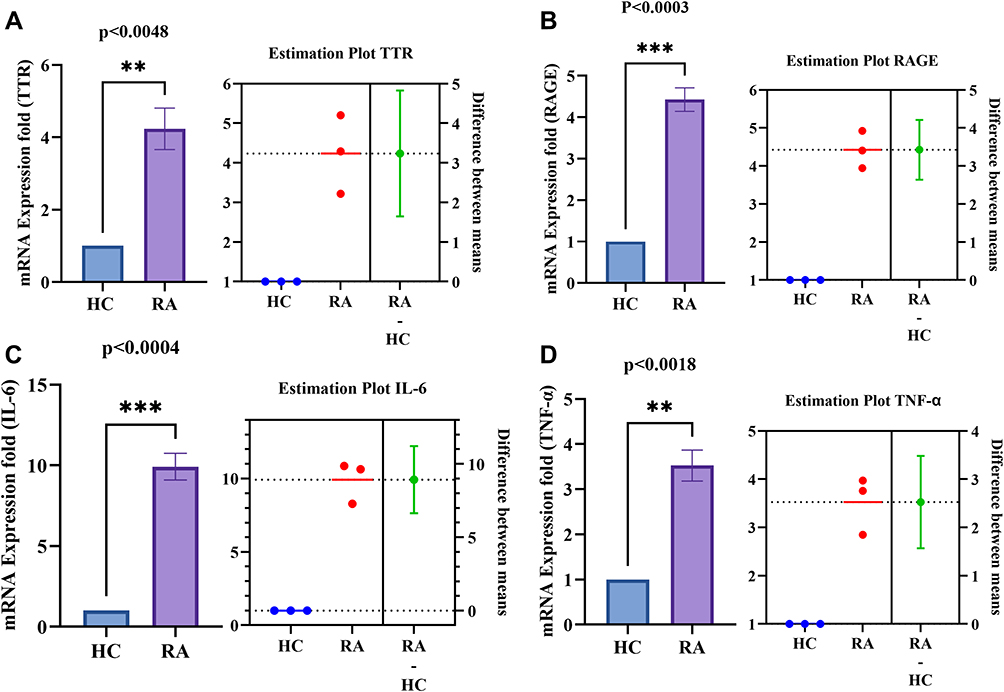 |
Figure 6 PBMCs differential gene expression of TTR, RAGE and pro-inflammatory cytokines (IL-6 and TNF-α) between HC and RA (n=10 each). (A and B) Increased significant gene expression of TTR (p<0.0048) and RAGE (p<0.0003) respectively in RA PBMCs compared to HC. (C and D) Increased significant gene expression of IL-6 (p<0.0004) and TNF-α (p<0.0018) respectively in RA PBMCs compared to HC. The estimation plot of each indicates the difference between the mean of HC and RA. The green dot shows the difference between the two means (HC, and RA), and the green line shows the 95% confidence interval of that difference. The data are presented as mean ±SEM. The significance level indicates **< 0.01, and ***< 0.001. Abbreviations: RA, rheumatoid arthritis; HC, healthy control; OA, osteoarthritis; TTR, transthyretin; RAGE, receptors for advanced glycation end products. |
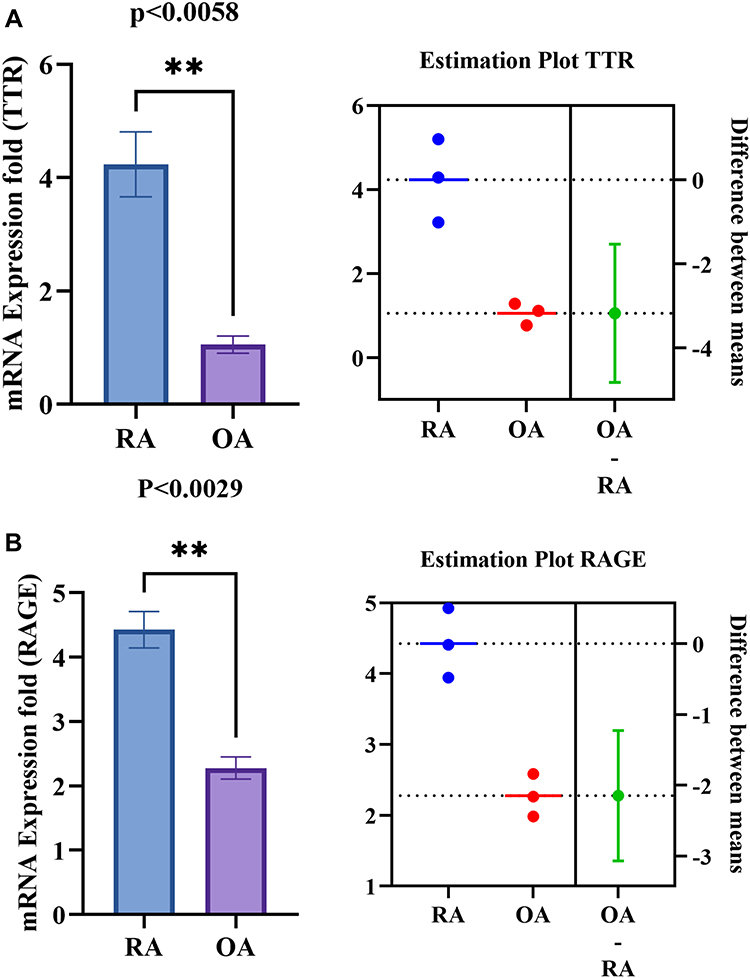 |
Figure 7 PBMC’s differential gene expression of TTR, RAGE between RA and OA. (A and B) Shows the increased significant gene expression of TTR (p<0.0058) and RAGE (p<0.0029) respectively in RA PBMCs compared to OA. The estimation plot of each groups shows a green dot indicates a difference between the mean of RA and OA, the green line represents the 95% confidence interval of that difference. The data are presented as mean ±SEM. The significance level indicates **< 0.01. Abbreviations: RA, rheumatoid arthritis; HC, healthy control; OA, osteoarthritis; TTR, transthyretin; RAGE, receptors for advanced glycation end products. |
Further, the disease-specific gene expression of TTR and RAGE were also estimated in PBMCs of other autoimmune (SLE) and inflammatory (SpA and OA) diseases (n=3). Results signified that the increased expression of TTR, and RAGE are more specific to RA compared to OA (Figure 7A and B), SLE and SpA (Figure 8A and B). However, RAGE gene expression (p<0.0002) was observed to be elevated in all RA, SLE, and SpA cases, along with a consequent raised production of IL-6 and TNF-α (Figure 8B–D) in inflammatory conditions. The increased gene expression of TTR and RAGE in RA PBMCs confirmed a major role in inflammation.
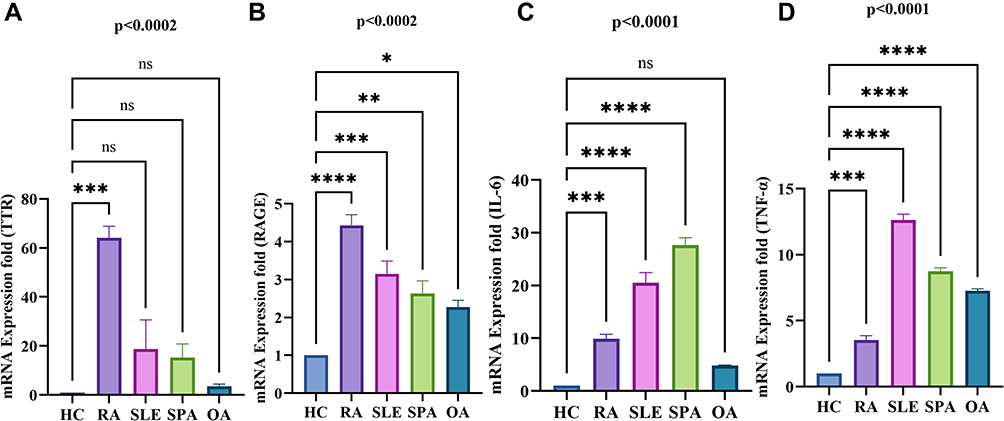 |
Figure 8 Differential gene expression analysis of TTR, RAGE, pro-inflammatory cytokine (IL-6, TNF-α) in RA, SLE, and SPA PBMCs by qRT-PCR. The altered gene expression was analyzed in RA (n=10), SLE, SpA (n=3 each) PBMCs compared to HC (n=10). (A) Shows the gene expression of TTR significantly increased in RA compared to SLE, SPA and OA PBMCs compared to HC, respectively. (B) Shows the increased gene expression of RAGE significantly in RA compared to SLE, SpA and OA. (C and D) Shows the increased pro-inflammatory cytokines IL-6 significantly in RA, SLE, SpA but non-significant (ns) in OA compare to HC respectively whereas TNF-α was found to be significantly increased in all compare to HC PBMCs. The data were normalized with β–actin and/or GAPDH as an internal loading control. Values are presented as the mean ± SEM. The significance level indicates *p < 0.05; **< 0.01, ***< 0.001 and ****< 0.0001, ns = non-significant, analyzed by one-way ANOVA. Abbreviations: RA, rheumatoid arthritis; HC, healthy control; OA, osteoarthritis; SLE, systemic lupus erythematosus; SpA, spondylarthritis; TTR, transthyretin; RAGE, receptors for advanced glycation end products. |
TNF-α Induced Pro-Inflammatory Cytokines, NF-κB Pathway Activation, and TTR and RAGE Differential Gene Expression in RA Synoviocytes
The mRNA expression of human synovial fibroblast (SW982) cells were induced with TNF-α (10ng/mL) for 1hr compared to the controls (un-induced) evaluated by qRT-PCR analysis. The changed fold induction of pro-inflammatory cytokines (IL-6 and IL-1β), NF-κβ pathway subunits (RelA or p65, p50, TNF-α), TTR and RAGE mRNA expression finding suggested the influential role of TNF-α on differential expression. The qRT-PCR results revealed a significant increased expression of IL-6 (p<0.0094) (Figure 9A), IL-1β (p<0.0001) (Figure 9B), p50 (p<0.0001) (Figure 9C), RelA or p65 (p<0.0010) (Figure 9D), and TNF-α (p<0.0004) (Figure 9E) under TNF-α stimulatory conditions.
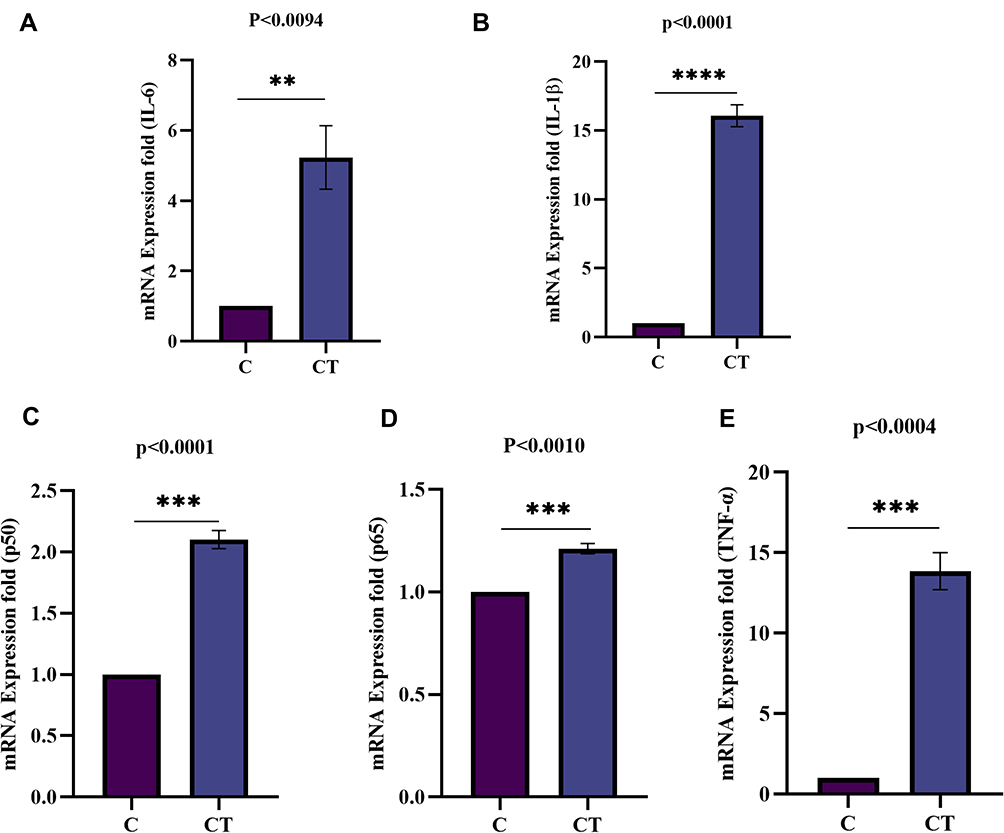 |
Figure 9 Fold induction of pro-inflammatory cytokines (IL-6, and IL-1β) and NF-κB pathway subunits (Rel A/p65, p50, and TNF-α) mRNA expression analysis in synovial cells by qRT-PCR. The mRNA expression in SW982 cells induced with TNF-α (10ng/mL) for 1hr compared to control (un-induced). (A) Fold induction of IL-6 gene expression indicates a significantly increased level (p<0.0094). (B) The fold induction of IL-1β gene expression indicates a significant (p<0.0001) increased mRNA level. (C) Fold induction of p50gene expression shows a significant (p<0.0001) up-regulation. (D) Fold induction of Rel A/p65 gene expression was observed significant (p<0.0010) on TNF-α induction. (E) Fold induction of TNF-α gene expression shows a significant (p<0.0004) higher level. The data was normalized with GAPDH as an internal loading control and the values are presented as the mean ± SEM (n = 3). The significance level indicates **< 0.01, ***< 0.001 and ****< 0.0001 versus normal control or TNF-α induction analysed by Student’s t-test. Abbreviations: C, control; CT, TNF-α induced. |
Furthermore, TTR and RAGE differential mRNA expression upon TNF-α exposure was observed. Subsequently, the fold induction of TTR and RAGE resulted in a significantly increased expression p<0.028 (Figure 10A) and p<0.0011 (Figure 10B) respectively, compared to control (un-induced) cells. The data was provided after being normalized with GAPDH as a loading control, and the values are presented as mean ± SEM (n = 3) between normal control versus TNF-α induced/stimulated cells. This finding suggests that TNF-α stimulation tempted inflammatory pathway activation, TTR and RAGE altered/differential gene expression in synoviocytes and confirmed a crucial role in inflammation associated with RA.
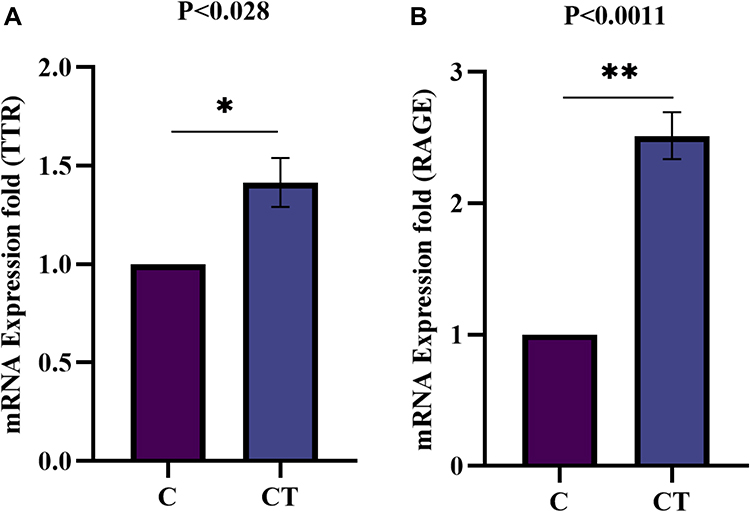 |
Figure 10 Fold induction of TTR and RAGE mRNA expression analysis in synovial cells by qRT-PCR. The mRNA expression in SW982 cells induced with TNF-α (10ng/mL) for 1hr, compared to control un-induced (A) Fold induction of TTR gene expression significantly (p<0.028) increased upon TNF-α induction compare to control. (B). Similarly, fold induction of RAGE gene expression indicates a significant (p<0.0011) increased level in TNF-α induced synoviocytes. The data normalized with GAPDH as an internal loading control and the values presented the mean ± SEM (n = 3). The significance level indicates *p < 0.05; **< 0.01 versus normal control and TNF-α treatment analysed by Student’s t-test. Abbreviations: C, control; CT, TNF-α induced. |
Molecular Docking and Interaction Analysis of TTR-RAGE
During inflammatory circumstances, AGEs/glycated proteins are frequently deposited extra-cellularly [32]. We identified the molecular interaction active site of TTR for this demonstration, and the combined structure of TTR, glucose and MGO (Supplementary Figure 2) was assessed to simulate glycated protein synthesis (Supplementary Figure 3A and B) (Supplementary Tables 5–7). RAGE docking simulations with TTR-glucose-MGO complex predicted the interaction (Supplementary Figure 3A and B) and binding pocket site (Supplementary Tables 8 and 9), the interaction of RAGE with S100P has been known, hence was used as a reference control (Supplementary Figure 3C). This comparison study supported and validated our in-silico findings (details in supplementary results).
TTR-RAGE Co-Immunoprecipitation (CO-IP) in RA-FLS Analysis
The Co-IP results revealed the TTR-RAGE interaction when cell lysate of RA-FLS was immunoprecipitated (IP) with anti-TTR antibody and immunoblotted with anti-RAGE antibody. The presence of RAGE band intensity showed TTR interaction, shown in the IP-TTR lane vs the respective controls used for analysis (Supplementary Figure 3D).
Discussion
RA is a global health problem characterized by autoimmunity and chronic inflammation in the synovial membrane and joints.1 Currently, RF and ACPA autoantibodies have been used to distinguish RA; however, there are ambiguity and clinical difficulties due to co-occurrence of other diseases.26 It is well recognized that significant cross-reactivity by autoantigens in the presence of other inflammatory mediators is critical and can mislead the diagnosis.4,5 Several studies have highlighted the importance of differential proteins (DPs) in RA pathogenesis and disease-specific conditions.27 Later in RA, a milieu of AGE proteins has been associated with autoimmune progression, with their propensity to aggregate, leading to the production of neo-autoantigens28,29.
Glycation and the accumulation of glycated plasma proteins such as serum albumin (Supplementary Figure S1), hemoglobin, and immunoglobulins have all been extensively described to play an essential role in the development of a variety of diseases including diabetes, cardiovascular disease, autoimmune disease, cancer, and Alzheimer’s, and it has become one of the clinically significant PTM ascribed to detecting disease progression.28–30 This study aimed to identify DPs in RA and their pathogenic link to comprehend disease pathogenesis by analyzing non-enzymatic post-translation modification such as glycation.
We identified 150 DPs using two proteomics methods, 2-DE (gel-based), and SWATH-MS (non-gel-based) (Supplementary Tables 2 and 3) and three proteins (TTR, serotransferrin and Apo-A1) were selected based on previously unknown pathophysiological relationships and their disease-specific expression levels in RA. Using Flu-PAGE LC-MS/MS, nine proteins were confirmed as glycated (Supplementary Table 4) in RA plasma. The identified glycated proteins, haptoglobin, alpha-1-antitrypsin, and alpha-2-macroglobulin, are profoundly positively correlated with glycated hemoglobin (HbA1c), providing high accuracy for type-2 diabetes mellitus (T2DM) diagnosis.31 Other glycated proteins, Apo-A132 and serotransferrin,33 were reported to have variable abundance under hyperglycemic, oxidative, and inflammatory circumstances, resulting in deficiencies in key processes involved in anti-apoptotic, antioxidant, and iron metabolism.9,32,33
In this study, DPs including TTR, serotransferrin, and Apo-A1 were identified by both gel-based and non-gel-based techniques. Our findings showed that TTR, serotransferrin, and Apo-A1 has not been previously studied or reported in terms of glycation and their parallel differential expression in RA. Flu-PAGE resulted in a different percentage of glycation rate of TTR (7.78%), serotransferrin (5.37%), and Apo-A1 (3.38%) in RA plasma. We deduced that a small percentage of a protein’s glycation is significant and may cause inflammation when expressed abnormally. Hence, the screened proteins, TTR, serotransferrin, and Apo-A1, were validated by ELISA in RA and OA plasma (Figure 3A–C). TTR was analysed to be more specific and have a higher glycation rate compared to serotransferrin and Apo-A1, indicating the significance of TTR in RA. Furthermore, TTR plasma levels were also compared to the important clinical parameters such as ACPA and the DAS28-ESR score, which are used to diagnose RA.3 Moreover, the correlation analysis revealed that increased TTR plasma levels had a positive and significant association with ACPA and DAS28-ESR score (Figure 3E and F), suggesting that TTR has a pathogenic significance in RA.
TTR is a prealbumin secretory protein that binds and transports retinol and thyroxin (T4) to mediate normal biological activity,34 but its differential expression and correlation with disease progression have been discovered in a variety of diseases, including familial amyloidotic polyneuropathy (FAP),35 carotid of atherosclerotic tissues,36 Alzheimer disease,7 and coronary artery disease (CAD).19 Moreover, TTR autoantibodies against modified TTR have previously been discovered in the synovial fluid of individuals with juvenile idiopathic arthritis (JIA).37 But the likely pathogenic mechanism which aid in varied expressions, glycation influence of TTR that introduces inflammation in RA remain unknown.
Since it has been reported that glycation leads to AGEs development that acts as a ligand for the receptor of advanced glycation end-products (RAGE) involved in inflammatory signaling cascade activation,8,16 it leads to RAGE up-regulation as well as inflammation increment in endothelial cells.16 However, the exact role or function of highly expressed proteins in RA pathophysiology remains poorly defined. RAGE is a well-known transmembrane receptor expressed in normal concentration by neuronal, endothelial cells, smooth muscle, monocytes, and macrophage cells in healthy conditions, but in disease conditions found to be increased. The increased concentration of glycated protein/legends is suggested to be directly proportional to RAGE expression,8,16 investigated in RA plasma. Interestingly, in the current study, we have found that higher average concentrations of RAGE (89.45769 pg/mL) and TTR (80.94598 pg/mL) in RA plasma are associated (Figure 4E) and showed a significant positive correlation (Figure 4F).
Further, other than blood plasma proteins, peripheral immune cells are key sentinels of host defense. But PBMCs in RA plays an important role in the pathogenesis because these circulatory cells undergo a series of immunophenotypic changes that develop autoimmunity and inflammation.39 Thus, evaluating the targeted genes (TTR and RAGE) or inflammatory gene expression in PBMCs is likely to provide additional information on immune reactivity.
We, therefore, performed qRT-PCR and evaluated the gene expression of TTR and RAGE in PBMCs of RA, SLE, SpA, OA (Figure 8A and B), and the finding revealed a higher expression of TTR and RAGE in RA. The higher expression of both genes indicates an aberrant activation of PBMC, which may point to a direct/indirect link with an inflammatory response, contributing to the onset of RA. In our understanding, increased TTR gene expression in PBMCs can accelerate inflammation, autoantigen, and auto-immunogenic responses in the presence of unknown stimuli, and increased RAGE gene expression amplifies inflammatory pathway activation during the onset and persistence of inflammation.16 Furthermore, the binding of AGEs to RAGE in monocyte-macrophage has been demonstrated to increase the production of TNF-α, IL-1 and IL-6, that are involved in cell proliferation and inflammation.16 TNF-α and IL-6, which play an important role in RA, were shown to be substantially increased in RA PBMCs (Figure 8C and D). However, the fact that RAGE–ligand interactions cause NF-kB-mediated cell activation and increased production of pro-inflammatory cytokines is well known, but how sustained elevated levels of inflammatory stimuli influence RAGE expression is unclear. The long-term interactions with a wide range of inflammatory agents/pro-inflammatory cytokines (TNF-α, IL-6 and IL-17) that occur over the course of the disease may also affect the RAGE expression profile. Moreover, the change in the extracellular and intracellular RAGE ligand level influenced by age, disease severity/inflammatory circumstances, immune-suppressive treatment and/or medication therapy may also influence RAGE expression.38–40
TTR association with inflammation other than its normal physiological role remains a plausible hypothesis. The synovium is the major site of inflammation in RA pathogenesis, and the mechanism by which TNF-α induces alteration of TTR expression associated with inflammation is unknown. As a result, we studied the impact and changed behavior of synoviocytes that are dependent on TNF-α stimulation and found that increased TTR gene expression is linked with synovium inflammation. TNF-α caused inflammatory pathway activation (Figure 9), TTR and RAGE (Figure 10) differential gene expression in synoviocytes may indicate its crucial involvement in RA-associated inflammation.
To fully understand the pathophysiological interaction between TTR and RAGE, in-silico analysis was further carried out to explore RAGE as a potential target of TTR. We speculated that increased TTR levels in the blood might interact with reducing sugars (glucose and derivatives) and MGO, a highly reactive oxidant, interfering/disrupting TTR molecular conformation and therefore being recognized by RAGE receptor.42,43 To demonstrate this, we adopted an in-silico approach to assess the combined structure of TTR, glucose, and MGO to generate simulated glycated TTR interaction with RAGE (Supplementary Tables 5–7). The results showed that simulated glycated TTR showed interaction and formed H-bonds with RAGE with a binding energy of (−815.3 Kcal/mol) (Supplementary Tables 8 and 9), but un-simulated TTR formed no H-bonds, indicating that only glycated TTR interacts with RAGE (Supplementary Figure 3A–C). The TTR-RAGE interaction was verified further by Co-IP in RA-FLS (Supplementary Figure 3D). Both in-silico and in-vitro findings suggested a mechanism in which TTR is encountered by a series of non-enzymatic modifications in blood, modified as a ligand of RAGE, similar to glycation of molecules that ultimately activates RAGE cellular inflammatory signaling pathway.41–43 However, a regulator or stimuli for TTR and RAGE increased expression, which may further influence the inflammatory response in PBMCs, remains to be shown. Future in-vivo and larger cohort studies would be critical because they may provide a basis for assessing the potential target to improve the therapeutic or diagnostic value of TTR and RAGE in RA aetiology.
Conclusion
The proteomics of RA patients showed a marked differences in plasma proteins, and the elevated levels of TTR, RAGE, as well as glycation, are key events linked with RA. The positive correlation between TTR and RAGE in RA plasma may have pathological significance, and increased gene expression, particularly in RA PBMCs, indicating a key role in inflammation, and TTR-RAGE interaction may imply the potential to exert inflammatory signaling cascade activation via RAGE in RA-FLS. Furthermore, TNF-α stimulation is crucial in promoting TTR and RAGE expression dysregulation. Overall, the findings of this study further reinforce the idea of variable protein abundance in RA pathogenesis, which might further present a possible therapeutic target.
Highlights
- Differential protein (DP) identification in RA patients holds potential to aid in disease assessment and development.
- A variable rate of protein glycation, an undesired PTM has pathogenic significance in RA.
- TTR and RAGE levels in plasma and peripheral blood mononuclear cells (PBMCs) are consistently high, linked to inflammation and may serve as risk indicators/pathologic predictors of RA.
Data Sharing Statement
For all original data and protocol, please contact Dr Sagarika Biswas ([email protected]).
Ethics Statement
The study protocol was ethically approved by All India Institute of Medical Sciences (AIIMS), New Delhi, India (Reg No IEC-22/04.01.2019, RP-35/2019) and the Council of Scientific and Industrial Research (CSIR)-Institute of Genomics & Integrative Biology, Delhi, India (CSIR-IGIB/IHEC/2017-18 Dt. 08.02.2018), and the study protocols complied with the Declaration of Helsinki.
Consent for Publication
A signed consent was obtained from each participant and all the participants were informed about the purpose of the study.
Acknowledgment
We acknowledge the Council of Scientific and Industrial Research (CSIR), and Department of Science and Technology (DST), Government of India, New Delhi, India, for providing financial support. Monu, Mohd Saquib and Debolina Chakraborty received fellowship support from CSIR. Prachi Agnihotri and Ashish Sarkar received a fellowship from DST. Mr Rahul Chakraborty for mass spectrometer data acquisition and Mr Pankaj for transportation of biological samples from the hospital to the lab. We also thank CSIR-Institute of Genomics & Integrative Biology, Delhi, India, for research and AcSIR for academic support and the Department of Rheumatology, All India Institute of Medical Sciences (AIIMS), New Delhi, India, for sample arrangement.
Author Contributions
All authors made substantial contributions to data analysis and took part in drafting the article or revising it critically for important intellectual content; agreed to submit to the current journal. Monu and Dr Sagarika Biswas made substantial contributions to conception, design, drafting, acquisition of data, or analysis and interpretation of data. Dr Uma Kumar provided the biologics/sample. Dr Sagarika Biswas agreed to submit to the current journal, gave final approval to the version to be published, and agreed to be accountable for all aspects of the work.
Funding
We would like to acknowledge the Department of Science and Technology (DST), Science & Engineering research board (SERB) New Delhi, India, for financial support.
Disclosure
The authors declare no conflict of interests.
References
1. Smolen JS, Aletaha D, Barton A, et al. Rheumatoid arthritis. Nat Rev Dis Primers. 2018;4:18001.
2. WHO. Rheumatoid arthritis; 2018. Available from: www.who.int/chp/topics/rheumatic/en/.
3. Guo Q, Wang Y, Xu D, Nossent J, Pavlos NJ, Xu J. Rheumatoid arthritis: pathological mechanisms and modern pharmacologic therapies. Bone Res. 2018;6:15.
4. Zavala-Cerna MG, Martínez-García EA, Torres-Bugarín O, et al. The clinical significance of posttranslational modification of autoantigens. Clinic Rev Allerg Immunol. 2014;47:73–90.
5. Santos AL, Lindner AB. Protein posttranslational modifications: roles in aging and age-related disease. Oxid Med Cell Longev. 2017;2017:5716409.
6. Sun F, Suttapitugsakul S, Xiao H, et al. Comprehensive analysis of protein glycation reveals its potential impacts on protein degradation and gene expression in human cells. J Am Soc Mass Spectrom. 2019;30:2480–2490.
7. Li X, Buxbaum JN. Transthyretin and the brain revisited: is a neuronal synthesis of transthyretin protective in Alzheimer’s disease? Mol Neurodegener. 2011;23(6):79.
8. Gkogkolou P, Bohm M. Advanced glycation end products: key players in skin ageing? Dermatoendocrinol. 2012;4(3):259–270.
9. Tarannum A, Arif Z, Alam K, Ahmad S, Uddin M. Nitroxidized-albumin advanced glycation end product and rheumatoid arthritis. Arch Rheumatol. 2019;34(4):461–475.
10. Luzak B, Boncler M, Kosmalski M, et al. Fibrinogen glycation and presence of glucose impair fibrin polymerization-an in vitro study of isolated fibrinogen and plasma from patients with diabetes mellitus. Biomolecules. 2020;10(6):877.
11. Kennedy DM, Skillen AW, Self CH. Glycation of monoclonal antibodies impairs their ability to bind antigen. Clin Exp Immunol. 1994;98:245–251.
12. Singh VP, Bali A, Singh N, Jaggi AS. Advanced glycation end products and diabetic complications. Korean J Physiol Pharmacol. 2014;18(1):1–14.
13. Parker CE, Mocanu V, Mocanu M, et al. Mass Spectrometry for post-translational modifications. In: Alzate O, editor. Neuroproteomics. Boca Raton (FL): CRC Press/Taylor & Francis; 2010.
14. Krasny L, Bland P, Kogata N, et al. SWATH mass spectrometry as a tool for quantitative profiling of the matrisome. J Proteomics. 2018;189:11–22.
15. Pereira Morais MP, Marshall D, Flower SE, et al. Analysis of protein glycation using fluorescent phenyl-boronate gel electrophoresis. Sci Rep. 2013;3(2013):1437.
16. Lee EJ, Park JH. Receptor for Advanced Glycation Endproducts (RAGE), its ligands, and soluble RAGE: potential biomarkers for diagnosis and therapeutic targets for human renal diseases. Genomics Inform. 2013;11(4):224–229.
17. Hua C, Daien CI, Combe B, Landewe R. Diagnosis, prognosis and classification of early arthritis: results of a systematic review informing the 2016 update of the EULAR recommendations for the management of early arthritis. RMD Open. 2017;3(1):e000406.
18. Biswas S, Sharma S, Saroha A, et al. Identification of novel autoantigen in the synovial fluid of rheumatoid arthritis patients using an immune-proteomics approach. PLoS One. 2013;8(2):e56246.
19. Monu, Kharb R, Sharma A, Chaddar MK, et al. Plasma proteome profiling of coronary artery disease patients: downregulation of transthyretin-an important event. Mediators Inflamm. 2020;2020:3429541.
20. Zhang Q, Ames JM, Smith RD, Baynes JW, Metz TO. A perspective on the Maillard reaction and the analysis of protein glycation by mass spectrometry: probing the pathogenesis of the chronic disease. J Proteome Res. 2009;8(2):754–769.
21. Trott O, Olson AJ. AutoDock Vina: improving the speed and accuracy of docking with a new scoring function, efficient optimization, and multithreading. J Comput Chem. 2010;31(2):455–461.
22. Donato R. RAGE: a single receptor for several ligands and different cellular responses: the case of certain S100 proteins. Curr Mol Med. 2007;7:711–724.
23. de Groot L, Hinkema H, Westra J, et al. Advanced glycation endproducts are increased in rheumatoid arthritis patients with controlled disease. Arthritis Res Ther. 2011;13(6):R205.
24. Kong QZ, Guo LT, Yang JN, et al. Anti-inflammatory effects of TRAF-interacting protein in rheumatoid arthritis fibroblast-like synoviocytes. Mediators Inflamm. 2016;2016:3906108.
25. Zhou L, Tang X, Li X, Bai Y, Buxbaum JN, Chen G. Identification of transthyretin as a novel interacting partner for the δ subunit of GABAA receptors. PLoS One. 2019;14(1):e0210094.
26. Tan EM, Smolen JS. Historical observations contributing insights on the etiopathogenesis of rheumatoid arthritis and the role of rheumatoid factor. J Exp Med. 2016;213(10):1937–1950.
27. Zhang R, Yang X, Wang J, et al. Identification of potential biomarkers for differential diagnosis between rheumatoid arthritis and osteoarthritis via integrative genome‑wide gene expression profiling analysis. Mol Med Rep. 2019;19(1):30–40.
28. Ott C, Jacobs K, Haucke E, et al. Role of advanced glycation end products in cellular signalling. Redox Biol. 2014;2:411–429.
29. Ansari NA, Dash D. Amadori glycated proteins: role in the production of autoantibodies in diabetes mellitus and effect of inhibitors on non-enzymatic glycation. Aging Dis. 2013;4:50–56.
30. Arasteh A, Farahi S, Habibi-Rezaei M, Moosavi-Movahedi AA. Glycated albumin: an overview of the in vitro models of an in vivo potential disease marker. J Diabetes Metab Disord. 2014;13:49.
31. Spiller S, Li Y, Blüher M, Welch L, Hoffmann R. Diagnostic accuracy of protein glycation sites in long-term controlled patients with Type 2 diabetes mellitus and their prognostic potential for early diagnosis. Pharmaceuticals (Basel). 2018;11(2):38.
32. Nobecourt E, Tabet F, Lambert G, et al. Nonenzymatic glycation impairs the anti-inflammatory properties of apolipoprotein A-I. Arterioscler Thromb Vasc Biol. 2010;30(4):766–772.
33. Sabitha D, Dawson E, Tiwari S, et al. Study of glycation of transferrin and its effect on biomarkers of iron status in uncontrolled diabetes mellitus patients. J Clin Diagn Res. 2020;14(2020):BC06–BC09.
34. Buxbaum JN, Reixach N. Transthyretin: the servant of many masters. Cell Mol Life Sci. 2009;66(19):3095–3101.
35. Azevedo EP, Guimaraes-Costa AB, Bandeira-Melo C, et al. Inflammatory profiling of patients with familial amyloid polyneuropathy. BMC Neurol. 2019;19(1):146.
36. Bobbert T, Raila J, Schwarz F, et al. Relation between retinol, retinol-binding protein 4, transthyretin and carotid intima-media thickness. Atherosclerosis. 2010;213(2):549–551.
37. Mahmud SA, Binstadt BA. Autoantibodies in the pathogenesis, diagnosis, and prognosis of juvenile idiopathic arthritis. Front Immunol. 2019;9:3168.
38. Pullerits R, Bokarewa M, Dahlberg L, et al. Decreased levels of soluble receptor for advanced glycation end products in patients with rheumatoid arthritis indicating deficient inflammatory control. Arthritis Res Ther. 2005;7(4):R817–R824.
39. Drinda S, Franke S, Eidner T, et al. Decreased RAGE expression in peripheral blood mononuclear cells of patients with rheumatoid arthritis. Clin Exp Rheumatol. 2009;27(3):483–490.
40. Lin J, He Y, Chen J, Zeng Z, Bin Y, Ou Q. Datasets of YY1 expression in rheumatoid arthritis patients. Data Brief. 2016;9:1034–1038.
41. Yoshitomi H. Regulation of immune responses and chronic inflammation by fibroblast-like synoviocytes. Front Immunol. 2019;19(10):1395.
42. Tobon-Velasco JC, Cuevas E, Torres-Ramos MA. Receptor for AGEs (RAGE) as mediator of NF-kB pathway activation in neuroinflammation and oxidative stress. CNS Neurol Disord Drug Targets. 2014;13(9):1615–1626.
43. Huang JS, Guh JY, Chen HC, Hung WC, Lai YH, Chuang LY. Role of receptor for advanced glycation end-product (RAGE) and the JAK/STAT-signaling pathway in AGE-induced collagen production in NRK-49F cells. J Cell Biochem. 2001;81(1):102–113.
 © 2021 The Author(s). This work is published and licensed by Dove Medical Press Limited. The
full terms of this license are available at https://www.dovepress.com/terms
and incorporate the Creative Commons Attribution
- Non Commercial (unported, 3.0) License.
By accessing the work you hereby accept the Terms. Non-commercial uses of the work are permitted
without any further permission from Dove Medical Press Limited, provided the work is properly
attributed. For permission for commercial use of this work, please see paragraphs 4.2 and 5 of our Terms.
© 2021 The Author(s). This work is published and licensed by Dove Medical Press Limited. The
full terms of this license are available at https://www.dovepress.com/terms
and incorporate the Creative Commons Attribution
- Non Commercial (unported, 3.0) License.
By accessing the work you hereby accept the Terms. Non-commercial uses of the work are permitted
without any further permission from Dove Medical Press Limited, provided the work is properly
attributed. For permission for commercial use of this work, please see paragraphs 4.2 and 5 of our Terms.