Back to Journals » Journal of Inflammation Research » Volume 14
Transcriptome Analysis Reveals the Molecular Immunological Characteristics of Lesions in Patients with Halo Nevi When Compared to Stable Vitiligo, Normal Nevocytic Nevi and Cutaneous Melanoma
Authors Pan C, Shang J, Jiang H, Shi Y ![]() , Zhang W, Xiong J, Mei Y
, Zhang W, Xiong J, Mei Y ![]() , Long S, Ge G, Wang Z
, Long S, Ge G, Wang Z ![]() , Wu Z, Wang H
, Wu Z, Wang H ![]() , Wu A
, Wu A
Received 26 May 2021
Accepted for publication 13 August 2021
Published 24 August 2021 Volume 2021:14 Pages 4111—4124
DOI https://doi.org/10.2147/JIR.S321672
Checked for plagiarism Yes
Review by Single anonymous peer review
Peer reviewer comments 2
Editor who approved publication: Professor Ning Quan
Chun Pan,1 Jingzhe Shang,2,3 Haiqin Jiang,1 Ying Shi,1 Wenyue Zhang,1 Jingshu Xiong,1 Youming Mei,1 Siyu Long,1 Gai Ge,1 Zhenzhen Wang,1 Ziwei Wu,1 Hongsheng Wang,1 Aiping Wu2,3
1Institute of Dermatology, Chinese Academy of Medical Sciences and Peking Union Medical College, Nanjing, 210046, People’s Republic of China; 2Institute of Systems Medicine, Chinese Academy of Medical Sciences & Peking Union Medical College, Beijing, 100005, People’s Republic of China; 3Suzhou Institute of Systems Medicine, Suzhou, 215123, People’s Republic of China
Correspondence: Hongsheng Wang
Institute of Dermatology, Chinese Academy of Medical Sciences and Peking Union Medical College, Nanjing, 210046, People’s Republic of China
Email [email protected]
Aiping Wu
Institute of Systems Medicine, Chinese Academy of Medical Sciences & Peking Union Medical College, Beijing, 100005, People’s Republic of China
Email [email protected]
Background: Given their similar appearance and histology, halo nevi (HN) were considered as a type of vitiligo. However, whether HN have stronger immune response than stable vitiligo (VL) remains unclear. In addition, the molecular alterations in HN compared with normal nevocytic nevi (NN) and primary cutaneous melanoma (MM) must be determined. This study aimed to systematically characterize the molecular immunological features of HN.
Methods: Skin samples from patients with HN, VL, NN, and MM were obtained with informed consent. Each of the four groups underwent transcriptome sequencing and data analysis were for pairwise comparison. Quantitative real-time PCR (RT-qPCR) was conducted to confirm the transcriptional expression of some differentially expressed genes (DEGs) that were closely related to immunity.
Results: A total of 441 and 1507 DEGs were found in the HN/NN and HN/MM groups, respectively. Compared with those of VL, HN lesions contained 162 up-regulated DEGs and 12 down-regulated DEGs. Bioinformatics analysis showed that the up-regulated genes in HN were substantially enriched in immune response, immune deficiency, and immune rejection; biological stimulation (virus, bacteria); and proliferation and activation of immune cells. Immune cell composition analysis also confirmed high expression levels of multiple immunocytes in HN.
Conclusion: The molecular immune mechanisms of HN and VL were similar, but the immune activity of HN was stronger than that of VL. Innate and adaptive immunity were involved in the pathogenesis and progression of HN and VL.
Keywords: vitiligo, halo nevi, transcriptome sequencing, differentially expressed genes
Introduction
Halo nevi (HN), also known as Sutton’s nevi, are clinically characterized by benign nevocytic nevi surrounded by round or oval depigmentation plaques and form halos.1–3 The occurrence of multiple HN can be regarded as a marker to represent cellular autoimmunity to nested melanocytes and could imply an increased risk of VL in patients, especially those with family history. Therefore, the occurrence of HN is believed to be a strong predictor of the passage to mixed VL.4,5 Although the pathogenesis of HN and VL is associated with CD8+ T cells, the specific mechanisms involved are unclear, and the relationship between HN and VL remains controversial at this time.3,6,7 HN were considered as a type of VL because of their similar histology and the high frequency in patients with generalized VL.8 Recent studies focusing on molecular protein expression and HLA genotyping proposed that HN and VL are distinct diseases.3,6,7,9
Patients with melanoma (MM) may also experience epidermal depigmentation.10 Studies reported that patients with vitiligo have a reduced risk for MM.11,12 Whether spontaneous or caused by new treatment, this condition is a good prognostic signal for patients with MM.13,14 The clinical manifestation of depigmentation and histopathological features are difficult to differentiate from those of VL.15 The pathogenesis of depigmentation in patients with MM is similar to that in patients with VL. MM cells share several antigens with normal melanocytes, including tyrosinase TRP-1, TRP-2, gp100, and MART-1.16 Serum antibodies from patients with VL can destroy melanocytes and MM cells in vitro because of the same autoantibodies against tyrosinase, TRP-1, and TRP-2 in MM and VL.17 Besides, autoreactive CD8+ T cells can attack melanocytes by recognizing melanocyte specific antigens and induce apoptosis of melanocytes.18
Although CD8+ T cells play a vital role in the pathogenesis of HN and VL or the immunity of MM (Figure 1), the specific molecular characteristics between HN and stable VL remain unclear. In addition, the structural or molecular abnormalities present in HN but not in NN and MM must be determined. In this study, transcriptome analysis was performed to compare the gene expression profiles of HN, stable VL, NN, and MM. The results may uncover additional clues to pathogenesis of HN and provide novel insights into the future development of therapies of VL and MM.
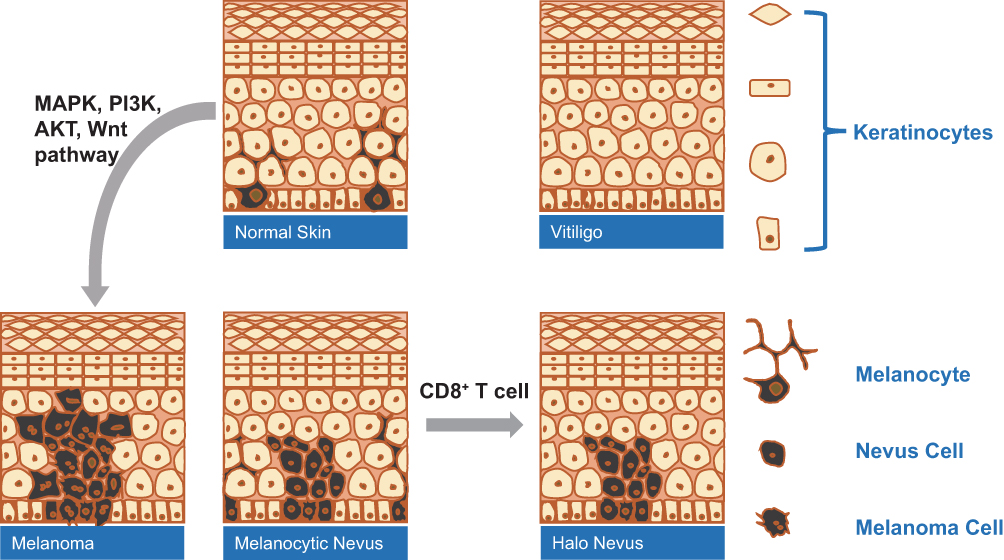 |
Figure 1 The role of CD8+T cells in the pathogenesis of VL-, HN- and MM-associated hypopigmentation. |
Materials and Methods
Patients and Samples
Skin samples were obtained from four patients with HN, five patients with stable VL, five patients with NN, and four patients with primary cutaneous MM in the Institute of Dermatology, Chinese Academy of Medical Sciences (Table 1). All skin samples were obtained from lesional skin. The diagnosis of VL and HN was based on acquired skin depigmentation with typical symmetrical distribution of characteristic locations. Wood’s lamp was used to help establish the diagnosis. All enrolled patients with VL were diagnosed with stable VL, that depigmentation patchy did not expand and no new white patchy occurred for at least 6 months prior to sample collection, while HN patients with new lesions were selected. The diagnosis of NN and primary cutaneous MM was based on clinical and histopathological features. All participants signed written informed consent forms. This study was reviewed and approved by the ethics committee of the Institute of Dermatology, Chinese Academy of Medical Sciences and Peking Union Medical College.
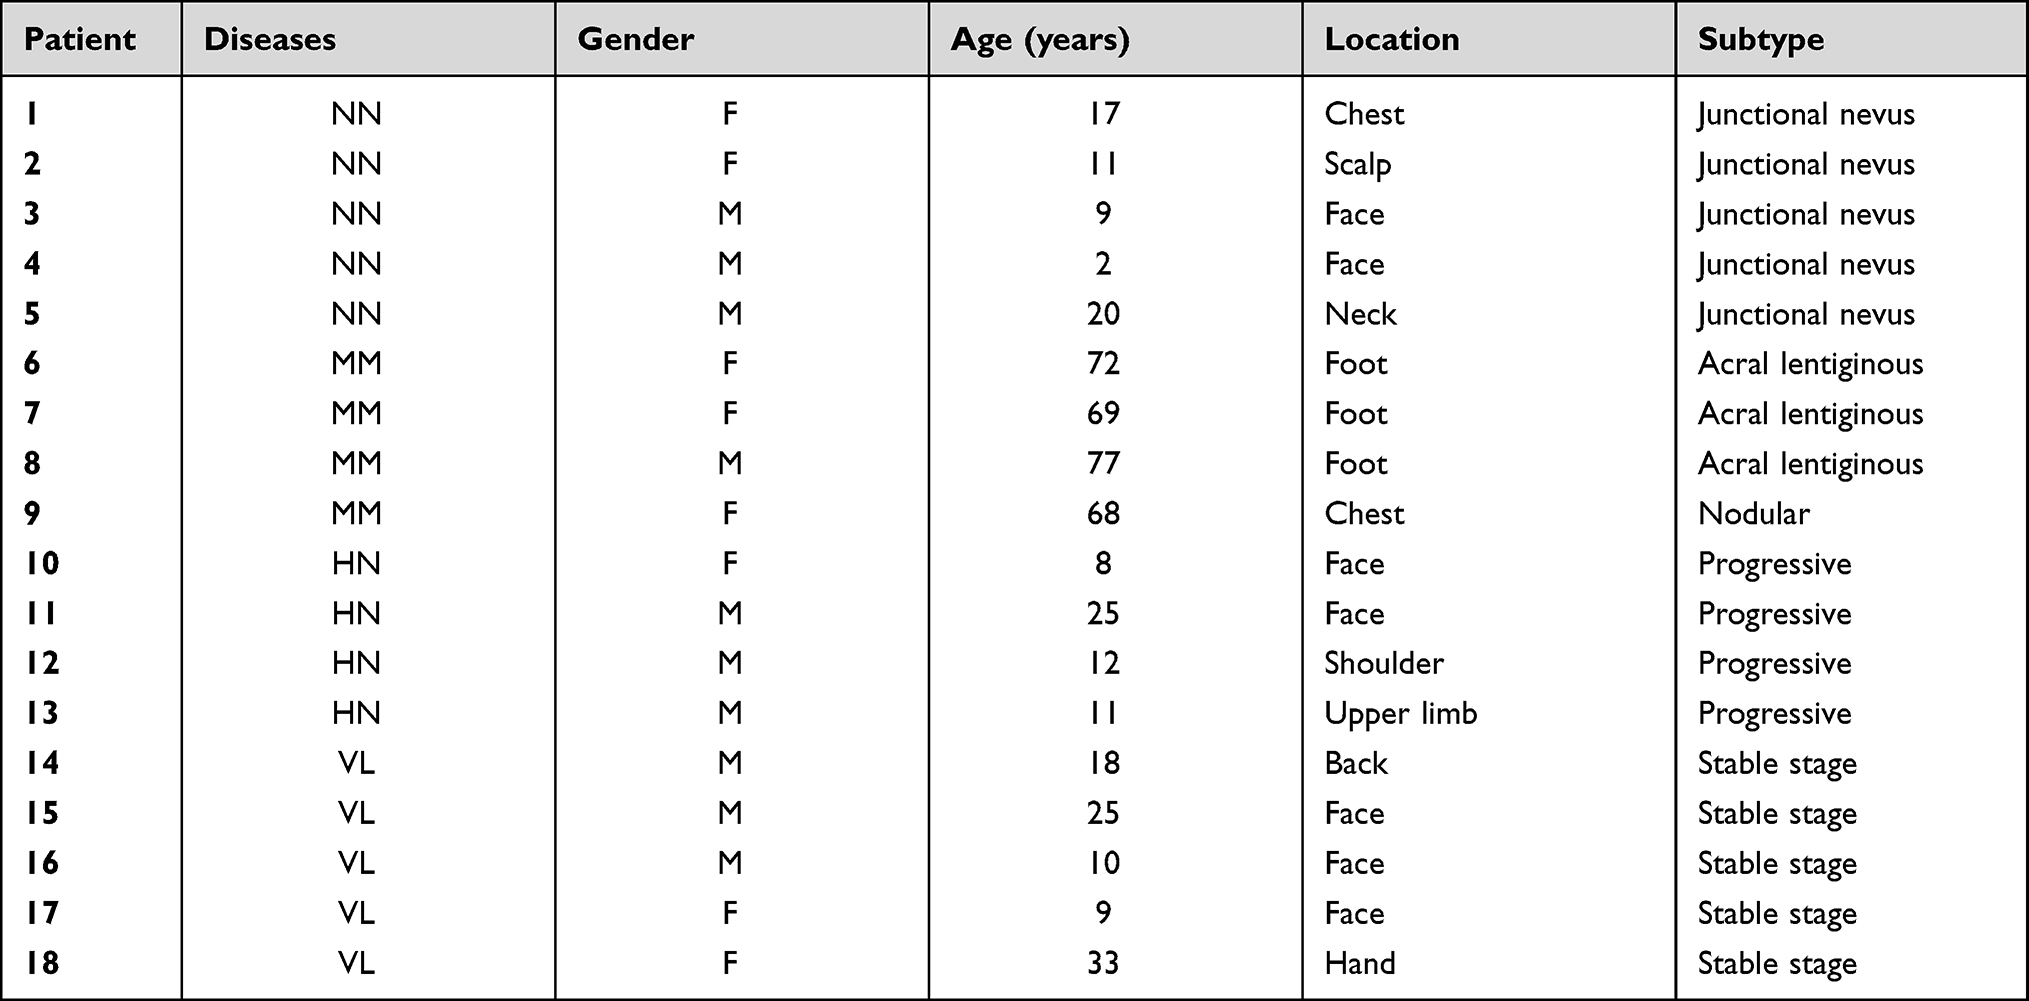 |
Table 1 Sequencing Samples and Grouping Information |
RNA Extraction and Transcriptome Sequencing
After visible adipose tissues were removed, skin samples were trimmed into pieces and added to RLT tissue lysis buffer containing β-mercaptoethanol (BME). The tissues were then crushed by a grinder to break up. Following the manufacturer’s instructions, total RNA was extracted from skin samples using the RNeasy plus mini kit (Qiagen, Hilden, Germany). RNA concentration was calculated by the Nanodrop 1000 spectrophotometer (Thermo Scientific, Ottawa, ON, CA), and RNA integrity was measured by Agilent 2100 bioanalyser (Agilent, USA). Transcriptome sequencing of RNA from the skin biopsies of four different diseases was performed on Illumina HiSeq X Ten platform (Illumina, USA) to initially screen the DEGs.
Data Analysis
The sequencing results were imported and analyzed with the CASAVA for statistical computation and visualization. Data normalization was performed within and across the arrays using per gene and per chip normalization in accordance with the manufacturer’s recommendation. Raw data obtained by high throughput sequencers possibly contain low-quality reads and adaptor. For accurate and reliable analysis results, background correction was performed on the raw data. After low-quality reads were removed, valid reads were mapped to a reference genome and genes with STAR. Principal component analysis (PCA) was performed for all samples and corresponding gene expression levels. Genetic quantitative and differential analysis were performed using HTSeq. Fragments per kilobase of transcript per million fragments mapped (FPKM) was used to calculate the gene expression.
Identification of DEGs in the Samples of Four Different Diseases
DEGs were analyzed by comparing the gene expression in the samples of four different diseases. The following six pairs of comparisons were examined: (1) HN and VL, (2) HN and NN, (3) HN and MM, (4) MM and NN, (5) MM and VL, and (6) NN and VL. DEGs under various comparison conditions were calculated by DESeq2 software on the basis of the FPKM values of different transcripts under each condition. The DEGs were then filtered by the combined criteria of the absolute fold change (log2 FC) and false discovery rate (FDR)-adjusted p-values (q values). Genes with log2 FC ≥ 1 and q value <0.05 were selected as DEGs.
Functional Annotation of DEGs
Gene Ontology (GO) and Kyoto Encyclopedia of Genes and Genomes (KEGG) pathway enrichment analyses were performed to investigate the relevant biological functions and pathways associated with DEGs.19 GO enrichment analysis using clusterProfiler R package was conducted to annotate and classify the DEGs from biological pathways based on the three categories of molecular functions (MFs), cellular components (CCs), and biological processes (BPs). Pathway analysis can be used to further understand the metabolic pathways and specific biological functions of genes. Therefore, the pathways of DEGs were also analyzed and annotated according to the KEGG database (http://www.genome.jp/kegg/). The corresponding p values and q values in GO and KEGG analyses were calculated. Q value ≤0.01 was considered as significant enrichment.
Modular Transcriptional Repertoire Analyses
Transcriptional profiles were obtained for the six groups. R package Limma was used to conduct group-level analysis at the probe-level to identify the statistically significant probes (FDR <0.05). According to the number of statistically significant probes assigned to each module, the positive percentages for up-regulation and negative percentages for down-regulation were calculated.
The percentage difference of each module was mapped on a grid where each position corresponded to one of the 28 main modules.20 The relationship between the module and the sample phenotype was analyzed, the regulatory network between genes in the module was drawn, and the key regulatory genes were identified.
Immune Cell Component Analysis
Immune cell composition was predicted using ImuUCC and GSVA. Immune score was calculated by studying the specific gene expression characteristics of immune cells to predict immune cell infiltration. Charts were drawn by R package heatmap and ggplot.
Confirmation of Gene Expression Changes by RT-qPCR
Total RNA was extracted from the lesions of additional patients with HN, VL, and NN and from the skin tissues of healthy volunteers by using the RNeasy plus mini kit (Qiagen, Hilden, Germany). mRNA was reverse transcribed using the HiScript™ II Q RT SuperMix for qPCR ((Vazyme, China). RT-qPCR was conducted with ChamQ™ Universal SYBR® qPCR Master mix (Vazyme, China). The relative gene expression levels were calculated by 2−ΔΔCt method with the housekeeping gene β-actin as the internal reference. The designed primers are listed in Supplemental Table 4.
Results
Comparison of Gene Expression
Principal component analysis (PCA) was performed on all samples and the corresponding gene expression levels to observe the clustering relationship based on the gene expression levels (Figure 2A). The results showed that VL, HN, and NN samples were relatively close but could still be divided into different types. The gene expression profiles of MM were remarkably different from those of the other three diseases.
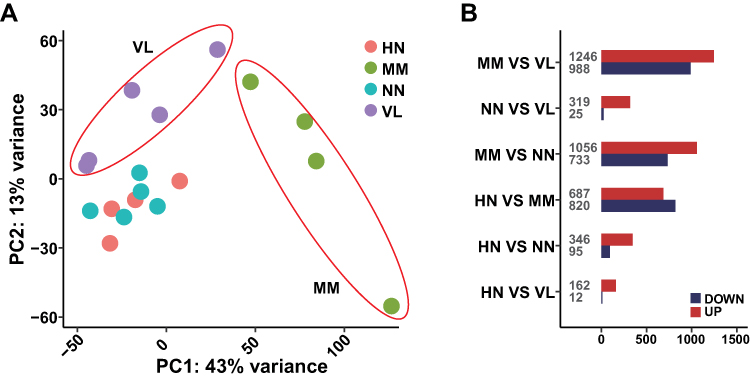 |
Figure 2 Gene expression levels of all samples. (A) Principal component analysis (PCA) of gene expression profiles in samples of four diseases. (B) The number of DEGs of different comparative groups. |
The gene expression levels of four different samples were analyzed by DESeq2. The up- and down-regulated genes were compared between (1) HN and VL, (2) HN and NN, (3) HN and MM, (4) MM and NN, (5) MM and VL, and (6) NN and VL (Figure 2B). The number of DEGs among NN, HN, and VL was small, suggesting the similarity of these three diseases. The number of DEGs was high in all the comparative groups involving MM, indicating that MM gene expression was significantly different.
Identification of DEGs
A total of 441 DEGs were found between HN and NN, among which 346 genes were up-regulated and 95 genes were down-regulated. The top 40 most significantly up-regulated and down-regulated genes are listed in Supplementary Table 1. Most of the up-regulated genes encoded chemokines or cytokines, including CXCL9, CXCL13, CXCR3, CD8A, CD7, and CD38. Several genes were related to the activation of immunocytes, such as GBP4, GBP5, TNFRSF9, and LAG3. In the comparison with VL, 174 genes were differentially expressed; among which 162 were up-regulated and 12 were down-regulated (Supplementary Table 2). In the comparison between HN with MM, 1507 genes were differentially expressed; among which, 687 were up-regulated and 820 were down-regulated (Supplementary Table 3).
Functional Enrichment Analysis
The identified DEGs were annotated by GO classification, and GO functional enrichment analysis was performed to detect their biological functions. In Figure 3, GO analysis showed the enrichment of DEGs in the MF, CC, and BP categories. Several GO terms in the HN and NN comparison group were noted, including immune response, immune system process, and immune cell proliferation and activation. The biological pathways of up-regulated genes enrichment in the HN/VL group were similar to those in the HN/NN group. Down-regulated DEGs were significantly enriched in muscle development and contraction. In the HN/MM group, the up-regulated DEGs were enriched in epidermal development and keratinization, and the down-regulated DEGs were enriched in extracellular matrix, neutrophil differentiation, and neutrophil mediated immune response.
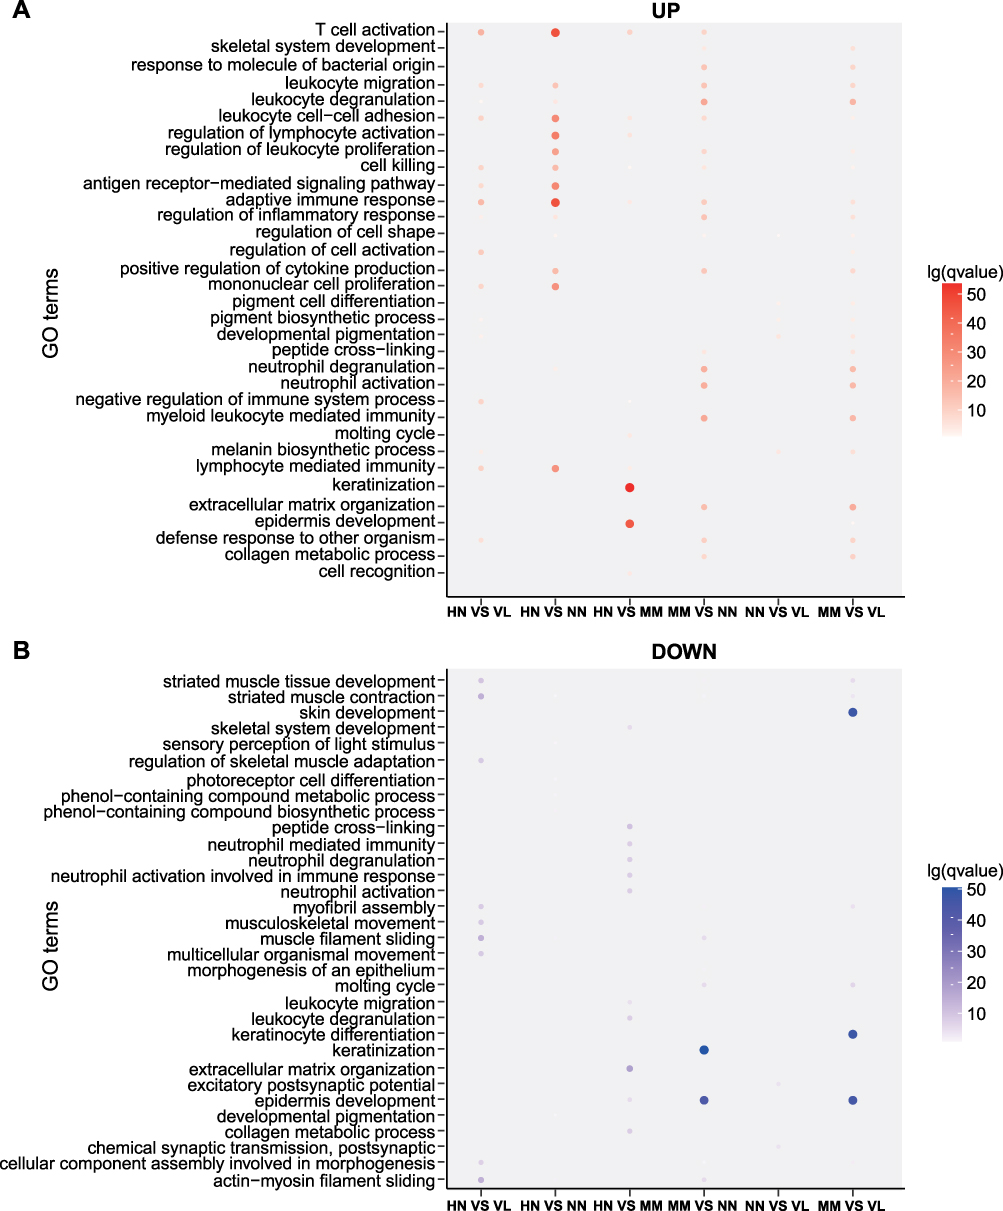 |
Figure 3 GO classification and GO functional enrichment analysis. (A) Up-regulated statistical map of GO functional classification of DEGs. (B) Down-regulated statistical map of GO functional classification of DEGs. Different groups are represented on the horizontal axis and different gene functions are shown on the vertical axis. Red represents the GO functional clustering of up-regulated genes. Blue represents the GO functional clustering of down-regulated genes. The color on the coordinate axis represents FDR. In the coordinate axis, the size of the point represents the number of DEG. |
KEGG enrichment pathways were also analyzed (Figure 4). Antigen processing and presentation, cytokine–cytokine receptor interaction, chemokine signaling pathway, and primary immunodeficiency were potentially related to the strong immune response of HN. For the comparison between HN and NN, the DEGs were associated with measles, HTLV-1 infection, viral myocarditis, graft-versus-host disease, allograft rejection, primary immunodeficiency, type I diabetes mellitus, and autoimmune thyroid disease. KEGG functional enrichment analysis for the comparison between HN and MM revealed three pathways related to the immune response, namely, chemokine signaling pathway, natural killer cell mediated cytotoxicity, and chemokine signaling pathway. Among which, the up- and down-regulated DEGs accounted for half, suggesting that the development of these two diseases is regulated differently.
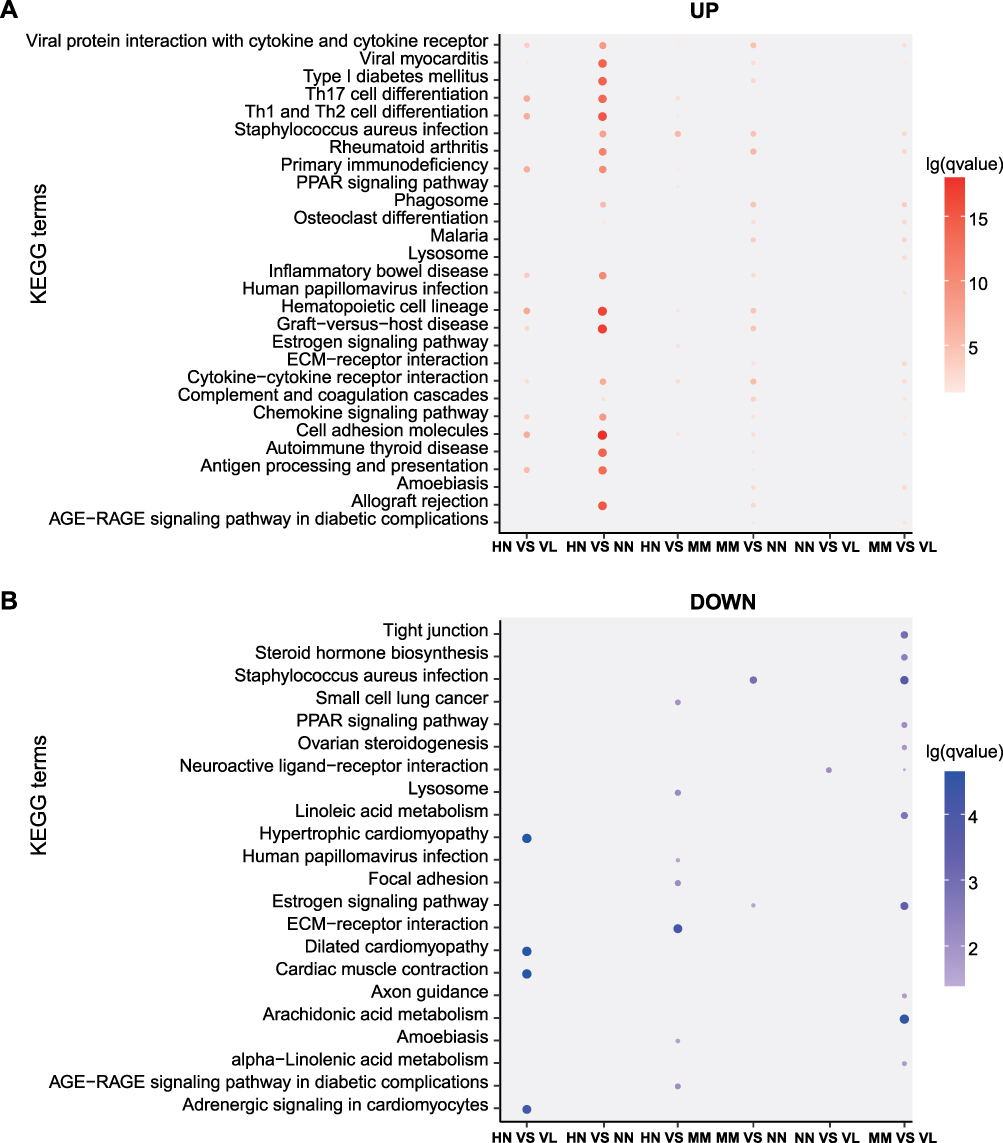 |
Figure 4 KEGG pathway enrichment analysis. (A) KEGG pathways of up-regulated DEGs. (B) KEGG pathways of down-regulated DEGs. Different groups are represented on the horizontal axis and different pathways are shown on the vertical axis. The color on the coordinate axis represents FDR. In the coordinate axis, the size of the point represents the number of DEG. |
Modular Transcriptional Repertoire Analyses
At the group level, modular repertoire analysis revealed a similar strong up-regulation of module B3, B4, and C1 in the HN/NN, HN/VL, HN/MM, MM/VL, and MM/NN groups (Figure 5A). Modules B3, B4, and C1 were annotated immune signals. The genes of B3, B4, and C1 modules were analyzed by module annotation network (Figure 5B). Consistent with the previous GO and KEGG analyses, the results showed that the B3, B4, and C1 modules were involved in immune response.
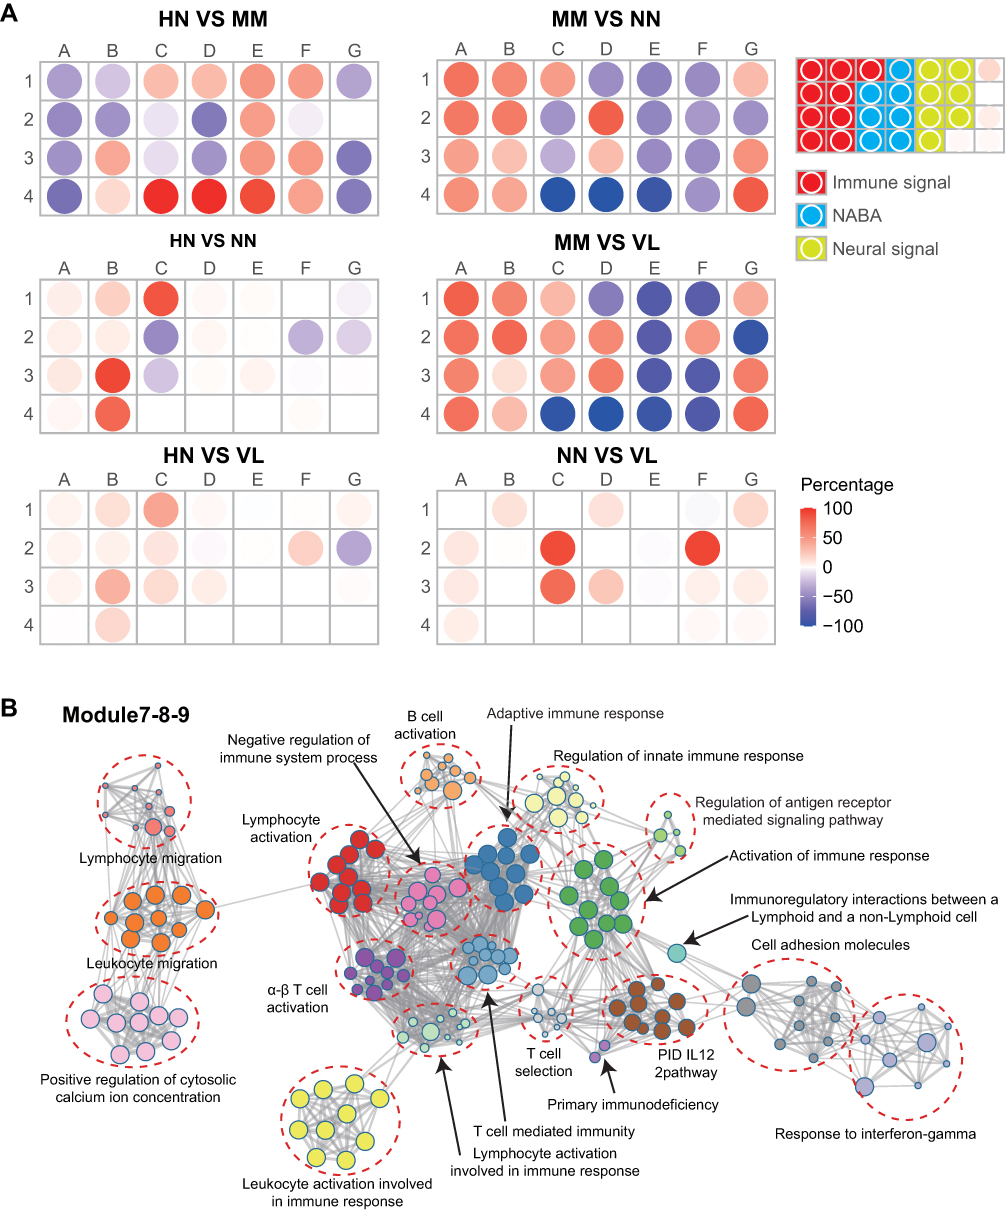 |
Figure 5 Modular transcriptional repertoire analyses. (A) Modules containing transcripts with increased expression are represented in red, while those with decreased expression are represented in blue. (B) Modules B3, B4 and C1 were involved in immune response. |
Immune Cell Component Analysis
Immune cell component analysis was conducted on the samples of the four diseases (Figure 6A). The proportion of DC and T cells was high in almost all samples, and that of macrophages in HN and MM samples was higher than that in the other two samples. In addition, the up-regulated immune cell types in the HN group included iTreg, NK, Th1, CD8+T, and gamma-delta T cells (Figure 6B).
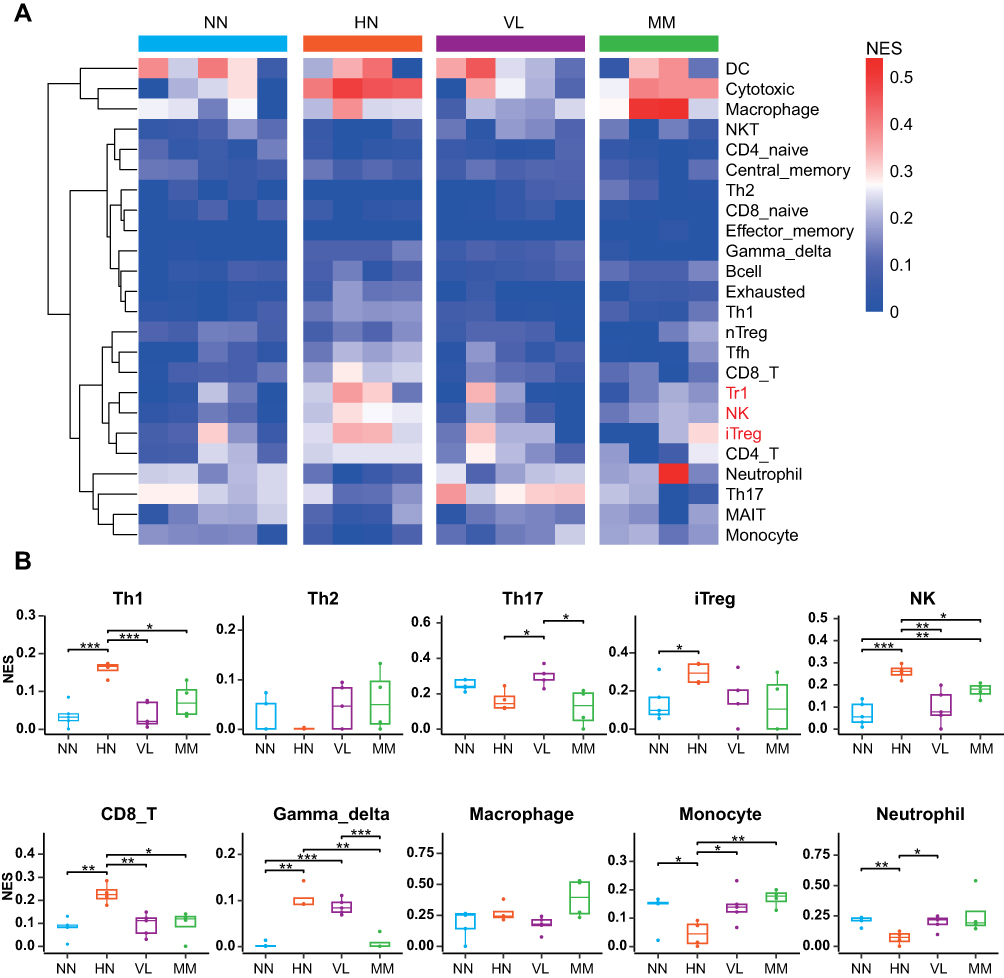 |
Figure 6 Cell type change in samples of four diseases. (A) Heat map of cell type changes. The average of the percentage of immune cells in a sample of the same disease indicates the percentage of immune cells in that disease. The colors represent the percentage of immune cells in the disease. (B) Bee map of different types of immune cells. ***P < 0.001, **P < 0.01, *P < 0.05. |
Changes in molecules regarding immune cells were also analyzed (Figure 7). The most up-regulated molecules were found in the HN samples. In addition, the HN/NN comparison group had many specifically up-regulated immune cell molecules (158), of which 60 were also up-regulated in the HN/VL group. The specific up-regulated pathways of the HN/NN group included T cell receptor signaling, NF-kB (TNFRSF13B, BIRC3, TRAF1, CCL4, PRKCQ, CARD11), and JAK-STAT signaling (IL7R, PTPN6).
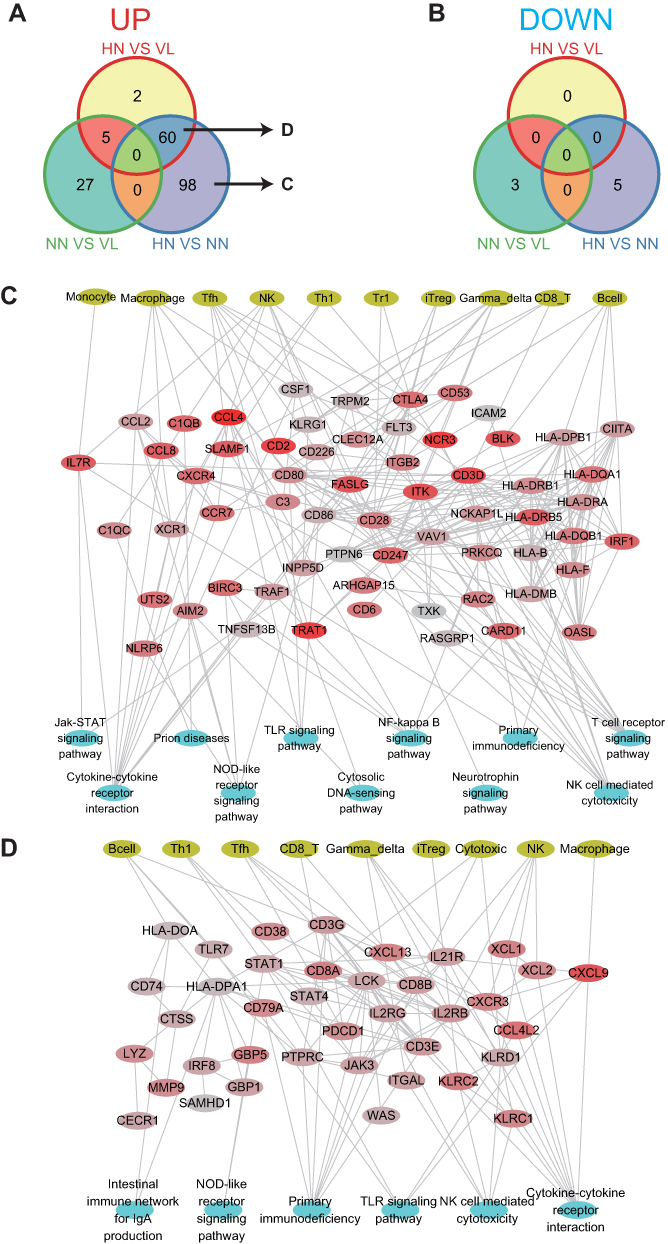 |
Figure 7 Immune molecules change in samples of four diseases. (A) Up-regulated immune molecular profiles in the HN/VL, NN/VL, and HN/NN groups. (B) Down-regulated immune molecular profiles in the HN/VL, NN/VL, and HN/NN groups. (C) Up-regulated immune molecules, immune cells and pathways regulatory networks of HN/NN. (D) The shared up-regulated immune molecules, immune cells and pathways regulatory networks of the HN/NN and HN/VL groups. |
Confirmation of DEGs by RT-qPCR
Basically consistent with the results of transcriptome sequencing, the mRNA expression of 9 out of 10 selected genes (CD8A, GBP5, CXCL9, CXCL13, CXCR3, TNFRSF9, KLRC1, LILRB1, IL2RB, and TRPM1) in the HN group was significantly higher than that in the VL, NN, and MM groups (p<0.01) (Figure 8).
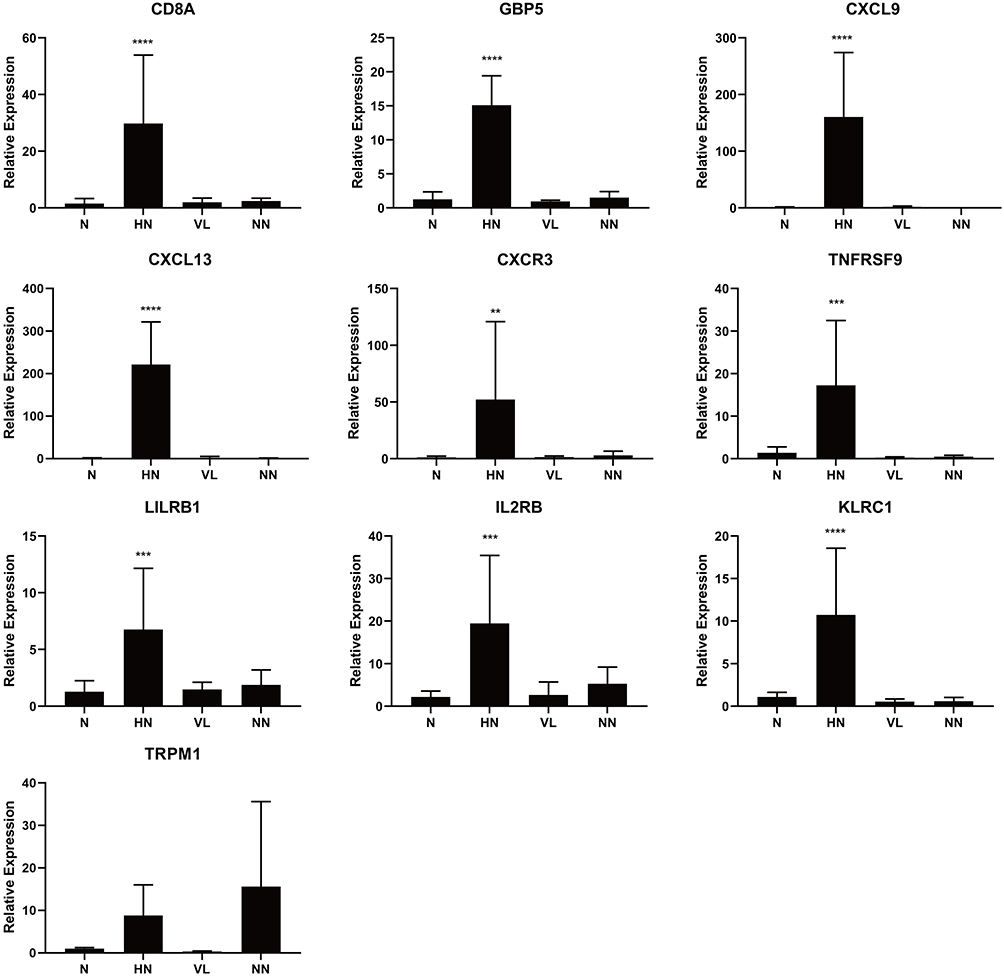 |
Figure 8 Validation of DEGs by RT-qPCR. Comparing to normal control (n = 4), VL (n = 4) and NN (n = 4), the mRNA expression levels of 9 identified genes were elevated in HN (n = 4). ****P < 0.0001, ***P < 0.001, **P < 0.01. |
Discussion
HN and VL are autoimmune disorders of the skin. VL is characterized by the formation of depigmentation spots due to the destruction of melanocytes,21 and HN is a benign melanocytic nevi with surrounding well-defined decolorization halo and frequently appears in adolescence or youth. The central nevi may partially or completely recede, and the surrounding white halo may persist or continue to expand. The typical histopathological feature of HN is the infiltration of band lymphoid tissue cells in the dermis.22,23 CD8+T cells account for the majority of the infiltrated lymphocytes.2,22 Yang et al found that autoimmune phenotype of HN and VL was associated with H2O2. It was characterized by the substantial up-regulation of the CXCL10-CXCR3 axis of the chemokine induced by IFN-γ and the detected dense infiltration of CD8+T. The findings indicated that the pathogenesis of both diseases is similar.24 Trauma can easily cause the Koebner reaction of progressive VL and thus lead to new decolorization lesions; therefore, resection is not recommended for patients with progressive VL in clinical practice. However, HN has remarkable autoimmune response against melanocytes in the skin, and surgical resection is a common treatment for HN. Studying autoimmune signals in the skin samples of HN may be a strategy for VL research.24 In this study, skin samples of progressive HN, stable vitiligo, NN, and MM were collected to analyze the differences in the expression profiles of progressive HN. The results revealed similar immune molecules and pathways in the development of HN and VL. CD8 was highly expressed in HN, suggesting the role of cytotoxic CD8+ T cells in the destruction of melanocytes in HN. The genes associated with CXCL10-CXCR3 axis were also notably expressed, which induced the activation of CD8+T cells.25
Previous transcriptome sequencing on the differences in gene expression in VL lesions, surrounding skin, and normal skin tissues showed that the up-regulated genes point to abnormal activity in the innate immune system, particularly NK cells in VL lesions.26 Markers of an enhanced innate immune response were also up-regulated in non-invasive skin surrounding the lesions in patients with VL. The potential importance of innate immunity was further emphasized.26 In the present study, molecules related to NK cells were highly expressed, and the innate immune pathway was activated in HN. These findings indicated that innate immunity plays a role in the pathogenesis of HN and VL.
In this study, transcriptome sequencing was performed on the skin lesions of patients with HN, stable VL, NN, and primary cutaneous MM to explore the gene expression profiles in skin tissues of different disease samples. Comparison of the gene expression among the samples revealed that the four diseases had their respective gene expression characteristics, reflecting their different pathological or physiological states. According to the principal component analysis of gene expression level and sample stratification clustering, the gene expression profiles of HN, stable VL, and NN had a large range of overlap, with extremely high similarity in the expression profiles of HN and stale VL. Comparison of gene expression between HN and stable VL only showed a small number of differently expressed genes; this finding implied that HN and VL have similar gene expression profiles and was consistent with previous studies suggesting their similar pathogenesis.24 Comparative analysis showed that most of the up-regulated and differentially expressed genes in the HN/VL group could also be found in the HN/NN group and were in relation to immunity. Therefore, the immune function of HN was activated or enhanced compared with stable VL or NN.
VL is often clinically in conjunction with other autoimmune diseases, including autoimmune thyroid disease, alopecia areata, type I diabetes, Addison’s disease, rheumatoid arthritis, inflammatory bowel disease, and systemic lupus erythematosus.27 Genome-wide association studies found approximately 50 genetic loci contributing to the risk of VL, many of which were found in other autoimmune diseases.28 In this study, functional enrichment analysis also indicated that the DEGs obtained from HN were substantially enriched in the biological pathway of autoimmune diseases. These results suggested that HN and VL are at a genetic risk of developing multiple autoimmune diseases, and their genetic risks are similar.
VL has been linked to graft-versus-host disease (GVHD). GVHD is one of the most common and devastating complications after allogeneic hematopoietic stem cell transplantation (HSCT) and is a major cause of death in long-term survivors and advanced non-recurrent-associated disease.29 Several hypotheses have been presented about the mechanism by which HSCT may cause VL, including chemotherapy/radiation, transferation from donor auto-antibodies, or destruction of receptor melanocytes by GVHD-like processes.30 Therefore, GVHD is believed to be a trigger for the occurrence of auto-antibodies and some autoimmune complications. Sanli et al proposed that chronic GVHD may trigger an immune response leading to the destruction of melanocytes,31 and this hypothesis was verified by the current study. The DEGs in HN were remarkably enriched in immunodeficiency and immune rejection pathways, including GVHD and allograft rejection. Therefore, GVHD may cause an imbalance of immune system and result in HN and VL.
In our study, the DEGs in HN lesions may be involved in responses to infectious stimuli (bacterial and viral), and this finding was consistent with previous studies on VL and its association with infection. As an important environmental factor, viruses are involved in the pathogenesis of many autoimmune diseases. Viral infections such as herpes, hepatitis, cytomegalovirus, and HIV could trigger autoimmunity and result in the onset of VL.32–34 The frequency of these autoimmune diseases is also increased in patients with VL.27 Further research on the specific mechanism by which viruses trigger the onset of HN and VL is needed.
In conclusion, the genetic risk and immune mechanism of HN were similar to those of VL. Compared with stable VL, progressive HN had enhanced immunoactivity. The adaptive immunity represented by CD8+T cells and the innate immunity represented by NK cells are involved in the occurrence and development of HN. The immune response of HN may be related to autoimmune diseases and GVHD. Virus and bacterial infection may be an important factor in triggering these autoimmune diseases.
Data Sharing Statement
All data generated or analyzed during this study are included in this published article and supplementary information files.
Ethics Approval and Consent to Participate
This study was approved by the Ethics Committee of the Hospital for Skin Diseases (Institute of Dermatology), Chinese Academy of Medical Sciences and Peking Union Medical College (2016-I2M-1-005) and conducted in accordance with the declaration of Helsinki principles. All patients signed written informed consent.
Consent for Publication
Written informed consent for the publication of clinical details and/or clinical images was obtained from the patients. Copies of the consent forms are available for review.
Acknowledgments
We are grateful to all the patients and volunteers who participated in the study. All authors approved the final manuscript.
Funding
This manuscript was supported by grants from the Chinese Academy of Medical Science Innovation Fund for Medical Science (2017-I2M-B&R-14, 2016-I2M-1-005), and the National Natural Science Foundation of China (grant 81972950).
Disclosure
The authors declare no conflict of interest.
References
1. Barona MI, Arrunategui A, Falabella R, Alzate A. An epidemiologic case-control study in a population with vitiligo. J Am Acad Dermatol. 1995;33(4):621–625. doi:10.1016/0190-9622(95)91282-7
2. Zeff RA, Freitag A, Grin CM, Grant-Kels JM. The immune response in halo nevi. J Am Acad Dermatol. 1997;37(4):620–624. doi:10.1016/S0190-9622(97)70181-6
3. Ding GZ, Zhao WE, Li X, Gong QL, Lu Y. A comparative study of mitochondrial ultrastructure in melanocytes from perilesional vitiligo skin and perilesional halo nevi skin. Arch Dermatol Res. 2015;307(3):281–289. doi:10.1007/s00403-015-1544-4
4. Speeckaert R, van Geel N. Distribution patterns in generalized vitiligo. J Eur Acad Dermatol Venereol. 2014;28(6):755–762. doi:10.1111/jdv.12171
5. Ezzedine K, Diallo A, Leaute-Labreze C, et al. Halo naevi and leukotrichia are strong predictors of the passage to mixed vitiligo in a subgroup of segmental vitiligo. Br J Dermatol. 2012;166(3):539–544. doi:10.1111/j.1365-2133.2011.10709.x
6. de Vijlder HC, Westerhof W, Schreuder GM, de Lange P, Claas FH. Difference in pathogenesis between vitiligo vulgaris and halo nevi associated with vitiligo is supported by an HLA association study. Pigment Cell Res. 2004;17(3):270–274. doi:10.1111/j.1600-0749.2004.00145.x
7. Schallreuter KU, Kothari S, Elwary S, Rokos H, Hasse S, Panske A. Molecular evidence that halo in Sutton’s naevus is not vitiligo. Arch Dermatol Res. 2003;295(6):223–228. doi:10.1007/s00403-003-0427-2
8. Lerner AB. Part V: clinical applications of psoralens, and related materials: vitiligo. J Invest Dermatol. 1959;32(2):285–310. doi:10.1038/jid.1959.49
9. Scherz-Shouval R, Elazar Z. ROS, mitochondria and the regulation of autophagy. Trends Cell Biol. 2007;17(9):422–427. doi:10.1016/j.tcb.2007.07.009
10. Cohen BE, Manga P, Lin K, Elbuluk N. Vitiligo and melanoma-associated vitiligo: understanding their similarities and differences. Am J Clin Dermatol. 2020;21(5):669–680. doi:10.1007/s40257-020-00524-0
11. Paradisi A, Tabolli S, Didona B, Sobrino L, Russo N, Abeni D. Markedly reduced incidence of melanoma and nonmelanoma skin cancer in a nonconcurrent cohort of 10,040 patients with vitiligo. J Am Acad Dermatol. 2014;71(6):1110–1116. doi:10.1016/j.jaad.2014.07.050
12. Teulings HE, Overkamp M, Ceylan E, et al. Decreased risk of melanoma and nonmelanoma skin cancer in patients with vitiligo: a survey among 1307 patients and their partners. Br J Dermatol. 2013;168(1):162–171. doi:10.1111/bjd.12111
13. Mochel MC, Ming ME, Imadojemu S, et al. Cutaneous autoimmune effects in the setting of therapeutic immune checkpoint inhibition for metastatic melanoma. J Cutan Pathol. 2016;43(9):787–791. doi:10.1111/cup.12735
14. Hua C, Boussemart L, Mateus C, et al. Association of vitiligo with tumor response in patients with metastatic melanoma treated with pembrolizumab. JAMA Dermatol. 2016;152(1):45–51. doi:10.1001/jamadermatol.2015.2707
15. Lommerts JE, Teulings HE, Ezzedine K, et al. Melanoma-associated leukoderma and vitiligo cannot be differentiated based on blinded assessment by experts in the field. J Am Acad Dermatol. 2016;75(6):1198–1204. doi:10.1016/j.jaad.2016.07.060
16. Houghton AN, Eisinger M, Albino AP, Cairncross JG, Old LJ. Surface antigens of melanocytes and melanomas. Markers of melanocyte differentiation and melanoma subsets. J Exp Med. 1982;156(6):1755–1766. doi:10.1084/jem.156.6.1755
17. Fishman P, Merimski O, Baharav E, Shoenfeld Y. Autoantibodies to tyrosinase: the bridge between melanoma and vitiligo. Cancer-Am Cancer Soc. 1997;79(8):1461–1464.
18. Garbelli S, Mantovani S, Palermo B, Giachino C. Melanocyte-specific, cytotoxic T cell responses in vitiligo: the effective variant of melanoma immunity? Pigment Cell Res. 2005;18(4):234–242. doi:10.1111/j.1600-0749.2005.00244.x
19. Yuan X, Meng D, Cao P, et al. Identification of pathogenic genes and transcription factors in vitiligo. Dermatol Ther. 2019;32(5):e13025. doi:10.1111/dth.13025
20. Chiche L, Jourde-Chiche N, Whalen E, et al. Modular transcriptional repertoire analyses of adults with systemic lupus erythematosus reveal distinct type I and type II interferon signatures. Arthritis Rheumatol. 2014;66(6):1583–1595. doi:10.1002/art.38628
21. Ezzedine K, Eleftheriadou V, Whitton M, van Geel N. Vitiligo. Lancet. 2015;386(9988):74–84. doi:10.1016/S0140-6736(14)60763-7
22. Weyant GW, Chung CG, Helm KF. Halo nevus: review of the literature and clinicopathologic findings. Int J Dermatol. 2015;54(10):e433–e435. doi:10.1111/ijd.12843
23. Suh KY, Bolognia JL. Signature nevi. J Am Acad Dermatol. 2009;60(3):508–514. doi:10.1016/j.jaad.2008.10.056
24. Yang Y, Li S, Zhu G, et al. A similar local immune and oxidative stress phenotype in vitiligo and halo nevus. J Dermatol Sci. 2017;87(1):50–59. doi:10.1016/j.jdermsci.2017.03.008
25. Harris JE, Harris TH, Weninger W, Wherry EJ, Hunter CA, Turka LA. A mouse model of vitiligo with focused epidermal depigmentation requires IFN-gamma for autoreactive CD8(+) T-cell accumulation in the skin. J Invest Dermatol. 2012;132(7):1869–1876. doi:10.1038/jid.2011.463
26. Yu R, Broady R, Huang Y, et al. Transcriptome analysis reveals markers of aberrantly activated innate immunity in vitiligo lesional and non-lesional skin. PLoS One. 2012;7(12):e51040. doi:10.1371/journal.pone.0051040
27. Gill L, Zarbo A, Isedeh P, Jacobsen G, Lim HW, Hamzavi I. Comorbid autoimmune diseases in patients with vitiligo: a cross-sectional study. J Am Acad Dermatol. 2016;74(2):295–302. doi:10.1016/j.jaad.2015.08.063
28. Spritz RA, Andersen GH. Genetics of vitiligo. Dermatol Clin. 2017;35(2):245–255. doi:10.1016/j.det.2016.11.013
29. Wolff D, Lawitschka A. Chronic graft-versus-host disease. 2019:331–345.
30. Bae JM, Choi KH, Jung HM, et al. Subsequent vitiligo after hematopoietic stem cell transplantation: a nationwide population-based cohort study from Korea. J Am Acad Dermatol. 2017;76(3):459–463. doi:10.1016/j.jaad.2016.08.064
31. Sanli H, Akay BN, Arat M, et al. Vitiligo after hematopoietic cell transplantation: six cases and review of the literature. Dermatology. 2008;216(4):349–354. doi:10.1159/000117705
32. Dou Y, Yim HC, Kirkwood CD, Williams BR, Sadler AJ. The innate immune receptor MDA5 limits rotavirus infection but promotes cell death and pancreatic inflammation. EMBO J. 2017;36(18):2742–2757. doi:10.15252/embj.201696273
33. Stratton R, Slapak G, Mahungu T, Kinloch-de LS. Autoimmunity and HIV. Curr Opin Infect Dis. 2009;22(1):49–56. doi:10.1097/QCO.0b013e3283210006
34. Lunemann JD, Frey O, Eidner T, et al. Increased frequency of EBV-specific effector memory CD8+ T cells correlates with higher viral load in rheumatoid arthritis. J Immunol. 2008;181(2):991–1000. doi:10.4049/jimmunol.181.2.991
 © 2021 The Author(s). This work is published and licensed by Dove Medical Press Limited. The
full terms of this license are available at https://www.dovepress.com/terms
and incorporate the Creative Commons Attribution
- Non Commercial (unported, 3.0) License.
By accessing the work you hereby accept the Terms. Non-commercial uses of the work are permitted
without any further permission from Dove Medical Press Limited, provided the work is properly
attributed. For permission for commercial use of this work, please see paragraphs 4.2 and 5 of our Terms.
© 2021 The Author(s). This work is published and licensed by Dove Medical Press Limited. The
full terms of this license are available at https://www.dovepress.com/terms
and incorporate the Creative Commons Attribution
- Non Commercial (unported, 3.0) License.
By accessing the work you hereby accept the Terms. Non-commercial uses of the work are permitted
without any further permission from Dove Medical Press Limited, provided the work is properly
attributed. For permission for commercial use of this work, please see paragraphs 4.2 and 5 of our Terms.