")
Back to Journals » Journal of Inflammation Research » Volume 14
Transcription Coactivator BCL3 Acts as a Potential Regulator of Lipid Metabolism Through the Effects on Inflammation
Authors Zhang S, Gao J, Liu S, Yu L, Zhang W, Liang Y, Wang H
Received 7 July 2021
Accepted for publication 9 September 2021
Published 23 September 2021 Volume 2021:14 Pages 4915—4926
DOI https://doi.org/10.2147/JIR.S327858
Checked for plagiarism Yes
Review by Single anonymous peer review
Peer reviewer comments 3
Editor who approved publication: Professor Ning Quan
Shuo Zhang,1 Jingtao Gao,1 Shibo Liu,1 Lu Yu,1 Wen Zhang,1 Yinming Liang,1,2 Hui Wang1,2
1Henan Key Laboratory of Immunology and Targeted Drug, School of Laboratory Medicine, Xinxiang Medical University, Xinxiang, Henan Province, 453003, People’s Republic of China; 2Henan Collaborative Innovation Center of Molecular Diagnosis and Laboratory Medicine, Xinxiang Medical University, Xinxiang, Henan Province, 453003, People’s Republic of China
Correspondence: Hui Wang
Henan Key Laboratory of Immunology and Targeted Drug, School of Laboratory Medicine, Xinxiang Medical University, Xinxiang, Henan Province, 453003, People’s Republic of China
Tel/Fax +86 373 3831203
Email [email protected]
Background and Purpose: Transcriptional coactivator B-cell lymphoma-3 (BCL3) is a member of the IκB family of NF-κB inhibitors and regulates the activity of the NF-κB pathway. However, the relationship between BCL3 and lipid metabolism remains unclear. The present study investigates the effects of BCL3 in immune and metabolism in obese mice.
Animals and Methods: Construct Bcl3-KO mice through CRISPR/Cas9 technology. Obesity model was induced in Bcl3-KO mice by feeding a high-fat diet for 16 weeks, and some metabolic-related indicators were analysed.
Results: The results showed that the KO mice gained significantly less body weight on a high fat diet without a change in food intake. There was significant improvement in hepatic steatosis and adipose tissue hypertrophy in KO mice. The expression of SREBP1 and its downstream fatty acid synthetase FAS and ACC were down-regulated in KO mice, and the inflammation in adipose tissue and liver was further reduced.
Conclusion: These results suggest that BCL3 may be a novel factor in regulating lipid metabolism in the development of obesity.
Keywords: inflammation, obesity, BCL3, lipid metabolism, SREBP1
Introduction
Obesity is associated with insulin resistance, atherosclerosis, hypertension, hyperlipidemia, fatty liver and other diseases.1,2 Adipose tissue dysfunction is an indication of obesity. Failure to properly store excess energy can lead to ectopic lipid deposition in other metabolically sensitive organs such as liver tissue, leading to liver steatosis and insulin resistance. In the process of obesity, inflammatory cells are constantly infiltrating into the swollen adipose tissue and release various inflammatory factors, so that keeps the body in a systemic state of chronic low-grade inflammation.3 In addition, excessive expansion of adipose tissue will aggravate impaired glucose tolerance and release various factors, such as adiponectin and leptin, which are related to the inflammatory process.4 Adipokines not only play a role in adipose tissue but also affect distant organs and tissues, resulting in changes in systemic metabolism.5,6
All people with obesity are most at risk of developing fatty liver disease. Liver is an important organ for the synthesis of triglycerides (TG). Therefore, accelerating lipid consumption and inhibiting lipid synthesis are considered as effective solutions to reduce lipid accumulation in the liver.7,8 Triglyceride synthesis in the liver is regulated by the transcriptional regulation of sterol regulatory element-binding protein 1(SREBP1), a major regulator of fatty acid synthetase (FAS).9 In previous studies, the activity of SREBP1/FAS pathway was significantly increased in mice with non-alcoholic fatty liver disease, leading to rapid progression of hepatic steatosis.10 Inhibition of SREBP1 expression can make obese mice induced by high fat diet show an anti-hepatic steatosis effect.11
BCL3 plays an important role in the regulation of immunity and inflammation. BCL3 has been classified as a member of the IκB family due to the presence of anchorin repeats. However, the role of BCL3 on the NF-κB pathway has been controversial. It exerts pro-inflammatory and anti-inflammatory functions by combining with different subunits.12 We overexpressed or knocked out BCL3 and found that it plays a negative regulatory role of NF-κB in HTLV-1 (human T-cell leukemia virus type 1) infected cells.13,14 However, in other studies, BCL3 appears to block the degradation of P50 and thus reduce inflammation in tissues of patients with acute pancreatitis or cholangitis.15 Inflammation can regulate energy metabolism under physiological and pathological conditions.3,16 We found that BCL3 mRNA levels were highly expressed in the adipose tissues of obese mice; thus, we hypothesized that BCL3 might have an effect on lipid metabolism. We established BCL3 knockout mice using CRISPR/Cas9 technology. After 16 weeks of high-fat diet, the size of adipose tissue in BCL3 knockout obese mice changed dramatically. However, the effect of BCL3 on lipid metabolism has not been reported. Therefore, it will be provided new insights into the pathogenesis of obesity by studying the effect of BCL3 on lipid metabolism.
Materials and Methods
Animals
A Bcl3 whole-body knockout mice (Bcl3-KO) was gifted by Prof. Yingming Liang. C57BL/6 (WT) mice were purchased from Charles River when it is 4 weeks of age. The male mice were fed on normal diet (ND) to 8 weeks of age, and then fed on high-fat diet (HFD Research Diet, 60% fat) or ND for 16 weeks with ad libitum access to food to establish the obesity model. The body weight of mice was measured regularly every week, and food intake of Bcl3-KO and WT was measured at 5 weeks of the ND or HFD. At the end of HFD feeding, tissue samples were collected from the mice. Animals were bred in a humidity- and temperature-controlled room (20°C–24°C and 30%–70%, respectively) with a 12-hour-light/12-hour-dark cycle (lights on at 6:00 a.m.). Mice were housed with littermates with a maximum of 5 mice/cage. All animal procedures were approved by the Institutional Animal Care and Use Committee (IACUC) of the Xinxiang Medical University. The experiments were performed following the experimental and welfare guidelines, namely, the Laboratory Animal (non-primate) Experiments Guidelines issued by Xinxiang Medical University.
Histological Analysis
Liver and adipose tissue was treated with 4% formaldehyde and embedded in paraffin and sectioned for histological analysis. The liver and adipose tissue were sliced into 5µm slices. All sections were stained with hematoxylin and eosin (H&E) and at least 4 mice per group. Adipocyte (n = 100 adipocytes) diameter was measured, and an average diameter was recorded for each animal.
GTTs and ITTs
For glucose tolerance tests, animals were IP injected with a glucose solution (2g/kg) after 12 hours of fasting, and blood sample for glucose determination was collected from the tail vein at 0, 15, 30, 60, 90, and 120 minutes after dextrose injection. Glucose levels were measured using ACCU-CHEK Active Model GB.
For insulin tolerance tests, 0.75U/kg of insulin was IP injected after 6 hours of fasting, and blood sample for glucose determination was collected from the tail vein at 0, 15, 30, 60, 90, and 120 minutes after insulin injection. Glucose levels were measured using ACCU-CHEK Active Model GB.
Western Blot Analysis
Cells and tissue were rinsed once with PBS and lysis was made in ice-cold lysis buffer (250mM NaCl, 1% Triton, 25mM Hepes pH 7.4) supplemented with protease and phosphatase inhibitors. Nucleoprotein was extracted according to the manufacturer’s instructions (Solarbio). Cell lysates or immunoprecipitates were separated by SDS-PAGE and transferred to PVDF membranes. After blocking with 5% BSA, the membrane was incubated with primary antibodies at 4°C overnight, followed by incubation with the corresponding secondary antibodies for 1 h at room temperature. The membranes were washed three times for 10 min each. The following antibodies were used: GAPDH (Abways, AB0037, 1:5000), SREBP1 (Santa Cruz, sc-365513, 1:1000), Lamin B1 (Proteintech, 66095-1-Ig, 1:10000), FAS (CST, 3180S, 1:1000), pACC (CST, 11818S, 1:1000), ACC (CST, 3676S, 1:1000), CPT1A (CST, 12252S, 1:1000), ATGL (CST, 2439S, 1:1000), pAKT (CST, 4060S, 1:1000), AKT (CST, 4691S, 1:1000), Goat Anti-Rabbit IgG (H+L) HRP (Abways, AB0101, 1:5000), Goat Anti-Mouse IgG (H+L) HRP (Abways, AB0102, 1:5000). Arbitrary densitometry units were quantified by ImageJ analysis.
Cell Harvest and Culture
External ears were collected from Bcl3-KO and WT mice; minced and digested with collagenase type I (200U/mL; Worthington) and dispase II (0.9U/mL; Roche) in a shaking water bath at 37°C for 2h. Dissociated cells were filtered through a 70 µm cell strainer and centrifuged at 1000r for 5 min. Pelleted cells were resuspended for 1 min in red blood cell lysing buffer (Solarbio) to remove erythrocyte contamination and were centrifuged at 1000r for 5 min. The isolated cells were plated in 100mm Petri dishes (P0) in Dulbecco’s modified Eagle’s medium (DMEM; Corning) supplemented with 1% antibiotic solution and 10% fetal bovine serum (FBS; Gibco). Subconfluent primary cultures were detached (0.25% trypsin, 2.21mM EDTA; Corning), replated in complete medium, and subcultured a density of 5×10⁴ cells/mL in six-well culture plates.
In vitro Adipogenic Differentiation
The capacity of ear mesenchymal stem cells (EMSC) to differentiate into the adipogenic lineage was verified up to passage five (P=5). Cells were replated in six-well culture plates at a density of 5×10⁴ cells/mL and maintained in a complete medium until confluent (considered day 0). Thereafter, the cells were exposed to an adipogenic induction medium containing DMEM plus 10% FBS, 1% antibiotic solution supplement 0.5mM isobutylmethylxanthine, 1.7μM insulin, and 1μM dexamethasone for 4 days (adipogenic medium I). For the next 4 days, medium was changed to DMEM supplemented with 10% FBS, 1% antibiotic solution, 1.7 μM insulin (adipogenic medium II).
Oil Red O Staining
A stock solution of oil red O (0.15 g in 30mL of isopropanol) was prepared and filtered through a 0.2 µm filter. A working solution was prepared by diluting 6mL of stock solution in 4 mL of distilled water and filtered through a 0.2 µm filter before use. Differentiated cells were fixed for 1 hour in 4% paraformaldehyde at room temperature and later stained for lipid accumulation for 30minutes with oil red O. Cells were washed three times with water and observed under a phase-contrast microscope.
RNA Isolation and qPCR
Total RNA was extracted from the cells with Trizol reagent (TAKARA, 9109). Briefly, 500ng of total RNA were reverse transcribed using RT Master Mix (Takara). Real-time quantitative PCR was carried out in an Applied Biosystems 7500 System with SYBR Green supermix. The relative mRNA level was expressed as fold change relative to untreated controls after normalization to the expression of GAPDH by the 2−ΔΔCT method. The specific primers used are shown in Supplemental Table 1 and were synthesized by Sangon Biotech.
Triglyceride Assay
Liver tissues were homogenized in phosphate buffered saline (PBS; 1g:20mL) and the cell lysate was made with the cell lysis buffer on ice. The lipids were extracted from the liver tissue homogenization or cell lysate using a n-heptane/isopropanol (1:1) mixture. Triglyceride was determined using the Serum Triglyceride Determination Kit (BC0625, Solarbio) according to the manufacturer’s instructions.
Analysis of Metabolic Parameters
Blood glucose levels were measured using the ACCU-CHEK Active Model GB (Roche) via tail vein blood sampling. Plasma nonesterified fatty acids (NEFA), triglycerides (TG), total-cholesterol (TCH), and ALT concentration were commissioned by Wuhan Seville Biotechnology Co., LTD.
Flow Cytometry
Organs including spleen, and Epididymis fat were collected to obtain single-cell suspension following standard procedures, as described previously. Briefly, non-specific antibody-binding sites were blocked by incubation with anti-CD16/32 (BD Biosciences) on ice prior to staining. Then, cells were stained with fluorochrome-conjugated antibodies for CD45-APC-Cy7 (557659, BD Biosciences), CD11b-FITC (1:400, 553310, BD Biosciences), F4/80-BV421 (1:400, 565411, BD Biosciences) and CD11c-PE-Cy7 (1:400, 25–01114-81, eBioscience) in PBS containing 1% FBS in the dark at 4°C for 30min and washed with PBS 3 times. For intracellular staining, Fixation/Permeabilization kit (554714, BD Biosciences) was used to stain CD206-APC (1:200, 141708, BioLegend). Macrophages were identified by CD45+, CD11B+ and F4/80+, M1 macrophages were gated by CD206− and CD11c+, M2 macrophages were gated by CD206+ and CD11c−. Flow cytometry was performed on a BD FACS Canto™ flow cytometer. Flow cytometry data were analyzed using FlowJoV10.
Statistical Analysis
Cohorts of five to eight animals per genotype per treatment were assembled, and all in vivo studies were repeated two to three independent times.
Differences between groups were examined for statistical significance using an unpaired two-tailed Student’s t test. All statistical tests were performed using GraphPad Prism 6.0, and all data are represented as mean ± SEM. The exact values of n and statistical significance are reported in the Figure Legends. Significant difference in means is indicated thusly: *p < 0.05, **p < 0.01, and ***p < 0.001. For all tests, P < 0.05 was defined as significant.
Results
Bcl3-KO Improved HFD-Induced Obesity in Mice
To assess the potential role of BCL3 in metabolic disease, we generated Bcl3-KO mice using the CRISPR/Cas9 system. We measured BCL3 mRNA expression in liver and adipose tissue to detect knockout efficiency (Figure 1A). Both WT and Bcl3-KO mice were fed the ND or 60% HFD for 16 weeks, beginning at 8 weeks of age. The mice were weighed regularly every week, and their body weights were recorded. Both WT and Bcl3-KO mice showed a similar age-dependent increase in body weight on either diet (Figure 1B). Moreover, bodyweight was a little decrease in ND WT versus Bcl3-KO mice but bodyweight was significant decrease in HFD Bcl3-KO compared with HFD WT mice. Differences were observed in bodyweight (Figure 1D) and appearance (1C). At the same time, in order to exclude the difference in body weight caused by altered food intake, we measured the food intake of mice in each group at the 5–8 weeks after the change of diet. Only slightly higher differences were found in food intake in WT versus Bcl3-KO mice on the HFD (Figure 1E). However, upon the HFD challenge, Bcl3-KO mice displayed lower weight of multiple adipose depots (Figure 1F) including epididymal (EAT), mesenteric (MAT), perirenal (PAT), subcutaneous (SAT) relative to WT littermates. This suggested that the weight loss of mice after Bcl3 knockout was primarily due to the loss of adipose tissue weight.
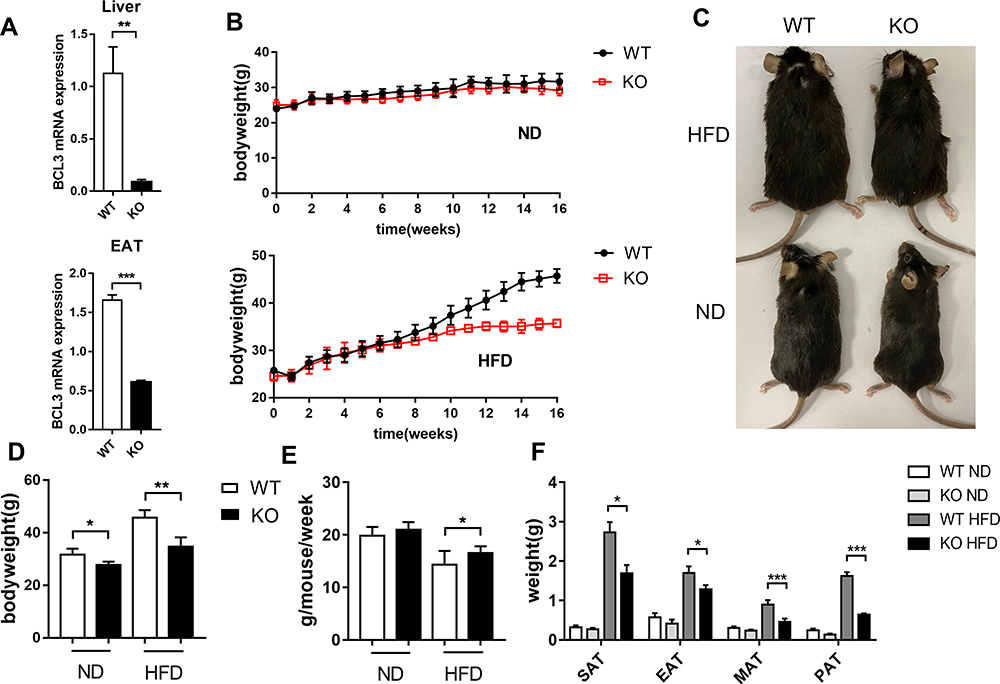 |
Figure 1 Altered lipid distribution in Bcl3-KO mice. Notes: Male WT and Bcl3-KO mice were fed a ND or HFD for 16 weeks. (A) mRNA levels of BCL3 in Liver and EAT from WT and Bcl3-KO mice. (B) Development of body weight of Bcl3-KO and WT mice. (C) Appearance of mice. (D) Body weight and (E) food intake were monitored. (F) Depot mass of subcutaneous, epididymis, mesentery, perirenal WAT in WT and Bcl3-KO mice. Data in A-F represent means of n=5–8 mice/group ±SEM. *p < 0.05, **p < 0.01, ***p < 0.001 for Bcl3-KO versus WT mice. |
Hepatic Steatosis Was Decreased in Bcl3-KO Mice
To explore the role of BCL3 in the control of hepatic steatosis, Bcl3-KO mice were fed on HFD to establish the hepatic steatosis model. Compared to WT mice, the Bcl3-KO mice exhibited a reduced degree in hepatic steatosis at the end of 4 months on HFD, which was observed in the liver appearance (Figure 2A), liver weight (Figure 2C) and liver triglyceride content (Figure 2D). Further H&E staining of liver tissue sections showed a significant change in the overall morphology of the liver, indicating that the large droplet-like structures in the liver of obese mice with Bcl3-KO were reduced compared with that of WT mice (2B). The difference was observed in the mice both in HFD and ND mice. HFD induced metabolic alterations including total cholesterol (TCH) and alanine aminotransferase (ALT). Serum ALT, TCH, FFA, and TG levels were significantly lower in HFD-fed Bcl3-KO mice compared to HFD-fed WT mice (Figure 2E–H). The data suggest that Bcl3-KO mice are resistant to the hepatic steatosis on HFD.
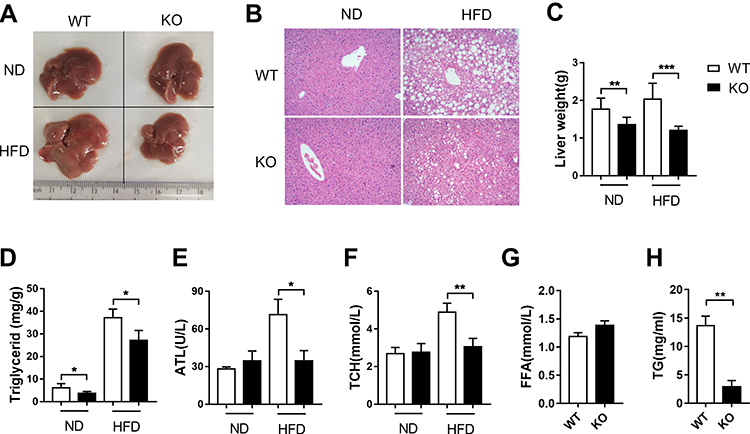 |
Figure 2 Hepatic steatosis was decreased in Bcl3-KO mice. Notes: Murine liver tissues were retrieved after 16 weeks of ND or HFD feeding. (A) Liver image. (B) Microscope image of representative liver sections with H&E staining. (C) Liver weight. (D) Triglyceride in liver tissue. (E) Plasma levels of ALT,(F) TCH, (G) FFA and (H) TG in WT and Bcl3-KO mice. Data in A-H represent means of n=5–8 mice/group ±SEM. *p < 0.05, **p < 0.01, ***p < 0.001 for Bcl3-KO versus WT mice. |
Bcl3 Deletion Protects Against HFD-Induced Systemic Insulin Resistance
Obesity impairs glucose metabolism in the body. Insulin regulates glucose metabolism in the liver by promoting lipogenesis and glycogen synthesis, while repressing glucose synthesis, gluconeogenesis and glycogenolysis. In the present study, we assessed glucose homeostasis in ND and HFD-fed Bcl3-KO and WT mice. No changes in fasting glucose or insulin tolerance and glucose tolerance were found in the lean ND-fed mice between genotypes (Figures 3A, C and E). On the other hand, on the HFD, fasting glucose levels were lowered in Bcl3-KO mice (Figure 3E). Furthermore, HFD-fed Bcl3-KO mice showed improved glucose tolerance and an enhanced hypoglycemic response to injected insulin compared to HFD-fed WT mice (Figure 3A and C). We calculated the area under the curve in Figure 3A and B to more directly reflect the differences in insulin sensitivity and glucose tolerance of the two genotype mice under different dietary conditions (Figure 3B and D). The decreased serum total TG suggested that Bcl3-KO mice had a protective effect on insulin resistance induced by HFD. These improved values became comparable to the results in ND-fed mice. To measure in vivo insulin action, we harvested adipose and liver tissue. Consistent with the ITTs and GTTs, insulin-stimulated Akt phosphorylation was significantly higher in liver and adipose tissue of Bcl3-KO mice than WT mice (Figure 3F and G). Taken together. These results show that deletion of Bcl3 leads to a marked improvement in systemic insulin resistance due to enhanced adipose and liver insulin sensitivity.
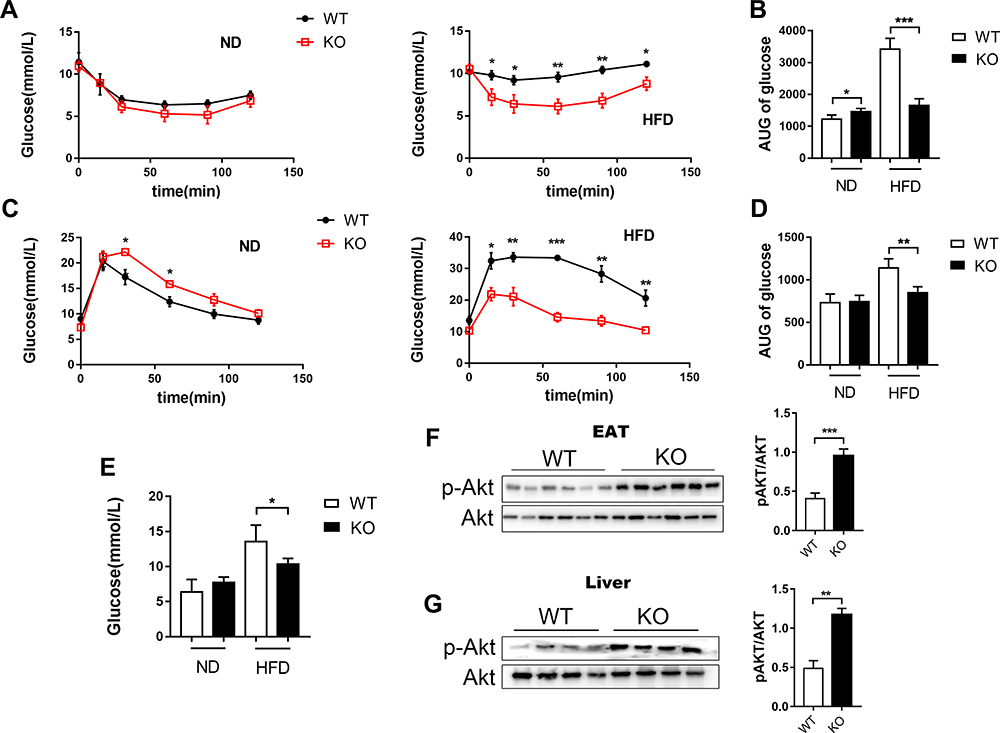 |
Figure 3 Improved glucose metabolism and insulin sensitivity in Bcl3-KO mice. Notes: (A) Serial changes in glucose levels after intraperitoneal injection of insulin in WT and Bcl3-KO mice and (B) area under the curve (AUC) at 16 weeks for ND and HFD. (C) Serial changes in glucose levels after intraperitoneal injection of glucose in WT and Bcl3-KO mice and (D) area under the curve (AUC) at 16 weeks for ND and HFD. (E) Fasting blood glucose levels. (F) Western blot analysis of insulin-stimulated phospho-Akt S473 (pS473AKT) in EAT. (G) Insulin-stimulated pS473AKT in liver. Data in A-E represent means of n=5 mice/group ±SEM. *p < 0.05, **p < 0.01, ***p < 0.001 for Bcl3-KO versus WT mice. |
Bcl3 Deletion Improves Adipocyte Hypertrophy Induced by HFD
In obesity, adipose tissue enlarges in order to store excess energy, and this is mainly driven by adipocyte hypertrophy. In appearance, the EAT of obese WT mice was significantly more than that of obese Bcl3-KO mice (4A). We studied the adipocyte architecture of HFD obese Bcl3-KO and WT mice. Interestingly, adipocytes from Bcl3-KO mice were smaller with a lower average cell size than WT mice (Figure 4B and C). On the other hand, an increase in adipocyte number was observed in HFD Bcl3-KO compared to WT mice (Figure 4C). To explain this phenotype, we measured adipocyte differentiation rate in isolated EMSC from Bcl3-KO and WT mice. Previous studies established and characterized EMSC have the characteristics of stem cells, including the ability to self-renewal and to differentiate into various types of cells.17–19 As showed in Figure 4E, EMSC from WT mice differentiated into adipocytes faster than EMSC from Bcl3-KO mice, as evident by Oil red O staining (Figure 4E). Bcl3-KO mice fed with HFD exhibited lower adiponectin levels and lower leptin levels (Figure 4D). Adiponectin and leptin are known important adipokines produced by functional adipocytes, and their expression levels are closely related to adipocyte function. Taken together, these results suggest that Bcl3 deletion can protect against the adipocyte hypertrophy in EAT of obese WT mice and decelerate adipocyte differentiation and improve adipose tissue function in obese mice.
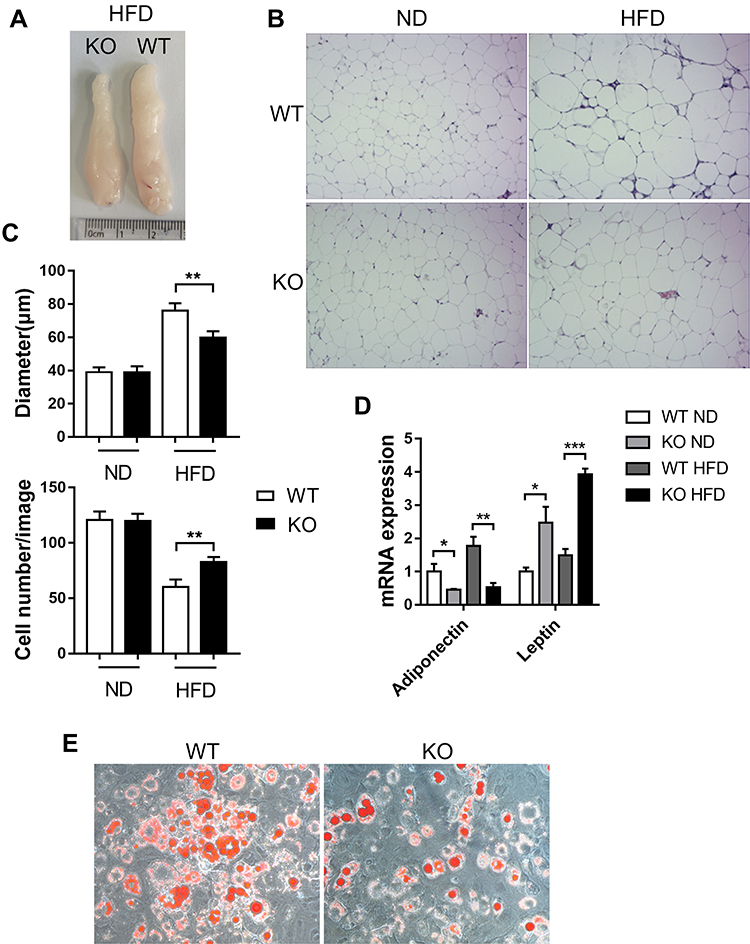 |
Figure 4 Improved adipocyte hypertrophy and improved adipocyte function in the absence of BCL3. Notes: Adipose tissues (EAT) were retrieved after 16 weeks of ND or HFD feeding. (A) EAT image. (B) Representative H&E staining images of EAT of WT and Bcl3-KO ND-fed or HFD-fed mice. (C) Quantification of adipocyte number per image and area (μM). (D) mRNA levels of adiponectin and leptin in EAT from WT and Bcl3-KO mice. (E) Adipogenic potentials of WT versus Bcl3-KO ear mesenchymal stem cells (EMSC). Data in A-E represent means of n=4–6 mice/group ±SEM. *p < 0.05, **p < 0.01, ***p < 0.001 for Bcl3-KO versus WT mice. |
Bcl3 Deletion Decreased the Expression of Key Lipogenic Enzymes
In order to examine the mechanisms of moderated hepatic steatosis and adipocyte hypertrophy, we next explored the expression of key lipogenic enzymes including fatty acid synthase (FAS), acetyl CoA carboxylase (ACC), phospho-acetyl-CoA carboxylase (pACC) and sterol regulatory element-binding protein (SREBP1). Under the condition of ND, there was no significant difference in the expression of adipogenic enzyme in Bcl3-KO mice (Figure 5A and B). However, pACC, FAS and SREBP1 were significantly decreased in obesity Bcl3-KO mice compared with obese WT mice (Figure 5C and D). In parallel, regulators of hepatic lipid clearance and export were enhanced in HFD-fed Bcl3-KO mice. SREBP1 is synthesized as an inactive precursor that binds to the endoplasmic reticulum (ER). In response to insulin signalling, SREBP1 is transported from the ER to the Golgi, processed by proteases in the Golgi, and then shuttled to the nucleus to induce lipogenic gene expression. On the basis of these results, we checked HFD mice nuclear SREBP1 protein levels. In Bcl3-KO mice fed with high-fat diets, the active, nuclear-localized SREBP1 (nSREBP1) was significantly increased (Figure 5E). The expression of carnitine palmitoyltransferase 1A (CPT1A) was significantly increased implying an improvement of the mitochondrial fatty acid β-oxidation (Figure 5C and D). These data suggest that BCL3 deficiency may reduce fat accumulation by decreased de novo lipogenesis and increased β-oxidation of fatty acids.
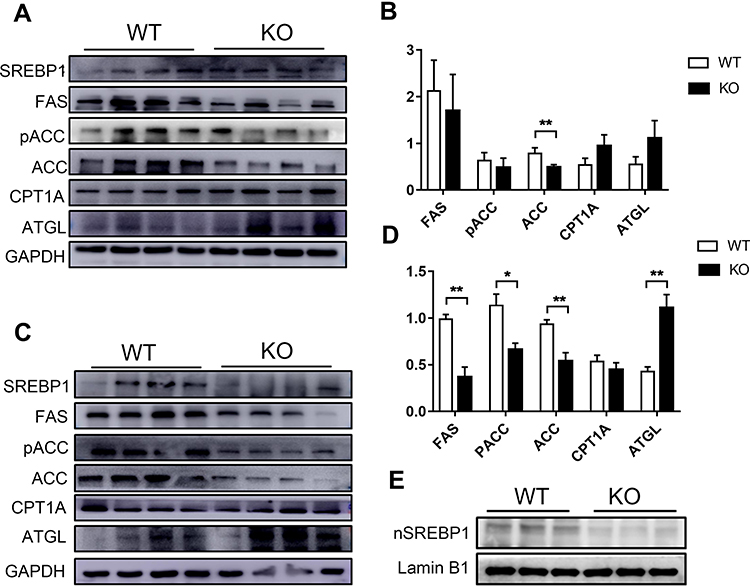 |
Figure 5 Down-regulation of lipid synthesis in Bcl3-KO mice. Notes: (A) Western blot analysis of SREBP1, FAS, pACC, ACC, CPT1, ATGL protein expression in WT and Bcl3-KO ND-fed mice and (B) quantitative. (C) Western blot analysis of SREBP1, FAS, pACC, ACC, CPT1, ATGL protein expression in WT and Bcl3-KO HFD-fed mice and (D) quantitative. (E) Western blot analysis of nuclear-localized SREBP1 (nSREBP1) in WT and Bcl3-KO HFD-fed mice. Data in B and D represent means of n=4 mice/group ± SEM. *p < 0.05, **p < 0.01 for Bcl3-KO versus WT mice. |
Decreased Macrophage Infiltration and Inflammation in EAT and Liver of Bcl3-KO Mice
Large of adipose tissue macrophages (ATMs) accumulate in EAT and liver of obese, leading to the development of chronic inflammation. Accordingly, flow cytometry analysis from EAT showed less accumulation of M1-like macrophages in Bcl3-KO adipose tissue compared to WT mice (Figure 6E), as we know, M1-like macrophages that are highly pro-inflammatory. This was consistent with a lower number of crown-like structures as measured by F4/80 immunohistochemical staining in liver from Bcl3-KO than WT mice (Figure 6A). Next, we explored macrophage polarization in liver, the mRNA expressions of M1 macrophage markers, including IL-6 and IL-1β, and M2 macrophage makers, including Arg1 and CD206 were assessed with qRT-PCR. As shown in Figure 6B and C, BCL3 KO suppressed M1 macrophage marker expression and increased M2 macrophage marker expression. Furthermore, there was reduced expression of pro-inflammatory genes in EAT from Bcl3-KO mice as measured by qPCR analysis (Figure 6D). It is well known that activation of the NF-κB pathway is closely related to the expression of inflammatory factors, and previous studies have shown that BCL3 can bind to P50 to affect the activation of the NF-κB pathway. Therefore, we measured the expression of P50 in the liver and adipose tissue of obese mice, and the results showed that the expression of P50 protein in Bcl3-KO mice was increased (Figure 6F). Taken together, these results suggest that Bcl3 deletion leads to decrease secretion of chemokine and inflammatory cytokines from adipocytes and hepatocytes, causing reduced M1-like macrophage content and decreased inflammation and contributing to improved insulin sensitivity.
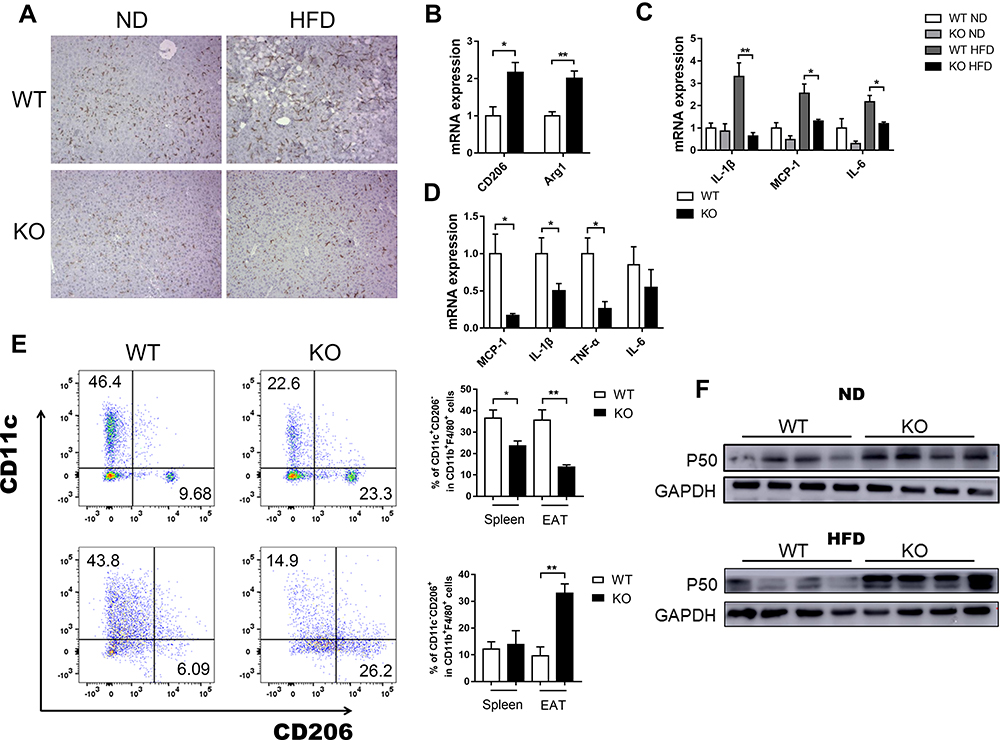 |
Figure 6 Decreased adipose and liver tissue inflammation in Bcl3-KO Mice. Notes: (A) F4/80 immuno-staining in liver. (B) RT-PCR analysis for mRNA expression of CD206, Arg1 in liver. (C) RT-PCR analysis for pro-inflammatory cytokine mRNA expression of IL-1β, MCP-1, IL-6 in liver. (D) RT-PCR analysis for pro-inflammatory cytokine mRNA expression of IL-1β, MCP-1, TNF-α, IL-6 in EAT. (E) Representative flow cytometry analysis of macrophage subtype in spleen and EAT. (F) Western blot analysis of P50 protein expression in WT and Bcl3-KO ND-fed and HFD-fed mice. Data in A-D represent means of n=5–7 mice/group ±SEM. *p < 0.05, **p < 0.01 for Bcl3-KO versus WT mice. |
Discussion
Very little is known about the function of BCL3 in adipocyte biology and nothing has been reported, as far as we know, in the setting of obesity and hepatic steatosis. Here, we have generated Bcl3-KO mice and have performed detailed studies revealing that BCL3 is a critical physiological regulator of lipid metabolism, insulin sensitivity and hepatic steatosis. To further explore the role of BCL3, mice were exposed to a high-fat diet. We find that deletion of Bcl3 protects mice from HFD-induced obesity and fatty liver disease in vivo. This was accompanied by improved insulin resistance and glucose intolerance, reduced ATM content, and decreased inflammatory signaling in adipose and liver tissue.
In order to further explore the mechanism of the occurrence of this phenotype, we measured the key lipogenic enzymes including FAS, ACC and pACC and fatty acid oxidation enzymes such as CPT1A and ATGL were examined. SREBP1 is an important nuclear transcription factor in animal fat metabolism, and is synthesized as an inactive precursor that binds to the endoplasmic reticulum (ER). In response to insulin signaling, SREBP1 is transported from the endoplasmic reticulum to the Golgi in a coat protein complex II(COPII)-dependent manner, processed by proteases in the Golgi, once SREBP1 is activated, the mature (sheared) protein translocates to the nucleus to induce lipid-producing gene expression, such as FAS.9 In mice with non-alcoholic fatty liver disease, the activity of the SREBP1/FAS pathway is significantly increased, leading to the progression of hepatic steatosis.20,21 Overexpression of SREBP1 in obese WT mice leads to disorders of glucose and lipid metabolism, leading to increased lipid production. Reduced utilization of fatty acids and accumulation of toxic lipid compounds in the liver are key steps to increase susceptibility to liver injury.22 FAS-dependent de novo lipogenesis is essential for the activation of macrophages and CD8+ cells, which will directly affect the inflammatory response and the formation of inflammatory mediators.23,24 Our results showed that the SREBP1, FAS and ACC genes related to liver triglyceride production of Bcl3-KO were relatively reduced, while the expressions of ATGL related to triglyceride output were increased in these mice. This leads to reduced triglyceride levels in the body, which in turn shows weight loss, reduced hepatic steatosis, and changes in the size of adipocyte. For another, NF-κB P65 phosphorylation is positively correlated with SREBP1 levels. These seem to indicate that SREBP1 expression is associated with NF-κB pathway mediated validation. In our experiment, NF-kB P50 protein level was negatively correlated with SREBP1, but the specific mechanism is still unknown.
In vitro BCL-3 was identified to influence inflammatory and energy metabolism in cardiomyocytes.25 In a study by Nadine, specific overexpression of BCL3 in the liver exacerbated hepatic steatosis through PPARs and PGC-1α.26 But this was limited to the role of BCL3 in the liver, and there were no data on the deletion of the Bcl3 gene. Role of BCL3 in adipocyte biology is poorly understood. We found that deletion of Bcl3 in vivo protects mice from high-fat induced adipose tissue hypertrophy. Studies have shown that adipocyte size is negatively correlated with insulin sensitivity.27 H&E staining showed that the volume of Bcl3-KO adipocytes was smaller than that of WT mice. The reduction of Bcl3-KO adipocyte tissue and the decrease of adipocyte volume may be due to the lower adipocyte differentiation rate observed in EMSCs isolated from Bcl3-KO mice. Previous studies have shown that EMSCs are stem cells with multidirectional differentiation potential.28 For many years, adipose tissue has been considered as an energy storage organ, but now it is also considered to have endocrine function, which plays an endocrine function through the synthesis and secretion of many adipokines, such as adiponectin and leptin.29,30 Adipokines act not only in adipose tissue but also in distant organs and tissues.11 Leptin is produced by adipocytes and is responsible for regulating energy balance. Lipid metabolism may also be affected by leptin.31–33 In vitro administration of leptin resulted in a decrease in triglyceride content in adipose and non-adipose tissues, and reduced plasma triglyceride and free fatty acid concentrations in rats.34,35 In the study of Schulz et al, intranasal administration of leptin resulted in significant weight loss and adipose tissue loss in diet-induced obese rats.36 In our experiment, a high-fat diet significantly increased leptin levels in adipose tissue of mice, and the loss of adipose tissue and body weight in obese Bcl3-KO mice may be related to the elevated leptin levels in adipose tissue.
During the development of obesity, chronic, low-grade inflammation is induced in adipose tissue.37,38 Increased adipose tissue inflammation stimulates adipocyte lipolysis and tissue fibrosis, and thus led to increases in metabolic abnormalities. Inflammation caused by apoptosis of liver cells and adipocytes is a key driver of disease progression and promotes further amplification of inflammation in non-alcoholic fatty liver disease and adipose tissue.39 BCL3 has previously been considered as a major negative regulator of pro-inflammatory cytokines expressed by inflammatory cells. Collins et al found that the interaction between BCL3 and P50 is a necessary and sufficient condition for the anti-inflammatory properties of BCL3.40 However, our study found that Bcl3 knockout alleviated inflammation by down-regulating the expression of IL-1β, TNF-α, and IL-6 in liver and adipose tissue of high-fat fed mice. They are released by liver cells and fat cells, as well as by inflammatory cells, and promote lipid accumulation by impaling insulin signaling. In liver tissue, IL-6 inhibits the expression of insulin receptor and reduces adipogenesis and adiponectin levels.41,42 The expression of MCP-1 was decreased in liver and adipose tissue of obese Bcl3-KO mice. MCP-1 is mainly secreted by intrahepatic macrophages and promotes liver lipid accumulation by increasing lipid synthesis and inhibiting lipid outflow.43 In addition, macrophages enter the liver and adipose tissue through MCP-1, which is particularly evident in obese Bcl3-KO mice.44 Decreased infiltration of macrophages in the liver and adipose tissue of Bcl3-KO mice may be caused by the decreased expression of MCP-1, but the underlying mechanism needs to be further explored. These data suggest that BCL3 deficiency leads to reduced chemokine secretion in liver and adipose tissue, resulting in reduced ATM content and reduced inflammatory response. The anti-inflammatory phenotype in Bcl3-KO mice was further studied. The expression level of P50 protein in the liver was measured by WB, and the results showed that the expression level of P50 in Bcl3-KO mice was increased, and the difference was more obvious in the obese mice. As P50 is a key inhibitor of NF-κB pathway,45,46 it is reasonable to speculate that the Bcl3 gene knockout may increase the expression of P50 protein, or decrease the decomposition of P50, resulting in the increase of P50 content in vivo, and the increased P50 binds to DNA to inhibit the activation of NF-κB. In turn, it leads to the decrease of downstream inflammatory factors, and alleviates the systemic chronic low-grade inflammation in obese mice.
In conclusion, we identified BCL3 as a potential regulator in fatty acid synthesis through its effects on lipid metabolism in liver and adipose tissue involving (1) key lipogenic enzymes including SREBP1 and FAS and (2) the remission of hepatic and adipose inflammation. Hepatocyte damage and increased systemic inflammation caused by ectopic storage of triglycerides further lead to insulin resistance. However, the specific mechanism is still unknown and needs to be further studied.
Funding
This work was funded by the National Natural Science Foundation of China (Grant No. 81871309, U1804190) and the 111 Project (D20036, China) to Hui Wang.
Disclosure
The authors declare no conflicts of interest for this work.
References
1. Samson R, Ayinapudi K, Le Jemtel TH, Oparil S. Obesity, hypertension, and bariatric surgery. Curr Hypertens Rep. 2020;22(7):46. doi:10.1007/s11906-020-01049-x
2. Shaunak M, Byrne CD, Davis N, Afolabi P, Faust SN, Davies JH. Non-alcoholic fatty liver disease and childhood obesity. Arch Dis Child. 2021;106(1):3–8. doi:10.1136/archdischild-2019-318063
3. Wang H, Ye J. Regulation of energy balance by inflammation: common theme in physiology and pathology. Rev Endocr Metab Disord. 2015;16(1):47–54. doi:10.1007/s11154-014-9306-8
4. Unamuno X, Gomez-Ambrosi J, Rodriguez A, Becerril S, Fruhbeck G, Catalan V. Adipokine dysregulation and adipose tissue inflammation in human obesity. Eur J Clin Invest. 2018;48(9):e12997. doi:10.1111/eci.12997
5. Francisco V, Pino J, Gonzalez-Gay MA, et al. Adipokines and inflammation: is it a question of weight? Br J Pharmacol. 2018;175(10):1569–1579. doi:10.1111/bph.14181
6. Kang YE, Kim JM, Joung KH, et al. The Roles of Adipokines, Proinflammatory Cytokines, and Adipose Tissue Macrophages in Obesity-Associated Insulin Resistance in Modest Obesity and Early Metabolic Dysfunction. PLoS One. 2016;11(4):e0154003. doi:10.1371/journal.pone.0154003
7. Dumas K, Ayachi C, Gilleron J, et al. REDD1 deficiency protects against nonalcoholic hepatic steatosis induced by high-fat diet. FASEB J. 2020;34(4):5046–5060. doi:10.1096/fj.201901799RR
8. Xie Z, Gao G, Wang H, et al. Dehydroabietic acid alleviates high fat diet-induced insulin resistance and hepatic steatosis through dual activation of PPAR-gamma and PPAR-alpha. Biomed Pharmacother. 2020;127:110155. doi:10.1016/j.biopha.2020.110155
9. Oishi Y, Spann NJ, Link VM, et al. SREBP1 Contributes to Resolution of Pro-inflammatory TLR4 Signaling by Reprogramming Fatty Acid Metabolism. Cell Metab. 2017;25(2):412–427. doi:10.1016/j.cmet.2016.11.009
10. An JP, Choi JH, Huh J, et al. Anti-hepatic steatosis activity of Sicyos angulatus extract in high-fat diet-fed mice and chemical profiling study using UHPLC-qTOF-MS/MS spectrometry. Phytomedicine. 2019;63:152999. doi:10.1016/j.phymed.2019.152999
11. Li Y, Xu S, Mihaylova MM, et al. AMPK phosphorylates and inhibits SREBP activity to attenuate hepatic steatosis and atherosclerosis in diet-induced insulin-resistant mice. Cell Metab. 2011;13(4):376–388. doi:10.1016/j.cmet.2011.03.009
12. Wang VY, Li Y, Kim D, et al. Bcl3 Phosphorylation by Akt, Erk2, and IKK Is Required for Its Transcriptional Activity. Mol Cell. 2017;67(3):484–97 e5. doi:10.1016/j.molcel.2017.06.011
13. Wang J, Niu Z, Shi Y, et al. Bcl-3, induced by Tax and HTLV-1, inhibits NF-kappaB activation and promotes autophagy. Cell Signal. 2013;25(12):2797–2804. doi:10.1016/j.cellsig.2013.09.010
14. Wang J, Li J, Huang Y, et al. Bcl-3 suppresses Tax-induced NF-kappaB activation through p65 nuclear translocation blockage in HTLV-1-infected cells. Int J Oncol. 2013;42(1):269–276. doi:10.3892/ijo.2012.1685
15. Song L, Wormann S, Ai J, et al. BCL3 Reduces the Sterile Inflammatory Response in Pancreatic and Biliary Tissues. Gastroenterology. 2016;150(2):499–512 e20. doi:10.1053/j.gastro.2015.10.017
16. Zhu X, Guo X, Mao G, et al. Hepatoprotection of berberine against hydrogen peroxide-induced apoptosis by upregulation of Sirtuin 1. Phytother Res. 2013;27(3):417–421. doi:10.1002/ptr.4728
17. Gawronska-Kozak B. Regeneration in the ears of immunodeficient mice: identification and lineage analysis of mesenchymal stem cells. Tissue Eng. 2004;10(7–8):1251–1265. doi:10.1089/ten.2004.10.1251
18. Gawronska-Kozak B, Manuel JA, Prpic V. Ear mesenchymal stem cells (EMSC) can differentiate into spontaneously contracting muscle cells. J Cell Biochem. 2007;102(1):122–135. doi:10.1002/jcb.21286
19. Rim JS, Mynatt RL, Gawronska-Kozak B. Mesenchymal stem cells from the outer ear: a novel adult stem cell model system for the study of adipogenesis. FASEB J. 2005;19(9):1205–1207. doi:10.1096/fj.04-3204fje
20. la Fuente FP, Quezada L, Sepulveda C, et al. Exercise regulates lipid droplet dynamics in normal and fatty liver. Biochim Biophys Acta Mol Cell Biol Lipids. 2019;1864(12):158519. doi:10.1016/j.bbalip.2019.158519
21. Fang K, Wu F, Chen G, et al. Diosgenin ameliorates palmitic acid-induced lipid accumulation via AMPK/ACC/CPT-1A and SREBP-1c/FAS signaling pathways in LO2 cells. BMC Complement Altern Med. 2019;19(1):255. doi:10.1186/s12906-019-2671-9
22. Neuschwander-Tetri BA. Hepatic lipotoxicity and the pathogenesis of nonalcoholic steatohepatitis: the central role of nontriglyceride fatty acid metabolites. Hepatology. 2010;52(2):774–788. doi:10.1002/hep.23719
23. Everts B, Amiel E, Huang SC, et al. TLR-driven early glycolytic reprogramming via the kinases TBK1-IKKvarepsilon supports the anabolic demands of dendritic cell activation. Nat Immunol. 2014;15(4):323–332. doi:10.1038/ni.2833
24. Carroll RG, Zaslona Z, Galvan-Pena S, et al. An unexpected link between fatty acid synthase and cholesterol synthesis in proinflammatory macrophage activation. J Biol Chem. 2018;293(15):5509–5521. doi:10.1074/jbc.RA118.001921
25. Yang J, Williams RS, Kelly DP. Bcl3 interacts cooperatively with peroxisome proliferator-activated receptor gamma (PPARgamma) coactivator 1alpha to coactivate nuclear receptors estrogen-related receptor alpha and PPARalpha. Mol Cell Biol. 2009;29(15):4091–4102. doi:10.1128/MCB.01669-08
26. Gehrke N, Worns MA, Huber Y, et al. Hepatic B cell leukemia-3 promotes hepatic steatosis and inflammation through insulin-sensitive metabolic transcription factors. J Hepatol. 2016;65(6):1188–1197. doi:10.1016/j.jhep.2016.06.026
27. Ezeh U, Chen IY, Chen YH, Azziz R. Adipocyte Insulin Resistance in PCOS: relationship With GLUT-4 Expression and Whole-Body Glucose Disposal and beta-Cell Function. J Clin Endocrinol Metab. 2020;105(7):548.
28. Staszkiewicz J, Gimble JM, Manuel JA, Gawronska-Kozak B. IFATS collection: stem cell antigen-1-positive ear mesenchymal stem cells display enhanced adipogenic potential. Stem Cells. 2008;26(10):2666–2673. doi:10.1634/stemcells.2008-0270
29. Liu H, Wu X, Luo J, et al. Adiponectin peptide alleviates oxidative stress and NLRP3 inflammasome activation after cerebral ischemia-reperfusion injury by regulating AMPK/GSK-3beta. Exp Neurol. 2020;329:113302. doi:10.1016/j.expneurol.2020.113302
30. Yu H, Chhabra KH, Thompson Z, et al. Hypothalamic POMC deficiency increases circulating adiponectin despite obesity. Mol Metab. 2020;35:100957. doi:10.1016/j.molmet.2020.01.021
31. Pereira S, Cline DL, Glavas MM, Covey SD, Kieffer TJ. Tissue-Specific Effects of Leptin on Glucose and Lipid Metabolism. Endocr Rev. 2021;42(1):1–28.
32. Wu L, Li H, Xu W, et al. Dissimilar regulation of glucose and lipid metabolism by leptin in two strains of gibel carp (Carassius gibelio). Br J Nutr. 2020;2:1–15.
33. Tiliscan C, Arama V, Mihailescu R, et al. Association of adiponectin/leptin ratio with carbohydrate and lipid metabolism parameters in HIV-infected patients during antiretroviral therapy. Endocr Res. 2018;43(3):149–154. doi:10.1080/07435800.2018.1439058
34. Jiang L, Su H, Wu X, et al. Leptin receptor-expressing neuron Sh2b1 supports sympathetic nervous system and protects against obesity and metabolic disease. Nat Commun. 2020;11(1):1517. doi:10.1038/s41467-020-15328-3
35. Yao H, Fan C, Fan X, et al. Effects of gut microbiota on leptin expression and body weight are lessened by high-fat diet in mice. Br J Nutr. 2020;124(4):396–406. doi:10.1017/S0007114520001117
36. Schulz C, Paulus K, Johren O, Lehnert H. Intranasal leptin reduces appetite and induces weight loss in rats with diet-induced obesity (DIO). Endocrinology. 2012;153(1):143–153. doi:10.1210/en.2011-1586
37. Hotamisligil GS. Inflammation and metabolic disorders. Nature. 2006;444(7121):860–867. doi:10.1038/nature05485
38. Olefsky JM, Glass CK. Macrophages, inflammation, and insulin resistance. Annu Rev Physiol. 2010;72:219–246. doi:10.1146/annurev-physiol-021909-135846
39. Fischer IP, Irmler M, Meyer CW, et al. A history of obesity leaves an inflammatory fingerprint in liver and adipose tissue. Int J Obes. 2018;42(3):507–517. doi:10.1038/ijo.2017.224
40. Collins PE, Kiely PA, Carmody RJ. Inhibition of transcription by B cell Leukemia 3 (Bcl-3) protein requires interaction with nuclear factor kappaB (NF-kappaB) p50. J Biol Chem. 2014;289(10):7059–7067. doi:10.1074/jbc.M114.551986
41. Lehrskov LL, Christensen RH. The role of interleukin-6 in glucose homeostasis and lipid metabolism. Semin Immunopathol. 2019;41(4):491–499. doi:10.1007/s00281-019-00747-2
42. Gavito AL, Bautista D, Suarez J, et al. Chronic IL-6 Administration Desensitizes IL-6 Response in Liver, Causes Hyperleptinemia and Aggravates Steatosis in Diet-Induced-Obese Mice. PLoS One. 2016;11(6):e0157956. doi:10.1371/journal.pone.0157956
43. Clement S, Juge-Aubry C, Sgroi A, et al. Monocyte chemoattractant protein-1 secreted by adipose tissue induces direct lipid accumulation in hepatocytes. Hepatology. 2008;48(3):799–807. doi:10.1002/hep.22404
44. Ji X, Yang L, Zhang Z, et al. Sphingosine 1-phosphate/microRNA-1249-5p/MCP-1 axis is involved in macrophage-associated inflammation in fatty liver injury in mice. Eur J Immunol. 2020;50(11):1746–1756. doi:10.1002/eji.201948351
45. Kravtsova-Ivantsiv Y, Goldhirsh G, Ivantsiv A, et al. Excess of the NF-kB p50 subunit generated by the ubiquitin ligase KPC1 suppresses tumors via PD-L1- and chemokines-mediated mechanisms. Proc Natl Acad Sci U S A. 2020;117(47):29823–29831. doi:10.1073/pnas.2019604117
46. Hu B, Wei H, Song Y, et al. NF-kappaB and Keap1 Interaction Represses Nrf2-Mediated Antioxidant Response in Rabbit Hemorrhagic Disease Virus Infection. J Virol. 2020;94(10):86. doi:10.1128/JVI.00016-20
 © 2021 The Author(s). This work is published and licensed by Dove Medical Press Limited. The full terms of this license are available at https://www.dovepress.com/terms.php and incorporate the Creative Commons Attribution - Non Commercial (unported, v3.0) License.
By accessing the work you hereby accept the Terms. Non-commercial uses of the work are permitted without any further permission from Dove Medical Press Limited, provided the work is properly attributed. For permission for commercial use of this work, please see paragraphs 4.2 and 5 of our Terms.
© 2021 The Author(s). This work is published and licensed by Dove Medical Press Limited. The full terms of this license are available at https://www.dovepress.com/terms.php and incorporate the Creative Commons Attribution - Non Commercial (unported, v3.0) License.
By accessing the work you hereby accept the Terms. Non-commercial uses of the work are permitted without any further permission from Dove Medical Press Limited, provided the work is properly attributed. For permission for commercial use of this work, please see paragraphs 4.2 and 5 of our Terms.