Back to Journals » Journal of Inflammation Research » Volume 15
TLR3 Expression is a Potential Prognosis Biomarker and Shapes the Immune-Active Tumor Microenvironment in Esophageal Squamous Cell Carcinoma
Authors Su R, Cai L, Xiong P, Liu Z, Chen S, Liu X, Lin R, Lei Z, Tian D, Su M
Received 26 November 2021
Accepted for publication 2 February 2022
Published 28 February 2022 Volume 2022:15 Pages 1437—1456
DOI https://doi.org/10.2147/JIR.S348786
Checked for plagiarism Yes
Review by Single anonymous peer review
Peer reviewer comments 3
Editor who approved publication: Professor Ning Quan
Ruibing Su,1,* Lijun Cai,1,* Pan Xiong,1,* Zhiwei Liu,1,* Shaobin Chen,2 Xi Liu,1 Runhua Lin,1 Zhijin Lei,1 Dongping Tian,1 Min Su1
1Institute of Clinical Pathology, Department of Pathology, Shantou University Medical College, Shantou, Guangdong, People’s Republic of China; 2Department of Thoracic Surgery, Cancer Hospital of Shantou University Medical College, Shantou, Guangdong, People’s Republic of China
*These authors contributed equally to this work
Correspondence: Min Su, Institute of Clinical Pathology, Department of Pathology, Shantou University Medical College, No. 22 Xinling Road, Shantou, Guangdong, People’s Republic of China, Tel/Fax +86-754-88900429, Email [email protected]
Background: Toll-like receptor 3 (TLR3) not only plays a crucial role in innate immune and inflammation but also in anti-cancer immunity. Nevertheless, the clinicopathological outcome of TLR3 in ESCC is still ambiguous.
Methods: Immunohistochemistry was performed to investigate TLR3 expression and its impact on survival in 137 ESCC patients (including paired esophageal tissues with different stages of early lesions from 37 patients). Furthermore, we downloaded ESCC RNA-seq datasets (including phenotype and survival data) from The Cancer Genome Atlas (TCGA). The relationship between TLR3 and prognosis, biological landscape, and immune infiltration was assessed to verify the immunohistochemical results of our tissue samples, explore the possible mechanism of prognostic outcomes, and predict the sensitivity of immunotherapy.
Results: TLR3 protein expression displayed an increasing trend in the progression through different grades of cellular atypia, from normal, esophageal simple hyperplasia (ESSH), intraepithelial neoplasia (IEN) to ESCC (P < 0.0083). TLR3 protein had a positive association with inflammation level (Rho = 0.341, P < 0.001). TLR3 mRNA expression was significantly higher in comparison to adjacent normal tissues (P < 0.001). Cox regression analysis indicated high TLR3 protein and mRNA expression conferred good prognosis in our samples and TCGA, especially for advanced ESCC patients (TNM stage III and IV). Overexpression of TLR3 resulted in an immune-active microenvironment via the recruitment of immune-active cells including cytotoxic lymphocytes (CTLs), CD8+ T cells, NK cells, dendritic cells, and M1-type macrophages. TLR3 expression was correlated with the pro-inflammatory cytokines and chemokines relating to anti-tumor immunity. Moreover, GSEA analysis indicated upregulated expression of TLR3 could activate the apoptotic pathway.
Conclusion: High TLR3 expression in ESCC patients was associated with a more favorable prognosis, immune-active cell infiltration, and an activated apoptotic pathway. TLR3 has potential applications for immunotherapy and immune response prediction in patients with ESCC.
Keywords: esophageal squamous cell carcinoma, TLR3, prognosis, immune infiltrates, immunotherapy response
Introduction
Esophageal squamous cell carcinoma (ESCC), accounting for about 90% of esophageal cancer (ESCA) cases worldwide, is one of the most common and mortal tumors, especially in East Asia.1,2 ESCC ranked sixth and fourth, respectively, for morbidity and mortality among all malignant tumors in China.3 However, among the common tumor types, research on ESCC is comparatively insufficient. Despite the advanced development of endoscopic technology in recent years, early diagnosis and therapeutics remain limited for ESCC patients, with a large proportion of tumors being unresectable or have already metastasized when diagnosis and a 5-year survival rate of only approximately 20% in most countries.4,5
Toll-like receptors (TLRs) are a family of transmembrane receptors that recognize a variety of pathogens, play a vital role in inflammation related to molecular patterns, and have been confirmed to be related to tumor progression or regression, depending on the TLRs and cancer types.6,7 Toll-like receptor 3 (TLR3), as one of the essential members in TLRs, participates in the carcinogenesis of a variety of tumors.8,9 TLR3 is expressed in normal epithelial cells, immune cells and cancer cells and recognized as a prognostic biomarker in certain cancers, such as gastric cancer, hepatocellular carcinoma, lung adenocarcinoma, renal cancer, and melanoma.10,11 Multiple researches have demonstrated that TLR3 agonists can activate specific immune reactivities in the mice tumor models and cancer patients, especially when combined with other treatments in the past few years.12,13 TLR3 agonists enhance T cell infiltration in cancer tissue to promote apoptosis and eliminate tumor cells8,14 and should be a suitable immune adjuvant of tumor vaccine to activate immunocompetent cells, overcome immunosuppressive tumor microenvironments (TMEs) and reconstruct TMEs, which can play an anti-tumor effect.15 A very recent clinical trial has shown that poly I:C, a drug of a TLR3 agonist, can increase serum IgG levels in ESCC patients. Nevertheless, in-depth assessments of the immune response, such as CD8+ T cell infiltration, were lacking.16
Tumor microenvironments (TMEs) are mainly composed of immune cells and stromal cells that contribute to the occurrence and progression of certain cancers.17 The presence of infiltrations or localization by specific tumor-infiltrating lymphocyte (TIL) subtypes (including CD8+ T cell, FOXP3+ Treg cell) has a bearing on the prognosis of ESCA patients.18,19 In contrast, it appears that other TIL subsets, including CD45RO+ or CD3+ T cells, were not correlated with patient survival.18 Moreover, in a recent study, only ESCA patients with higher lymphocyte infiltration in peritumoral tissue (peritumoral reactivity) experienced significantly longer overall survival (OS) than those with lower reactivity when evaluating components of lymphocytic reactions to tumors (including peritumoral, intraneural, lymphatic, and stromal reactions).20 NK cells and macrophages, innate immune cells, are promising effectors of cancer immunotherapy when presenting in TMEs as well.21–23
However, the association of TLR3 with ESCC prognosis is uncertain,11,24,25 and its relationship with immune infiltration has not been reported. The change in TLR3 expression during carcinogenesis of the esophageal epithelium from normal to dysplasia to tumorigenic has not yet been studied. Thus, the current study was conducted to examine TLR3 expression in different stages of early esophageal lesions and explore its clinicopathological and prognostic outcome for ESCC patients in TCGA and the Chaoshan district. We assessed the relationship between TLR3 and immune infiltration as well. Our results may provide additional evidence for TLR3 in association with immune infiltration and the role of immunotherapy for ESCC patients.
Materials and Methods
Patients and Sample Collection
A total of 137 ESCC patients without any preoperative treatment at the Cancer Hospital of Shantou University Medical College between 2012 and 2014 were included in this retrospective study. We separately sampled surgical specimens at various sites for identifying pathological lesions of different stages, including tumor tissue (ESCC), esophageal simple hyperplasia (ESSH), intraepithelial neoplasia (IEN), and normal tissue according to the previous sampling standards (Figure 1A).26 The histopathological diagnosis of each sample was verified by two expert pathologists according to the 8th Edition of the UICC-AJCC (Union for International Cancer Control-American Joint Committee on Cancer) staging system and the 5th Edition 2019 World Health Organization Classification of Tumors of the Digestive System.27,28 Moreover, we divided the inflammation degree of esophageal epithelium into four groups: none-inflammation (-), inflammation score (+), inflammation score (++) and inflammation score (+++) according to the density and affected areas of chronic inflammatory cells in HE staining based on previous studies.26 Among the 137 cases, we found that 37 patients had paired normal-ESSH-IEN-ESCC tissue and 50 paired normal-ESCC tissue. Detailed clinicopathological parameters for the cohort are shown in Table S1. The study was conducted in accordance with the principles of the Declaration of Helsinki and approved by the Ethics Committee of Shantou University Medical College (SUM-2015-15), and informed consents were obtained from patients or their families.
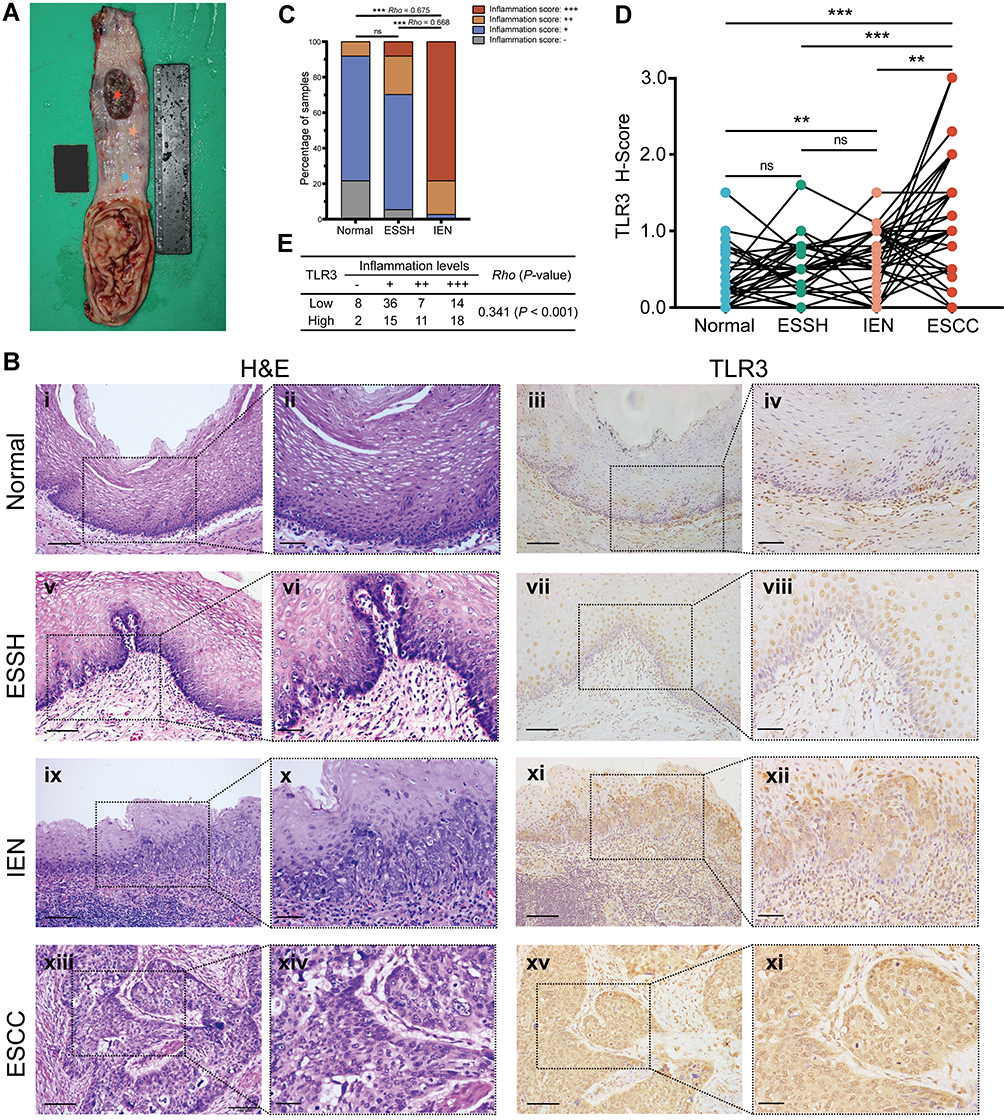 |
Figure 1 Inflammation levels and TLR3 protein expression in esophageal tissues at different pathologic stages. (A) Schematic diagram of esophageal tissues sampling. The stars in various colors from top to bottom in the esophageal mucosa represent respectively: esophageal squamous cell carcinoma (ESCC, inside tumor), tumor proximal tissue of early lesions for identifying esophageal squamous simple hyperplasia (ESSH) and intraepithelial neoplasia (IEN), and distant non-malignant tissue. (B) Microscopic images of esophageal tissues at different pathologic stages with different levels of inflammation and TLR3 protein expression, i–ii, Normal: rare inflammation; v–vi, ESSH: general mild inflammation; ix–x, IEN: common moderate or severe inflammation; xiii–xiv, ESCC. IHC showing TLR3 expression from normal (iii–iv), ESSH (vii–viii), IEN (xi–xii) to ESCC (xv-xvi). Scale bars:100 μm (i, iii, v, vii, ix, xi, xiii and xv) and 40 μm (ii, iv, vi, viii, x, xii, xiv, and xi). (C) Correlation between inflammation score and histologic types. Rho indicates Spearman rank correlation coefficient. (D) The protein expression levels of TLR3 in 37 paired esophageal tissues: Normal, ESSH, IEN, and ESCC samples. P < 0.0083 (α=0.05/6) was considered statistically significant in pairwise comparison. (E) Correlation between inflammation score and TLR3 H-score (the High and Low TLR3 groups are based on the ROC curve). **P < 0.01; *** P < 0.001; “ns” indicates no significance. |
Immunohistochemistry
Tissue block sections of four μm thick were first deparaffinized in xylene three times and then hydrated with a descending alcohol concentration. After treatment with 3% hydrogen peroxide for 15 minutes to inhibit endogenous peroxidase activity, antigen retrieval was performed with a pressure cooker, in which the sections were immersed in citrate buffer (pH 6.0) at 120°C, followed by cooling at room temperature and washing with phosphate-buffered saline (PBS). To block nonspecific staining, sections were incubated with 10% normal goat serum (ZLI-9022, ZSGB-BIO, Beijing, China). Next, the slides were set at 4°C overnight with a primary monoclonal antibody for TLR3 (1:150, NBP2-24875, mouse IgG1 kappa, Clone 40C1285.6, Novus Biologicals, USA). After washing with PBS, secondary antibodies (Kit-5010, MXB Biotechnologies, Fuzhou, China) were added for incubation at 37°C for 30 min and then visualized with diaminobenzidine (DAB, FL-6001-03, Long Island Antibody, Shanghai, China). Subsequently, the slides were counterstained with hematoxylin, followed by dehydration and mounting with cover glasses. We performed validation of the immunohistochemistry (IHC) with positive (placenta tissue, Figure S1.A) and negative controls (replacing the primary antibody with PBS or a mouse IgG isotype, Figure S1.B).
IHC was observed blindly by two independent pathologists. We performed the score of the TLR3 protein expression with a modified histo-score (H-score), which included a semiquantitative assessment of both the proportion of positive cells (0–100%) and intensity of staining.29,30 Defining the intensity score as strong (+3), moderate (+2), weak (+1), or no staining (-/negative, 0) (representative pictures are shown in Figure S2). Then the positive fraction scores and intensity grades were multiplied to get the H-score (0–3), representing the overall TLR3 expression level of each sample.
Expression Data in ESCC in TCGA
The RNA-Seq expression data and corresponding clinical and survival information for ESCC were extracted from the ESCA dataset (162 ESCA and 11 adjacent normal samples) in The Cancer Genome Atlas (TCGA, GDC V18.0, released on July 8, 2019), including 80 ESCC and 1 ESCC adjacent normal tissue. Due to there being only one ESCC-adjacent normal tissue sample in the TCGA-ESCA, the TLR3 differential expression analysis was performed on a combined cohort of TCGA and Genotype-Tissue Expression (GTEx) samples.
We also explored and visualized the relationship between TLR3 gene expression, gene copy number, DNA methylation levels and clinical data in ESCC patients on the MEXPRESS (https://mexpress.be/) website, a tool for the visualization of DNA methylation from TCGA data.
Gene–Gene Interaction (GGI) Networks and Functional Analysis
In this study, GeneMANIA (http://genemania.org/), GO (Gene Ontology) enrichment, and KEGG (Kyoto Encyclopedia of Genes and Genomes) pathway were used to search for co-expressed genes, construct gene–gene interaction networks, and analyze the functional pathway of co-expressed genes for ESCC in TCGA.31 We also performed functional analysis of the low and high TLR3 expression tumor samples with Gene Set Enrichment Analysis (GSEA, V 4.1.0), including hallmark, immunologic signature, and curated gene sets.32 The threshold values of |NES| (normalized enrichment score) >1, and FDR (false discovery rate) q-value <0.10 were considered statistically significant.
Analysis of Immune Infiltrating and Immunotherapy Response
We performed TIMER2.0 database to estimate the relevance between TLR3 mRNA expression in ESCC and infiltrating immune cells, including CD4+ and CD8+ T cells, B cells, NK cells, macrophages, and myeloid dendritic cells (DCs) in TCGA ESCC expression profiles.33 The R package ESTIMATE, a method that infers the fraction of immune and stromal cells in tumor samples by gene expression signatures, was used to evaluate the presence of cell populations in the TCGA ESCC tissues. The tool computes estimate score indicating tumor purity, immune score inferring the immune infiltration abundance in tumor bulk, and stromal score predicting the proportion of stromal component in tumor tissue.34
Subsequently, the TIDE (Tumor Immune Dysfunction and Exclusion) score was employed to forecast immunotherapy response and immune evasion by evaluating dysfunction and exclusion signatures of T cell from TCGA ESCC expression profiles.35,36 Moreover, the recommended methods, including MCP-counter and ssGSEA (the algorithm of xCell), were used to develop a more immune cell infiltration and compare and mutually verify the most relevant immune components and their difference within TLR3low and TLR3high groups.32,37–39
Exploring TLR3 Expression and Its Prognosis and TILs in Pan-Cancer
We also downloaded the other 28 cancer types in the GTEx-TCGA datasets to investigate the expression pattern of TLR3. Moreover, we used TISIDB database to evaluate the associations between TLR3 expression and OS and TILs across human cancers.40
Other Statistical Analyses
We performed other statistical analyses and visualized pictures with R software (V 4.0.3) and GraphPad Prism 8.0. Mann–Whitney U-test (for two groups) and Kruskal-Wallis H-test (for multiple groups) were used to detect the differences. Correlations between TLR3 protein or mRNA expression (low level and high level) and clinicopathological parameters were analyzed by using the Pearson χ2 test or Fisher’s exact probability test. The correlation coefficient was evaluated using Spearman’s test. ROC (Receiver operating characteristic) curve analysis was used to investigate the diagnostic value and cutoff value of TLR3. Kaplan–Meier curves and Log-rank tests were conducted in OS, DSS (disease-specific survival), DFI (disease-free interval), and PFI (progression-free interval) to evaluate the survival effect of TLR3. We performed the Cox proportional-hazards model (Forward: LR) in our tissue samples, and the outcomes were displayed using the hazard ratios (HRs) and the 95% confidence intervals (CIs).
Results
Inflammation Levels and TLR3 Protein Expression in Early Lesions of Esophageal Tissues
We obtained 37 paired specimens with different pathological morphologies, namely normal, ESSH, IEN, and ESCC from 137 patients. The level of inflammation was correlated positively between IEN and normal or IEN and ESSH groups (Rho = 0.675 and Rho = 0.668, respectively, P < 0.001, Figure 1B i-ii, v–vi, ix–x and xiii–xiv, Figure 1C), which is consistent with our previous results.26 IHC showed that TLR3 was expressed in 37.8% (14/37) of normal epithelia, 86.5% (32/37) of ESSH, 81.1% (30/37) of IEN, and 89.2% (33/37) of ESCC. There was an increasing trend in the level of TLR3 expression in different grades of cellular atypia, from normal, ESSH, IEN to ESCC, with P < 0.0083 (α=0.05/6) except in groups between normal and ESSH and ESSH and IEN (Figure 1B iii-iv, vii–viii, xi–xii, and xv-xvi, Figure 1D). We also examined the TLR3 protein expression in 111 cases of non-tumor samples, which correlated positively with the inflammation levels (Rho = 0.341, P < 0.001, Figure 1E, the High and Low TLR3 groups are based on the ROC curve).
Clinicopathological Characteristics of ESCC Patients and the Relationships with TLR3 Levels
The baseline information of ESCC patients in IHC tissue samples, including gender, age, tumor location, gross type, tumor size, tumor grade, pT stage, pN stage, pM stage, pTNM stage, resection margin, postoperative radiotherapy, and postoperative chemotherapy, are listed in Table 1. To the last clinical follow-up, 107 patients died, and 30 patients survived or were lost. The median survival time was 19.33 months (4.53–66.83 months). However, except for the postoperative radiotherapy subgroups, the clinicopathological characteristics of ESCC were not associated with TLR3 protein expression (Table 1).
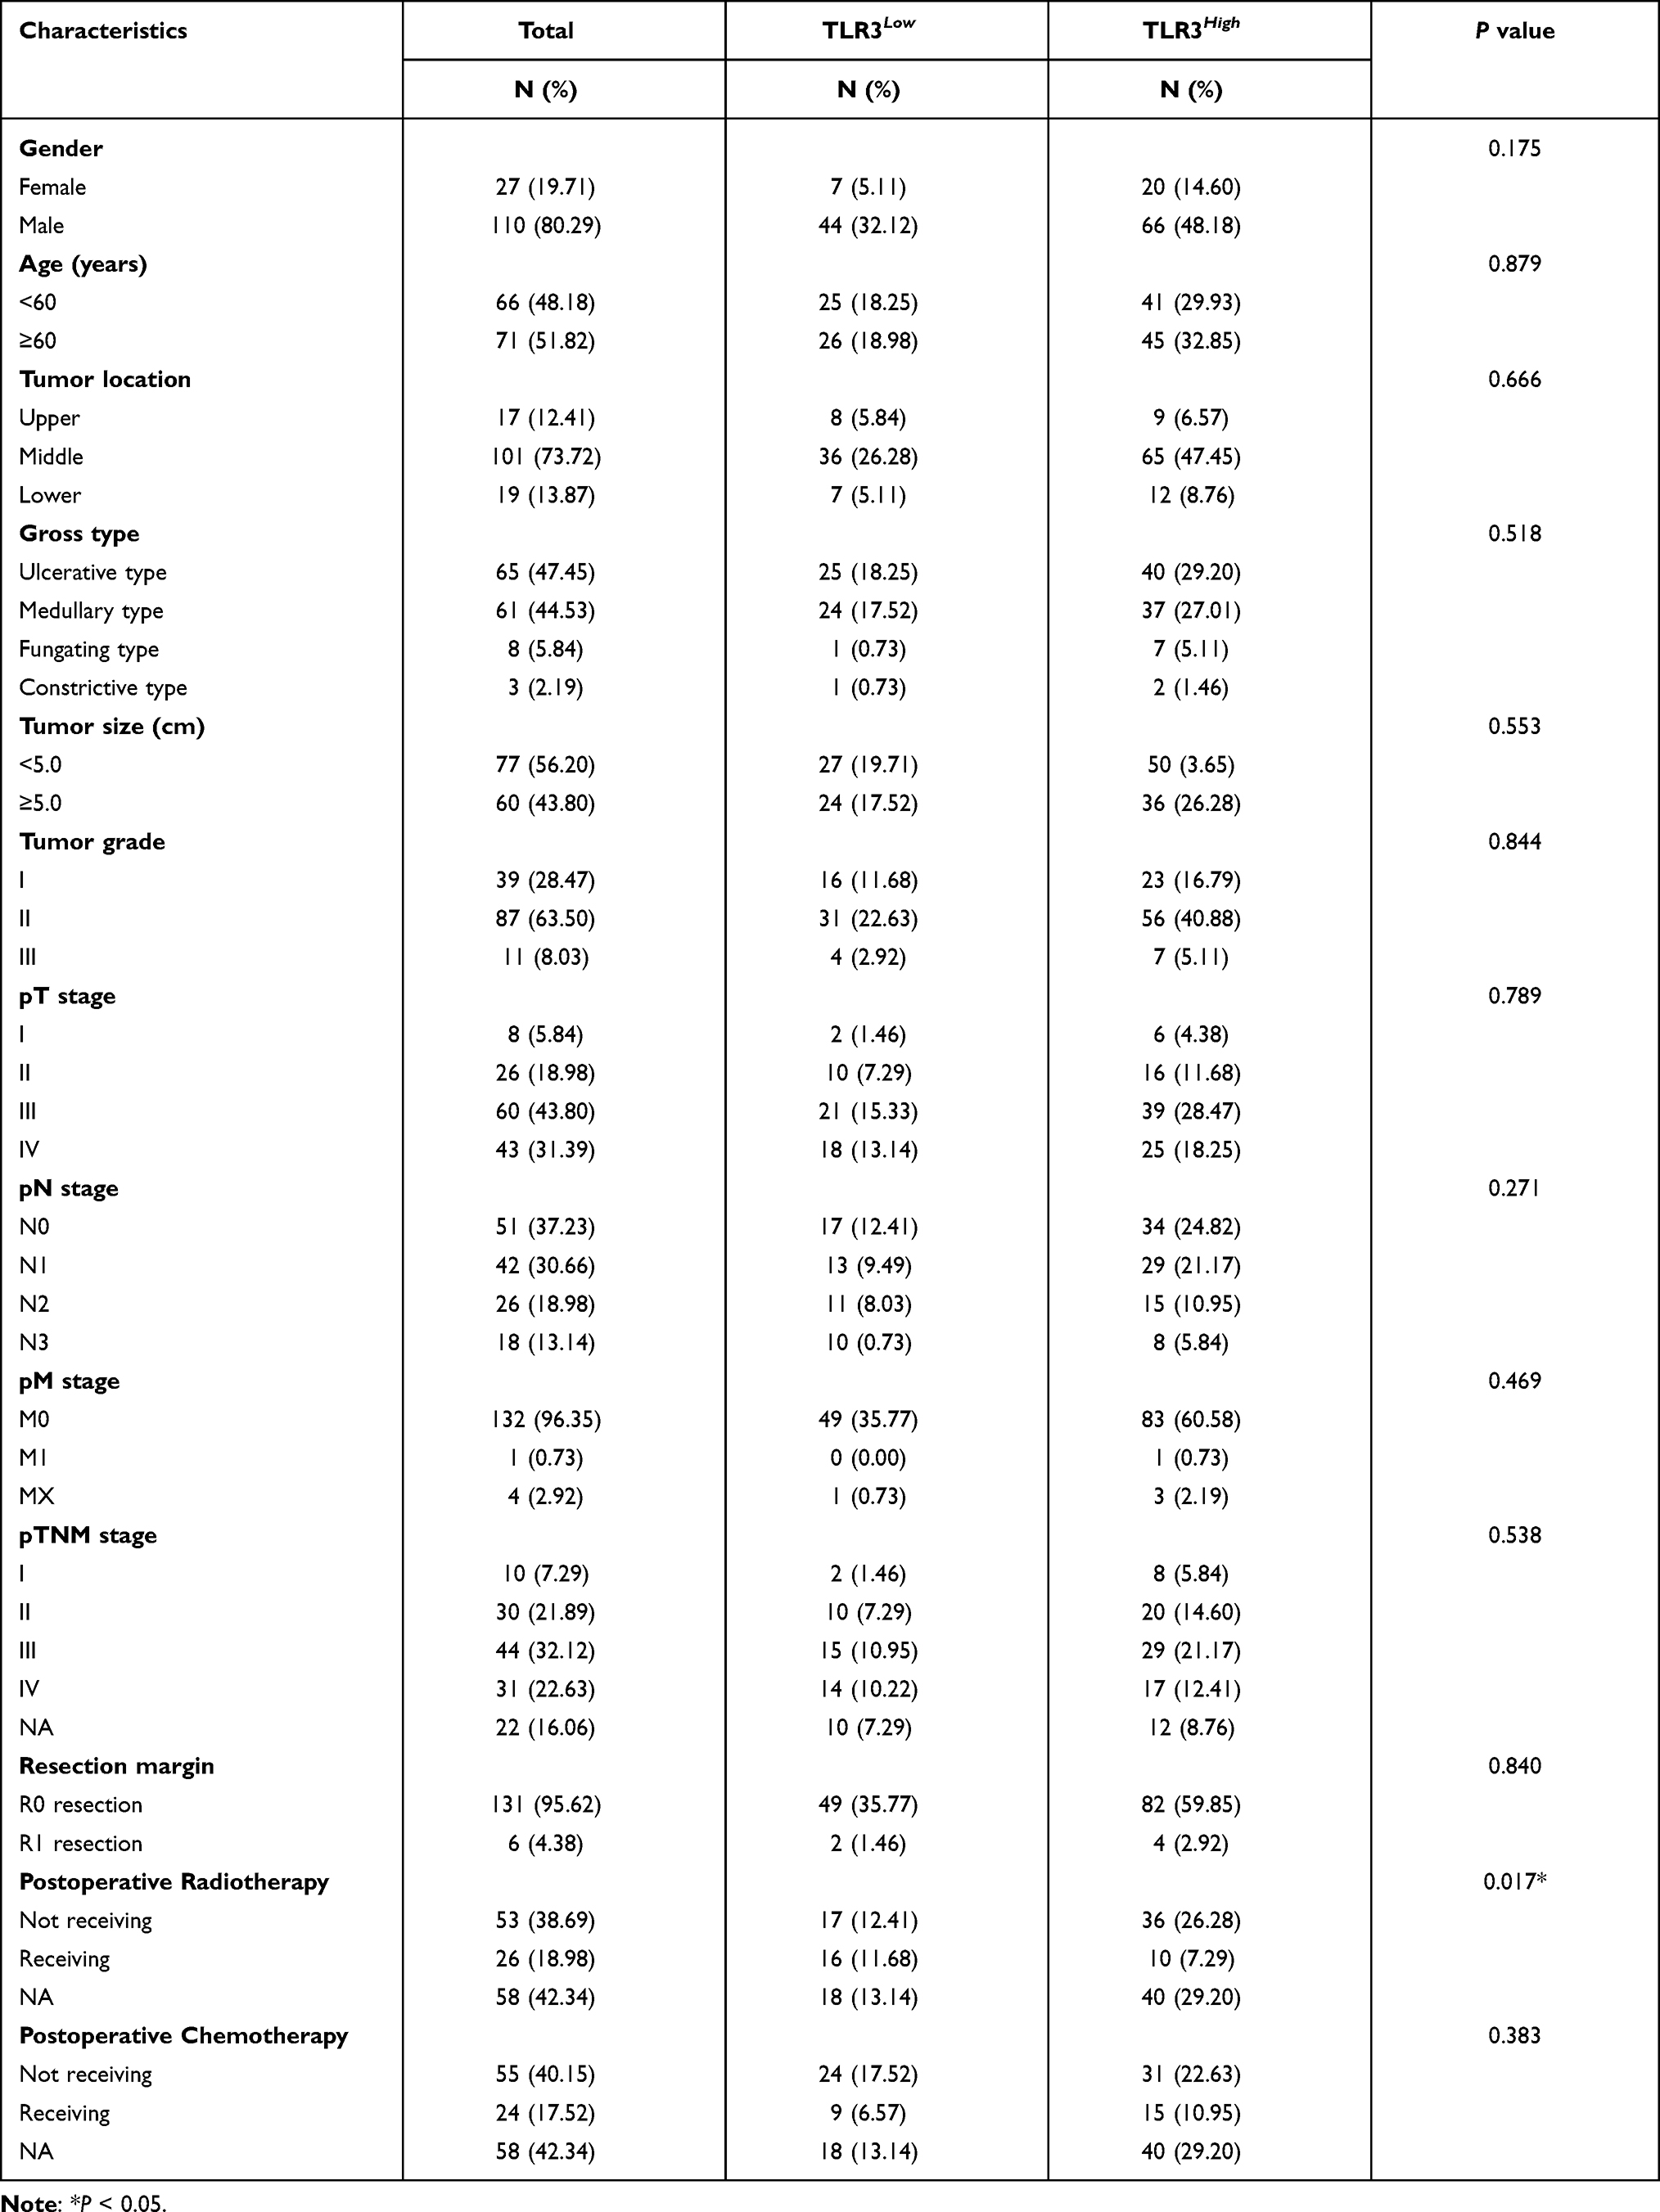 |
Table 1 Clinicopathological Parameters of ESCC Patients in IHC Samples |
In the TCGA-ESCC, no significant correlations were detected between TLR3 and other clinical parameters, such as gender (P = 0.925), age (P = 0.885), tumor location (P = 0.239), grade (P = 0.697), T stage (P = 0.460), N stage (P = 0.363), and M stage (P = 0.785). The median survival time was 13.35 months (0.13–68.97 months). The associations between TLR3 mRNA expression and clinicopathological parameters had similar results in the ESCA dataset, as shown in Table S2.
Upregulated Levels of TLR3 Protein and mRNA in ESCC Patient
TLR3 protein was expressed in the nucleus and cytoplasm in ESCC tissue samples, with expression in the nucleus being relatively strong and in the cytoplasmic being relatively weak (Figure 1B iii-ivvii–viiixi–xii, and xv-xvi, Figure S2). TLR3 was expressed in 94.9% (130/137) of ESCC and 56.0% (28/50) of normal epithelia (P < 0.001, Figure 2A).
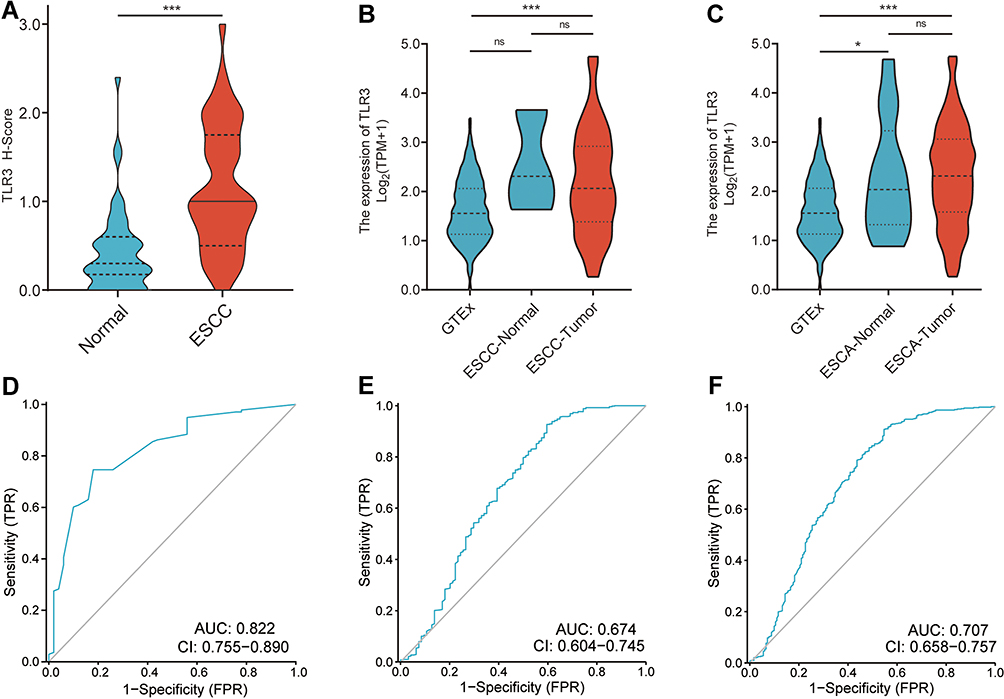 |
Figure 2 The expression and ROC curves of TLR3 in IHC samples and TCGA. (A) The protein expression levels of TLR3 in ESCC and adjacent normal tissue samples. (B) The mRNA expression levels of TLR3 in GTEx (n=518), TCGA ESCC-Normal (n=3) and TCGA ESCC-Tumor samples (n=92). (C) The mRNA expression levels of TLR3 in GTEx (n=518), TCGA ESCA-Normal (n=13) and TCGA ESCA-Tumor samples (n=181). (D) ROC curve shows that TLR3 had an AUC value of 0.822 (95% CI: 0.755–0.890) to discriminate between ESCC tissues from non-tumor controls in our sample. With a cutoff of 0.725, the sensitivity, specificity, and accuracy were 74.6, 82.0, and 76.5%, respectively. (E) TLR3 had an AUC value of 0.679 (95% CI: 0.603–0.755) in the ROC curve for TCGA-ESCC. (F) TLR3 had an AUC value of 0.707 (95% CI: 0.658–0.757) in the ROC curve for TCGA-ESCA. *P < 0.05, ***P < 0.001; ns, no significance. |
We then analyzed the mRNA data from the combined cohort of TCGA and GTEx further to understand the expression of TLR3 in ESCC and ESCA. ESCC-Tumor (n = 92) and ESCC-Normal (adjacent to tumor, n = 3), and ESCA-Tumor (n = 181) and ESCA-Normal (n = 13) were available from TCGA, and 518 normal esophageal samples were extracted from GTEx. Non-cancerous esophageal tissues from TCGA-ESCA and normal esophageal samples extracted from GTEx as controls (n = 531).
Analyses showed that the TLR3 mRNA levels in ESCC were higher than those in normal tissues from GTEx (P < 0.001, Figure 2B) or all the non-cancerous samples (P < 0.001, Figure 2B). TLR3 expression in the ESCA dataset had a similar trend (ESCA-Tumor vs normal or non-cancerous samples, P < 0.001, Figure 2C). Interestingly, TLR3 in non-cancerous samples from TCGA-ESCA was higher than in normal samples from GTEx (P = 0.0388, Figure 2C). Taken together, these outcomes suggested that both protein and mRNA levels of TLR3 were increasing in ESCC.
Differential Levels of TLR3 as a Prospective Biomarker to Distinguish Between ESCC and Normal Samples
To investigate the value of TLR3 expression for distinguishing ESCC samples from normal samples, we performed a ROC curve analysis of TLR3 in our tissue samples and GTEx-TCGA. The results showed the AUC value of TLR3 was 0.822 (95% CI: 0.754–0.889, Figure 2D) in IHC samples. At a cutoff of 0.725, TLR3 had a sensitivity, specificity, and accuracy of 74.5%, 82.0%, and 76.5%, respectively. The positive and negative predictive values were 91.9% and 53.9%, respectively. The RNA level of TLR3 also had similar diagnostic efficacy in ESCC and ESCA samples in the GTEx-TCGA and the AUC value was 0.674 (95% CI: 0.604–0.745, Figure 2E) and 0.707 (95% CI: 0.658–0.757, Figure 2F), respectively. These outcomes showed that TLR3 might be a promising biomarker to distinguish ESCC samples from normal samples.
To further explore the correlation between TLR3 expression and gene copy number and DNA methylation of the TLR3 promoter, we performed integrated visualization of TLR3 expression, copy number, and DNA methylation levels in MEXPRESS based on ESCC data from TCGA (Figure 3A and B). Copy number was positively correlated with TLR3 expression. Methylation at four CpG sites of TLR3 (cg06498520, cg17671280, cg12281049 and cg25367691) was negatively correlated with TLR3 expression (Figure 3C).
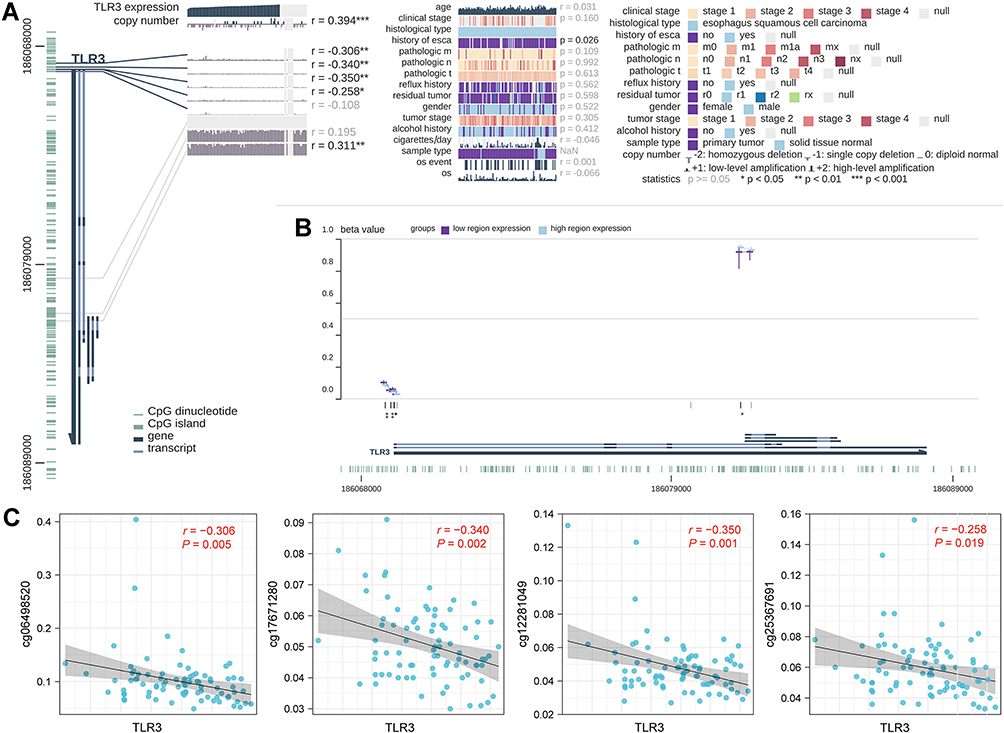 |
Figure 3 Correlations between TLR3 expression and DNA levels in TCGA ESCC patients. (A) Correlation between TLR3 expression and clinical parameters, copy number, and DNA methylation. The statistics, including correlation coefficient (r) and p-value, are on the right. (B) Summary view of DNA methylation differences in which the samples had been divided into two groups based on their TLR3 expression level. The horizontal lines at each probe position represent the median percentage of methylation (β Value), while the vertical lines indicate the range between 25% and 75%. (C) Scatter diagram and correlation analysis of TLR3 expression and methylation levels of CpG sites, including cg06498520, cg17671280, cg12281049, and cg25367691. *P <0.05, **P <0.01, **P <0.001. |
Low Expression of TLR3 Protein Predicts Poorer Prognosis in ESCC Patients
To investigate the association between TLR3 expression (including protein and mRNA levels) and OS in ESCC patients, we performed Cox regression in our tissue samples and TCGA. In the univariate Cox regression model, we found that ESCC patients with high TLR3 protein expression had longer OS (P = 0.006, HR = 0.573, 95% CI: 0.386–0.851, Figure 4Ai and Table 2) and DSS (P = 0.003, HR = 0.549, 95% CI: 0.368–0.820, Figure 4Aii). In addition, patients with larger tumor size (P = 0.001, HR = 1.911, 95% CI: 1.296–2.818), T stage IV (P = 0.024, HR = 3.295, 95% CI: 1.167–9.305), N stage N3 (P = 0.002, HR = 2.566, 95% CI: 1.423–4.626), TNM stage II, III and IV (P = 0.020, HR = 3.535, 95% CI: 1.219–10.253; P = 0.009, HR = 4.054, 95% CI: 1.422–11.560; P = 3.530e-4, HR = 6.944, 95% CI: 2.399–20.102, respectively) had shorter OS (Table 2). The median survival times (MSTs) for low and high TLR3 expression patients were 15.6 months (95% CI: 13.0–19.3 months) and 29.5 months (95% CI: 23.9–38.1 months), respectively. Moreover, the 1-, 3- and 5-year survival rates of low and high TLR3-expressing patients were 62.7%, 13.7%, 0% and 81.4%, 27.9%, 3.5%, respectively.
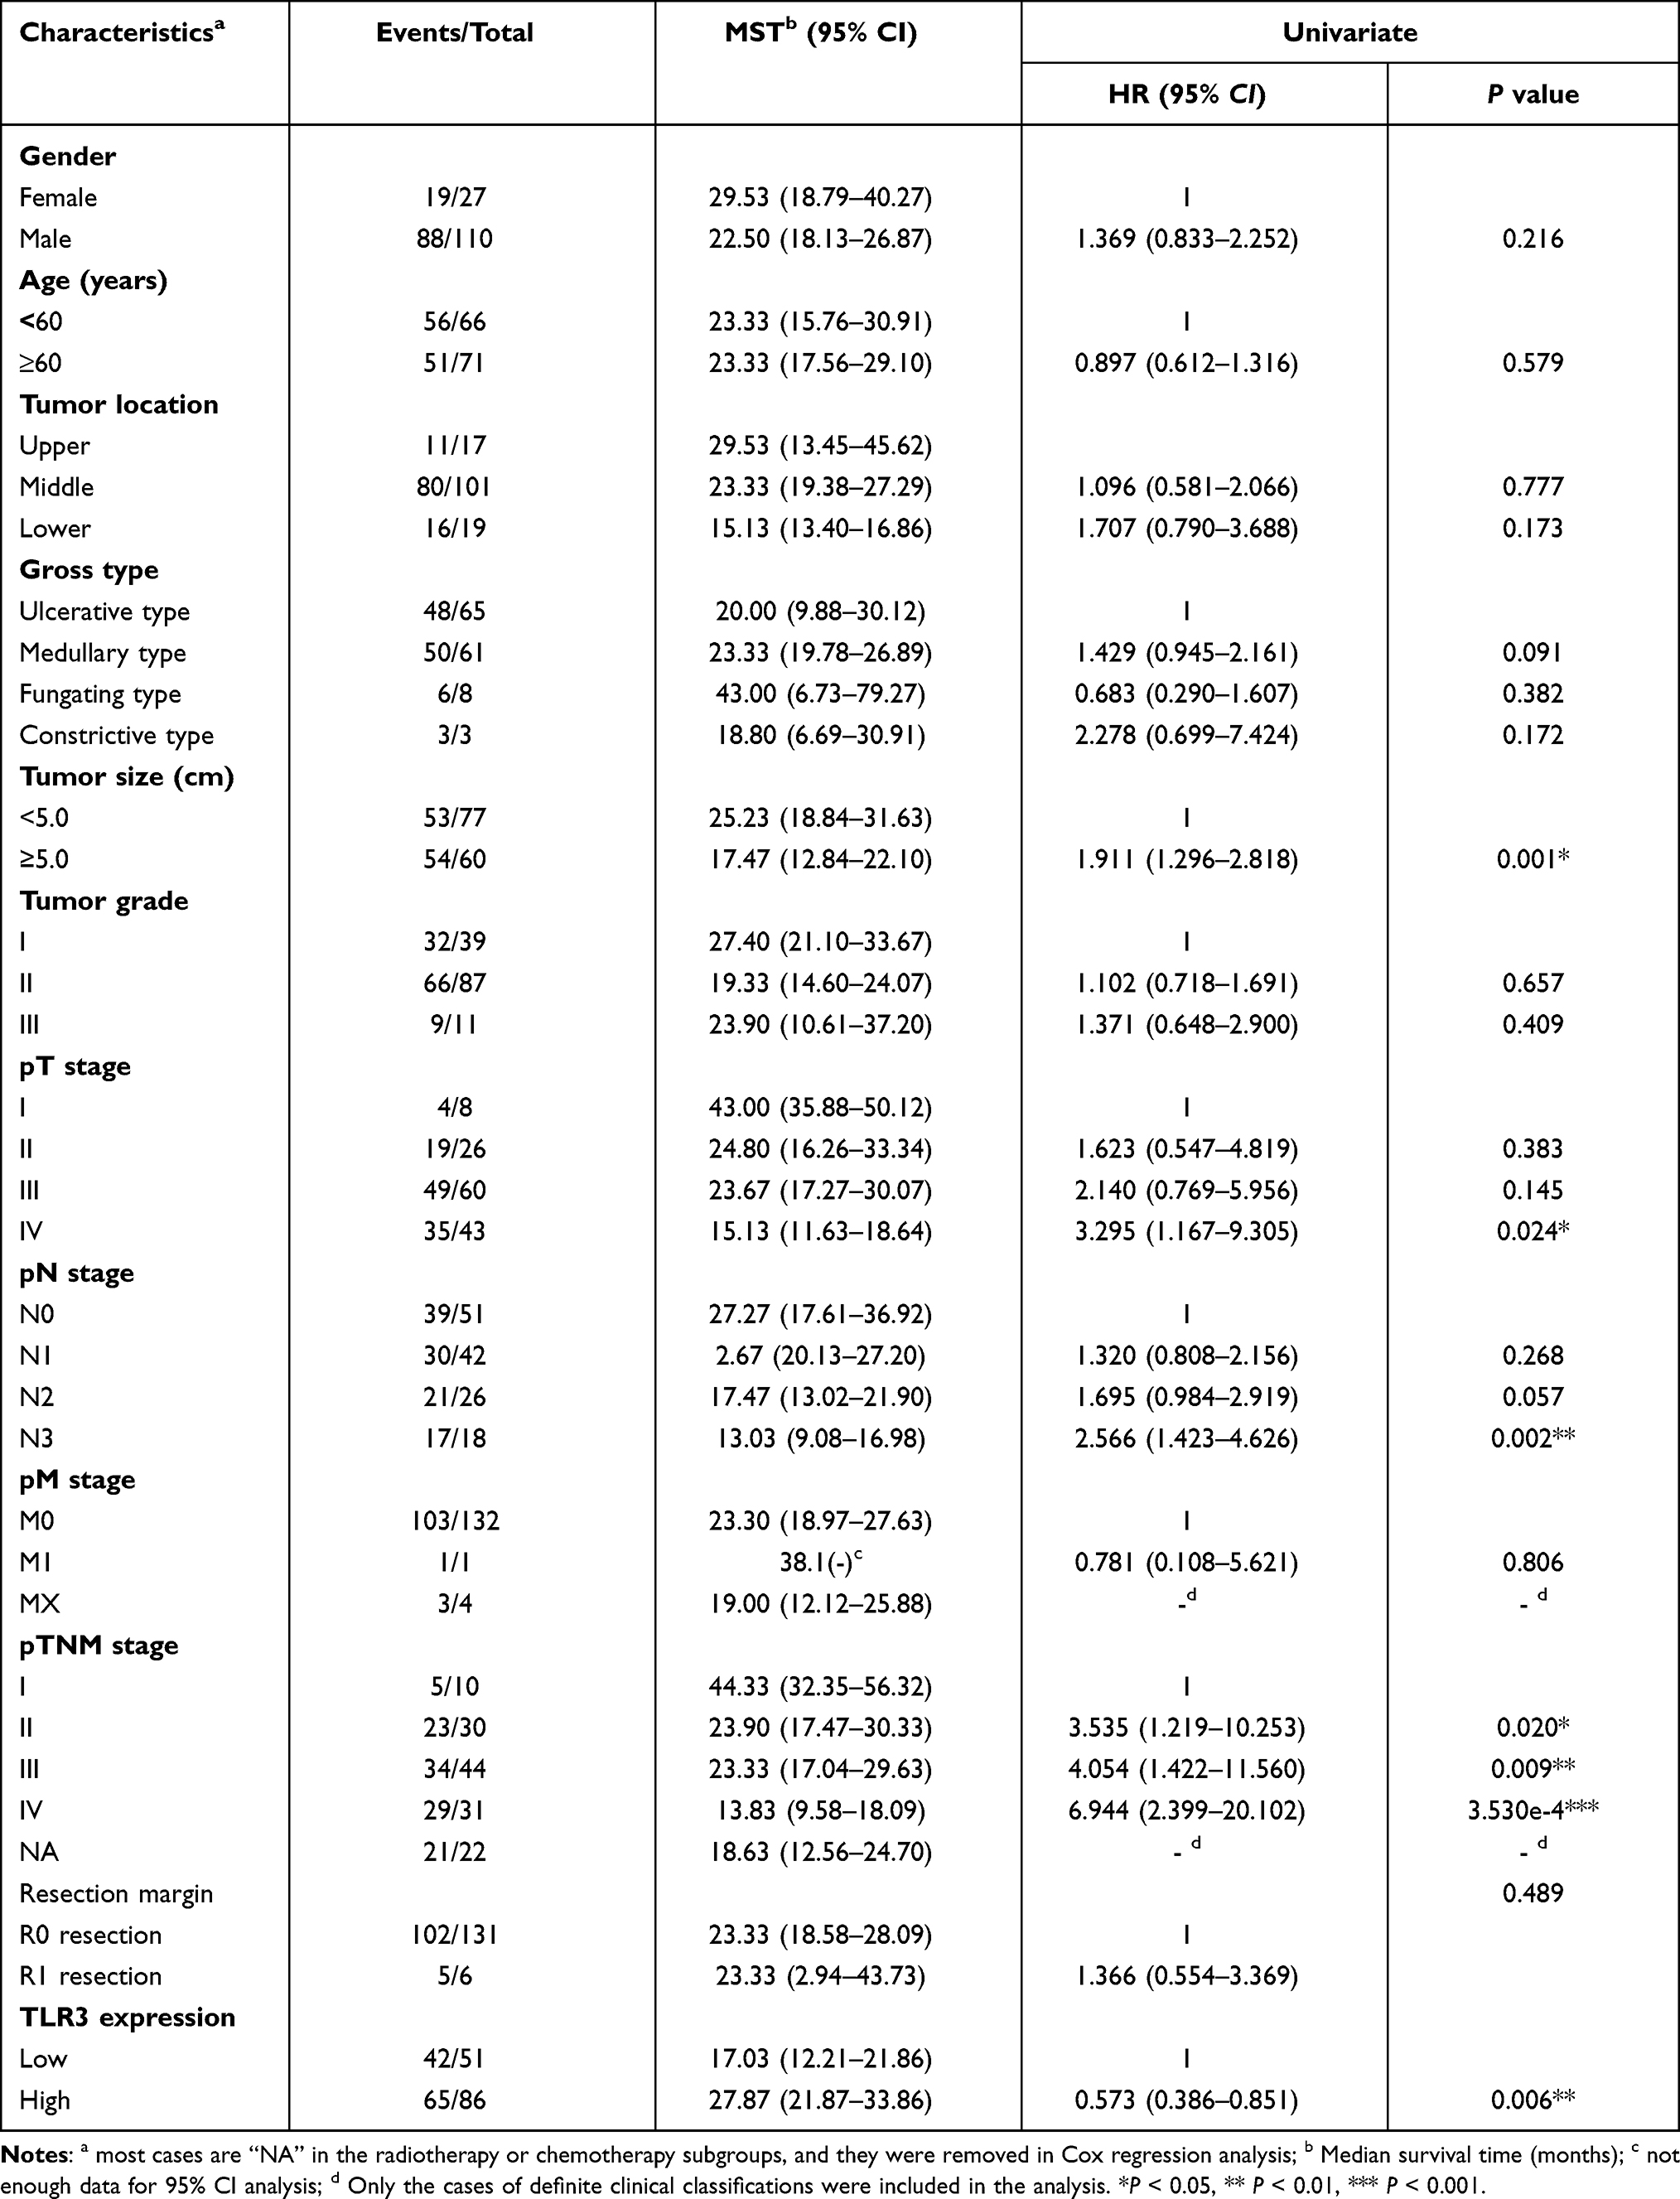 |
Table 2 Cox Regression Univariate Analysis in Patients with ESCC in IHC Samples |
Furthermore, adjusting for other factors, low TLR3 protein expression (P = 0.005, HR = 1.737, 95% CI: 1.179–2.559), TNM stage II, III and IV (P = 0.026, HR = 3.336, 95% CI: 1.151–9.668; P = 0.012, HR = 3.788, 95% CI: 1.333–10.759; P = 0.002, HR = 5.481, 95% CI: 1.891–15.883, respectively) and tumor size (≥5.0 cm, P = 0.017, HR = 1.622, 95% CI: 1.091–2.410) were factors for poor prognosis of ESCC patients in the multivariate Cox regression model (Table 3). Therefore, TLR3 expression could be a potential biomarker for the prognosis of patients with ESCC. Stratified by TMN stage, there was not statistically significant for stage III (P = 0.635, Figure 4Bi) and II patients (Figure S3.A), while the OS of stage IV or combined stage III and IV patients with high TLR3 level was longer than that of patients with low TLR3 level (P = 0.024 and P = 0.025, respectively, Figure 4Bii and iii), and not enough data in the stage I subgroup. We also performed survival curves with patients receiving postoperative chemotherapy (Figure 4Ai) or radiotherapy (Figure 4Aii) and showed a lack of association with OS, contrasting a previous report.25 The survival curves of DSS in IHC samples gave a similar result (Figure S3.B).
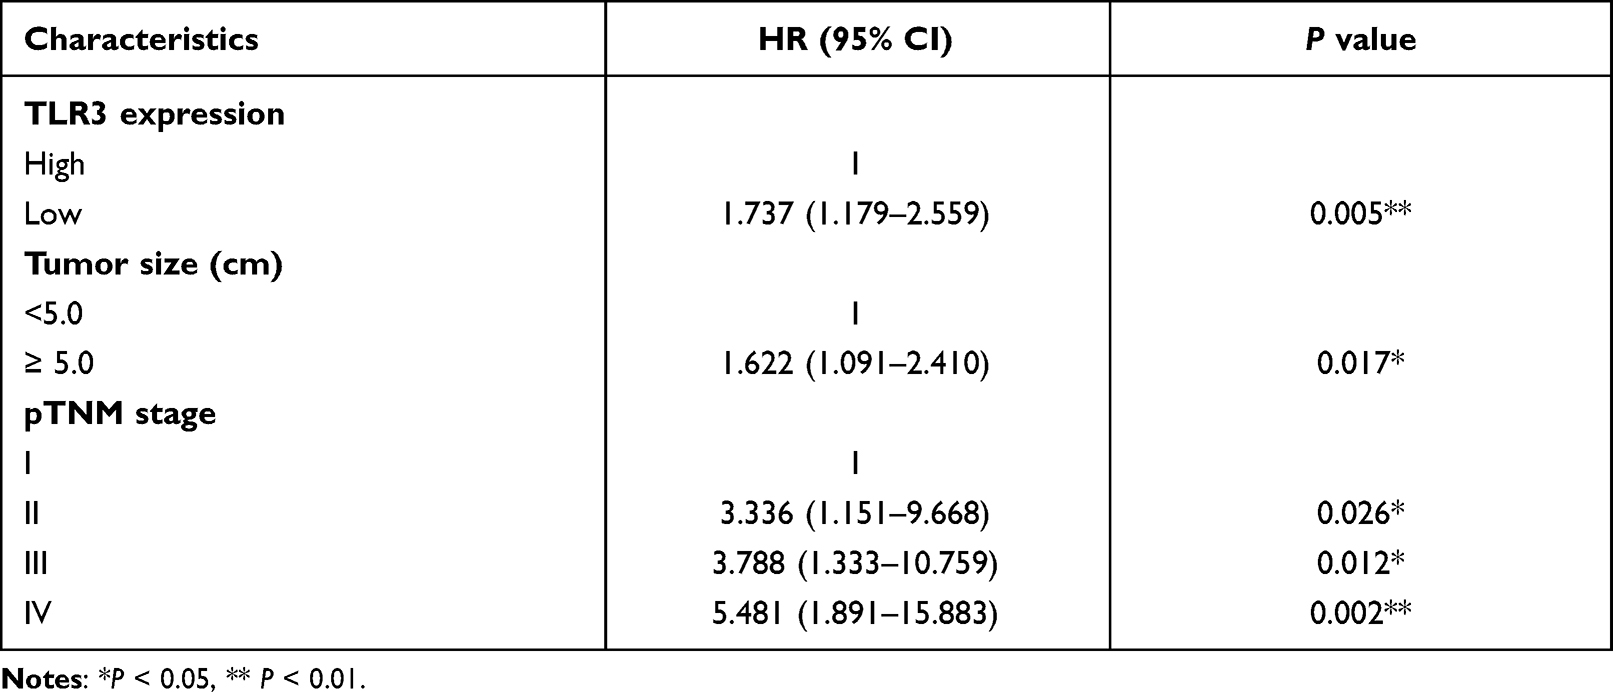 |
Table 3 Cox Regression Multivariate Analysis in Patients with ESCC in IHC Samples |
In the TCGA, the mRNA Expression of TLR3 was not associated with OS in ESCC patients (Figure 4Di). However, when stratified by TMN stage, we found that the OS of stage III patients with high TLR3 level was significantly longer than that of patients with low TLR3 level (P = 0.033, HR = 0.199, 95% CI: 0.045–0.874, Figure 4Dii), while there was no statistical significance for stage II patients (Figure 4Diii) and not enough data for stage I (n = 7) and stage IV (n = 4). There was also no statistical significance in survival analysis of DSS, DFI, and PFI in TCGA-ESCC patients (Figure S3.C-E). Interestingly, as is shown in Figure 4E, the OS of ESCA patients with the low TLR3 level was significantly shorter than those with the high TLR3 level (P = 0.028, HR = 0.435, 95% CI: 0.207–0.916).
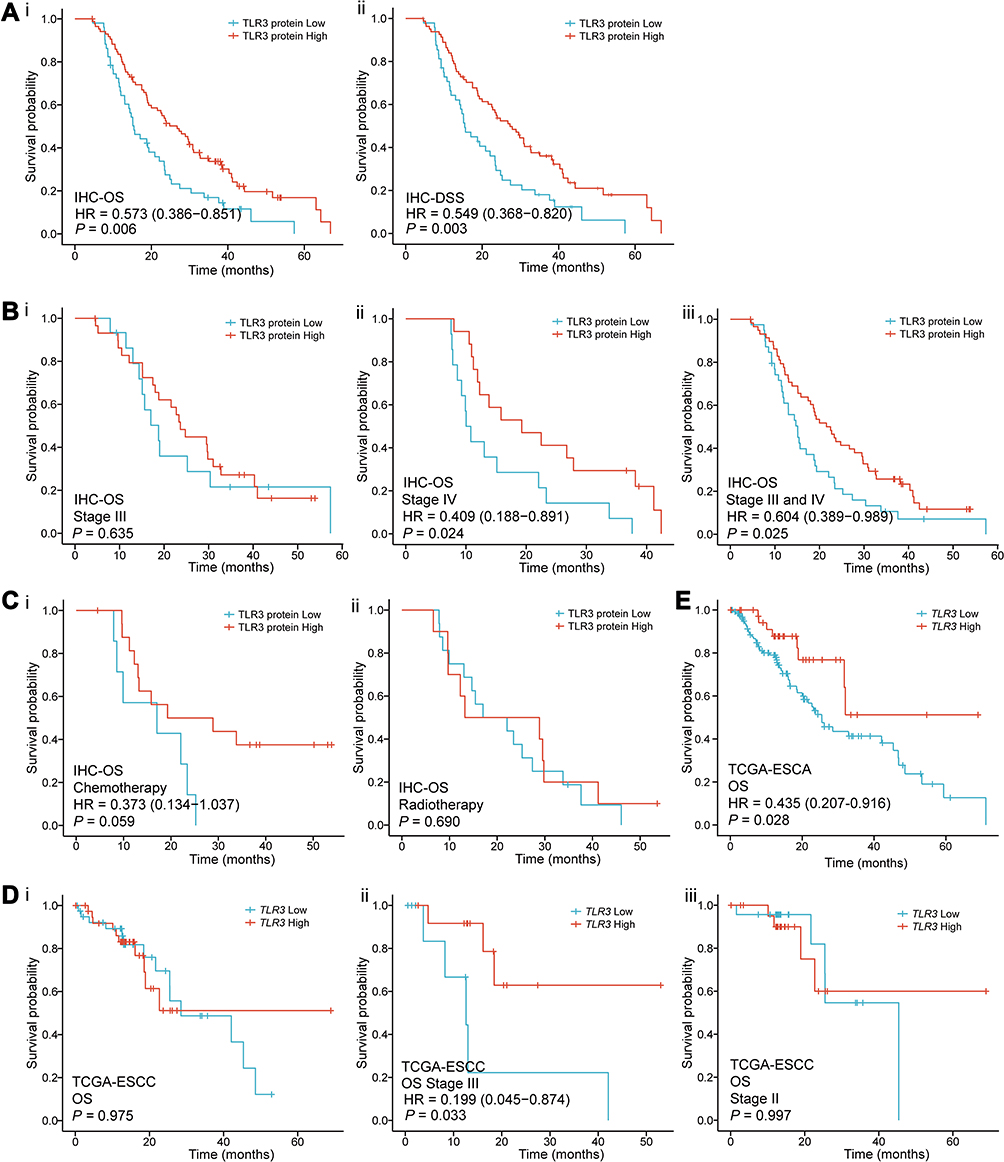 |
Figure 4 Survival curves for TLR3 in IHC samples and TCGA. (A) Survival curves in IHC samples indicated that ESCC patients with low TLR3 protein expression had a shorter OS (i) and DSS (ii) than those with high-level of TLR3 (15.4 vs 26.7 months, P = 0.006; 15.4 vs 27.3 months, P = 0.003, respectively) in the IHC samples. (B) Stratified by TMN stage, i. there was no statistical significance in stage III (P = 0.635); ii, iii. the OS of stage IV or combined stage III and IV patients with high TLR3 level was significantly longer than that of patients with low TLR3 level (P = 0.024 and P = 0.025, respectively). (C) The survival curves for having received postoperative chemotherapy (i, P = 0.059) or radiotherapy (ii, P = 0.690) patients in IHC samples. (D) The survival curves of OS in the TCGA-ESCC patients. i. all the data; ii. TNM stage III (P = 0.033, HR = 0.199, 95% CI: 0.045–0.874); iii. TNM stage II. (E) ESCA patients with low TLR3 mRNA expression had a shorter OS than those with high levels of TLR3 (13.2 vs 18.3 months, P = 0.028) in the Kaplan-Meier survival curves from the TCGA. |
Gene Networks and Functional Annotations
A network of TLR3 was found to have its 20 potentially frequently interacting genes and 171 links (interactions) (Figure 5A). Changes in the biological process of TLR3 were related to the innate immune response-activating signal transduction, TLR, NF-kB, and pattern recognition receptor signaling pathway (Figure 5B). These genes involved ubiquitin-protein ligase binding, tumor necrosis factor receptor superfamily binding, toll-like receptor binding, endosome and endolysosome membrane, and CD40 receptor complexes. The scatter diagrams between TLR3 and co-expression genes in TCGA ESCC are displayed in Figure 5C.
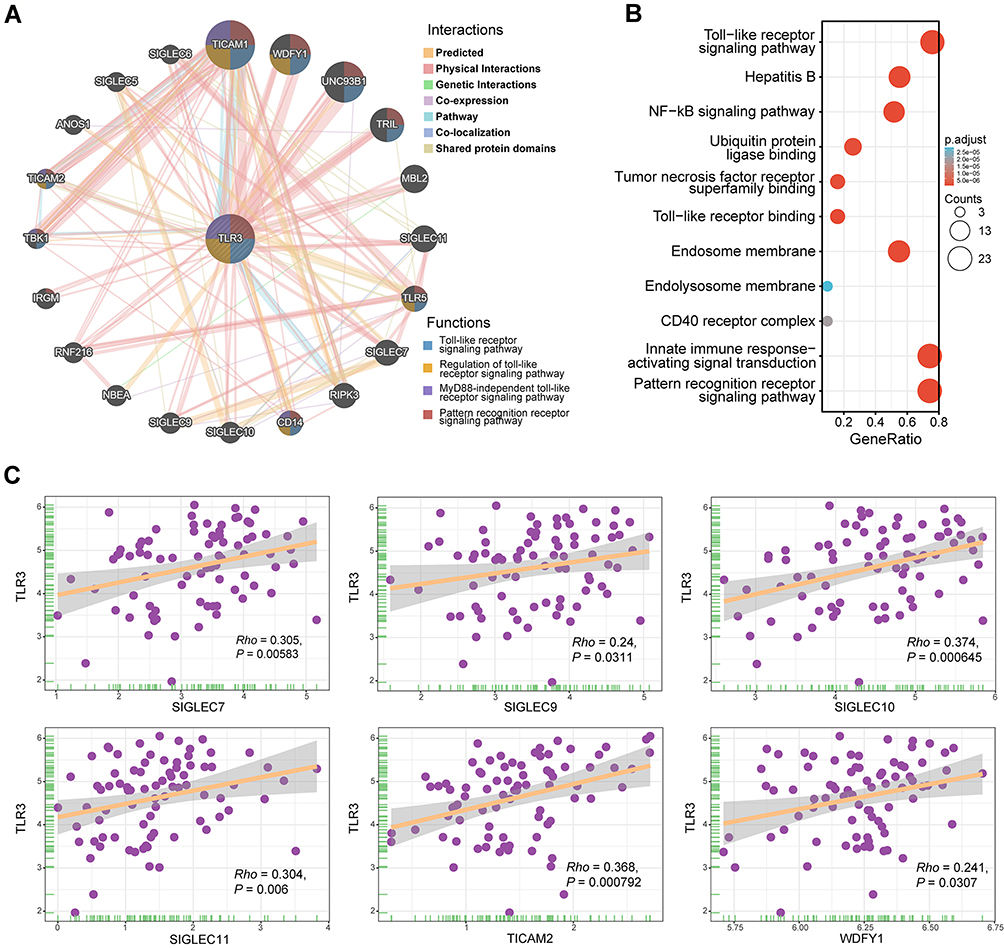 |
Figure 5 Interaction network of frequently interacting genes and functional enrichment analyses. (A) Gene to gene interaction network with frequently interacting genes (GeneMANIA, accessed on Sept 8th, 2021): the node size, color of lines, and colored node circle sections represent the strength of interaction, the types of interaction between genes, and functions of the respective genes, respectively. (B) GO enrichment and KEGG pathway analyses of 21 involved genes. (C) Correlation analyses between the expression of TLR3 and co-expressed genes in ESCC. SIGLEC7, sialic-acid binding Ig-like lectin 7; SIGLEC9, sialic-acid binding Ig-like lectin 9; SIGLEC10, sialic-acid binding Ig-like lectin 10; SIGLEC11, sialic-acid binding Ig-like lectin 11; TICAM2, toll-like receptor adaptor molecule 2; WDFY1, WD repeat and FYVE domain containing 1. |
Correlation Analysis Between TLR3 and Immune Infiltrations in ESCC
We initially found that immune-active cells, including CD8+ T cells (Rho = 0.301, P = 0.006), CD4+ T cells (Rho = 0.383, P = 4.162e-4), B cells (Rho = 0.323, P = 0.003), neutrophils (Rho = 0.472, P = 8.664e-6) and myeloid dendritic cells (Rho = 0.444, P = 3.227e-5) correlated positively with TLR3 expression whereas macrophages were not associated with TLR3 expression in TCGA ESCC patients by the TIMER2.0 database (Figure 6A).
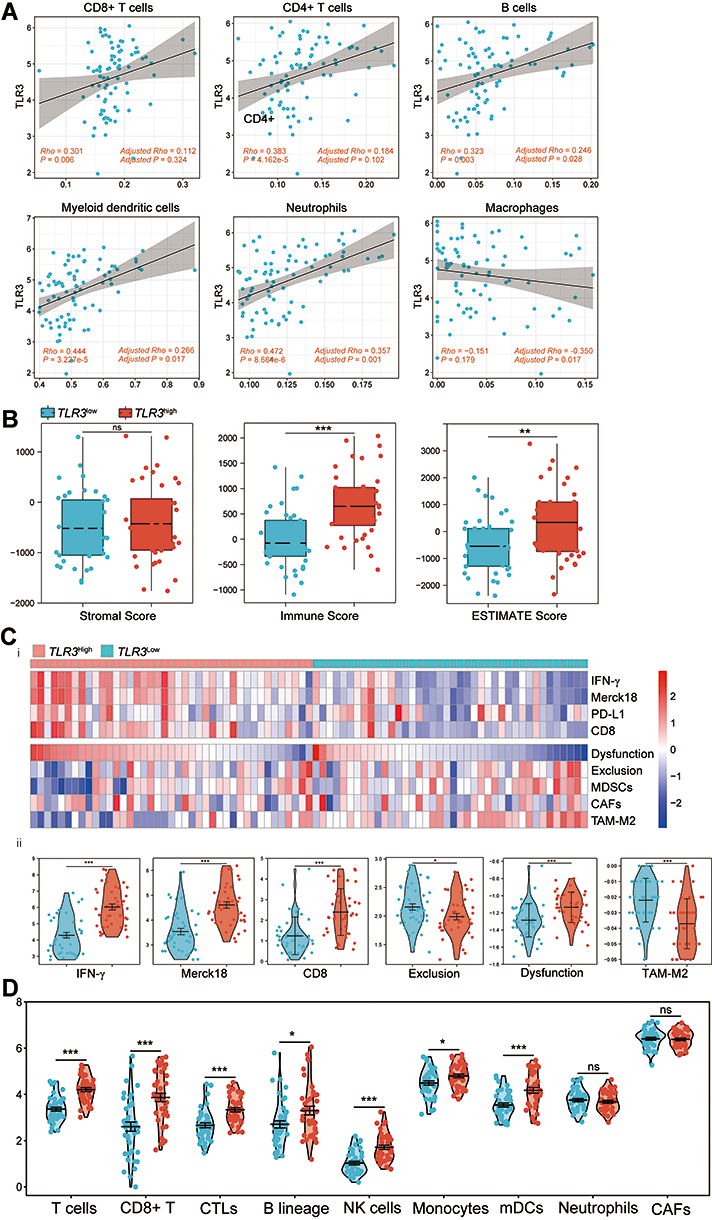 |
Figure 6 Correlations between TLR3 expression and immune infiltration level predict immunotherapeutic response. (A) Scatter diagram and correlation analysis of TLR3 expression with six types of immune infiltration levels, including CD8+ T cells, CD4+ T cells, B cells, neutrophils, macrophages, and dendritic cells in TCGA ESCC. Results are also shown after being adjusted for tumor purity. (B) Boxplot showing stromal, immune, and ESTIMATE scores within TLR3low and TLR3high groups. (C) i. Heatmap of biomarkers for prediction of immunotherapeutic response from the TIDE dataset, including IFN-γ, Merck18 (T cell-inflamed signature), PD-L1, CD8, dysfunction, exclusion, MDSCs, CAFs, and TAM-M2 (M2 subtype). ii. Violin plot showing IFN-γ, Merck18, CD8, exclusion, dysfunction, and TAM-M2 scores within TLR3low and TLR3high groups. (D) Violin plot showing T cells, CD8+ T cells, CTLs, B-cell lineage, NK cells, monocytes, myeloid dendritic cells (mDCs), neutrophils, and CAFs between TLR3low and TLR3high groups. *P < 0.05, **P < 0.01, ***P < 0.001; “ns” indicates no significance. |
To further investigate the more detail of infiltrating immune cells correlating with TLR3 expression, 29 types of infiltrating immune cells and 2 types of immune-suppressive cells were analyzed. As shown in Table 4, the expression of TLR3 had a correlation with the abundance of activated CD8+ T cells (Rho = 0.499, P = 2.000e-6), activated CD4+ T cells (Rho = 0.400, P = 2.380e-4), activated B cells (Rho = 0.294, P = 0.008), natural killer (NK) cells (Rho = 0.298, P = 0.007), T follicular helper cell (Rho = 0.266, P = 0.017), type 1 T helper cells (Th1, Rho = 0.378, P = 0.001), and type 2 T helper cells (Th2, Rho = 0.256, P = 0.022) after tumor purity adjustments.
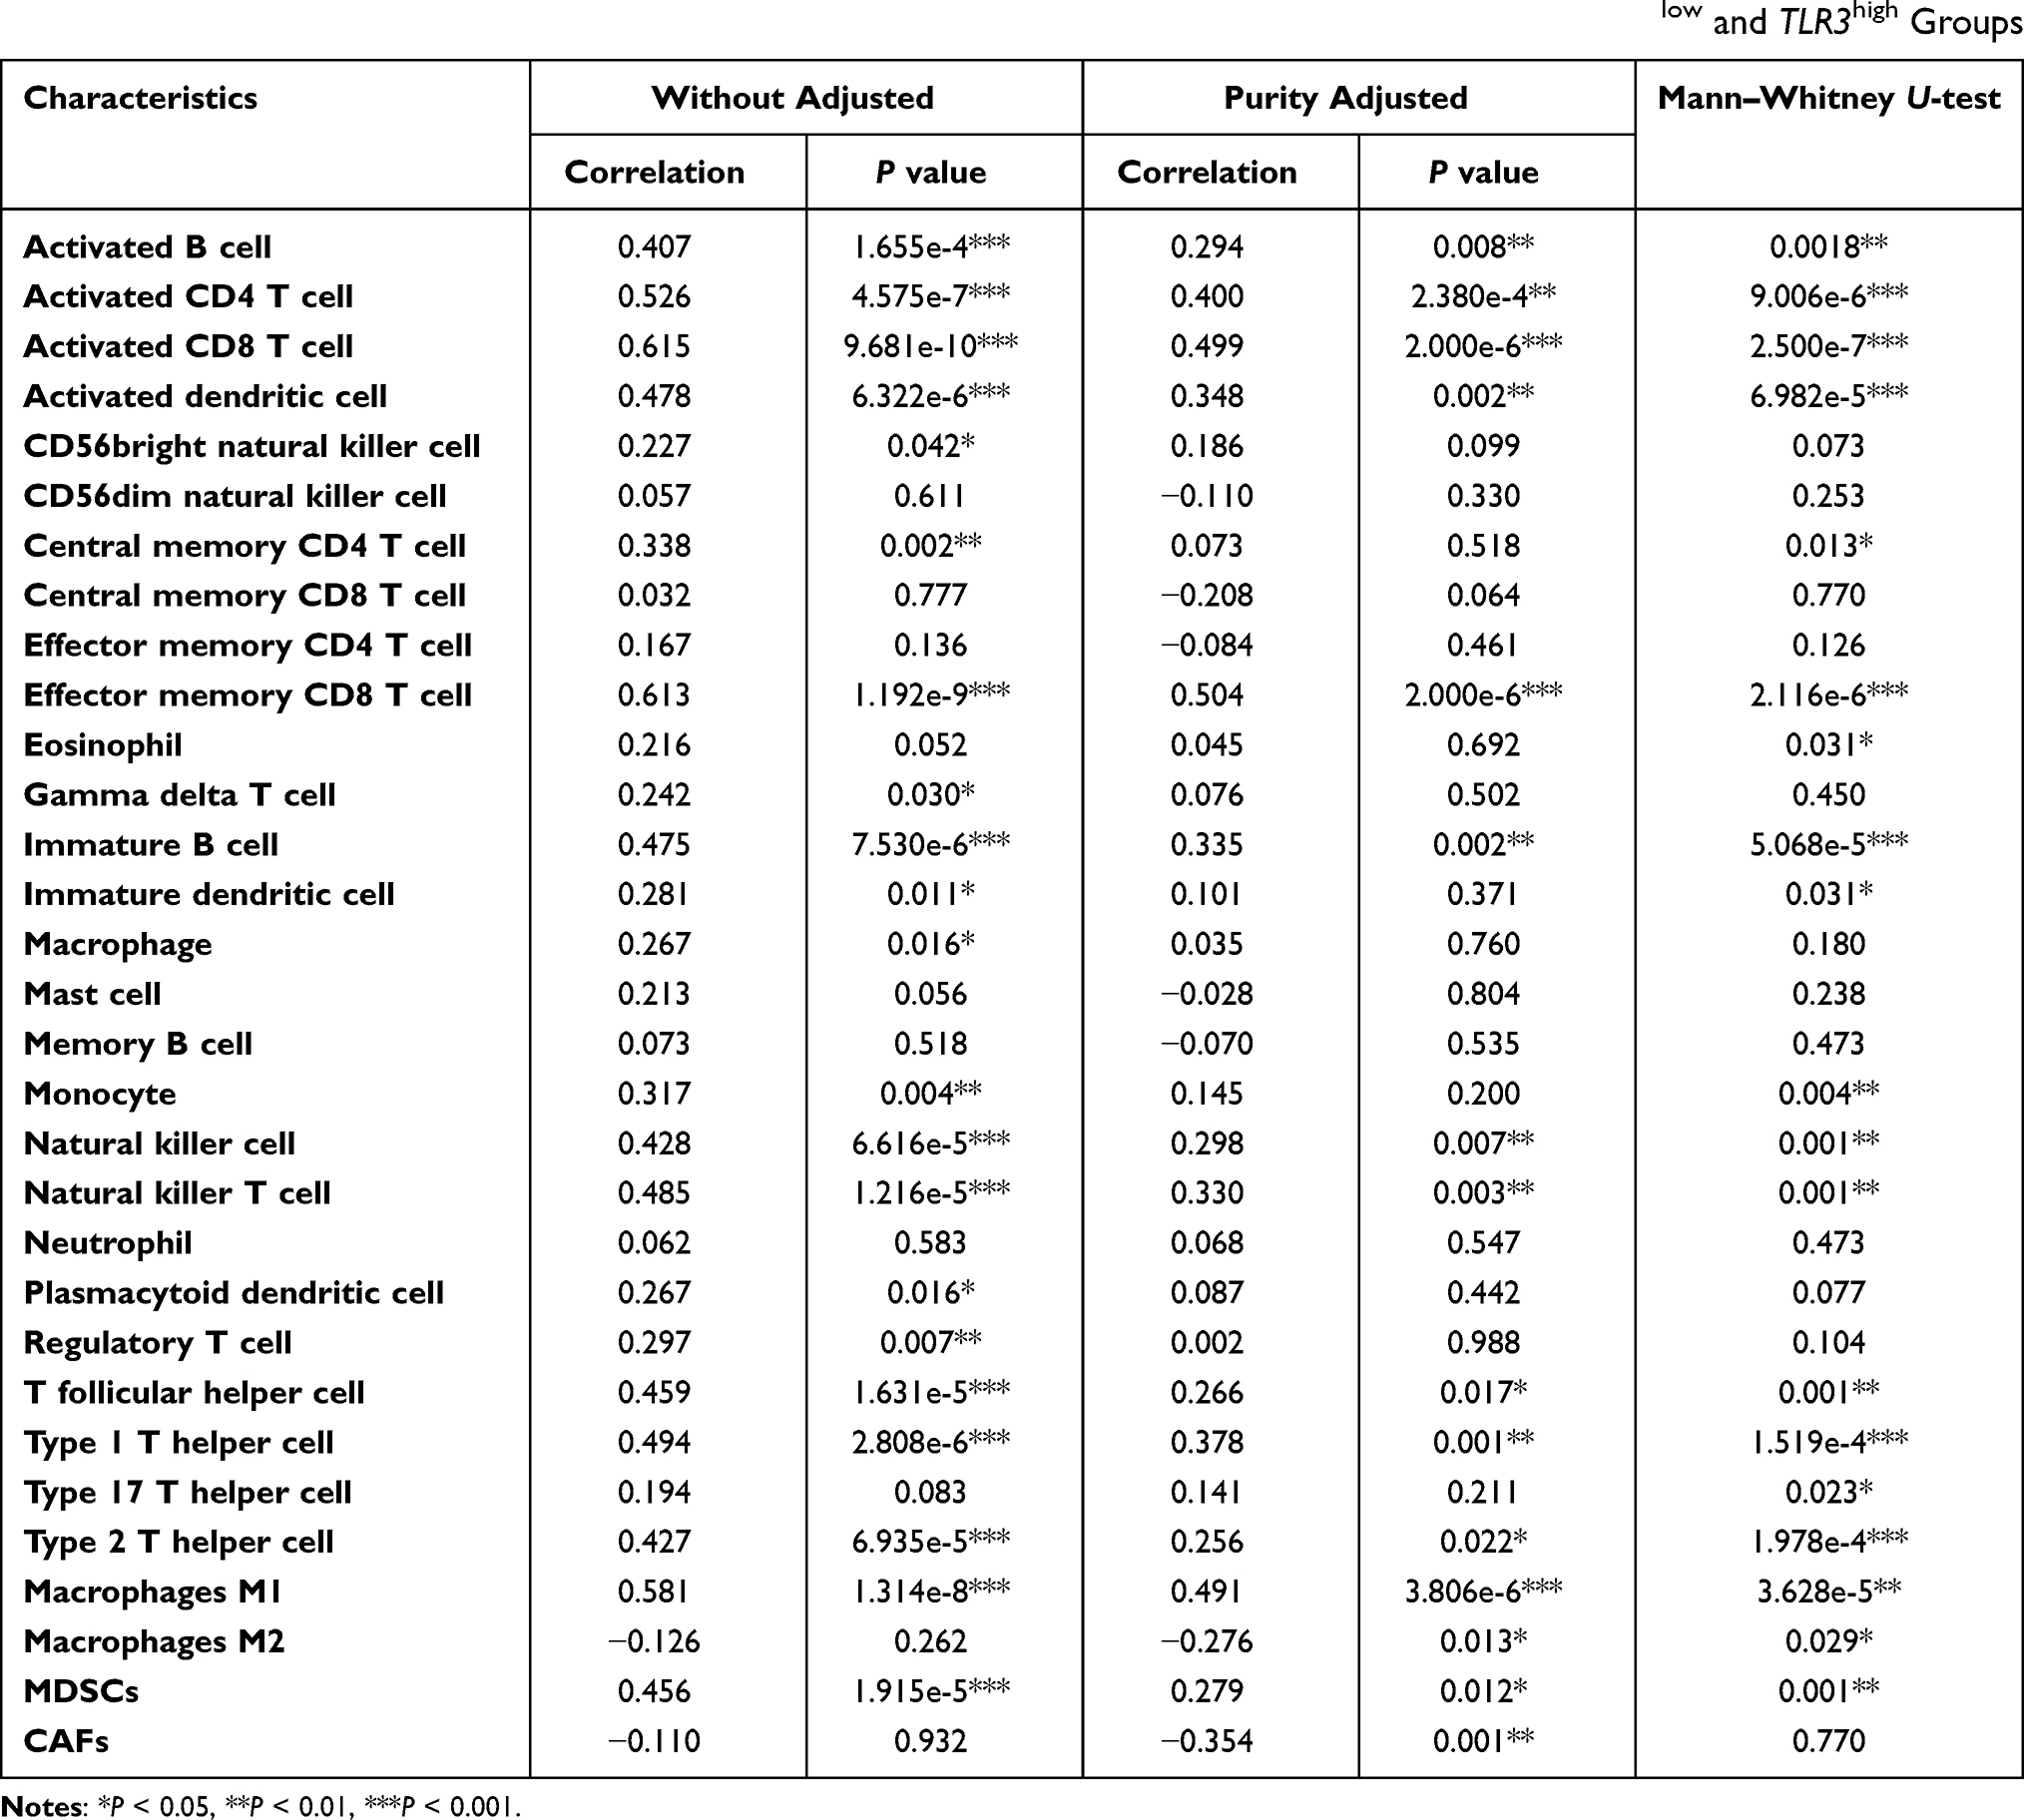 |
Table 4 Correlations Between TLR3 and Infiltrating Immune Cells and Mann–Whitney U-Test Between TLR3low and TLR3high Groups |
We found that immune-suppressive cancer-associated fibroblasts (CAFs, adjusted Rho = −0.354, adjusted P = 0.001) were shown to be negatively correlated with TLR3 expression. Still, myeloid-derived suppressor cells (MDSCs, adjusted Rho = 0.279, adjusted P = 0.012) were slightly positively associated correlated with TLR3 expression (Table 4, Figure S4.A and B). Interestingly, TLR3 expression was shown to be negatively correlated with macrophages M2 (adjusted Rho = −0.276, P = 0.013) while positively correlated with macrophages M1 (Rho = 0.581, P = 1.314e-8, adjusted Rho = 0.491, adjusted P = 3.806e-6, Table 4, Figure S4.C and D). This suggests that the expression of TLR3 may imply the polarization of macrophages M2 to macrophages M1.
Upregulated TLR3 Expression Presumably Indicate Active Immunotherapy Response
We hypothesized that upregulated TLR3 expression might shape an anti-cancer TIME and lead to an active immunotherapeutic response on account of the conception that high expression of TLR3 had a higher immune infiltration. Then we performed the analysis of the stromal and immune score between TLR3low and TLR3high groups to examine this assumption with the R package ESTIMATE. The immune infiltration levels in the TLR3high group were accompanied by a higher immune score compared with the TLR3low group, while there was no significant difference in the stromal score (Figure 6B).
However, the prediction of immunotherapeutic response (TIDE scores) was not ideal, and only one patient had no response (TIDE score >0),36 so we further assessed other biomarkers for immunotherapy. We observed that the TLR3low group scored low in IFN-γ (P = 6.009e-6), immune dysfunction (P = 0.005), Merck18 (T cell-inflamed signature, P = 6.177e-6) and CD8+ T cells (P = 7.090e-6), while scoring high in immune exclusion (P = 0.029) and TAM-M2 (tumor-associated macrophages M2 subtype, P = 0.005) when comparing with the TLR3high group (Figure 6C). There was no significant difference in PD-L1 (P = 0.436, Figure S5.A), MDSCs (P = 0.382, Figure S5.B) and CAFs (P = 0.848, Figure S5.C) between the TLR3low and TLR3high group.
We quantified the diverse immune cell populations between TLR3low and TLR3high groups by MCP-counter and ssGSEA algorithm to validate these results. In line with the TIDE results, the result of MCP-counter showed that upregulation of TLR3 not only scored higher in T cells (P = 1.753e-7), CD8+ T cells (P = 5.000e-6), cytotoxic lymphocytes (P = 3.500e-5), and B-cell lineage (P = 2.749e-3), but also in NK cells (P = 2.500e-7), monocytic lineage (P = 0.044) and myeloid DCs (P = 0.001, Figure 6D). Furthermore, there was no significant difference in CAFs (P = 0.219, Figure 6D) between the groups. The results of the Mann–Whitney U-test from ssGSEA are also shown in Table 4, in accordance with that of the MCP-counter method. We also found a significant difference in M1-type macrophages (Figure S5.D), Th1, Th2, MDSCs and M2-type macrophages (Figure S5.E) between the TLR3low and TLR3high groups (Table 4). These outcomes indicated that TLR3 might have potential applications of immune response and immunotherapy prediction in ESCC patients, mainly for immune-active cells rather than immune-suppressive cells.
Mechanisms of the TLR3-Induced Immune-Active Tumor Microenvironment
Analysis results of GSEA, the overall expression changes in ESCC were associated with the signatures of HALLMARK_COMPLEMENT (NES = 3.051; FDR q-value = 0.00), HALLMARK_INFLAMMATORY_RESPONSE (NES = 2.361; FDR q-value = 0.00), HALLMARK_INTERFERON_GAMMA_RESPONSE (NES = 2.345; FDR q-value = 0.00) and HALLMARK_APOPTOSIS (NES = 2.017; FDR q-value = 0.00, Figure 7A) in the hallmark gene sets. Moreover, immunologic signature gene sets correlated to CD8+ T cells, CD4+ T cells, Treg cells and DCs, such as “GSE3337_CTRL_VS_4H_IFNG_IN_CD8POS_DC_DN” (NES = 2.636, FDR q-value = 0.085), “GSE10325_CD4_TCELL_VS_MYELOID_UP” (NES = 2.546, FDR q-value = 0.089), “GSE14415_INDUCED_TREG_VS_FOXP3_KO_INDUCED_TREG_DN” (NES = 2.416, FDR q-value = 0.082), and “GSE22886_ NAIVE_CD8_ TCELL_VS_NKCELL_DN” (NES = 2.219, FDR q-value = 0.049, Figure 7B). The results of curated gene sets are shown in Figure 7C.
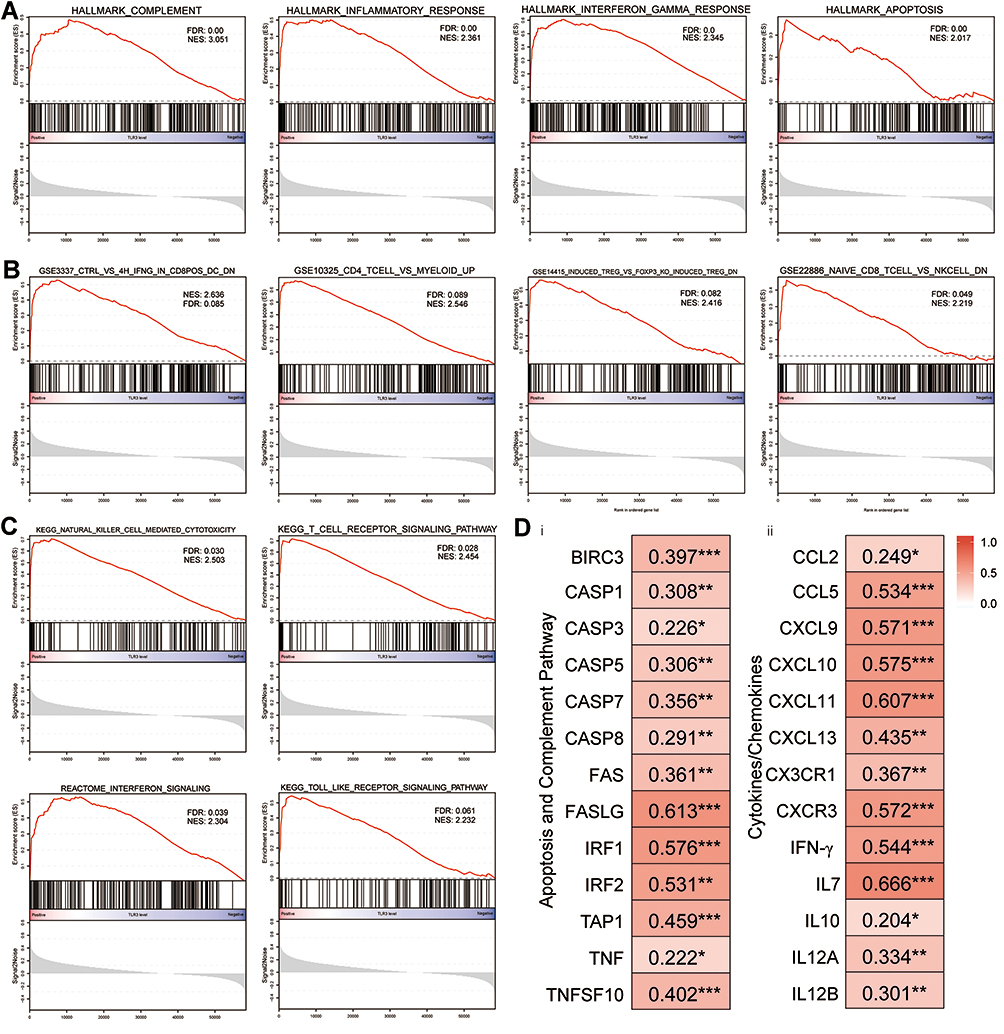 |
Figure 7 Canonical pathway analysis using GSEA and the relationship between TLR3 and related genes of signaling pathways, cytokines, and chemokines. (A) The most significant pathways in terms of the hallmark gene sets. (B) The most significant pathways in terms of the immunologic signature gene sets. (C) The most significant pathways in terms of the curated gene sets. (D) Correlations between TLR3 expression and gene expression changes in the apoptosis and complement signaling pathways (i), and cytokines and chemokines patterns (ii) in the tumor immune microenvironment. *P < 0.05, **P < 0.01, ***P < 0.001. |
The expression levels of the COMPLEMENT and APOPTOSIS signaling pathways were examined, including BIRC3, CASP3, CASP8, FASLG, IRF1, IRF2, TAP1, IFNB1, TNF, and TNFSF10.11,41,42 In accordance with previous discoveries, there was a significant relationship between TLR3, and the components as mentioned above (Figure 7Di). Moreover, it was also identified that pro-inflammatory cytokines, chemokine, and its receptor (including IFN-γ, IL-7, IL-12, CCL5, CXCL9, CXCL10, and CXCR3), which are known to attract Th1 cells, CD8+ and NK cells (Figure 7Dii).14,41,43 Taken together, these data suggest that activated apoptosis pathways and higher pro-inflammatory cytokines and chemokine may be a latent mechanism for TLR3-related immune-active TIME in ESCC.
Expression, Prognosis and TILs Pattern of TLR3 in Pan-Cancer
As shown in Figure S6, we included 28 cancer types for the analysis from the datasets to detect the expression pattern of TLR3 across human cancers. TLR3 was altered in 24 of 28 cancer types compared with adjacent normal tissues, including 9 with upregulated and 15 with downregulated TLR3 expression (P < 0.05). We found that there were six types of cancers that had good prognosis and longer OS with higher TLR3 expression, including adrenocortical cancer, kidney renal clear cell carcinoma, mesothelioma, sarcoma, skin cutaneous melanoma, and ESCA. In contrast, there was an opposite prognosis for lung squamous cell carcinoma, lower grade glioma and pancreatic cancer (Figure S7.A and B). The results of expression and prognosis indicated that TLR3 might play a dual role across human cancers.
We also assessed the relationship between TLR3 expression and TILs in the TISIDB database across human cancers (Figure S7.C). Expression of TLR3 in ESCA was correlated with abundance of effector memory CD8+ T cells (Tem, Rho = 0.494, P < 2.2e-16), activated CD8 cells (Act_CD8 cells, Rho = 0.355, P = 8.41e-7), activated B cells (Act_B cells, Rho = 0.319, P = 1.06e-16), Th1 cells (Rho = 0.303, P = 3.02e-05), activated DCs (Act_DCs, Rho = 0.281, P = 0.000111), and NK cells (Rho = 0.225, P = 0.00121) (Figure S7.D). These outcomes indicated that TLR3 might play a specific role in immune infiltration in ESCA patient as well.
Discussion
TLR3 is an essential component of innate and adaptive immunity and a pattern recognition receptor of viral double-stranded RNA (dsRNA). When activated, TLR3 can initiate a series of signal transduction pathways, including MyD88-dependent and MyD88-independent pathways, and eventually secretes proinflammatory cytokines and chemokines, initiating the innate immune response to infection and inflammatory and antigen-specific immunity against malignant cells.43 In recent years, it has been reported that TLR3 is abnormally expressed in several tumor tissues and is related to the treatment and prognosis in tumor patients. For instance, patients with low TLR3 expression in gastric cancer, prostate cancer, and breast cancer have a favorable prognosis. In contrast, patients with low TLR3 expression in hepatocellular carcinoma and neuroblastoma have a poor prognosis, indicating that the levels of TLR3 mRNA expression have a dual role in tumor types.11 However, the prognosis conveyed by TLR3 in ESCC patients has been paradoxical in reported researches, and its relationship with immune infiltration has not been studied.11,24,25 Therefore, we conducted this study to shed light on this unresolved issue.
In this study, we first found that TLR3 protein expression is positively correlated with early lesions of esophageal tissues and the overall distribution. The changes of TLR3 protein expression are consistent with that in esophageal adenocarcinoma and a previous study of ESCC.24,44 TLR3 mRNA expression also has a moderate positive correlation with gene copy numbers while being negatively correlated with methylation levels, which may provide preliminary insights on how TLR3 is regulated in ESCC tissue. Moreover, TLR3 protein expression is positively correlated with inflammation levels. Upwards of 15% ~ 20% of human cancers can be attributed to chronic inflammation and infections worldwide.45 Our previous study showed that the degree of inflammation was also correlated with precancerous lesions and markers of DNA damage, suggesting chronic inflammation and DNA damage involved in the carcinogenesis of ESCC.26 A study has reported that necrotic epithelial cells induce a TLR3-mediated proinflammatory effect involving NF-κB-dependent induction of IL-8 upregulation in esophageal cell cultures, leading to epithelial injury and inflammation.46 However, the pathogenetic significance of upregulated TLR3 expression in esophageal carcinogenesis remains ambiguous and requires further research. We also found that TLR3 protein is expressed uniformly in the cytoplasm and nucleus of tumor cells but is expressed moderately or deeply in the nucleus and weakly in the cytoplasm in the normal esophageal epithelium. The subcellular localization of TLR3 changes during different pathologic stages, suggesting a change in function in tumor progression. However, there is no precise explanation of such a pattern to date.11
Our results show that high protein and mRNA expression of TLR3 with ESCA patients is correlated with good prognosis and immune infiltrates in our tissue samples and TCGA ESCA. In light of Cox regression analysis, high TLR3 protein expression has an association with long OS and DSS and can serve as a prognostic biomarker. Interestingly, the prognosis of TLR3 mRNA expression is not statistically significant for ESCC patients in TCGA, while only pTNM stage III patients with high TLR3 mRNA expression have a good prognosis. Furthermore, the TCGA ESCA patients (including ESCC and esophageal adenocarcinoma) with low expression of TLR3 also had a poor prognosis, which is consistent with our tissue samples and a previous study.25 The primary mechanism through which higher level of TLR3 is correlated with favorable prognosis in cancers is apoptosis. Numerous researches have validated the function of TLR3 and its ligands to directly induce apoptosis in animal studies and cancer cells, such as hepatocellular carcinoma, breast cancer, lung cancer, and melanoma cell lines.8,11,47 In our study, GSEA analysis also showed upregulated TLR3 expression can activate the apoptotic pathway. The related apoptosis signals, including caspase-3 and caspase-8, also positively correlated with TLR3 mRNA expression in this study.48
The tumor immune microenvironment (TIME) also plays key roles in regulating tumor carcinogenesis, invasion, and metastasis.49 As is known, TLR3 is an essential bridge between innate immunity and acquired immunity. Numerous studies have demonstrated the function of TLR3 directly or via releasing IFN to activate tumor-specific NK cells, enhance CTL infiltration and response, establish Th1 immunity, and upregulate gene expression involved in the recruitment and functionality of those cells in tumors.12,50–52 Our data indicate TLR3 expression is positively correlated with the immune score. Notably, TLR3 expression has an explicit connection with immune infiltrations (including T cells and their subtypes such as CTL, CD8+ T, CD4+ T, Th1, and Th2, B cells, and NK cells) in ESCC. There is a higher abundance of CD8+ T, CTL, and NK cells in TLR3high tumors when compared with the TLR3low tumors. TLR3 mRNA expression is associated with proinflammatory cytokines (IFN) and chemokines IL-7, IL-12, CCL5, CXCL9, CXCL10, CXCR1, and CXCR3, which are known to attract Th1, CD8+ T, and NK cells.14,43 Furthermore, we found that increased expression of TLR3 could indicate the polarization of M2 to M1-type macrophages, which generally plays an anti-cancer effect.53 Our results suggest that elevated TLR3 level might lead to cancer cell apoptosis by activating immune cell infiltration.
There are several limitations to this study. First, our findings suggest that TLR3 has an increasing trend in different stages of cellular atypia, warranting further elucidation of the role of TLR3 in the progression of esophageal carcinogenesis. Second, TLR3 expression also has a slight association with immune-suppressive MDSCs, and there is a significant difference between low and high groups, which can impair antitumor immunity.54 Moreover, high TLR3 level leading to ESCC cell apoptosis is lacking verification of experimental results. The abundance of TILs is estimated based on the deconvolution-based and marker-gene-based methods of bioinformatics analyses. Therefore, further efforts in vivo/vitro experiments are needed to detect the explicit the mechanism of the effect of TLR3 on ESCC cells and immune infiltration in ESCC.
In conclusion, our findings provide a better understanding of the role of TLR3 in ESCC. TLR3 may be considered a prognostic biomarker and potential applications for immunotherapy and immune response prediction in ESCC patients if demonstrated in a further profound study.
Abbreviations
CAF, Cancer-associated fibroblast; CI, Confidence interval; CTL, Cytotoxic T lymphocyte; DC, Dendritic cell; DFI, Disease-free interval; DSS, Disease-specific survival; ESCA, Esophageal cancer; ESCC, Esophageal squamous cell carcinoma; ESSH, Esophageal simple hyperplasia; IEN, Intraepithelial neoplasia; HR, Hazard ratio; IHC, Immunohistochemistry staining; MDSC, Myeloid derived suppressor cell; OS, Overall survival; PFI, Progression-free interval; TLR3, Toll-like receptor 3; TLR, Toll-like receptor; TIME, Tumor immune microenvironment; TMEs, Tumor microenvironment; TIL, Tumor-infiltrating lymphocyte.
Data Sharing Statement
All datasets used and/or analyzed during the current study are available from the public database.
Acknowledgments
We thank Professor Stanley Lin for his work in language editing. The authors thank all the staff and assistants in the Department of Pathology of Shantou University Medical College for their support in collecting samples and prognostic data.
Funding
This work was partially funded by the National Natural Science Foundation of China (Grant No. 81772997, 82073290 and 81802835), and Innovative Team Grant of Guangdong Department of Education (Project No.2020KCXTD033).
Disclosure
All authors declare no conflicts of interest in this study.
References
1. Li J, Xu J, Zheng Y, et al. Esophageal cancer: epidemiology, risk factors and screening. Chin J Cancer Res. 2021;33(5):535–547. doi:10.21147/j.issn.1000-9604.2021.05.01
2. Abnet CC, Arnold M, Wei WQ. Epidemiology of esophageal squamous cell carcinoma. Gastroenterology. 2018;154(2):360–373. doi:10.1053/j.gastro.2017.08.023
3. Cao W, Chen HD, Yu YW, Li N, Chen WQ. Changing profiles of cancer burden worldwide and in China: a secondary analysis of the global cancer statistics 2020. Chin Med J (Engl). 2021;134(7):783–791. doi:10.1097/cm9.0000000000001474
4. Siegel RL, Miller KD, Fuchs HE, Jemal A. Cancer statistics, 2021. CA Cancer J Clin. 2021;71(1):7–33. doi:10.3322/caac.21654
5. He Z, Liu Z, Liu M, et al. Efficacy of endoscopic screening for esophageal cancer in China (ESECC): design and preliminary results of a population-based randomised controlled trial. Gut. 2019;68(2):198–206. doi:10.1136/gutjnl-2017-315520
6. Huang L, Xu H, Peng G. TLR-mediated metabolic reprogramming in the tumor microenvironment: potential novel strategies for cancer immunotherapy. Cell Mol Immunol. 2018;15(5):428–437. doi:10.1038/cmi.2018.4
7. Dajon M, Iribarren K, Cremer I. Toll-like receptor stimulation in cancer: a pro- and anti-tumor double-edged sword. Immunobiology. 2017;222(1):89–100. doi:10.1016/j.imbio.2016.06.009
8. Bonnin M, Fares N, Testoni B, et al. Toll-like receptor 3 downregulation is an escape mechanism from apoptosis during hepatocarcinogenesis. J Hepatol. 2019;71(4):763–772. doi:10.1016/j.jhep.2019.05.031
9. Chuang HC, Chou MH, Chien CY, Chuang JH, Liu YL. Triggering TLR3 pathway promotes tumor growth and cisplatin resistance in head and neck cancer cells. Oral Oncol. 2018;86:141–149. doi:10.1016/j.oraloncology.2018.09.015
10. Akira S, Uematsu S, Takeuchi O. Pathogen recognition and innate immunity. Cell. 2006;124(4):783–801. doi:10.1016/j.cell.2006.02.015
11. Muresan XM, Bouchal J, Culig Z, Souček K. Toll-like receptor 3 in solid cancer and therapy resistance. Cancers (Basel). 2020;12(11):3227. doi:10.3390/cancers12113227
12. Smith M, García-Martínez E, Pitter MR, et al. Trial watch: toll-like receptor agonists in cancer immunotherapy. Oncoimmunology. 2018;7(12):e1526250. doi:10.1080/2162402x.2018.1526250
13. Devaud C, John LB, Westwood JA, Darcy PK, Kershaw MH. Immune modulation of the tumor microenvironment for enhancing cancer immunotherapy. Oncoimmunology. 2013;2(8):e25961. doi:10.4161/onci.25961
14. Jin JO, Yu Q. Systemic administration of TLR3 agonist induces IL-7 expression and IL-7-dependent CXCR3 ligand production in the lung. J Leukoc Biol. 2013;93(3):413–425. doi:10.1189/jlb.0712360
15. Chang SC, Zhang BX, Su EC, et al. Hiltonol cocktail kills lung cancer cells by activating cancer-suppressors, PKR/ OAS,and restraining the tumor microenvironment. Int J Mol Sci. 2021;22:4. doi:10.3390/ijms22041626
16. Ishikawa T, Kageyama S, Miyahara Y, et al. Safety and antibody immune response of CHP-NY-ESO-1 vaccine combined with poly-ICLC in advanced or recurrent esophageal cancer patients. Cancer Immunol Immunother. 2021;70(11):3081–3091. doi:10.1007/s00262-021-02892-w
17. Quail DF, Joyce JA. Microenvironmental regulation of tumor progression and metastasis. Nat Med. 2013;19(11):1423–1437. doi:10.1038/nm.3394
18. Zheng X, Song X, Shao Y, et al. Prognostic role of tumor-infiltrating lymphocytes in esophagus cancer: a meta-analysis. Cell Physiol Biochem. 2018;45(2):720–732. doi:10.1159/000487164
19. King RJ, Qiu F, Yu F, Singh PK. Metabolic and immunological subtypes of esophageal cancer reveal potential therapeutic opportunities. Front Cell Dev Biol. 2021;9:667852. doi:10.3389/fcell.2021.667852
20. Baba Y, Yagi T, Kosumi K, et al. Morphological lymphocytic reaction, patient prognosis and PD-1 expression after surgical resection for oesophageal cancer. Br J Surg. 2019;106(10):1352–1361. doi:10.1002/bjs.11301
21. Shigeoka M, Urakawa N, Nakamura T, et al. Tumor associated macrophage expressing CD204 is associated with tumor aggressiveness of esophageal squamous cell carcinoma. Cancer Sci. 2013;104(8):1112–1119. doi:10.1111/cas.12188
22. Lim KS, Mimura K, Kua LF, Shiraishi K, Kono K. Implication of highly cytotoxic natural killer cells for esophageal squamous cell carcinoma treatment. J Immunother. 2018;41(6):261–273. doi:10.1097/cji.0000000000000227
23. Zhang S, Liu W, Hu B, et al. Prognostic significance of tumor-infiltrating natural killer cells in solid tumors: a systematic review and meta-analysis. Front Immunol. 2020;11:1242. doi:10.3389/fimmu.2020.01242
24. Sheyhidin I, Nabi G, Hasim A, et al. Overexpression of TLR3, TLR4, TLR7 and TLR9 in esophageal squamous cell carcinoma. World j Gastroenterol. 2011;17(32):3745–3751. doi:10.3748/wjg.v17.i32.3745
25. Sato Y, Motoyama S, Wakita A, et al. TLR3 expression status predicts prognosis in patients with advanced Thoracic esophageal squamous cell carcinoma after esophagectomy. Am J Surg. 2018;216(2):319–325. doi:10.1016/j.amjsurg.2018.01.038
26. Liu X, Zhang M, Ying S, et al. Genetic alterations in esophageal tissues from squamous dysplasia to carcinoma. Gastroenterology. 2017;153(1):166–177. doi:10.1053/j.gastro.2017.03.033
27. Nagtegaal ID, Odze RD, Klimstra D, et al. The 2019 WHO classification of tumours of the digestive system. HistoPathology. 2020;76(2):182–188. doi:10.1111/his.13975
28. Rice TW, Ishwaran H, Ferguson MK, Blackstone EH, Goldstraw P. Cancer of the esophageal and esophagogastric junction: an eighth edition staging primer. J Thorac Oncol. 2017;12(1):36–42. doi:10.1016/j.jtho.2016.10.016
29. Zhu Y, Ramos da Silva S, He M, et al. An oncogenic virus promotes cell survival and cellular transformation by suppressing glycolysis. PLoS Pathog. 2016;12(5):e1005648. doi:10.1371/journal.ppat.1005648
30. Gruffaz M, Vasan K, Tan B, Ramos da Silva S, Gao SJ. TLR4-mediated inflammation promotes KSHV-induced cellular transformation and tumorigenesis by activating the STAT3 pathway. Cancer Res. 2017;77(24):7094–7108. doi:10.1158/0008-5472.Can-17-2321
31. Warde-Farley D, Donaldson SL, Comes O, et al. The GeneMANIA prediction server: biological network integration for gene prioritization and predicting gene function. Nucleic Acids Res. 2010;38(suppl_2):W214–W220. doi:10.1093/nar/gkq537
32. Becht E, Giraldo NA, Lacroix L, et al. Estimating the population abundance of tissue-infiltrating immune and stromal cell populations using gene expression. Genome Biol. 2016;17(1):218. doi:10.1186/s13059-016-1070-5
33. Li T, Fu J, Zeng Z, et al. TIMER2.0 for analysis of tumor-infiltrating immune cells. Nucleic Acids Res. 2020;48(W1):W509–w514. doi:10.1093/nar/gkaa407
34. Yoshihara K, Shahmoradgoli M, Martínez E, et al. Inferring tumour purity and stromal and immune cell admixture from expression data. Nat Commun. 2013;4(1):2612. doi:10.1038/ncomms3612
35. Fu J, Li K, Zhang W, et al. Large-scale public data reuse to model immunotherapy response and resistance. Genome Med. 2020;12(1):21. doi:10.1186/s13073-020-0721-z
36. Jiang P, Gu S, Pan D, et al. Signatures of T cell dysfunction and exclusion predict cancer immunotherapy response. Nat Med. 2018;24(10):1550–1558. doi:10.1038/s41591-018-0136-1
37. Sturm G, Finotello F, Petitprez F, et al. Comprehensive evaluation of transcriptome-based cell-type quantification methods for immuno-oncology. Bioinformatics. 2019;35(14):i436–i445. doi:10.1093/bioinformatics/btz363
38. Aran D, Hu Z, Butte AJ. xCell: digitally portraying the tissue cellular heterogeneity landscape. Genome Biol. 2017;18(1):220. doi:10.1186/s13059-017-1349-1
39. Charoentong P, Finotello F, Angelova M, et al. Pan-cancer immunogenomic analyses reveal genotype-immunophenotype relationships and predictors of response to checkpoint blockade. Cell Rep. 2017;18(1):248–262. doi:10.1016/j.celrep.2016.12.019
40. Ru B, Wong CN, Tong Y, et al. TISIDB: an integrated repository portal for tumor–immune system interactions. Bioinformatics. 2019;35(20):4200–4202. doi:10.1093/bioinformatics/btz210
41. Su R, Shereen MA, Zeng X, et al. The TLR3/IRF1/Type III IFN axis facilitates antiviral responses against enterovirus infections in the intestine. mBio. 2020;11:6. doi:10.1128/mBio.02540-20
42. Li A, Wu H, Tian Q, Zhang Y, Zhang Z, Zhang X. Methylation regulation of TLR3 on immune parameters in lung adenocarcinoma. Front Oncol. 2021;11:620200. doi:10.3389/fonc.2021.620200
43. Chew V, Abastado JP. Immunomodulation of the tumor microenvironment by Toll-like receptor-3 (TLR3) ligands. Oncoimmunology. 2013;2(4):e23493. doi:10.4161/onci.23493
44. Helminen O, Huhta H, Lehenkari PP, Saarnio J, Karttunen TJ, Kauppila JH. Nucleic acid-sensing toll-like receptors 3, 7 and 8 in esophageal epithelium, Barrett’s esophagus, dysplasia and adenocarcinoma. Oncoimmunology. 2016;5(5):e1127495. doi:10.1080/2162402x.2015.1127495
45. Greten FR, Grivennikov SI. Inflammation and cancer: triggers, mechanisms, and consequences. Immunity. 2019;51(1):27–41. doi:10.1016/j.immuni.2019.06.025
46. Lim DM, Wang ML. Toll-like receptor 3 signaling enables human esophageal epithelial cells to sense endogenous danger signals released by necrotic cells. Am J Physiol Gastrointest Liver Physiol. 2011;301(1):G91–99. doi:10.1152/ajpgi.00471.2010
47. Alkurdi L, Virard F, Vanbervliet B, et al. Release of c-FLIP brake selectively sensitizes human cancer cells to TLR3-mediated apoptosis. Cell Death Dis. 2018;9(9):874. doi:10.1038/s41419-018-0850-0
48. Bianchi F, Alexiadis S, Camisaschi C, et al. TLR3 expression induces apoptosis in human non-small-cell lung cancer. Int J Mol Sci. 2020;21:4. doi:10.3390/ijms21041440
49. Hinshaw DC, Shevde LA. The tumor microenvironment innately modulates cancer progression. Cancer Res. 2019;79(18):4557–4566. doi:10.1158/0008-5472.Can-18-3962
50. Takeda Y, Kataoka K, Yamagishi J, Ogawa S, Seya T, Matsumoto M. A TLR3-specific adjuvant relieves innate resistance to PD-L1 blockade without cytokine toxicity in tumor vaccine immunotherapy. Cell Rep. 2017;19(9):1874–1887. doi:10.1016/j.celrep.2017.05.015
51. Le Naour J, Galluzzi L, Zitvogel L, Kroemer G, Vacchelli E. Trial watch: TLR3 agonists in cancer therapy. Oncoimmunology. 2020;9(1):1771143. doi:10.1080/2162402x.2020.1771143
52. Seya T, Takeda Y, Matsumoto MA. Toll-like receptor 3 (TLR3) agonist ARNAX for therapeutic immunotherapy. Adv Drug Deliv Rev. 2019;147:37–43. doi:10.1016/j.addr.2019.07.008
53. Belgiovine C, D’Incalci M, Allavena P, Frapolli R. Tumor-associated macrophages and anti-tumor therapies: complex links. Cell Mol Life Sci. 2016;73(13):2411–2424. doi:10.1007/s00018-016-2166-5
54. Parker KH, Beury DW, Ostrand-Rosenberg S. Myeloid-derived suppressor cells: critical cells driving immune suppression in the tumor microenvironment. Adv Cancer Res. 2015;128:95–139. doi:10.1016/bs.acr.2015.04.002
 © 2022 The Author(s). This work is published and licensed by Dove Medical Press Limited. The
full terms of this license are available at https://www.dovepress.com/terms
and incorporate the Creative Commons Attribution
- Non Commercial (unported, 3.0) License.
By accessing the work you hereby accept the Terms. Non-commercial uses of the work are permitted
without any further permission from Dove Medical Press Limited, provided the work is properly
attributed. For permission for commercial use of this work, please see paragraphs 4.2 and 5 of our Terms.
© 2022 The Author(s). This work is published and licensed by Dove Medical Press Limited. The
full terms of this license are available at https://www.dovepress.com/terms
and incorporate the Creative Commons Attribution
- Non Commercial (unported, 3.0) License.
By accessing the work you hereby accept the Terms. Non-commercial uses of the work are permitted
without any further permission from Dove Medical Press Limited, provided the work is properly
attributed. For permission for commercial use of this work, please see paragraphs 4.2 and 5 of our Terms.