Back to Journals » Drug Design, Development and Therapy » Volume 16
THSD7B Mutation Induces Platinum Resistance in Small Cell Lung Cancer Patients
Authors Yao Z, Lin A, Yi Y, Shen W, Zhang J, Luo P ![]()
Received 26 February 2022
Accepted for publication 7 May 2022
Published 3 June 2022 Volume 2022:16 Pages 1679—1695
DOI https://doi.org/10.2147/DDDT.S363665
Checked for plagiarism Yes
Review by Single anonymous peer review
Peer reviewer comments 2
Editor who approved publication: Dr Tuo Deng
Zifu Yao,1,2,* Anqi Lin,1,* Yonglin Yi,1,* Weitao Shen,1 Jian Zhang,1 Peng Luo1
1Department of Oncology, Zhujiang Hospital, Southern Medical University, Guangzhou, Guangdong, 510282, People’s Republic of China; 2The First Clinical Medical School, Nanfang Hospital, Southern Medical University, Guangzhou, Guangdong, 510515, People’s Republic of China
*These authors contributed equally to this work
Correspondence: Jian Zhang; Peng Luo, Email [email protected]; [email protected]
Aim: Several cases of small cell lung cancer (SCLC) patients demonstrate resistance to the treatment initiatives such as cisplatin after platinum chemotherapy. It is crucial to the improvement of the overall survival (OS) of SCLC patients to discover the gene mutation inducing platinum resistance within this cohort.
Patients and Methods: We analyzed the gene mutations significantly associated with the OS from 2 cohorts of SCLC platinum-treated patients. And then we screened out THSD7B mutation. In order to understand the mechanism between THSD7B mutation and platinum resistance, we designed gene mutation co-occurrence and mutual exclusivity analysis, gene set enrichment analysis (GSEA) and gene set variation analysis (GSVA) analysis, and Connectivity Map (CMap) analysis.
Results: The poor prognosis of THSD7B mutant patients may be related to the inhibition of cell death-related pathways, the up-regulation of cell invasion and metastasis pathways, and the down-regulation of immune response pathways. Lovastatin and cyclooxygenase inhibitors could be used as potential target compounds in THSD7B mutant patients, which provides reference for future research on platinum resistance.
Conclusion: THSD7B can be considered a reliable biomarker that effectively facilitates the prediction of poor survival in SCLC platinum-treated patients.
Keywords: small cell lung cancer, gene mutation, platinum, chemotherapy resistance, prognosis
Introduction
Small cell lung cancer accounts for 15% of all lung cancers. It occurs particularly in elderly men and smokers and is prone to involve early distant metastasis.1 Many patients with small cell lung cancer exhibited a wide range of diseases at the time of treatment, along with substantially poor prognoses.2 Patients with extensive metastasis are primarily treated with concurrent chemoradiotherapy. At present, cisplatin or carboplatin combined with etoposide remains the first-line chemotherapy for SCLC. Many patients with extensive stage SCLC (ES-SCLC) frequently relapse, and rarely survive for over 2 years (10–20%),3 exhibiting a median survival time of only 7–10 months.4 Platinum therapy has been identified for its lack of efficacy in treating ES-SCLC, as the majority of patients quickly develop chemotherapy resistance following first-line chemotherapy. Moreover, platinum therapy fails to meet the efficacy standards of second-line chemotherapy, and is subsequently not found to be suitable.5 Thus, overcoming SCLC patients’ chemotherapy resistance has become a major obstacle in clinical therapeutics.
Recently, the rapid development of second-generation sequencing has led to the discovery of gene mutation’s role as a mechanism of cisplatin resistance.6 Zhang et al found that a TP53 K351N mutation was related to acquired cisplatin resistance in ovarian cancer.7 BRCA mutant cancer cells demonstrate abnormal DNA homologous recombination (HR) repair related to PARP, and some studies have also shown that PARP inhibitors sensitize cancer cells to DNA damaging drugs such as platinum.8 Hirai et al reported that WEEL inhibitors enhance the anti-tumor effect of DNA damaging drugs such as platinum drugs.9 They indicated that cancer cells with TP53 mutations are susceptible to the combination of WEEL inhibitors and platinum drugs.10 In contrast, Van et al indicated that this effect is somewhat independent of p53ʹs function.11 At present, the relationship between the SCLC high-frequency mutation gene and cisplatin resistance remains unclear.
Platinum-related gene mutation does not establish a complete and rich connection with signaling pathways. Many studies focus on classical oncogenes or tumor suppressor genes. However, it remains necessary to further analyze SCLC genomic data, explore potential biomarkers for predicting cisplatin resistance, and enrich the understanding of biomarkers in platinum resistance.
In this study, the use of WES, clinical data from the Zhujiang Hospital, and the George et al cohort1 were analyzed to screen biomarkers of poor survival in SCLC platinum chemotherapy-treated patients. The potential biomarkers’ drug resistance mechanism was explored from the perspective of multi-omics. In addition, we investigated the potential targeted compounds of platinum chemotherapy-treated patients with poor survival, which can provide further evidence in the improvement of the treatment approach for platinum resistance.
Materials and Methods
Clinical Samples and Data Acquisition
The research design of this paper is illustrated in Figure 1.
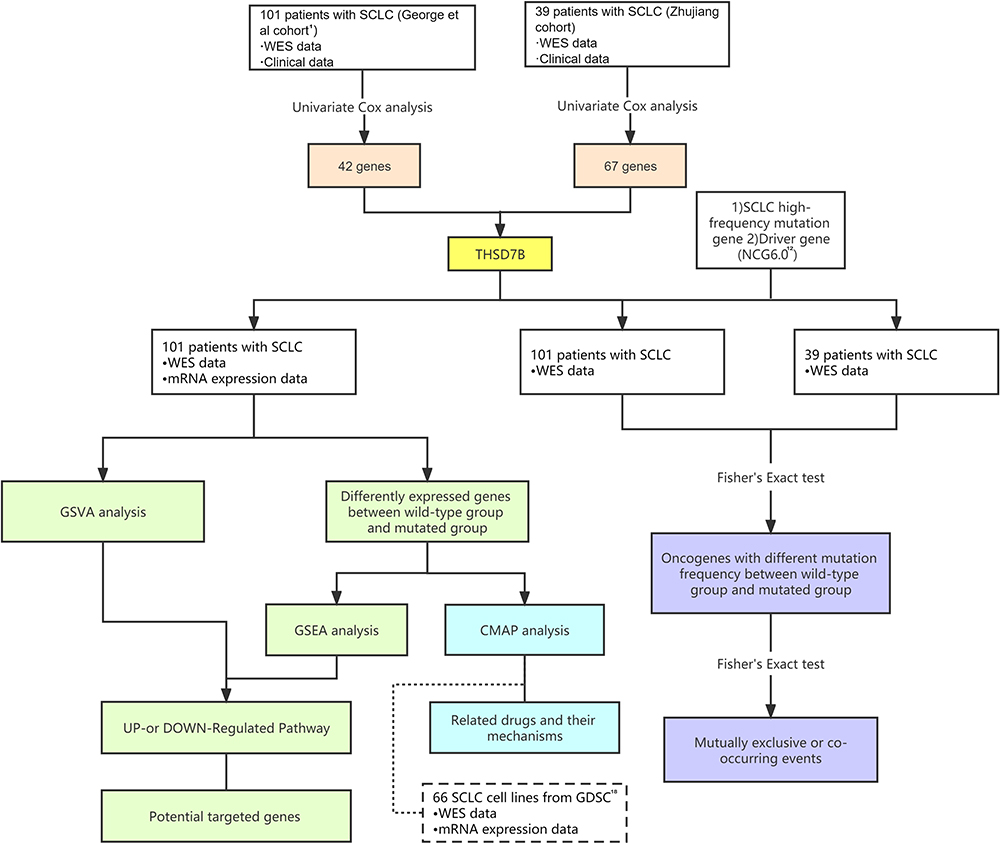 |
Figure 1 Workflow of the bioinformatic analysis. Abbreviations: SCLC, small cell lung cancer; WES, whole exome sequencing; NCG6.0, Network of Cancer Genes & Healthy drivers 6.0; GSVA, gene set variation analysis; GSEA, gene set enrichment analysis; CMAP, Connectivity Map; GDSC, Genomics of Drug Sensitivity in Cancer. |
Briefly, we selected 52 treatment-naïve SCLC patients from the Zhujiang Hospital. All of these patients were diagnosed at as stage IV SCLC patients, and received first-line chemotherapy treatment for SCLC in the form of cisplatin combined with etoposide. 39 patients were finally included in the Zhujiang cohort, inclusive of WES and OS information. In addition, we used 101 patient samples with WES and OS information from the George et al cohort.1 A majority of these patients were treatment-naive, with only five cases recorded at the time of relapse. The therapeutic treatment for patients in the George et al cohort1 was comprehensive, with 59 receiving chemotherapy, 42 receiving radiotherapy, and 5 receiving neoadjuvant chemotherapy. Accordingly, we removed synonymous mutation in the WES data in both cohorts, and retained non-synonymous mutation data.
Screening Gene Mutations Significantly Related to OS
In the Zhujiang and George et al cohorts,1 we identified mutant genes with significant OS correlation via a univariate Cox proportional hazard regression model (mutant frequency> 5%). Then, we selected the intersection of mutant genes from the two cohorts that were significantly related to OS, and only the THSD7B mutation was obtained.
Analysis of Gene Mutation Co-Occurrence and Mutual Exclusion
First, we analyzed the co-occurrence or mutual exclusivity of the top 20 frequently mutated genes. Then, by Fisher’s exact test, we detected the difference in the mutation frequency of the driver genes between the THSD7B-mutated group (THSD7B-MUT) and the wild type THSD7B group (THSD7B-WT) and selected the top 20 mutated driver genes for gene mutation co-occurrence and mutual exclusivity analysis. The driver genes were obtained from the NCG6.0 (Network of Cancer Genes & Healthy drivers 6.0) database (http://ncg.kcl.ac.uk).12 The R package “maftools”13 analyzed gene mutations’ co-occurrence or mutual exclusivity and visualized the results.
Gene Enrichment Analysis
We employed the expression matrix of George et al cohort1 and quantified the expression levels as log2(TPM+1). The differentially expressed genes (DEGs) were calculated by R package “limma”,14 and the cutoff value of logFC was calculated as mean (ABS (log FC))+2 * SD (ABS (log FC)). R package “ggplot2”15 was used to draw a volcano plot showing significant DEGs with P<0.05 (Supplementary Figure 1A). In THSD7B-MUT and THSD7B-WT, the expression of top20 shared DEGs is shown in Supplementary Figure 1B.
We used the canonical pathways of curated gene sets (C2 gene set) obtained from the Broad Institute Molecular Signatures Database (MSigDB)16 for gene enrichment analysis, and P<0.05 indicated a significant difference in these canonical pathways. The gene set enrichment analysis (GSEA) was carried out using the R package “clusterprofiler”.17 We then selected the cancer-associated pathways using the PubMed dataset (https://pubmed.ncbi.nlm.nih.gov/). The GSVA score of each cancer-associated pathway of a single sample was calculated by the GSVA algorithm. The top 10 pathways with differences between the THSD7B-MUT group and the THSD7B-WT group were screened out. In order to further screen out the core genes of the pathways, we intersected the DEGs between THSD7B-MUT and THSD7B-WT in the George et al cohort,1 in addition to the top 10 pathways’ gene sets.
Prediction of Potential Targeted Compound
We introduced 66 SCLC cell lines from Genomics of Drug Sensitivity in Cancer (GDSC) as verification sets. The WES data and expression matrices were obtained from GDSC1000 (https://www.cancerrxgene.org/gdsc1000/GDSC1000_WebResources/Home.html),18 and the gene expression matrix was obtained from the RMA file. Based on the WES data and the expression matrix of GDSC-SCLC cell lines, the differentially expressed THSD7B-MUT genes and cell lines were calculated via the same method. The DEGs of GDSC-SCLC cell lines and their respective analyses are shown in Supplementary Figure 2. Subsequently, we selected the top 500 up-regulated and down-regulated genes from the George et al cohort1 and GDSC-SCLC cell lines and sorted them in the input file (grp file) required by the Connectivity Map (CMap). We uploaded the file to the CMap build 02 query (https://portals.broadinstitute.org/cmap/) to analyze the data and determine the drugs with apparent enrichment. MoA files were obtained from https://clue.io/ to explore the mechanism of action of significant drugs.
Statistical Analysis
The full-text bioinformatic analysis was carried out in R 3.6.3. R package “ggplot2”,15 and was used to draw a bubble chart and visualize a multivariate Cox proportional hazards regression model. We analyzed the OS of THSD7B-MUT and THSD7B-WT using the Kaplan-Meier method, while the survival analysis was visualized by the R packages “survival”19 and “survminer”.20 The R package “venn” was used to draw a Venn diagram to show the intersection between genes significantly related to OS (mutation frequency > 5%) in the Zhujiang cohort and George et al cohort.1 Likewise, the R package “ComplexHeatmap”21 was used to illustrate the mutational landscape of gene mutations. The package “maftools”13 was used to draw a lollipop plot. The package “forest” was used to illustrate the forest map of univariate Cox proportional hazard regression. GSVA scores in the THSD7B-WT and THSD7B-MUT groups were compared through a t-test. Here, P<0.05 indicates that the difference is statistically significant, and all statistical tests are bilateral.
Results
THSD7B Mutation is Associated with Poor Prognosis of SCLC Patients Treated with Platinum
We collected both WES and clinical data from 39 SCLC patients in the Zhujiang cohort and calculated the correlation between gene mutations and OS via a univariate Cox regression model. We screened out 67 genes with gene mutation frequencies greater than 5% that were significantly correlated with OS. These all showed a significant negative correlation with OS (Figure 2A, Supplementary Figure 3A, P<0.05, HR>1). Similarly, we calculated the influence of gene mutations on OS in 101 samples from the George et al cohort1 by univariate Cox proportional hazard regression model. Then, we screened out 42 genes with gene mutation frequency greater than 5% and significantly correlated with OS, among which 39 genes were significantly negatively correlated with OS (Figure 2B, Supplementary Figure 3B, P<0.05, HR>1). After considering the intersection of the above results, only the THSD7B mutation was obtained (Figure 2C).
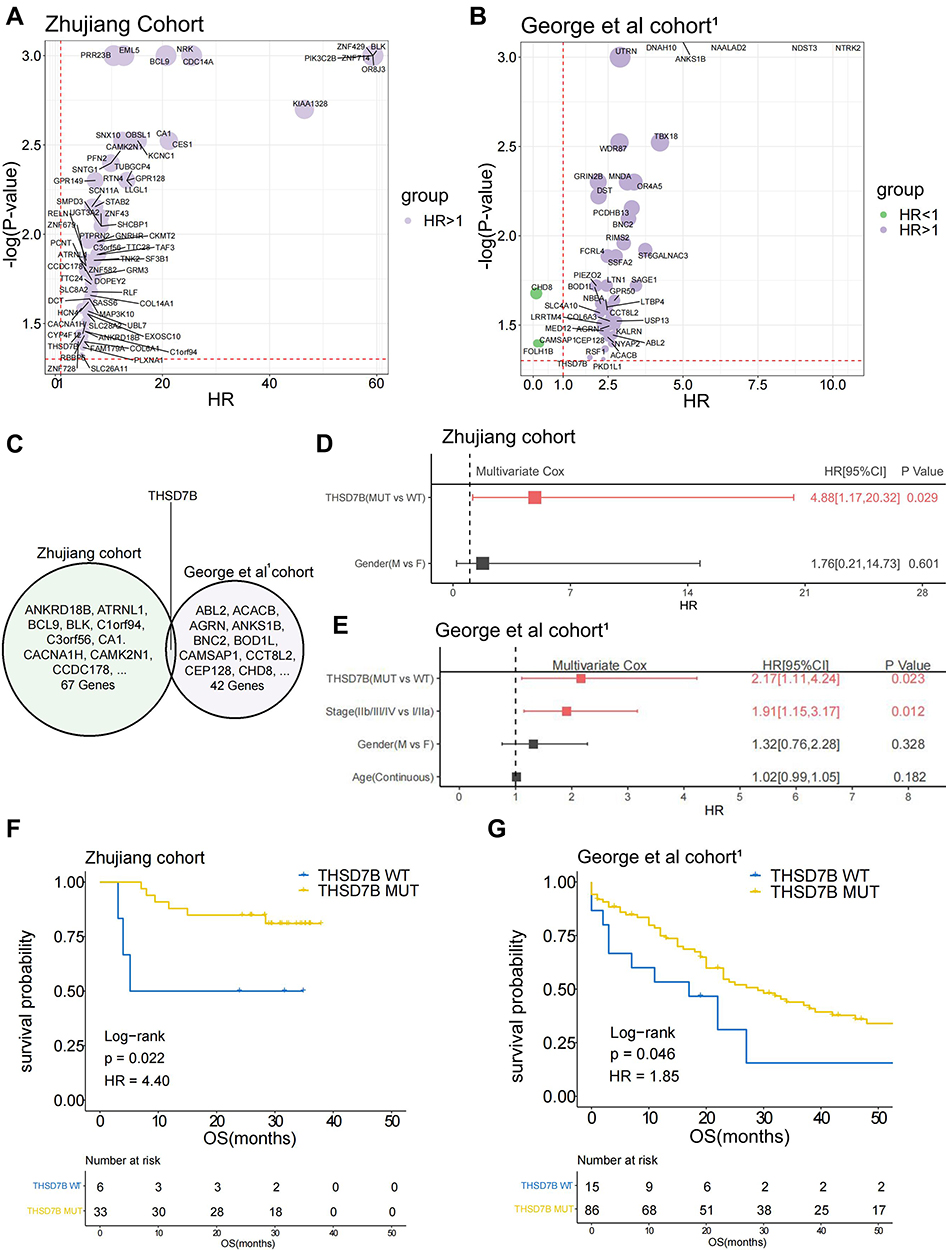 |
Figure 2 THSD7B mutation is significantly related to the poor prognosis of SCLC patients treated with platinum. (A and B) The bubble chart shows the gene mutations significantly related to OS according to univariate Cox proportional hazard regression analysis (Zhujiang cohort and George et al cohort1). (C) The Venn diagram shows two cohorts’ intersection with significant OS-related gene mutations, where THSD7B was the only intersection gene. (D and E) A multivariate Cox proportional hazard regression model was used to analyze the relationship between THSD7B mutation and the clinical characteristics and OS (Zhujiang cohort and George et al cohort1). (F and G) Kaplan-Meier analyzed the prognosis of THSD7B-WT patients and THSD7B-MUT patients (Zhujiang cohort and George et al cohort1) (P<0.05, Log rank test). Abbreviations: OS, overall survival; SCLC, small cell lung cancer; THSD7B-MUT, THSD7B mutant group; THSD7B-WT, THSD7B wild-type group. |
In order to explore whether THSD7B mutation is an independent factor affecting the survival of patients, we conducted a multivariate Cox proportional hazard regression model on the clinical information and the mutation status of THSD7B from patients in the Zhujiang and George et al cohorts.1 The results indicated that THSD7B mutation can affect the survival of patients, although the result was not unique (P<0.05, Figure 2D and E). In the Zhujiang cohort, the OS of patients with THSD7B-MUT was significantly shorter than that of patients with THSD7B-WT (P=0.02, Figure 2G). Similarly, in the George et al cohort,1 THSD7B mutation was also found to be significantly associated with poor prognoses (P=0.046, Figure 2F).
We then explored the relationship between THSD7B mutation and THSD7B expression in George et al cohort.1 No significant differences of THSD7B expression between THSD7B-WT group and THSD7B-MUT group were found (Supplementary Figure 4A). Further, no significant correlation was found between THSD7B expression and the OS of patients in the George et al cohort,1 (Supplementary Figure 4B). This result suggested that the particular mechanism by which THSD7B mutations mediate poor prognosis in SCLC patients was complex. Hence we further discovered the relationship between other gene mutations and THSD7B mutation.
The Relationship Between THSD7B Mutation, SCLC High-Frequency Mutation Gene, and the Affiliated Clinical Features
In the Zhujiang and George et al cohorts,1 we discovered that there were no significant differences observed in the clinical characteristics (age, gender and smoking history) between patients in the THSD7B mutation group and the wild-type group (P>0.05, Supplementary Table 1)
The gene-mutational landscapes of the top 20 most frequently mutated genes in the Zhujiang cohort and George et al cohorts1 are shown in Figure 3A and B. Among them, missense mutation was the most common mutation type observed in the THSD7B-MUT and THSD7B-WT groups. Compared to the THSD7B-WT group, the mutation frequency of the top 20 most frequently mutated genes in the THSD7B-MUT group was higher in the Zhujiang cohort, but there was no significant difference between them (Figure 3A). The George et al cohort1 displayed the gene mutation frequencies of ZFHX4 (67% vs 36%) and EYS (53% vs 19%), which were significantly higher in THSD7B-MUT patients (Fisher’s exact test, P<0.05, Figure 3B).
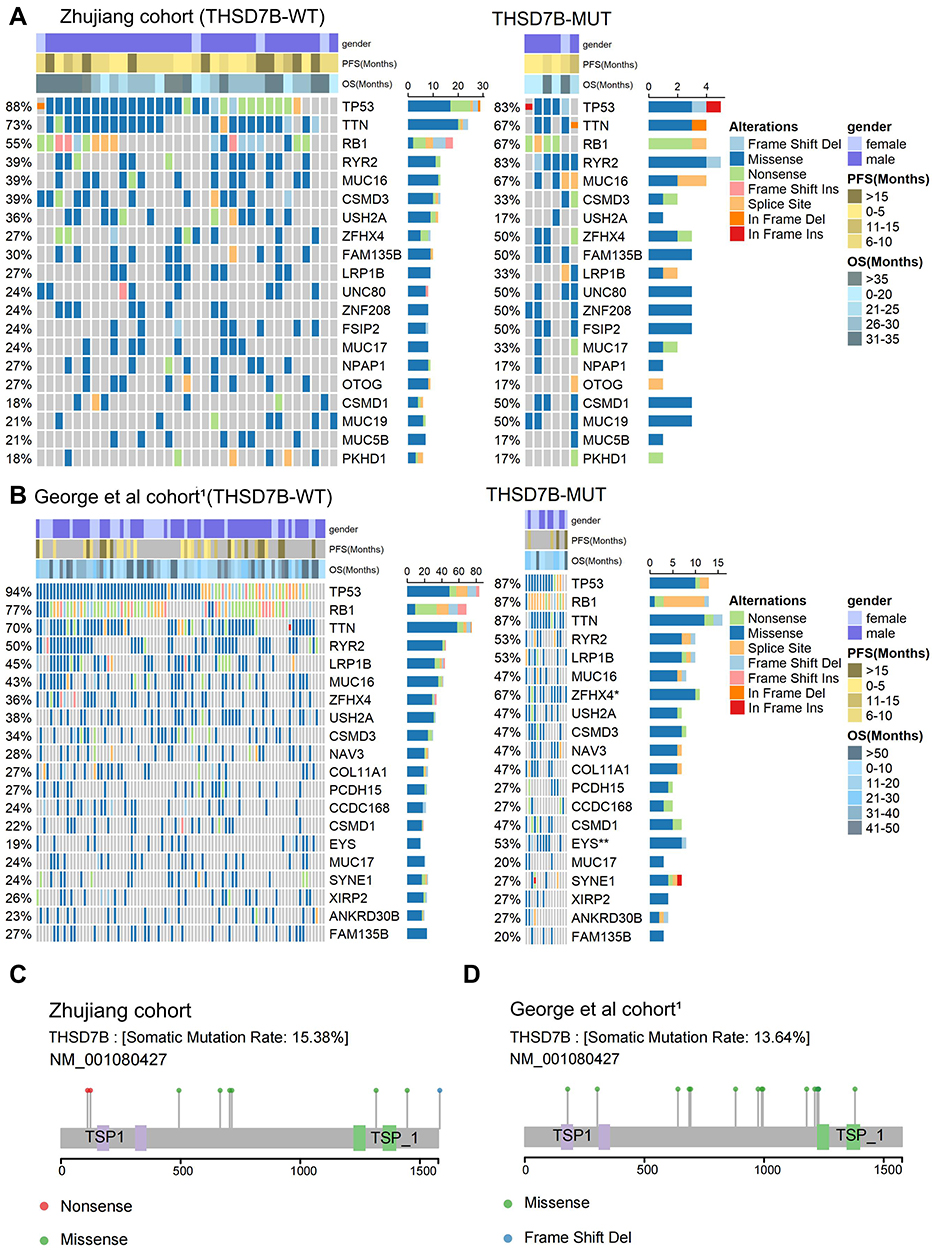 |
Figure 3 Mutational landscape of THSD7B-MUT and THSD7B-WT and the characteristics of THSD7B mutations at the protein level. (A and B) The mutational landscape shows the top 20 high-frequency mutant genes in THSD7B-MUT and THSD7B-WT (Zhujiang cohort and George et al cohort1). Gender, PFS time, and OS time were noted. Genes with significantly different mutation frequencies have been marked (Fisher’s exact test, P<0.05,“*”; P<0.01,“**”). (C and D) The lollipop plot shows the characteristics of THSD7B mutation at the protein level (Zhujiang cohort and George et al cohort1). Abbreviations: PFS, progression-free survival; OS, overall survival; THSD7B-MUT, THSD7B mutant group; THSD7B-WT, THSD7B wild-type group. |
The lollipop plot shows the mutation of the THSD7B gene at the protein level. The protein level mutations in the Zhujiang cohort included nonsense and missense mutations and frameshift deletion mutations, where the mutation time =1 (Figure 3C). Likewise, missense and frameshift deletion mutations can be observed in the George et al cohort,1 where the mutation frequency =1. There were no nonsense mutations identified in the George et al cohort1 (Figure 3D).
In order to explore the mutation pattern of gene pairs among the top 20 most frequently mutated genes in the two cohorts’ THSD7B-MUT patients, we conducted a gene mutation co-occurrence and mutual exclusivity analysis on THSD7B-MUT and THSD7B-WT in the two cohorts, respectively. We detected the significance of the events by Fisher’s exact test, where THSD7B-MUT had more gene pairs with significant co-occurrence mutation. For example, FSIP2-CSMD1, ZFHX4-CSMD1, FSIP2-ZFHX4, ZNF208-MUC19 genes were significantly associated with the co-occurrence mutation (P<0.01, Figure 4A), while the co-occurrence mutation of these gene pairs was not significant in THSD7B-WT (Figure 4B).
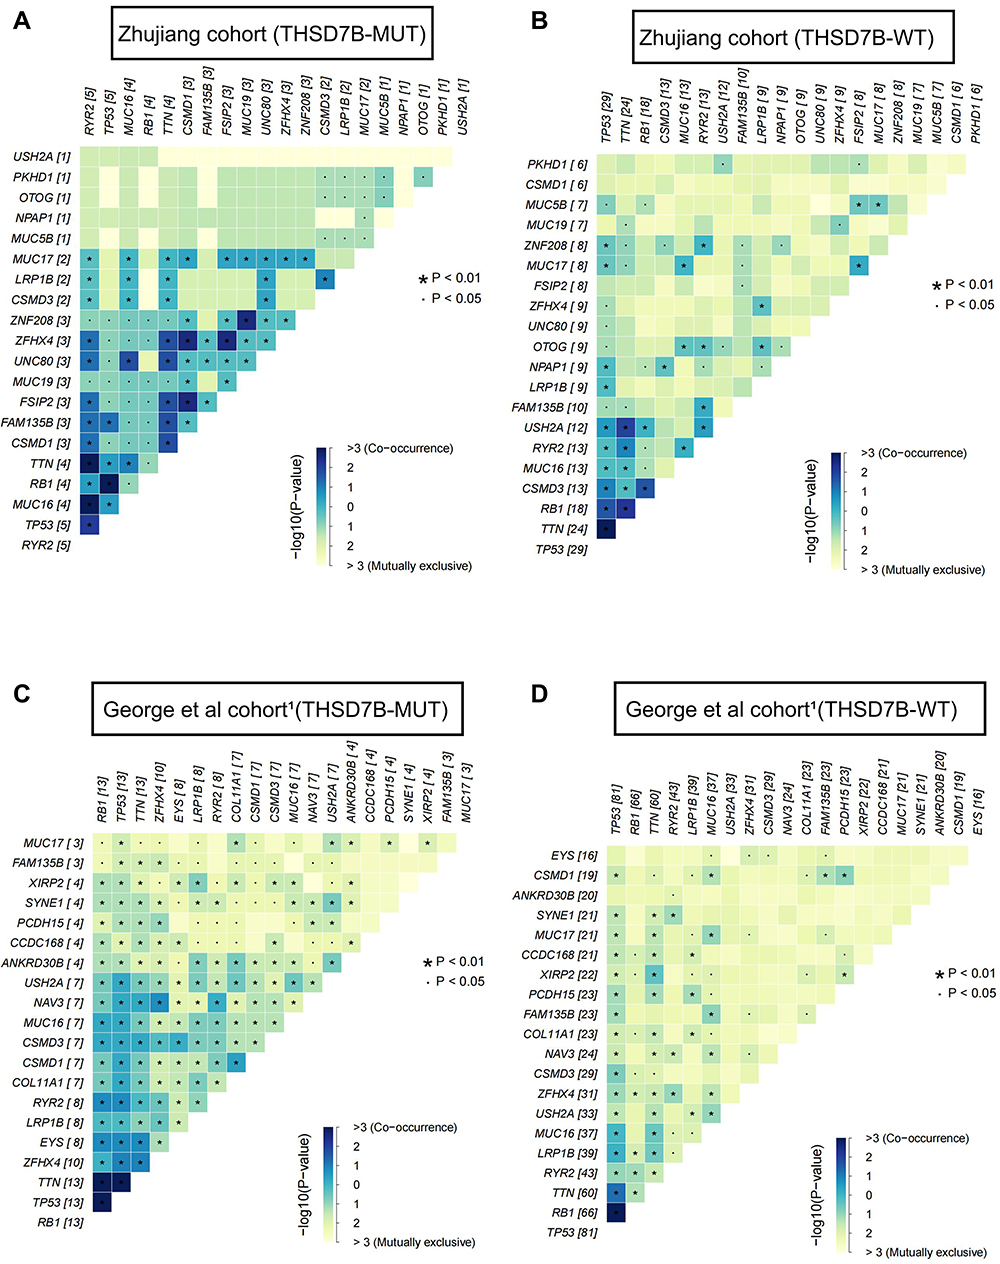 |
Figure 4 Co-occurrence mutation and mutual exclusivity of high-frequency mutant genes between THSD7B-MUT and THSD7B-WT. (A and B) Heatmap shows the co-occurrence mutation and mutual exclusivity of high-frequency mutant genes in THSD7B-MUT patients and THSD7B-WT patients (Zhujiang cohort) (Fisher’s exact test, P<0.01, “*”, P<0.05, “.”). (C and D) Heatmap shows the co-occurrence mutation and mutual exclusivity of high-frequency mutant genes in THSD7B-MUT patients and THSD7B-WT patients (George et al cohort1) (Fisher’s exact test, P<0.01, “*”, P<0.05 “.”). Abbreviations: THSD7B-MUT, THSD7B mutant group; THSD7B-WT, THSD7B wild-type group. |
Compared with THSD7B-WT, ZFHX4 and FSIP2 in THSD7B-MUT were both more likely to mutate when observed among the top 20 most frequently mutated genes. Similarly, in THSD7B-MUT patients in the George et al cohort,1 ZFHX4 was also more likely to mutate among the top 20 most frequently mutated genes in this cohort (Figure 4C). For genes EYS and ZFHX4 (P<0.01, P<0.05, Figure 3B), which have significantly changed mutation frequency in THSD7B-MUT, significant co-occurrence mutation was observed in THSD7B-MUT (P<0.05, Figure 4C), while mutual exclusivity of this pair of gene mutations was observed in THSD7B-WT (P<0.05, Figure 4D). This data suggests that the co-occurrence mutation of EYS and ZFHX4, a pair of high-frequency mutation genes, may be a potential factor for mediating platinum resistance in THSD7B-MUT SCLC patients.
The Relationship Between THSD7B Mutation and Driver Gene Mutation
We explored the relationship between the THSD7B and driver gene mutations. The driver gene mutation information was obtained from NCG6.0 (http://ncg.kcl.ac.uk/).12 First, Fisher’s exact test was used to analyze the difference in mutation frequency between THSD7B-MUT and THSD7B-MUT. Figure 5A and B display the mutational landscape of top20 differential mutation frequency genes’ driver genes in both the Zhujiang and George et al cohorts.1 There was no intersection between the driver genes screened from the two data sets. The mutation frequency of the driver genes screened from the two cohorts in THSD7B-MUT was higher than that in THSD7B-WT.
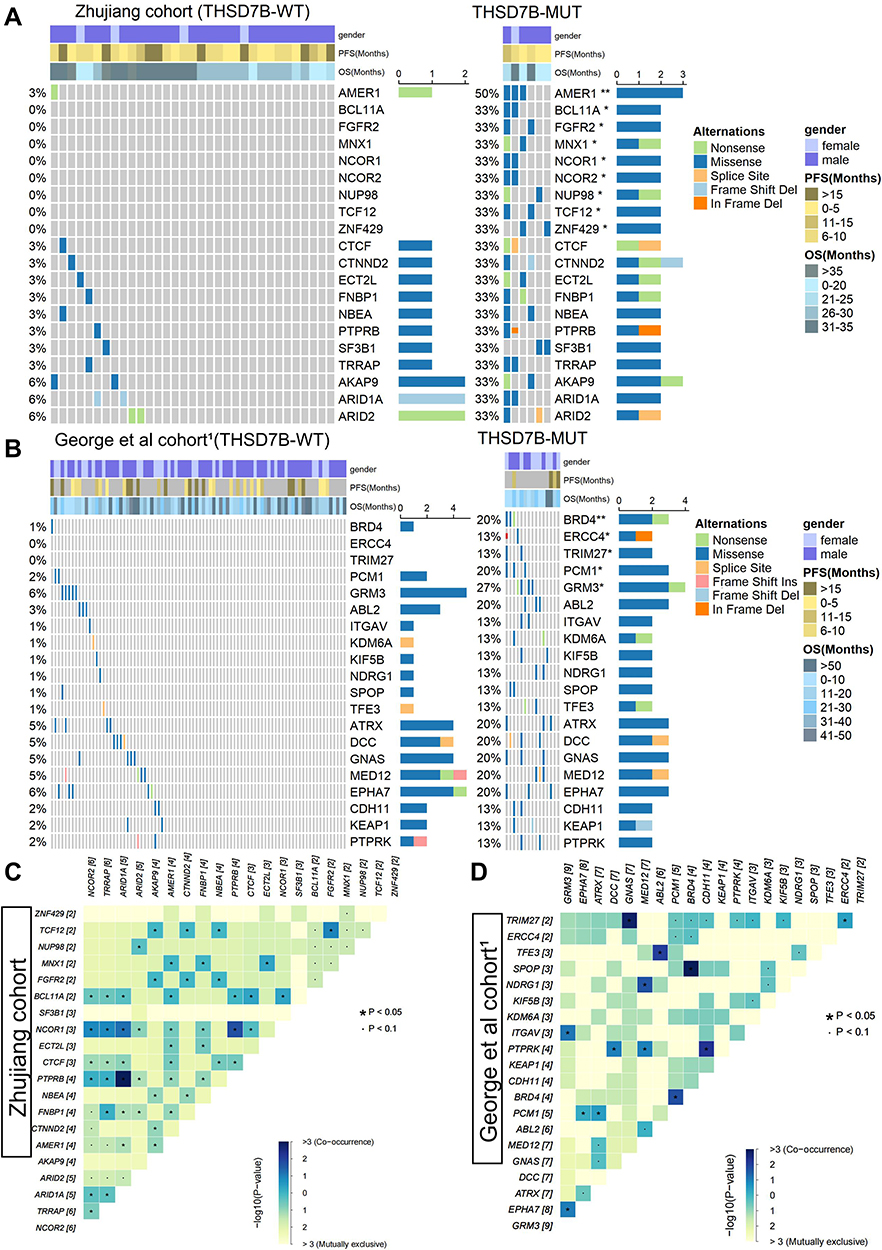 |
Figure 5 Driver genes of differential mutation frequency between THSD7B-MUT and THSD7B-WT. (A and B) Mutational landscape shows the top20 differential mutation frequency driver genes between the THSD7B-MUT and THSD7B-WT (Zhujiang cohort and George et al cohort1). Gender, PFS time, and OS time were noted. The driver genes with significant differences in gene mutation frequency between the two groups have been marked (Fisher’s exact test, P<0.05,“*”, P<0.01, “**”). (C and D) Heatmap shows the co-occurrence mutation and mutual exclusivity of the top 20 driver genes with different mutation frequencies between THSD7B-MUT and THSD7B-WT (Zhujiang cohort and George et al cohort1) (Fisher’s exact test, P<0.05, “*”, P<0.1, “.”). Abbreviations: PFS, progression-free survival; OS, overall survival; THSD7B-MUT, THSD7B mutant group; THSD7B-WT, THSD7B wild-type group. |
In the Zhujiang cohort, the driver genes with significant mutation frequency difference include AMER1 (50% vs 3%), BCL11A (33% vs 0%), FGFR2 (33% vs 0%), MNX1 (33% vs 0%), NCOR1 (33% vs 0%), NCOR2. NUP98 (33% vs 0%), TCF12 (33% vs 0%), ZNF429 (33% vs 0%), and their most common mutation type was recorded as the missense mutation (P<0.05, Figure 5A). In THSD7B-MUT the mutation types group was more abundant, and splice site mutation and in-frame deletion were not detected in the THSD7B-WT (Figure 5A).
In the comparison to the George et al cohort,1 and THSD7B-WT group, the mutation frequencies of BRD4 (20% vs 1%), ERCC4 (13% vs 0%), PCM1 (20% vs 2%) and GRM3 (27% vs 6%) in THSD7B-MUT were significantly different from those in THSD7B-WT (P<0.05, Figure 5B). In the THSD7B-MUT group, frameshift deletion and in-frame deletion mutations were detected, which did not exist in the THSD7B-WT group. These two mutation types were observed in ERCC4 and KEAP1 (Figure 5B).
We investigated the co-occurrence and mutual exclusivity of mutant genes to explore the potential mechanism of significant mutation frequency differences among these driver genes. For the Zhujiang cohort, there were several pairs of genes with significant co-occurrence mutation patterns, which were NCOR2-NCOR1, TCF12-FGFR2, BCL11A- NCOR1, and AMER1-MNX1 (P<0.05, Figure 5C) among the genes shown in Figure 5A with significant differences in mutation frequency between THSD7B-MUT and THSD7B-WT (P<0.05). For the George et al cohort,1 we found that among the genes shown in Figure 5B, which showed significantly different mutation frequencies between THSD7B-MUT and THSD7B-WT (P<0.05, Figure 5B), the BRD4-PCM1 gene pair had a significant co-occurrence mutation pattern (P<0.05, Figure 5D).
THSD7B Mutation and Signaling Pathway
In order to understand the potential pathways related to the THSD7B mutation, we utilized the GSEA analysis to calculate the enrichment scores of canonical pathways from the C2 gene sets,16 and pathways with P<0.05 were screened out.17 Cancer-associated pathways were selected by searching the PubMed dataset (https://pubmed.ncbi.nlm.nih.gov/). We also analyzed the differences between the GSVA scores of THSD7B-MUT and THSD7B-WT and then selected the top 10 cancer-related pathways with differences between THSD7B-MUT and THSD7B-WT. There are three cell metabolism-related pathways: the up-regulated pathway is the NOS1 Pathway, while the down-regulated pathway is the Adipocytokine Signaling Pathway and Eicosanoids (P<0.05, Figure 6A). Similarly, three immune-related pathways were down-regulated, the IL1R Pathway, the TCR Calcium Pathway, and the IL2 mediated Pathway (P<0.05, Figure 6B). The four pathways related to the cell cycle were down-regulated, namely the P53 Downstream Pathway, the PI3K-Akt network, the TGFβ Signaling Pathway, and the Smad2/Smad3: Smad4 heterotrimer regulators transcription (P<0.05, Figure 6C). Among them, significant differences were detected in 8 pathways (P<0.05, Figure 6D), while no significant differences were detected in 2 pathways (Adipocytokine Signaling Pathway, P = 0.056; IL2 Mediated Pathway, P=0.078).
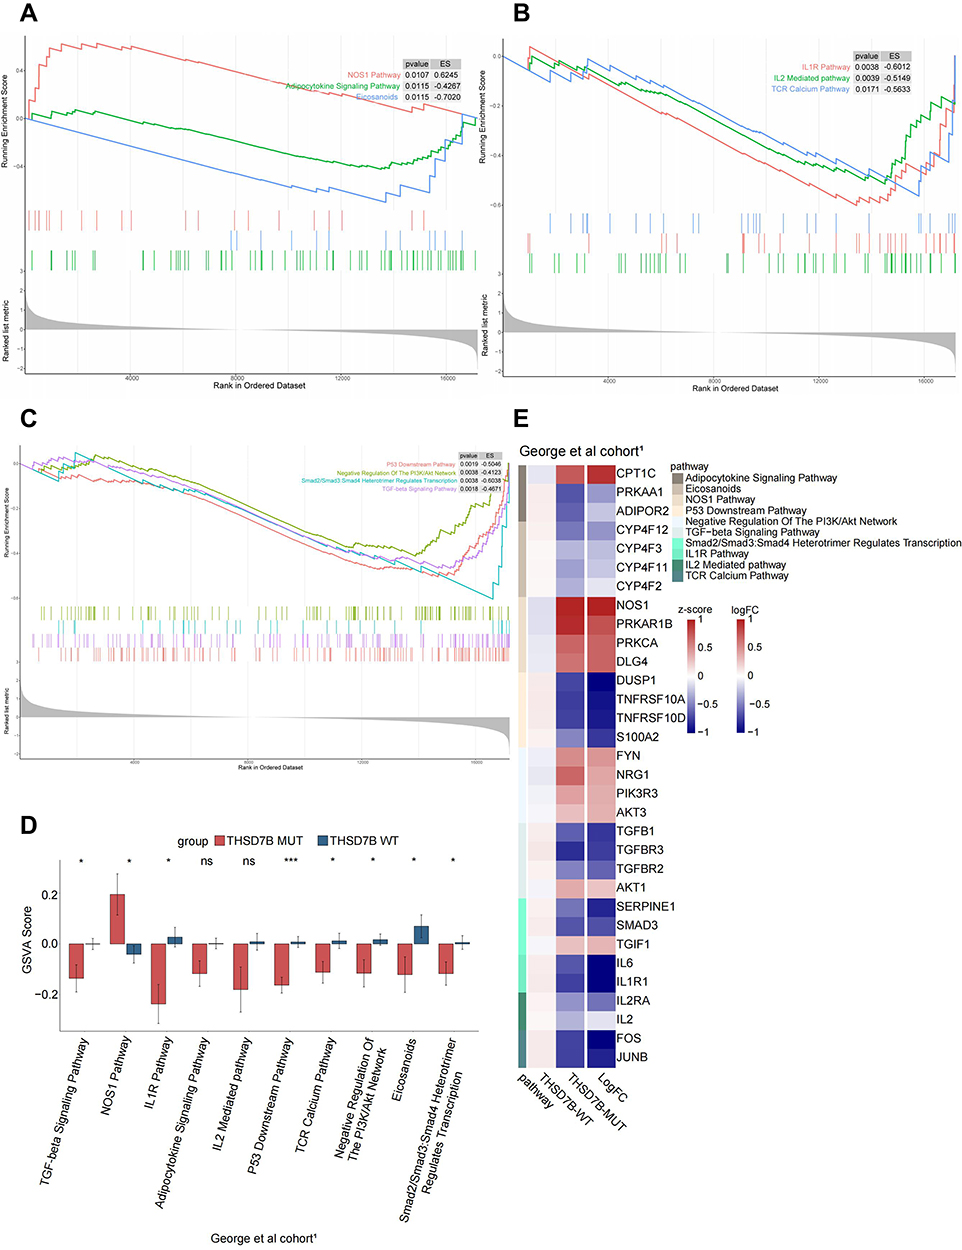 |
Figure 6 Potential signaling pathways of adverse prognosis in THSD7B-MUT patients in the George et al cohort.1 (A‒C) The enrichment of DEGs between THSD7B-MUT and THSD7B-WT by GSEA method. (D) The differences in GSVA scores between THSD7B-MUT and THSD7B-WT (t-test, 0.01<P<0.05,“*”; P<0.001, “***”; P≥0.05, “ns”). (E) Heatmap shows the core gene expression (z-score) and logFC of each pathway. Abbreviations: THSD7B-MUT, THSD7B mutant group; THSD7B-WT, THSD7B wild-type group; GSEA, gene set enrichment analysis; GSVA, gene set variation analysis. |
In order to explore these pathways’ potential core genes, we determined the intersection of the differentially expressed genes from the George et al cohort1 and the gene sets of 10 pathways to obtain their core genes. The expression of each pathway’s core genes in THSD7B-MUT and THSD7B-WT, as well as the logFC value are shown in Figure 6E.
THSD7B Mutation and Potential Target Compounds
CMap analysis is helpful in the identification of potential compounds targeting patients with the THSD7B mutation. We introduce the verification set, WES data, and expression matrix from 66 SCLC cell lines in the GDSC1000 database.18 Four significantly enriched compounds, anisomycin, lovastatin, terazosin, and vinburnine, were obtained from the George et al cohort1 using CMap analysis, and ten significantly enriched compounds were obtained from GDSC-SCLC cell lines. The results of the two cohorts were combined, and only lovastatin was selected. The enrichment score of the 13 compounds significantly enriched in the two cohorts is shown in Figure 7A.
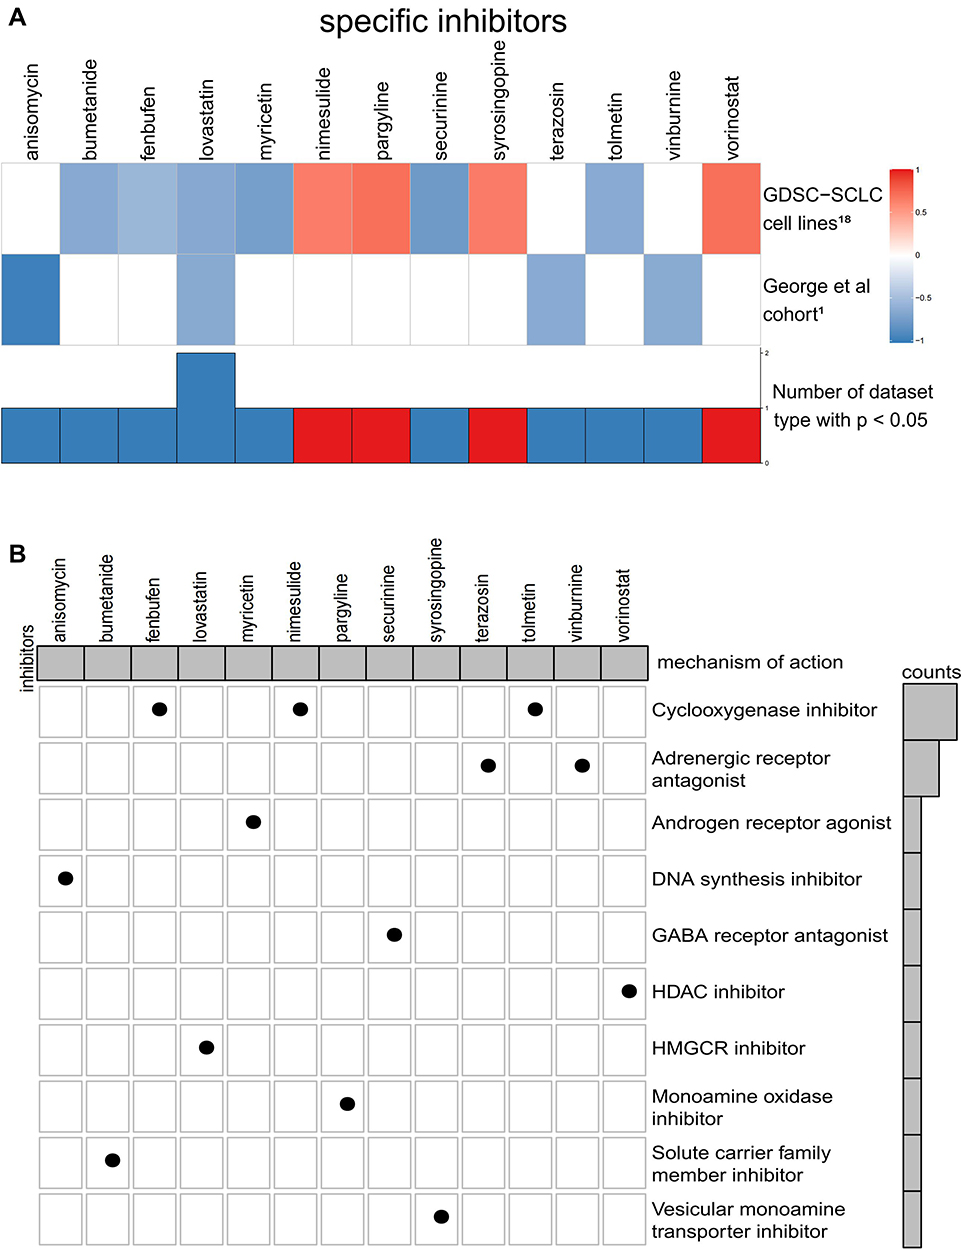 |
Figure 7 (A) Potential target compounds for THSD7B-MUT patients: CMap analysis. Heatmap shows each compound’s enrichment scores (positive in blue, negative in red) obtained from the CMap for each cohort (GDSC-SCLC cell lines18 and George et al cohort1). (B) Heatmap shows each compound (perturbagen) from the CMap that shares a mechanism of action (rows). Abbreviations: CMAP, Connectivity Map; GDSC, Genomics of Drug Sensitivity in Cancer; SCLC, small cell lung cancer. |
We aim to further understand the mechanism of action of these significantly enriched compounds. To achieve this, we acquired MoA files from https://clue.io/ in order to obtain our 13 significantly enriched compounds and their corresponding mechanisms of action, which were then visualized respective of their common mechanisms through oncoPrint. The most common mechanism among the 13 significantly enriched compounds is the cyclooxygenase inhibitor, with 3 compounds (enbufen, nimesulide, tolmetin) exhibiting this mechanism. The second common mechanism, an adrenergic receptor antagonist, has 2 compounds exhibiting this mechanism (terazosin, vinburnine) (Figure 7B). These mechanisms provide reference for further drug development research for SCLC patients with platinum resistance.
Discussion
Platinum drugs are used as first-line chemotherapy for SCLC, but many patients can develop chemotherapy resistance in the early stages of treatment, affecting their survival.1–3 This study explores the single gene mutation and its potential adverse prognosis mechanism in SCLC patients when mediated by platinum-based chemotherapy. We included WES and clinical data of 39 patients, and 101 SCLC patients who received platinum chemotherapy (Zhujiang cohort and George et al cohort1). Univariate Cox proportional hazard regression was used to screen the mutant genes (Figure 2A and B) presenting with a significant relationship to OS of cisplatin-treated patients in the two cohorts, and only the intersection gene THSD7B (Figure 2C) was selected. THSD7B-MUT tumor cells are thought to mediate adverse prognosis through the regulation of adipocytokines and nitric oxide (NO) metabolism, regulating the cell cycle, and suppressing the immune response (Figure 6). In addition, lovastatin and cyclooxygenase inhibitors can be used as potential targeted compounds for patients with THSD7B-MUT (Figure 7). Thus, according to this study, we summarized the potential mechanism of THSD7B-MUT and platinum chemotherapy resistance (Figure 8).
 |
Figure 8 Potential mechanism of THSD7B mutation and platinum resistance. |
The mutation frequency of ZFHX4 and some THSD7B-MUT driver genes increased significantly when compared to THSD7B-MUT, which may increase the risk of platinum resistance in THSD7B mutant patients. The THSD7B mutation has been proven to be a cisplatin resistance factor in esophageal squamous cell carcinoma (ESCC).22 Accordingly, THSD7B-MUT patient prognosis after platinum chemotherapy was significantly lower than that of THSD7B-WT patients (Figure 2E and F). The THSD7B mutation is a potential platinum resistance biomarker in SCLC. As high-frequency mutation genes of SCLC patients, ZFHX4 and EYS both display significantly increased mutation frequency in the THSD7B-MUT group (Figure 3B), and they both present with a significant co-occurrence mutation pattern (Figure 4C). In addition, the mutation frequency of 11 driving genes (AMER1, FGFR2, NCOR1, NCOR2, TCF12, ZNF429 NUP98, MNX1, BCL11A, BRD4, ERCC4, PCM1, and GRM3) increased significantly in THSD7B-MUT (Figure 5A and B). Interestingly, among the above 15 genes, the ZFHX4 and FGFR2 mutations along with MNX1 and BRD4 up-regulation were confirmed to be related to ESCC.23–26 The mutations of NCOR1 and the over-expression of ERCC4 and NCOR2 were the driving factors of head and neck squamous cell carcinoma (HNSC).27–29 This data suggests that these 7 genes may be involved in platinum resistance mediated by the THSD7B mutation. Furthermore, NCOR1 and NCOR2 can be used as nuclear receptor co-inhibitors to affect HDAC3.30 Their co-occurrent mutations can inactivate HDAC3, thereby reducing Rb’s ability to inhibit transcription and promote the cell cycle progress.30,31 Notably, a NCOR1-NCOR2 co-occurrence mutation event (Figure 5C) was observed in the Zhujiang cohort, suggesting that NCOR1-NCOR2 co-occurrence mutation is supplemental to the cisplatin resistance mechanism. For the other 8 genes with significantly increased mutation frequencies in THSD7B-MUT, no research has identified their relation to platinum resistance. We expect further research to focus on these gene mutations and their co-occurrence mutation patterns (Figure 5C and D).
Platinum resistance in THSD7B-MUT patients may be resultant from the blocked autophagy and apoptosis of tumor cells, active growth, invasion, and metastasis of tumor cells, and inhibited adaptive immune function mediated by Th1 cells in the tumor microenvironment. ADIPOR2 can induce autophagy through the STK11/LKB1-AMPK-ULK1 axis.32 The up-regulation of NOS1 is related to anti-apoptosis.33 Consistent with this, the Adipocytokine Signaling Pathway was down-regulated, the NOS1 Pathway was up-regulated, both ADIPOR2 and PRKAA1 were down-regulated although NOS1 was up-regulated (Figure 6A, D and E) in THSD7B-MUT tumor cells, which may hinder the autophagy and apoptosis of tumor cells. The TGFβ/Smad pathway is evidenced to be inhibited in SCLC, which promotes the growth of SCLC cells.34 SERPINE1 is the target gene of TGFβ, and its down-regulation indicates the inhibition of the TGFβ pathway.35 TGIF1 inhibits the activity of the TGFβ/Smad pathway.36 Similarly, in THSD7B-MUT tumor cells, the TGFβ/Smad pathway was inhibited and SMAD3 and SERPINE1 were down-regulated, while TGIF1 was up-regulated (Figure 6C, D and E), all of which can hinder the TGFβ/Smad pathway, thus inhibiting apoptosis. PI3K/Akt is involved in the development of various cancers, and Akt3 and PIK3R3 are related to tumor invasion and metastasis.37,38 A combination of DUSP1 and p53 can inhibit tumor progression and promote cell aging by inhibiting Akt.39,40 The overexpression of NRG1 activates the PI3K/Akt network, increases the phosphorylation of Akt and eNOS, and prevents cell apoptosis.41 ADIPOR2 decreased Akt phosphorylation, cyclinD1 and Bcl-2 protein production while inhibiting the cell cycle.42 Likewise, Akt3 and PIK3R3 were up-regulated in THSD7B-MUT tumor cells, NRG1 in the PI3K/Akt network was up-regulated, the downstream gene DUSP1 of the p53 pathway was down-regulated, and ADIPOR2 in the Adipocytokine Signaling Pathway was down-regulated (Figure 6E). This phenomenon can result in the weakening of the inhibitory factors of Akt phosphorylation in THSD7B-MUT tumor cells and the inhibition of p53 activity, thereby promoting cell growth, invasion, and metastasis. The data also suggested that the activation of the PI3K/Akt pathway can interact with both the p53 downstream and NOS1 pathways. In the TCR Calcium Pathway, FOS and JUNB were down-regulated (Figure 6E), which may be a factor inhibiting T-cell activity.43 We also found that IL2 secretion was inhibited (Figure 6A and D), while the IL2/IL2RA pathway activation could significantly reduce the risk of lung cancer.44 This trend suggests that the down-regulation of the TCR Calcium Pathway and IL2 Mediated Pathway may result in the decline of immune response in the THSD7B-MUT tumor.
According to the CMap website’s drug prediction, lovastatin and cyclooxygenase inhibitors were regarded as the potential core target compounds for patients presenting with THSD7B-MUT. Statin inhibits HMG-COA reductase and cholesterol synthesis, thus inhibiting cell membrane synthesis, cell growth, and reproduction.45 The molecule AMPK downstream of the Adipocytokine Signaling Pathway can inhibit HMG-CoA reductase.46 In THSD7B-MUT cells, the Adipocytokine Signaling Pathway and AMPK were down-regulated, and the inhibitory effect on HMG-CoA reductase weakened. However, the inhibition of HMG-CoA reductase by statin can weaken this process, thus controlling cholesterol synthesis and cell growth. Non-steroidal anti-inflammatory drugs (NSAIDs) and selective PTGS2 inhibitors (coxibs) are among the most promising drugs for cancer chemoprevention and treatment.47–50 COX reductase is involved in the metabolism of arachidonic acid into PGE2, which inhibits the secretion of IL2 by Th1,51 while the cyclooxygenase inhibitors can reverse this process and improve Th1 activity.
Although we proposed several potential pathways and targeted compounds to mediate THSD7B-MUT platinum resistance, our research still has limitations. First, our two cohorts (Zhujiang cohort and George et al cohort1) should be supplemented by cohorts with a larger sample size to prove that the THSD7B mutation can be used as a platinum resistance biomarker. Secondly, the two cohort samples came from different populations: the Zhujiang cohort samples came from the Asian population, while George et al cohort1 samples were obtained from Caucasian populations. This diversity led to a considerable difference in the driver genes, with significant changes to the mutation frequency of the THSD7B-MUT group in both cohorts, and should be addressed in future research. In addition, we aimed to evidence that the poor survival of SCLC patients is directly associated with the incidence of THSD7B mutation. However, due to the lack of data sets on SCLC, we were unable to include a validation set of treatment-naïve SCLC patients who received platinum chemotherapy as a treatment strategy. In addition, while the signaling pathways screened by GSVA were only established in the George et al cohort,1 no verification set was introduced as proof. While our research results are based on bioinformatic analyses, potential signaling pathways and potential targeted compounds still require further experimental verification.
Conclusion
We screened the gene mutations related to the poor OS of platinum-treated patients in two cohorts and found that the THSD7B mutation occurred in both cohorts. Further exploration of the gene mutation was conducted based on significantly changed mutation frequency and the co-occurrence and mutual exclusivity in THSD7B-MUT tumor cells. Based on the GSVA and GSEA algorithms, THSD7B-MUT tumor cell-enriched signaling pathways were identified. These pathways can inhibit tumor cell autophagy and apoptosis, promote tumor cell growth, invasion, and metastasis, and inhibit Th1 cell-mediated adaptive immune function in the tumor microenvironment. Lastly, we identified lovastatin and cyclooxygenase inhibitors as potential targets for patients with the THSD7B mutation.
Abbreviations
SCLC, small cell lung cancer; ES-SCLC, extended-stage SCLC; WES, whole exome sequencing; GSVA, gene set variation analysis; GSEA, gene set enrichment analysis; CMAP, Connectivity Map; MoA, mode-of-action; OS, overall survival; THSD7B-MUT, THSD7B mutant group; THSD7B-WT, THSD7B wild-type group.
Ethics Approval and Consent to Participate
The patients/participants provided their written informed consent to participate in this study and the research presented here has been performed in accordance with the Declaration of Helsinki and has been approved by the ethics committee of the Zhujiang Hospital of Southern Medical University.
Acknowledgments
Special thanks to the English language polishing contributions from TopScience Editing.
Author Contributions
All authors made a significant contribution to the work reported, whether that is in the conception, study design, execution, acquisition of data, analysis and interpretation, or in all these areas; took part in drafting, revising or critically reviewing the article; gave final approval of the version to be published; have agreed on the journal to which the article has been submitted; and agree to be accountable for all aspects of the work.
Funding
This work was supported by the Natural Science Foundation of Guangdong Province (Grant No. 2018A030313846 and 2021A1515012593), the Science and Technology Planning Project of Guangdong Province (Grant No. 2019A030317020), Guangdong Undergraduate Training Program on Innovation and Entrepreneurship (Grant No. S202212121072) and the National Natural Science Foundation of China (Grant No. 81802257, 81871859, 81772457, 82172750 and 82172811).
Disclosure
The authors declare that the research was conducted in the absence of any commercial or financial relationships that could be construed as a potential conflict of interest.
References
1. George J, Lim JS, Jang SJ, et al. Comprehensive genomic profiles of small cell lung cancer. Nature. 2015;524(7563):47–53. doi:10.1038/nature14664
2. Paz-Ares L, Dvorkin M, Chen Y, et al. Durvalumab plus platinum-etoposide versus platinum-etoposide in first-line treatment of extensive-stage small-cell lung cancer (CASPIAN): a randomised, controlled, open-label, Phase 3 trial. Lancet. 2019;394(10212):1929–1939. doi:10.1016/S0140-6736(19)32222-6
3. Saltos A, Shafique M, Chiappori A. Update on the biology, management, and treatment of Small Cell Lung Cancer (SCLC). Front Oncol. 2020;10:1074. doi:10.3389/fonc.2020.01074
4. Davies AM, Lara PN, Lau DH, Gandara DR. Treatment of extensive small cell lung cancer. Hematol Oncol Clin North Am. 2004;18(2):373–385. doi:10.1016/j.hoc.2003.12.012
5. Früh M, De Ruysscher D, Popat S, Crinò L, Peters S, Felip E. Small-cell lung cancer (SCLC): ESMO clinical practice guidelines for diagnosis, treatment and follow-up. Ann Oncol. 2013;24(Suppl 6):i99–i105. doi:10.1093/annonc/mdt178
6. Li R, Liu J, Fang Z, Liang Z, Chen X. Identification of mutations related to cisplatin-resistance and prognosis of patients with lung adenocarcinoma. Front Pharmacol. 2020;11:572627. doi:10.3389/fphar.2020.572627
7. Zhang GN, Liu H, Huang JM, et al. TP53 K351N mutation-associated platinum resistance after neoadjuvant chemotherapy in patients with advanced ovarian cancer. Gynecol Oncol. 2014;132(3):752–757. doi:10.1016/j.ygyno.2014.01.028
8. Turk AA, Wisinski KB. PARP inhibitors in breast cancer: bringing synthetic lethality to the bedside. Cancer-Am Cancer Soc. 2018;124(12):2498–2506.
9. Hirai H, Arai T, Okada M, et al. MK-1775, a small molecule Wee1 inhibitor, enhances anti-tumor efficacy of various DNA-damaging agents, including 5-fluorouracil. Cancer Biol Ther. 2010;9(7):514–522. doi:10.4161/cbt.9.7.11115
10. Hirai H, Iwasawa Y, Okada M, et al. Small-molecule inhibition of Wee1 kinase by MK-1775 selectively sensitizes p53-deficient tumor cells to DNA-damaging agents. Mol Cancer Ther. 2009;8(11):2992–3000. doi:10.1158/1535-7163.MCT-09-0463
11. Van Linden AA, Baturin D, Ford JB, et al. Inhibition of Wee1 sensitizes cancer cells to antimetabolite chemotherapeutics in vitro and in vivo, independent of p53 functionality. Mol Cancer Ther. 2013;12(12):2675–2684. doi:10.1158/1535-7163.MCT-13-0424
12. Repana D, Nulsen J, Dressler L, et al. The Network of Cancer Genes (NCG): a comprehensive catalogue of known and candidate cancer genes from cancer sequencing screens. Genome Biol. 2019;20(1):1. doi:10.1186/s13059-018-1612-0
13. Mayakonda A, Lin DC, Assenov Y, Plass C, Koeffler HP. Maftools: efficient and comprehensive analysis of somatic variants in cancer. Genome Res. 2018;28(11):1747–1756. doi:10.1101/gr.239244.118
14. Ritchie ME, Phipson B, Wu D, et al. limma powers differential expression analyses for RNA-sequencing and microarray studies. Nucleic Acids Res. 2015;43(7):e47. doi:10.1093/nar/gkv007
15. Wilkinson L. ggplot2: elegant graphics for data analysis by WICKHAM, H. Biometrics. 2011;67:2. doi:10.1111/j.1541-0420.2011.01616.x
16. Subramanian A, Tamayo P, Mootha VK, et al. Gene set enrichment analysis: a knowledge-based approach for interpreting genome-wide expression profiles. Proc Natl Acad Sci USA. 2005;102(43):15545–15550. doi:10.1073/pnas.0506580102
17. Yu G, Wang LG, Han Y, He QY. clusterProfiler: an R package for comparing biological themes among gene clusters. Omics. 2012;16(5):284–287. doi:10.1089/omi.2011.0118
18. Iorio F, Knijnenburg TA, Vis DJ, et al. A landscape of pharmacogenomic interactions in cancer. Cell. 2016;166(3):740–754. doi:10.1016/j.cell.2016.06.017
19. Therneau T, Therneau T, Grambsch P. Modeling Survival Data: Extending the Cox Model (Statistics for Biology and Health). Springer; 2000.
20. Kassambara A. Drawing survival curves using ‘ggplot2’ [R package survminer version 0.4.8]; 2020.
21. Gu Z, Eils R, Schlesner M. Complex heatmaps reveal patterns and correlations in multidimensional genomic data. Bioinformatics. 2016;32(18):2847–2849. doi:10.1093/bioinformatics/btw313
22. Hayashi M, Kawakubo H, Fukuda K, et al. THUMP domain containing 2 protein possibly induces resistance to cisplatin and 5-fluorouracil in in vitro human esophageal squamous cell carcinoma cells as revealed by transposon activation mutagenesis. J Gene Med. 2019;21(12):e3135. doi:10.1002/jgm.3135
23. Qing T, Zhu S, Suo C, Zhang L, Zheng Y, Shi L. Somatic mutations in ZFHX4 gene are associated with poor overall survival of Chinese esophageal squamous cell carcinoma patients. Sci Rep. 2017;7(1):4951. doi:10.1038/s41598-017-04221-7
24. Kato H, Arao T, Matsumoto K, et al. Gene amplification of EGFR, HER2, FGFR2 and MET in esophageal squamous cell carcinoma. Int J Oncol. 2013;42(4):1151–1158. doi:10.3892/ijo.2013.1830
25. Chu J, Li H, Xing Y, et al. LncRNA MNX1-AS1 promotes progression of esophageal squamous cell carcinoma by regulating miR-34a/SIRT1 axis. Biomed Pharmacother. 2019;116:109029. doi:10.1016/j.biopha.2019.109029
26. Liu D, Liu Y, Qi B, Gu C, Huo S, Trichostatin ZB. A promotes esophageal squamous cell carcinoma cell migration and EMT through BRD4/ERK1/2-dependent pathway. Cancer Med. 2021;10(15):5235–5245. doi:10.1002/cam4.4059
27. Veeramachaneni R, Walker T, Revil T, et al. Analysis of head and neck carcinoma progression reveals novel and relevant stage-specific changes associated with immortalisation and malignancy. Sci Rep. 2019;9(1):11992. doi:10.1038/s41598-019-48229-7
28. Vaezi A, Wang X, Buch S, et al. XPF expression correlates with clinical outcome in squamous cell carcinoma of the head and neck. Clin Cancer Res. 2011;17(16):5513–5522. doi:10.1158/1078-0432.CCR-11-0086
29. Rigalli JP, Reichel M, Reuter T, et al. The pregnane X receptor (PXR) and the nuclear receptor corepressor 2 (NCoR2) modulate cell growth in head and neck squamous cell carcinoma. PLoS One. 2018;13(2):e193242. doi:10.1371/journal.pone.0193242
30. You SH, Lim HW, Sun Z, Broache M, Won KJ, Lazar MA. Nuclear receptor co-repressors are required for the histone-deacetylase activity of HDAC3 in vivo. Nat Struct Mol Biol. 2013;20(2):182–187. doi:10.1038/nsmb.2476
31. Brehm A, Miska EA, McCance DJ, Reid JL, Bannister AJ, Kouzarides T. Retinoblastoma protein recruits histone deacetylase to repress transcription. Nature. 1998;391(6667):597–601. doi:10.1038/35404
32. Chung SJ, Nagaraju GP, Nagalingam A, et al. ADIPOQ/adiponectin induces cytotoxic autophagy in breast cancer cells through STK11/LKB1-mediated activation of the AMPK-ULK1 axis. Autophagy. 2017;13(8):1386–1403. doi:10.1080/15548627.2017.1332565
33. Zou Z, Li X, Sun Y, et al. NOS1 expression promotes proliferation and invasion and enhances chemoresistance in ovarian cancer. Oncol Lett. 2020;19(4):2989–2995. doi:10.3892/ol.2020.11355
34. Miyazono K, Katsuno Y, Koinuma D, Ehata S, Morikawa M. Intracellular and extracellular TGF-β signaling in cancer: some recent topics. Front Med. 2018;12(4):387–411. doi:10.1007/s11684-018-0646-8
35. Pepper MS, Belin D, Montesano R, Orci L, Vassalli JD. Transforming growth factor-beta 1 modulates basic fibroblast growth factor-induced proteolytic and angiogenic properties of endothelial cells in vitro. J Cell Biol. 1990;111(2):743–755. doi:10.1083/jcb.111.2.743
36. Razzaque MS, Atfi A. TGIF1-Twist1 axis in pancreatic ductal adenocarcinoma. Comput Struct Biotechnol J. 2020;18:2568–2572. doi:10.1016/j.csbj.2020.09.023
37. Hinz N, Jücker M. Distinct functions of AKT isoforms in breast cancer: a comprehensive review. Cell Commun Signal. 2019;17(1):154. doi:10.1186/s12964-019-0450-3
38. Wang G, Yang X, Li C, Cao X, Luo X, Hu J. PIK3R3 induces epithelial-to-mesenchymal transition and promotes metastasis in colorectal cancer. Mol Cancer Ther. 2014;13(7):1837–1847. doi:10.1158/1535-7163.MCT-14-0049
39. Hao PP, Li H, Lee MJ, et al. Disruption of a regulatory loop between DUSP1 and p53 contributes to hepatocellular carcinoma development and progression. J Hepatol. 2015;62(6):1278–1286. doi:10.1016/j.jhep.2014.12.033
40. Cheng CM, Liu F, Li JY, Song QY. DUSP1 promotes senescence of retinoblastoma cell line SO-Rb5 cells by activating AKT signaling pathway. Eur Rev Med Pharmacol Sci. 2018;22(22):7628–7632. doi:10.26355/eurrev_201811_16377
41. Xiao J, Li B, Zheng Z, et al. Therapeutic effects of neuregulin-1 gene transduction in rats with myocardial infarction. Coron Artery Dis. 2012;23(7):460–468. doi:10.1097/MCA.0b013e32835877da
42. Zhang L, Wen K, Han X, Liu R, Qu Q. Adiponectin mediates antiproliferative and apoptotic responses in endometrial carcinoma by the AdipoRs/AMPK pathway. Gynecol Oncol. 2015;137(2):311–320. doi:10.1016/j.ygyno.2015.02.012
43. Li-Weber M, Treiber MK, Giaisi M, et al. Ultraviolet irradiation suppresses T cell activation via blocking TCR-mediated ERK and NF-kappa B signaling pathways. J Immunol. 2005;175(4):2132–2143. doi:10.4049/jimmunol.175.4.2132
44. Jia Z, Zhang Z, Yang Q, Deng C, Li D, Ren L. Effect of IL2RA and IL2RB gene polymorphisms on lung cancer risk. Int Immunopharmacol. 2019;74:105716. doi:10.1016/j.intimp.2019.105716
45. Huang B, Song BL, Xu C. Cholesterol metabolism in cancer: mechanisms and therapeutic opportunities. Nat Metab. 2020;2(2):132–141. doi:10.1038/s42255-020-0174-0
46. Herzig S, Shaw RJ. AMPK: guardian of metabolism and mitochondrial homeostasis. Nat Rev Mol Cell Biol. 2018;19(2):121–135. doi:10.1038/nrm.2017.95
47. Huang WK, Tu HT, See LC. Aspirin use on incidence and mortality of gastrointestinal cancers: current state of epidemiological evidence. Curr Pharm Des. 2015;21(35):5108–5115. doi:10.2174/1381612821666150915110450
48. Rothwell PM, Price JF, Fowkes FG, et al. Short-term effects of daily aspirin on cancer incidence, mortality, and non-vascular death: analysis of the time course of risks and benefits in 51 randomised controlled trials. Lancet. 2012;379(9826):1602–1612. doi:10.1016/S0140-6736(11)61720-0
49. Rothwell PM, Fowkes FG, Belch JF, Ogawa H, Warlow CP, Meade TW. Effect of daily aspirin on long-term risk of death due to cancer: analysis of individual patient data from randomised trials. Lancet. 2011;377(9759):31–41. doi:10.1016/S0140-6736(10)62110-1
50. Cui HY, Wang SJ, Song F, et al. CD147 receptor is essential for TFF3-mediated signaling regulating colorectal cancer progression. Signal Transduct Target Ther. 2021;6(1):268. doi:10.1038/s41392-021-00677-2
51. Wang D, Dubois RN. Eicosanoids and cancer. Nat Rev Cancer. 2010;10(3):181–193. doi:10.1038/nrc2809
 © 2022 The Author(s). This work is published and licensed by Dove Medical Press Limited. The
full terms of this license are available at https://www.dovepress.com/terms
and incorporate the Creative Commons Attribution
- Non Commercial (unported, 3.0) License.
By accessing the work you hereby accept the Terms. Non-commercial uses of the work are permitted
without any further permission from Dove Medical Press Limited, provided the work is properly
attributed. For permission for commercial use of this work, please see paragraphs 4.2 and 5 of our Terms.
© 2022 The Author(s). This work is published and licensed by Dove Medical Press Limited. The
full terms of this license are available at https://www.dovepress.com/terms
and incorporate the Creative Commons Attribution
- Non Commercial (unported, 3.0) License.
By accessing the work you hereby accept the Terms. Non-commercial uses of the work are permitted
without any further permission from Dove Medical Press Limited, provided the work is properly
attributed. For permission for commercial use of this work, please see paragraphs 4.2 and 5 of our Terms.