Back to Journals » Journal of Inflammation Research » Volume 16
Theaflavin-3,3’-Digallate Ameliorates Collagen-Induced Arthritis Through Regulation of Autophagy and Macrophage Polarization
Authors Zhang L, Li W, Hou Z, Wang Z, Zhang W ![]() , Liang X
, Liang X ![]() , Wu Z, Wang T, Liu X, Peng X, Yang X, Yang H
, Wu Z, Wang T, Liu X, Peng X, Yang X, Yang H ![]() , Geng D
, Geng D
Received 24 May 2022
Accepted for publication 16 August 2022
Published 10 January 2023 Volume 2023:16 Pages 109—126
DOI https://doi.org/10.2147/JIR.S374802
Checked for plagiarism Yes
Review by Single anonymous peer review
Peer reviewer comments 2
Editor who approved publication: Professor Ning Quan
Lei Zhang,1,* Wenming Li,1,* Zhenyang Hou,2,* Zhidong Wang,1,* Wei Zhang,1 Xiaolong Liang,1 Zerui Wu,1 Tianhao Wang,1 Xin Liu,1 Xiaole Peng,1 Xing Yang,3 Huilin Yang,1 Dechun Geng1
1Department of Orthopaedics, The First Affiliated Hospital of Soochow University, Suzhou, People’s Republic of China; 2Department of Orthopaedics, Tengzhou City Center People’s Hospital, Tengzhou, People’s Republic of China; 3Orthopedics and Sports Medicine Center, Suzhou Municipal Hospital (North District), Nanjing Medical University Affiliated Suzhou Hospital, Suzhou, People’s Republic of China
*These authors contributed equally to this work
Correspondence: Huilin Yang; Dechun Geng, Department of Orthopaedics, The First Affiliated Hospital of Soochow University, Suzhou, People’s Republic of China, Email [email protected]; [email protected]
Purpose: Previous studies have presented that theaflavin-3,3’-digallate (TFDG), one of natural flavonoids, have protective effects on collagen-induced arthritis (CIA). Besides, it was reported that TFDG could affect inflammatory signaling pathways, like NF-κB, JNK, and so on, to ameliorate inflammation. However, the anti-inflammatory mechanisms mentioned above are common to natural flavonoid products including TFDG. Therefore, this study aimed to further investigate the other mechanisms of TFDG against CIA.
Methods: DBA/1 mice (8– 10 weeks) were intravenously injected Freund’s Adjuvant (100μL) at the base of tail and intraperitoneally injected PBS or different dosage of TFDG (1 mg/kg or 10 mg/kg). Then the paw and knee tissues were collected to assess the severity of joint destruction. In vitro experiments, bone marrow macrophages (BMMs) were exposed to TNF-α (10ng/mL) with or without different concentrations of TFDG (0.1μmol/L or 1.0μmol/L). Besides, the targets of TFDG were predicted with docking software and were verified through experiment.
Results: TFDG treatment could reduce M1 macrophage (pro-inflammatory) and inflammatory cytokines, such as IL-1, IL− 6 and TNF-α, both in vitro and in vivo. At the same time, the M2 macrophage (alternatively activated) polarization was promoted by TFDG. Animal experiments showed TFDG ameliorated joint destructions. For investigating the mechanisms, the targets of TFDG were predicted by bioinformatics tools. According to predictions, we hypothesized that TFDG could act with BCL-2 to weaken the interaction between BCL-2 and Beclin1. Beclin1 plays a central role in autophagy, and we found that the autophagy level of BMMs was recovered by TFDG. Besides, 3-MA, an autophagy inhibitor, could attenuate the therapeutic effect of TFDG.
Conclusion: TFDG protected against collagen-induced arthritis by attenuating the inflammation and promoting anti-inflammatory M2 macrophage polarization through controlling autophagy.
Keywords: theaflavin-3,3’-digallate, autophagy, inflammation, macrophage polarization, rheumatoid arthritis
Graphical Abstract:

Introduction
Rheumatoid Arthritis (RA) is a progressive autoimmune disease that is characterized by chronic inflammation of the synovium, which finally leads to synovial membrane, joint cartilage and subchondral bone damage.1 Inflammatory cells infiltration and cytokines release plays an important role during the initiation and development of RA.1,2 In addition, the current therapeutic approaches are to inhibit leukocytes activities, reduce cytokines release and ameliorate inflammatory conditions. Unfortunately, the majority of these drugs, such as disease-modifying anti-rheumatic drugs (DMARDs), nonsteroidal anti-inflammatory drugs (NSAIDs) and glucocorticoids (GCs), have unavoidable side effects that limit their wide usage.3,4
Recent researches have shown that different subtypes of macrophages have diverse effects on synovitis.5 Although it is controversial and complex, according to functional division, macrophages can be simplified into two types: the classically activated M1 (proinflammatory) phenotype and the alternatively activated M2 (anti-inflammatory) phenotype.6–8 M1 macrophages, characterized by the expression of inducible nitric oxide synthase (iNOS) and CD86, can produce tumor necrosis factor (TNF-α), interleukin 1β (IL-1β), and interleukin 6 (IL-6), whereas M2 macrophages, characterized by the expression of CD206 and arginase 1 (Arg-1), synthesize IL-10, IL-4, transforming growth factor β (TGF-β) and vascular endothelial growth factor (VEGF).9–12 M1 macrophages are one of the crucial effectors of synovitis; it works through secretion of inflammatory cytokines, production of proteases, release of reactive oxygen species (ROS), phagocytosis of pathogens and antigen presentation.13–15 In contrast, M2 macrophages can generate anti-inflammatory cytokines such as IL-10 and IL-4, inhibit the activity of proteases in tissue degradation and promote tissue repair by immunoregulation.16 Due to its immunoregulatory properties, M2 macrophages have been gradually investigated to treat inflammatory diseases and immune disorders.17,18
Numerous studies have demonstrated that inhibition of M1 macrophages and activation of M2 macrophages are novel approaches to control inflammation.17–19 For example, transforming macrophages from M1 to M2 phenotypes facilitated the tissue repair in inflammatory disorders,17 and the imbalance between M1 and M2 contributes to chronic inflammation in RA.20 In collagen-induced arthritis (CIA), IL-35, an anti-inflammatory cytokine, could activate M2 macrophages to alleviate the inflammation.21 In addition, biological materials with inhibitory effects on M1 macrophage showed therapeutic effects on synovitis when applied to CIA mice.22 These researches indicate that induction of M2 macrophages may be a potential therapeutic strategy for the treatment of RA.
As a widely consumed drink, black tea contains various bioactive polyphenols. Theaflavin-3,3’-digallate (TFDG), one of the polyphenols from black tea, was reported to act against oxidants and some types of cancer.23,24 In addition, TFDG could inhibit inflammation in acute lung injury.25 In our previous study, TFDG ameliorated peri-implant osteolysis via inhibition of inflammatory environment around implants.26 Recently, Liu and Li demonstrated that TFDG could attenuate the arthritis symptoms of CIA mice in vivo.27 However, limited literature has clarified the detailed mechanism of TFDG against inflammatory infiltration in CIA mice.
Numerous studies have confirmed that flavonoids, a group of natural products with multiple phenolic structures including TFDG, are well known for their anti-inflammatory effects.28,29 In addition, previous studies have found that TFDG had protective effects on CIA mice and TFDG could affect inflammatory signaling pathways, like NF-κB, JNK, and so on, to ameliorate inflammation.27 However, NF-κB and MAPK (including P38, JNK2, and ERK) signaling pathways can be affected not only by TFDG but also by majority of flavonoids, including mangiferin, ginkgetin, puerarin and so on.30–32 Therefore, this study was conducted to further investigate the precise mechanism of TFDG against CIA for the clinical transformation.
In the current study, we applied bioinformatics analysis and protein–ligand docking software to predict and find that TFDG might act with Bcl-2 to release Beclin-1, which plays a central role in autophagy and is identified as a Bcl-2-interacting protein. Autophagy is a self-regulating process for adapting to changing environments.33,34 Liu et al found that USP19 increased autophagic flux and facilitated M2 macrophage polarization.35 In silica-induced inflammation, promoting autophagy of alveolar macrophages could reduce inflammatory cytokines production and promote tissue repair.36 In contrast, impairing autophagy promoted M1 macrophage polarization in obese mice.37 Therefore, we hypothesized that the autophagy levels of macrophage might be influenced in the process of CIA and TFDG could rescue this changes. Fortunately, we have verified and demonstrated that TFDG could attenuate the inflammation of CIA mice by targeting Bcl-2 to influence autophagy.
In conclusion, this study presents the anti-inflammatory mechanism of TFDG and demonstrates that TFDG might be a validated treatment approach for RA patients
Materials and Methods
Drugs and Reagents
TFDG was purchased from Yuanye Bio-Technology Co., Ltd (Shanghai, China, #B20141-20mg). Recombinant mouse TNF-α was obtained from Sigma–Aldrich (Shanghai, China, # T7539). Complete and incomplete Freund’s adjuvant, as well as type II collagen of bovine, were purchased from Chondrex Inc. (USA, #7027, #7002, #20021). Minimum essential medium alpha (αMEM) and fetal bovine serum (FBS) were purchased from Gibco Life Technologies (USA, # 12571089, #10099141). Primary antibodies against F4/80 (#ab6640, 1:1000), TNF-α (#ab92324, 1:1000) and IL-1β (#ab205924, 1:1000) were obtained from Abcam (UK), and antibodies against iNOS (#13120, 1:1000), Arginase-1 (#93668, 1:1000) and CD206 (#24595, 1:1000) were obtained from Cell Signaling Technology (Boston, USA). In addition, primary antibodies LC3B (#A19665, 1:1000), Beclin-1 (#A17028, 1:1000) and β-Actin (#AC026, 1:1000) were bought from ABclonal, Inc. (Wuhan, China). Goat polyclonal secondary antibody to rat IgG (H&L, Alexa Fluor® 488) (#ab150157, 1:1000) and goat polyclonal secondary antibody to rabbit IgG (H&L, Alexa Fluor® 647) (#ab150079, 1:1000) were purchased from Abcam (UK). CCK-8 assay kit was obtained from Dojindo (Kumamoto, Japan). TNF-α ELISA Kit (#EK282HS), IL-1β ELISA Kit (#EK201B), IL-6 ELISA Kit (#EK206), IL-10 ELISA Kit (#EK210) were purchased from MULTISCIENCES (Hangzhou, China). ACP-conjugated anti-mouse CD11b (#101212, 1:500), FITC-conjugated anti-mouse F4/80 (#157310, 1:1000), PE-conjugated anti-mouse CD206 (#141706, 1:1000) or PE-conjugated anti-mouse CD86 (#159204, 1:1000) were purchased from BioLegend (USA).
Cell Preparation
BMMs were used in vitro assays, and which were extracted from bone marrow. Above all, 4 to 6-week-old DBA/1 mice were prepared to extract bone marrow. Then, the extracts were incubated in αMEM containing 10ng/mL M-CSF and 10% FBS for 16h, and half of the medium was exchanged. Finally, the cells were continually incubated for another 3days in αMEM containing 10ng/mL M-CSF, and the remaining adherent cells were bone marrow macrophages. Cells were incubated under 5% CO2 at 37°C in a humidified incubator, and the complete medium was renewed after culture for 48h.
Cytotoxicity Assay
To determine the toxic effect of TFDG on macrophages, cell activity was verified using a commercial kit-cell counting kit-8 (CCK-8). BMMs were cultured in 96-well plates with 4×10^3 cells per well and left overnight to adhere. The macrophages were then treated with different concentrations of TFDG (0, 0.1, 1, 10, 20, 30, 50, and 100μM) for 24h. Finally, the supernatant fluid was replaced with medium containing 10%CCK-8. After incubation for 2 hours, cell viability was measured with a microplate reader (BioTek, Vermont, USA), which could measure the spectrophotometric absorbance of the medium at 450 nm to determine the OD value.
Cell Immunofluorescence Staining
BMMs were seeded in 24-well plates with 4×10⁴ cells per well. The BMMs were cultured with induction medium containing or without TNF-α (10ng/mL), and different concentrations of TFDG were added to the different groups. In general, macrophages were divided into 4groups, Control, TNF-α, Low-TFDG and High-TFDG, and seeded in 24-well plates until adherence. After adherence, the Low-TFDG group and High-TFDG group were separately pretreated with 0.1μmol/L and 1.0μmol/L TFDG for 2h, and the PBS and TNF-α groups were only pretreated with PBS. TNF-α was then added to a concentration of 10ng/mL in all groups for 24h except for the PBS group. At the end of the intervention, the macrophages were washed 3 times with phosphate-buffered saline (PBS), and then chilled 4% paraformaldehyde were used for immobilizing BMMs 15min and rinsed with PBS 2 times again. Later, immunofluorescence blocking solution was applied to block macrophages for 1h. The cells were cultured with primary antibodies, including anti-F4/80 (1:500 dilution), anti-arginase1 (ARG1) (1:1000 dilution) and anti-iNOS (1:100 dilution), for 12h at 4°C. Then, the cells were rinsed with PBS, and cells were simultaneously incubated with goat polyclonal secondary antibody to rabbit IgG (H&L) (Alexa Fluor®647) and goat polyclonal secondary antibody to rat IgG (H&L) (Alexa Fluor®488) for 60min at 37°C. Nuclei were stained with DAPI (40,6-diamidino-2-phenylindole). Finally, the cells were photographed with a Zeiss laser scanning microscope (LSM510).
Animal Assays
The Guidelines for Care and Use of Laboratory Animals and the Ethics Committee of the First Affiliated Hospital of Soochow University were adhered to all animal experiments (ethical approval number 20170005063754). The 32 DBA/1 mice (8–9 weeks old, male, weight: 21±1.5g) were obtained from Laboratory Animal Center of Soochow University. All animals were allowed free access to a standard diet and water, and housed in a specific pathogen-free animal laboratory. Randomly divided 32 male DBA/1 mice (8–9 weeks) into Sham (n = 8), Vehicle (n = 8), Low-TFDG (1 mg/kg/day, n = 8) and High-TFDG (10 mg/kg/day, n = 8) groups. Blended CII (bovine type II collagen, 2 mg/mL in 0.05 M acetic acid; Sigma) with Freund’s complete adjuvant (2 mg/mL Mycobacterium tuberculosis; Sigma) at a 1:1 volume. The whole process of collagen-induced arthritis was represented as schematic diagram in Figure 1A. On day 0, 100μL of the mixed emulsion (containing 100μg CII) was administered to the vehicle, low-TFDG and high-TFDG groups at the base of the tail via intradermal injection. At day 20, 1mg/kg TFDG, 10mg/kg TFDG and equivalent saline were administered to the Low-TFDG, High-TFDG and both sham and vehicle groups via intraperitoneal injection 6 days a week for 8 weeks. On day 21, the mice, except for sham group, were given 100μg of bovine type II collagen mixed with incomplete Freund’s adjuvant in an equal volume, and the sham group was injected with Freund’s adjuvant with no collagen through the base of the tail. Paw swelling and the arthritis score were noted every week from treatment until the 8 weeks interference was finished. The thickness of the hind paws was applied to assess paw swelling. We applied the methods established by Brand et al to evaluate clinical arthritis of each leg.38 Furthermore, at the end of the observations, blood samples were taken from posterior orbital venous plexus, and 100 mg/kg chloral hydrate was applied for sacrifice via intraperitoneal injection. Then, the knee joints were removed for histological analysis, and the hind paws were harvested for micro-CT scanning.
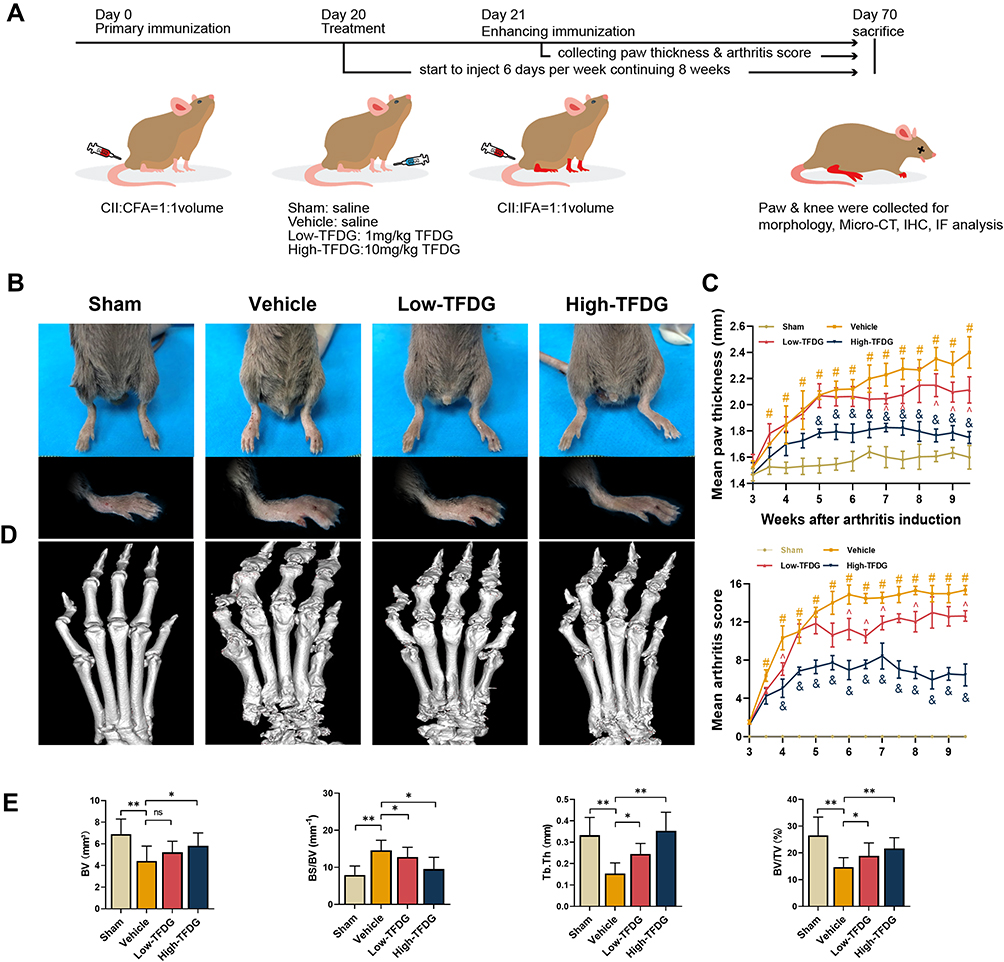 |
Figure 1 TFDG attenuated the arthritis of CIA mice. (A) Construction and treatment of collagen-induced arthritis in DBA/1 mice. (Low-TFDG: 1mg/kg/day, High-TFDG: 10mg/kg/day.) (B) The paw pictures of DBA/1 normal and CIA mice. (C) Mean paw thickness and mean arthritis score were recorded from the third week. (#p<0.05: compared with the Sham group; &p<0.05 and ^p<0.05: compared with the vehicle group). (D) 3D reconstruction of paw after Micro-CT scan. (E) Bone volume (BV, mm3), bone surface area to bone volume (BS/BV, mm−1), trabecular thickness (Tb. Th, mm), bone volume/tissue volume (BV/TV, %). (The number of mice in each group was 8. *p<0.05 and **p<0.01: compared with the vehicle group). Abbreviation: ns, no statistically significant. |
Immunohistochemistry Staining
The sections of the knee joint were routinely dewaxed, rehydrated and rinsed with PBS 4 times for 3 minutes each time. Then, for antigen retrieval, protease and hyaluronidase were given to the sections for 30 min in the dark at 37 °C. Next, the sections were scoured with PBS 4 times and incubated with serum to block nonspecific antigen for 40 minutes. Then, IL-1β and TNF-α antibodies were added dropwise to the sections overnight at 4 °C. IL-1β and TNF-α antibodies were both diluted at a ratio of 1:500 and obtained from Abcam (UK). After 12 h of incubation, the sections were incubated with secondary antibody for 1.5 hours at room temperature and rinsed with PBS 3 times. Sections were stained with a DAB horseradish peroxidase color kit (Beyotime, China). Specifically, after adding DAB, the sections were rapidly shifted to deionized water for 2 min. Finally, we applied hematoxylin staining to stain the nuclei for 2 min, and the sections were routinely washed, dehydrated and then mounted with neutral resin.
Micro-CT Analysis
SkyScan 1176 scanner (SkyScan, Aartselaar, Belgium) was applied to analyse the morphology of bones. Above all, scanner was performed at 170 mA and 60 kV with a resolution of 9 μm for original data acquisition. Then, we reconstructed the data of paw from micro-CT into three-dimensional (3D) images by the manufacturer’s software. Entire paw areas were chosen for 3D reconstruction and bone volume (BV, mm3), bone volume to bone volume fraction (BV/TV, %), trabecular thickness (Tb. Th, mm) and bone surface area to bone volume (Bs/BV, mm−1) were measured to analyze bone quality.
Histomorphology Assessment
The collected knee joint was dipped in 10% formalin for tissue fixation for approximately 48 hours at first. Then, 10% ethylenediaminetetraacetic acid (EDTA) was used to decalcify the bone tissue of the joint for 4 weeks before embedding in paraffin. Paraffin-embedded knee joints were cut 6 μm thick in sagittal sections on a microtome. The obtained sections were stained to evaluate the synovial infiltrate score, bone erosion score and cartilage Osteoarthritis Research Society International (OARSI) score with safranin O-fast green and H&E as described in our previous article. (32) The severity level was set as 0 (no detectable change), 1 (mild change), 2 (moderate change), and 3 (abundant change) for infiltration and erosion. Moreover, the extent of cartilage damage was assessed by a modified method (33). Blinded slides of each animal were inspected by at least three observers, and the averages of summed scores were used in the statistical analyses.
Tissue Immunofluorescence Analysis
Similar to immunohistochemistry staining, the sections of knee joints were routinely dewaxed, rehydrated, washed and blocked. The sections were then incubated with antibodies including anti-F4/80 (1:500 dilution), anti-CD206 (1:500 dilution) and anti-iNOS (1:100 dilution) for 12 h at 4 °C. After incubation, the sections were rinsed with PBS 3 times, and then fluorescence-labeled secondary antibodies, goat polyclonal secondary antibody to rabbit IgG (H&L) (Alexa Fluor®647) and goat polyclonal secondary antibody to rat IgG (H&L) (Alexa Fluor®488), were simultaneously added to the sections for 60 min at 37 °C. In addition, nuclei were counterstained with 40,6-diamidino-2-phenylindole (DAPI). Finally, the sections were routinely washed, dehydrated, mounted and then photographed with a Zeiss laser scanning microscope (LSM510).
Transcriptional Sequencing Data Collection and Processing
We searched the transcriptional sequencing data from the GEO Database (https://www.ncbi.nlm.nih.gov/geo/) with the keywords “RA or Rheumatoid Arthritis” and “Macrophage or Mononuclear cell”. We screened according to the following points: detailed information and reliable source; expression profiling by array. Finally, GEO accessions GSE10500, GSE97779 and GSE49604 were selected for analysis.
For the analysis of the differentially expressed genes (DEGs), NCBI GEO2R online tool (https://www.ncbi.nlm.nih.gov/geo/geo2r/) was applied. Control groups and RA groups were compared. Benjamini & Hochberg correction was chosen for P-value adjustment. P < 0.05 and |Log2FC|>1 was chosen as cut-off value. Then, the intersection of DEGs among GSE10500, GSE97779 and GSE49604 was chosen for further analysis of genes.
Identification of TFDG Target
For identifying target proteins of TFDG, Swiss Target Prediction online tool (http://www.swisstargetprediction.ch/) and STITCH (http://stitch.embl.de/) was applied. Canonical smiles of TFDG (PubChem CID:136277567) were chosen to estimate the most probable protein targets of TFDG. Then, we took the intersection between predicted targets of TFDG and DEGs of GSE10500, GSE97779 and GSE49604. Meanwhile, intersecting data were ranked according to the binding probability between TFDG and targets. Finally, according to the sorting data, we chose the top1 target of the list to protein–ligand molecular docking.
Protein–Ligand Molecular Docking
TFDG 2D structures were obtained from PubChem (CID:136277567). For subsequent docking, LigPrep (Schrödinger) and Chem3D (ChemOffice2020) were applied to transform the 2D structure into a 3D structure and minimize the molecular energy. Polar hydrogens and rotatable bonds were set on TFDG by AutoDock Tools. Other parameters were set to the default values. We searched the RCSB PDB database (https://www.rcsb.org/) for the 3D structures of the Bcl-2 complex with the Beclin-1 BH3 domain, through screening the best protein crystal structure [images with lower Resolution (A) will possess relatively intact structure]. Then, the structure of the Bcl-2 complex with the Beclin-1 BH3 domain was downloaded from the RCSB PDB database (PDB ID: 5VAU). The Bcl-2 structure was split from the Bcl-2/Beclin-1 complex (PDB ID: 5VAU) by PyMOL and PDB files of Bcl-2 were imported into AutoDock Tools. We removed proteins’ water molecules, added polar hydrogen, and saved the structure as PDBQT format files for later use. By adjusting BCL2 X-Y-Z coordinates and grid size, binding sites of BCL2 for molecular docking were set (centure: center_X = −5.828, center_Y = −1.045, center_Z = 36.122; grid size: size_X = 126, size_Y = 126, size_Z = 116). AutoDock Vina is an open-source molecular docking program and multi-threaded techniques to make more accurate and faster predictions than AutoDock4.39
Then, AutoDock Vina was run to calculate all the docking poses of TFDG on Bcl-2 fifty times, and structure with four lowest binding energy were taken as final results. The complexes were then presented using PyMOL.
Enzyme‑linked Immunosorbent Assays (ELISA)
BMMs were seeded in 6-well plates with 5×10⁵ cells per well, and the supernatant was collected for analyzing IL-6, IL-1β and IL-10 by ELISA. Besides, IL-6, IL-1β and TNF-α of peripheral blood were analyzed by ELISA kits according to the manufacturer’s instructions. In vitro, the macrophages were divided into 4 groups: Sham group was only treated with PBS; the TNF-α group was pretreated with PBS 2h before incubating with TNF-α (10ng/mL) 24h; and the Low-TFDG and High-TFDG groups were separately pretreated with the 0.1μmol/L and 1.0μmol/L TFDG for 2h and then cultured with TNF-α (10 ng/mL) for 24h. After that, the medium was collected to analyze the changes in IL-10, IL-6 and IL-1β via ELISA kits. In CIA mice, peripheral blood was collected from the posterior orbital venous plexus before sacrifice and then the serum was used to detect inflammatory cytokines by ELISA kit.
Flow Cytometry
BMMs were blocked with 3% BSA for 45 minutes, and then incubated with ACP-conjugated anti-mouse CD11b (1:200), FITC-conjugated anti-mouse F4/80 (1:200), PE-conjugated anti-mouse CD206 (1:200) or PE-conjugated anti-mouse CD86 (1:200), according to the manufacturers’ instructions. For each sample, at least 104 cells were analyzed using the Attune NxT (Thermo Fisher Scientific, USA).
Real-Time Quantitative PCR Analysis
Cell culture and intervention were same as described above. We extracted the total RNA using TRIzol (Invitrogen, USA) and then used NanoDrop-2000 (Thermo Fisher, USA) to measure the concentration of total RNA for reverse transcription. After identifying the density, Prime Script RT Master Mix (Takara, Japan) was applied to synthesize cDNA, and PCR amplification was subsequently performed. The amplification system included 7μL RNase-free dH2O, 0.5 μL of each primer, 2μL of cDNA and 10μL of qPCR Master Mix (Biotium, USA). We employed the CFX96 Touch Real-Time PCR Detection System (Bio–Rad, USA) to measure the reaction. Cycling systems were used as follows: 95.0°C for 10min at first, and then 40 cycles of 95.0°C for 5s, 60.0°C for 30s and 72°C for 30s were set. According to the internal control (GAPDH), the amplification efficiency normalized the data during their use. Primers were purchased from Sangon Biotech (Shanghai, China), and the sequences were as follows:
mouse IL-1β:
F: 5’-ACTCATTGTGGCTGTGGAGA-3’
R: 5’-TGTTCATCTCGGAGCCTGT-3’;
mouse IL-6:
F: 5’-TCGTGGAAATGAGAAAAGAGTG-3’
R: 5’-AGTGCATCATCGTTGTTCATACA-3’;
mouse iNOS:
F: 5’-ATCTTTGCCACCAAGATGGCCTGG-3’
R: 5’-TTCCTGTGCTGTGCTACAGTTCCG-3’;
mouse IL-10:
F: 5’-GAGAAGCATGGCCCAGAAAC-3’
R: 5’-CGCATCCTGAGGGTCTTCA-3’;
mouse Arg-1:
F: 5’-CTGAGCTTTGATGTCGACGG-3’
R: 5’-TCCTCTGCTGTCTTCCCAAG-3’;
mouse GAPDH:
F: 5’-CACCATGGAGAAGGCCGGGG-3’
R: 5’-GACGGACACATTGGGGGTAG-3’.
Each result was repeated three times.
Western Blot Analysis
BMMs were cultured in 6-well plates (6×10⁵ cells per well) for 12h. Before 10ng/mL TNF-α treatment, low and high concentrations of TFDG (0.1 and 1.0μM) were separately added to the Low- and High-TFDG groups for 2hours. Then, after treatment with 10ng/mL TNF-α for 30min, the macrophages were collected, centrifuged and lysed for Western blot analysis. Before the Western blot assay, the collected proteins were set to the same amounts within the four groups. Then, 28 micrograms of protein per group were loaded on 10%SDS-PAGE to split proteins and transferred to nitrocellulose (NC) membranes by 300mA 1hour. The NC membranes containing proteins were blocked with Quick-Block™ blocking buffer (Beyotime Institute of Biotechnology, China). Next, the NC membranes were incubated with primary antibodies (1:1000) overnight at 4°C. Then, membranes were rinsed in TBS-Tween and cultured with secondary horseradish peroxidase-conjugated antibodies (1:5000) for 2 hours at room temperature. The proteins were measured by a chemiluminescence detection system (Bio–Rad).
Associated Software in Interpreting Data
We used ImageJ1.8 to analyze image data, such as histomorphological pictures and cell immunofluorescence pictures. Image lab (Bio–Rad) was applied to analyze the bands of Western blot. The obtained digital data were analyzed with GraphPad Prism 8.0.
Statistical Analysis
All statistical analyses were performed using GraphPad Prism version 8.0. Continuous variables were described using the mean ± standard deviation. Categorical variables are shown as frequencies and proportions. Homogeneity tests of variances were performed to analyze the differences in data among the groups, and statistical significance between groups was identified by t-test and one-way ANOVA. According to the recommendation of GraphPad prism9, Dunnett’s multiple comparisons test was selected for post-hoc test after one-way ANOVA. For the data that did not suitable for parametric test, nonparametric Kruskal–Wallis tests was applied. P < 0.05 was considered to have a significant difference.
Results
TFDG Reduced Inflammation Both in vitro and in vivo
To determine the optimal concentration for the experiments, CCK-8 assay was chosen to ensure the effects of TFDG on cell viability and 2D Chemical Structure shown in Figure 2A. CCK-8 results showed that less than or equal to 10μmol/L of TFDG had no adverse impact on cell growth compared to 0μmol/L during day1 to day7 (Figure 2B). In contrast, 20μM TFDG markedly inhibited BMMs proliferation on day 1 (Figure 2B). Thus, we chose 1μmol/L and 0.1μmol/L of TFDG for the treatment of High and Low–TFDG group in vitro.
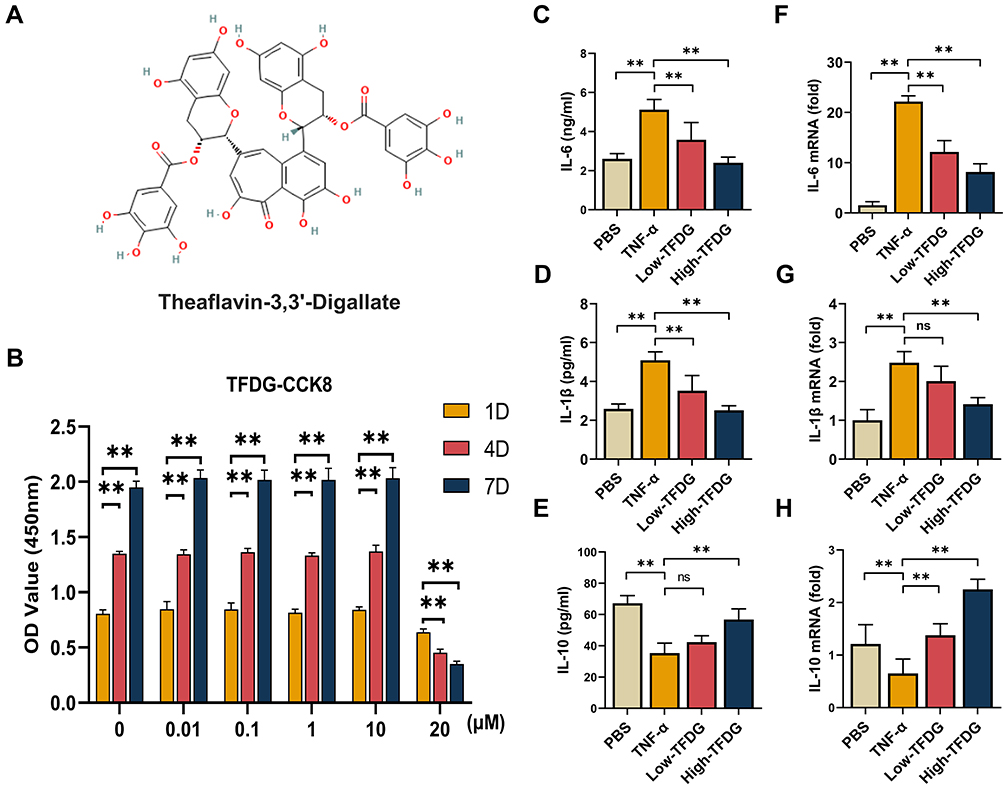 |
Figure 2 TFDG reduced the inflammatory cytokines in vitro. (A) 2D structure of TFDG. (B) Cell viability of BMMs treated with 0, 0.01, 0.1, 1, 10 and 20μM of TFDG for 1day, 4days and 7days. (n=5 per group) (**p<0.01 compared with 1day OD value.) (C–E) IL-6, IL-1β and IL-10 of BMMs supernatant were analyzed with ELISA. (n=5 per group) (F–H) IL-6, IL-1β and IL-10 of BMMs were analyzed with Real-time quantitative PCR. (n=5 per group.) (**p<0.01 compared with the TNF-α group). Abbreviation: ns, no statistically significant. |
For investigating the effects on inflammation, we continued to study the transcription and expression levels of inflammatory cytokines on BMMs in the presence of TNF-α, which simulates the inflammatory state in vitro. As shown in Figure 2C–E, the expression of IL-6 and IL-1β were both increased in the TNF-α group, but mildly upregulated in the High-TFDG group compared with PBS group. In addition, the mRNA of IL-6 and IL-1β were also highly increased in the TNF-α group and almost unchanged in the High-TFDG group (Figure 2F–H). In contrast, PCR and ELISA results presented that IL-10, an anti-inflammatory cytokine, significantly increased in High-TFDG group compared with the TNF-α group (Figure 2C–H).
In vivo studies, immunohistochemical staining of the synovial membrane of knee joint was applied to investigate the inflammatory state of CIA mice. Thirty-two male DBA/1 mice were randomly divided into 4 groups: Sham group (no treatment); Vehicle group (collagen-induced arthritis); Low-TFDG (collagen-induced arthritis, 1mg/kg TFDG) and High-TFDG (collagen-induced arthritis, 10mg/kg TFDG). As shown in Figure 3A–C, the levels of TNF-α and IL-1β were upregulated in the vehicle group and slightly increased in the High-TFDG group compared with the sham group. Meanwhile, levels of TNF-α, IL-1β and IL-6 in peripheral blood were markedly downregulated in the High-TFDG group compared with the vehicle group and mildly downregulated in the Low-TFDG group (Figure 3D–F). In contrast, serum IL-10 steadily increased in a concentration-dependent manner in the TFDG treatment groups (Figure 3G). These results indicated that TFDG effectively suppressed inflammation both in vitro and vivo.
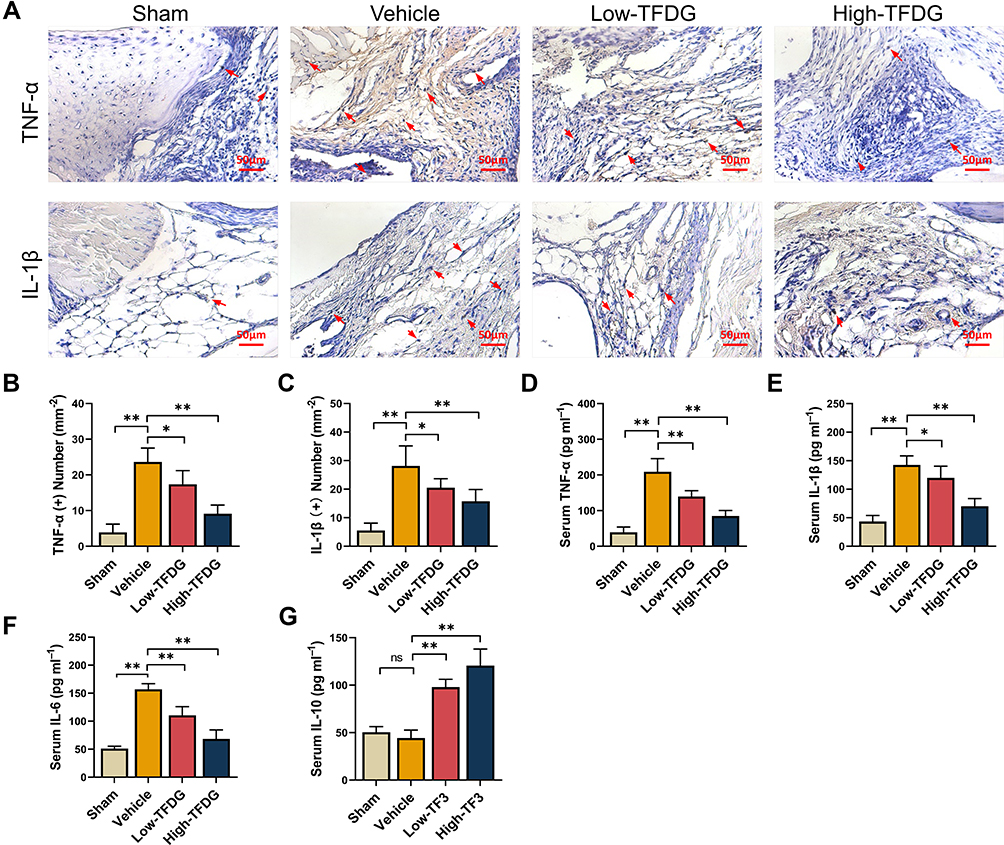 |
Figure 3 TFDG reduced the inflammatory cytokines in vivo. (A) Immunohistochemistry staining of TNF-α and IL-1β in CIA mice. (The red arrows point to positive cells. Scale bar: 50μm.) (B and C) Quantitative analysis of the number of positive cells in immunohistochemistry staining. (D–G) ELISA analysis of TNF-α, IL-1β, IL-6 and IL-10 in peripheral blood. (*p<0.05 and **p<0.01 compared with the vehicle group, n=8 each group). Abbreviation: ns, no statistically significant. |
TFDG Ameliorated the Arthritis of CIA Mice
To investigate whether it truly attenuated the arthritis of CIA mice, we did the following experiments. Figure 1A presents the process of model establishment and treatment. The results, in Figure 1B, show that the paw swelling of the High-TFDG group was smaller than the Vehicle group. The paw thickness increased from the third weekend and peak value appeared at the fifth weekend both in Low- and High-TFDG groups (Figure 1C). However, the vehicle group increased steadily until sacrifice (Figure 1C). The arthritis scores of the Low- and High-TFDG groups tended to be stable from the 5th week, and the vehicle group tended to be stable from the 6th week (Figure 1C). Furthermore, the peak value of arthritis scores in the TFDG groups was significantly lower than the vehicle group (Figure 1C). In addition, micro-CT analysis further confirmed the results in above. As shown in Figure 1D and E, the BS/BV was increased in vehicle group, and the Tb. Th and BV/TV were significantly decreased. In contrast, intervention with TFDG significantly ameliorated the damage in BV, BV/TV and Tb. Th, and reverse the change of BS/BV (Figure 1E).
In addition, histomorphological results of the joint were more intuitive to assess the therapeutic effects of TFDG. As shown in Figure 4A and B, H&E and Safranin-O staining showed the severity of joint destruction, such as cartilage damage, synovial hyperplasia and subchondral bone destruction. High-TFDG group was destroyed slightly than the Low-TFDG group and lower than that in the vehicle group (Figure 4A and B). Erosion score, OARSI score and infiltrate score in the Low-TFDG and High-TFDG groups were fully reduced compared to vehicle group (Figure 4C–E). In addition, the levels of inflammatory cell infiltration were differences between vehicle and TFDG groups (Figure 4F). These results suggest that TFDG reduced joint damage in CIA mice.
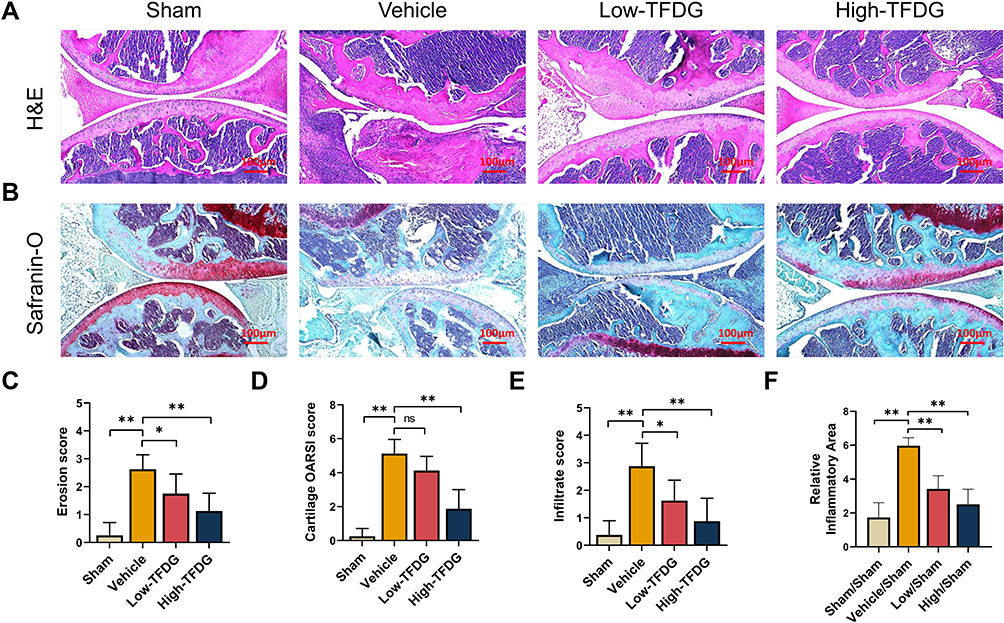 |
Figure 4 TFDG ameliorated the joint destruction. (A) H&E staining and (B) safranin-O/fast green staining of the knee joint of CIA mice. (Scale bar: 100μm) (C) Erosion score. (D) Cartilage OARSI score. (E) Infiltrate score. (F) Quantitative analyses of the relative inflammatory area of the knee joint. (*p<0.05 and **p<0.01 compared with the vehicle group, n=8 per group). Abbreviation: ns, no statistically significant. |
Besides, we stained the liver and kidney with H&E staining to evaluate the drug toxicity. As shown in Figure S1, there was no difference between TFDG treatment groups and PBS group. The results illustrated that the doses of TFDG used in vivo were no toxic effect.
TFDG Played an Important Role in Macrophage Polarization
Macrophage plays a vital role in inflammatory diseases. In current study, CD86 or iNOS were chosen for M1 macrophage marker and CD206 or Arg-1 for M2 macrophage marker. F4/80 was universal marker of mature macrophages.
In vitro, BMMs cultured in 10ng/mL TNF-α medium 24h except for PBS group and Low- and High-TFDG groups were pretreated with 0.1μM and 1.0μM TFDG for 2h. Immunofluorescence analysis of the macrophage phenotype revealed that the number of F4/80(+) iNOS(+) macrophages significantly increased in TNF-α group and slightly in High-TFDG group (Figure 5A–C). In contrast, F4/80(+) Arg-1(+) macrophages obviously increased in High-TFDG group and mildly in TNF-α group. RT–PCR results further confirmed the results that iNOS was increased in the TNF-α group and Arg-1 was upregulated in the Low- and High-TFDG groups (Figure 5D).
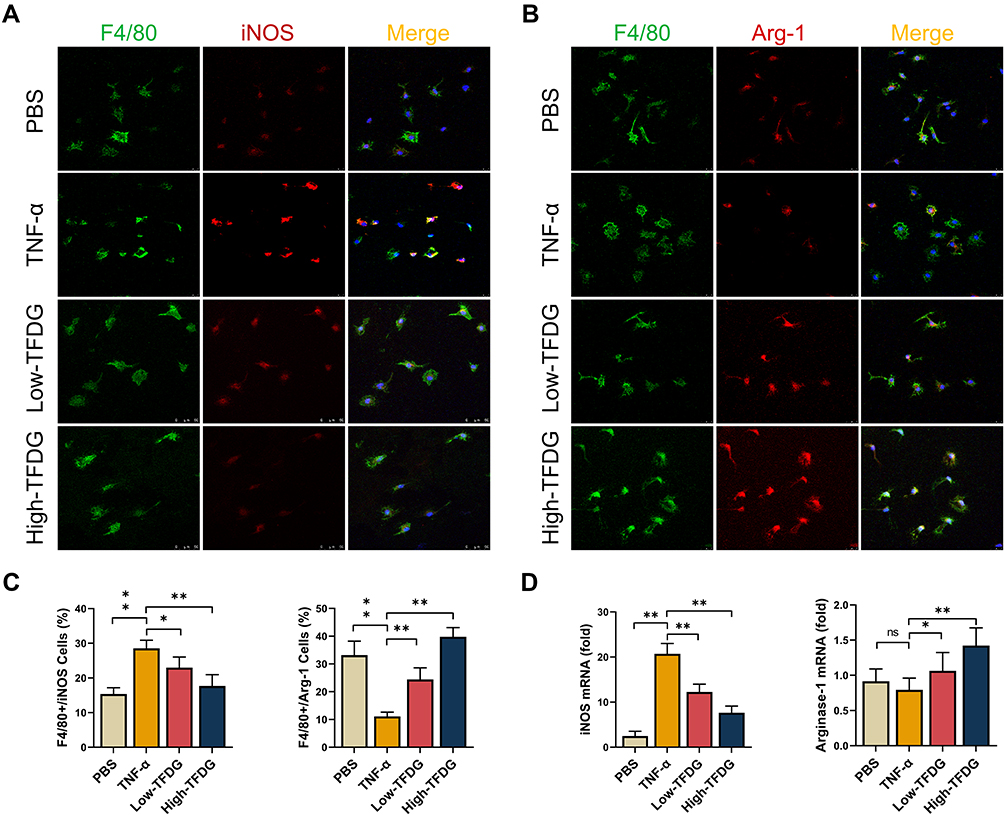 |
Figure 5 TFDG regulated macrophage polarization in vitro. (A) Immunofluorescence staining of F4/80(+)iNOS(+) macrophages. (B) Immunofluorescence staining of F4/80(+)Arg-1(+) macrophages. (C) Quantitative analyses of the positive cell number. (*p<0.05 and **p<0.01 compared with the TNF-α group; n=3 each group) (D) Real-time quantitative PCR analysis of iNOS and Arginase-1 mRNA level. (*p<0.05 and **p<0.01 compared with the TNF-α group, n=5 each group). Abbreviation: ns, no statistically significant. |
In vivo, Figure 6A shows that F4/80(+) CD86(+) cells more appeared in vehicle group and slightly arose in Low-TFDG group, but no significant difference in High-TFDG group compared to the sham group. In contrast, the number of F4/80(+) CD206(+) cells was increased in the High-TFDG group and slightly increased in the Low-TFDG group compared with the vehicle group (Figures 6B and S2).
 |
Figure 6 TFDG regulated macrophage polarization in CIA mice. (A and B) Immunofluorescence staining of F4/80(+)CD86(+) and F4/80(+)CD206(+) macrophages. (Scale bar: 100μm and 50μm.). |
These results suggested that TFDG played an important role in macrophage polarization, during which TFDG might regulate macrophage to reduce inflammatory cytokines and increase anti-inflammatory cytokines both in vitro and in vivo.
TFDG Modulated Macrophage Polarization via Autophagy
To clarify the role of TFDG involved in macrophage polarization, we applied Swiss Target Prediction and STITCH5.0 to predict possible targets. The results showed that 100 proteins were associated with TFDG and ranked by binding probability. In addition, we used NCBI Gene Datasets and NCBI GEO online tools to find the key differentially expressed genes (DEGs) between RA and control groups. Finally, GEO series GSE10500, GSE97779 and GSE49604 were chosen for DEGs analysis. As shown in Figure 7A, 4014 DEGs were screened in GSE97779, 456 DEGs in GSE49604 and 129 DEGs in GSE10500. To find out the key roles in RA from 100 targets of TFDG, we took the intersection between predicted targets of TFDG and DEGs of GSE10500, GSE97779 and GSE49604. The results are presented in Figure 7B, in which 28 proteins were selected and ranked by binding probability with TFDG. According to binding probability, Bcl-2 had the highest possibility of combination and was chosen for following analysis (Figure 7B).
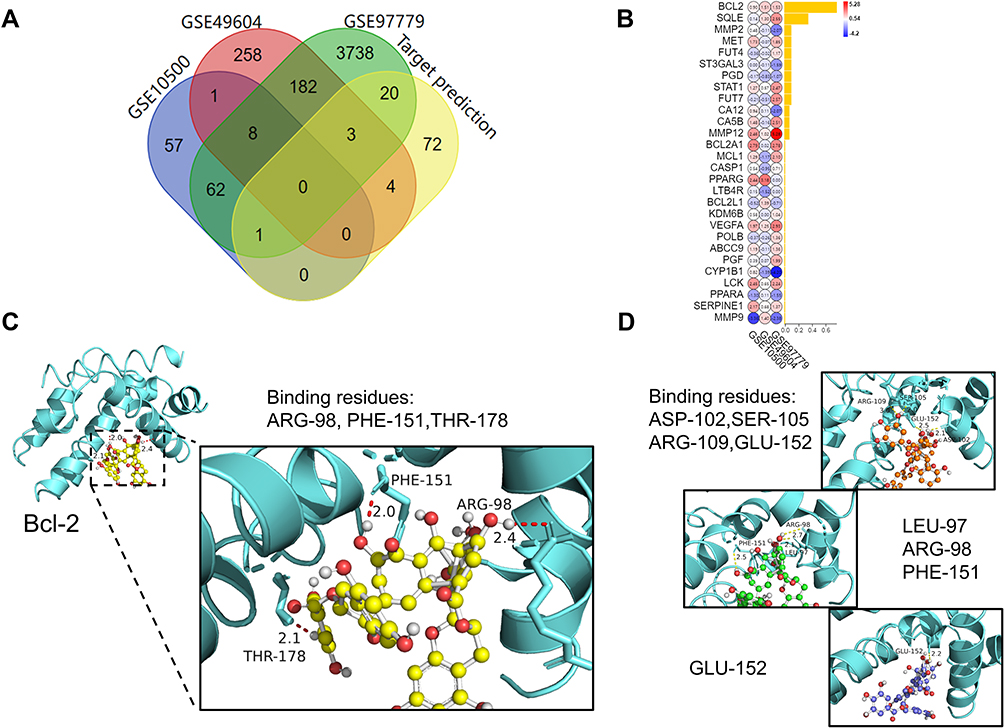 |
Figure 7 Prediction of TFDG targets and protein–ligand docking. (A) Intersection of GSE10500, GSE49604, GSE97779 and the results of Swiss Target Prediction of TFDG. (B) The intersection results were ranked by binding probability with TFDG.(Yellow bar chart presented the probability of combination between TFDG and proteins.) (C and D) Formation of hydrogen bond between TFDG and Bcl-2 residues. Showed in (C) was top1 binding conformation of TFDG with minimum binding energy. (D) was another 3 conformation of top4 with minimum binding energy. (yellow: top1, red: top2, green: top3, blue: top4.). |
The 3D structure of Bcl-2 was obtained from RCSB PDB (PDB accession 5VAU) (Figure S3AI). It was reported that BCL-2 could bind with Beclin-1 and the complex of BCL-2/Beclin-1, was presented in Figure S3AII and S3AIII). With protein–ligand docking, we further found that TFDG not only bound to Bcl-2 but also affected the binding pocket of Bcl-2/Beclin-1 complex (Figure S3B). As shown in Figure S3B, TFDG could bind with the Bcl-2/Beclin-1 binding pocket, and which might be possible to facilitate Beclin-1 release. Figure 7C shows the TFDG/BCL-2 complex with lowest combining energy, in which TFDG bind with the ARG-98, PHE-151 and THR-178 residues of Bcl-2. The other top4 TFDG with low combining energy are shown in Figure 7D.
To verify whether the level of autophagy was influenced, we explored the changes in Beclin-1 and LC3B, both of which played important roles in autophagy. Consistent with the protein–ligand docking results, Beclin-1 levels were increased after TFDG treatment compared with TNF-α group (Figure 8A and C). Meanwhile, LC3BII was stimulated as well in TFDG treatment (Figure 8A and D). Through confocal laser scanning microscopy, we also observed that LC3B accumulated in High-TFDG groups with higher fluorescence intensity compared with TNF-α (Figure 8B and E). These results indicated that the level of autophagy was upregulated (Figure 8C–E). Finally, we further confirmed the regulatory mechanism of TFDG with agonist and antagonist of autophagy. Figure 8F presents the process of screening M1 and M2 macrophages. All macrophages were selected with CD11b from BMMs. Then, M1 macrophages were screened with F4/80(+) CD86(+) and M2 macrophages with F4/80(+) CD206(+). As shown in Figure 8G and H, TNF-α treatment increased the M1 macrophages and decreased the M2 macrophages. In contrast, rapamycin, an agonist of autophagy, and TFDG inhibited the M1 polarization and promoted M2 polarization. In addition, the regulatory effects of TFDG on macrophage polarization were blocked by 3-MA, an inhibitor of autophagy (Figure 8G and H).
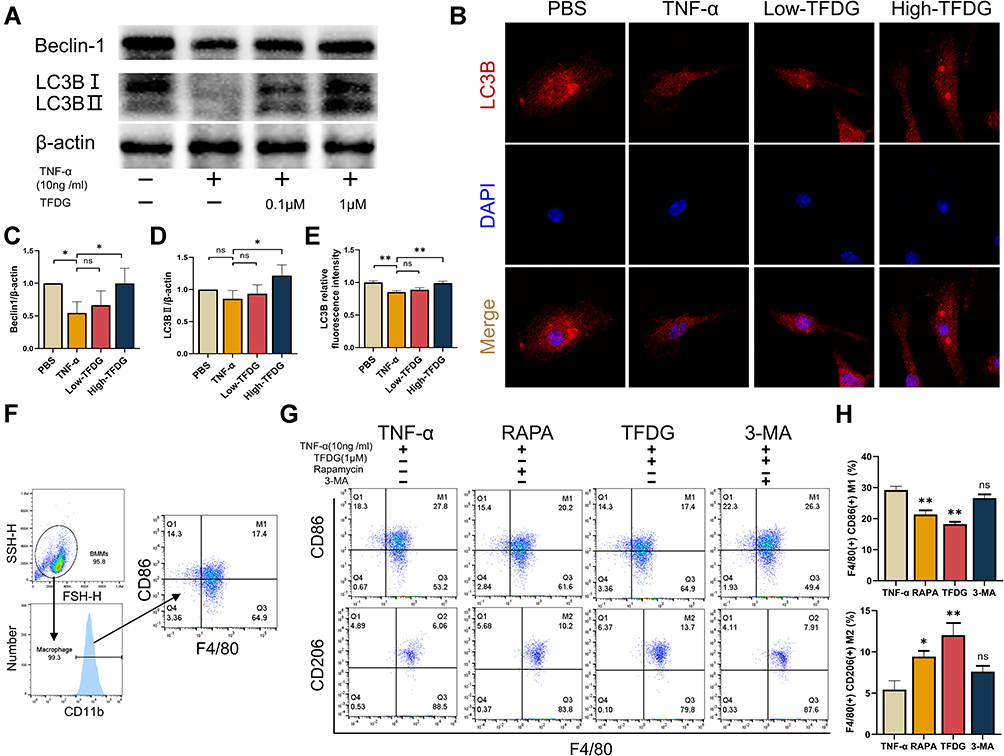 |
Figure 8 TFDG regulated macrophage polarization via autophagy. Before 10ng/mL TNF-α treatment for 4h, low and high concentration of TFDG (0.1 and 1.0μM) were separately added to the low and high TFDG groups for 2hours. (A) The Western blot analysis of Beclin-1, LC3B and β-actin (internal reference). (B) Immunofluorescence of the LC3B in BMMs. (C and D) Quantitative analysis of the gray level of Beclin-1 and LC3B bands. (E) Quantitative analysis of LC3B fluorescence intensity. (F) M1 and M2 macrophage sorting process with flow cytometry. (G and H) F4/80(+)CD86(+) and F4/80(+)CD206(+) macrophages were analyzed. (*p<0.05 and **p<0.01 compared with the TNF-α group, n=3 each group). Abbreviation: ns, no statistically significant. |
Finally, we conducted the rescue experiments by using one of Bcl-2 promoter, BIP V5. As shown in Figure S4A, TFDG treatment rescued the Beclin-1 inhibited by TNF-α, and increased the autophagy levels in BMMs. In contrast, BIP V5 treatment suppressed the facilitating effects of TFDG on Beclin-1 and LC3B (Figure S4A and S4B). Furthermore, BIP V5 neutralized the regulating effects of TFDG on macrophage (Figure S4C and S4D).
These results suggested that macrophage polarization was associated with the autophagy level. Besides, TFDG facilitated M2 polarization and reduces inflammation by promoting autophagy level of macrophage.
Discussion
RA is a chronic inflammatory disease caused by autoimmunity.1 The current therapeutic strategy for RA focus on inhibition of immune cells to attenuate inflammatory infiltration and joint destruction.40 Unfortunately, the drugs used in RA have various side effects and need long-term use.41 Thus, the development of new drugs and therapeutic strategies is necessary. TFDG, a bioactive polyphenol of black tea, has been reported to possess multiple beneficial properties.24 The inhibitory effects of TFDG on inflammatory diseases have been widely investigated and reported that the MAPK and NF-κB signaling pathways were targets of TFDG.42–45 However, the majority of plant polyphenols all have anti-inflammatory effects and could affect inflammatory signaling pathways like NF-κB, JNK, P38, and so on. In other words, the working targets of TFDG are not specific. Therefore, this study is to identify a more specific mechanism of TFDG in RA. We found that TFDG not only had a protective effect on the joints of RA mice by decreasing cytokines such as TNF-α, IL-1β and IL-6 but also had the ability to facilitate macrophage polarization from the M1 to M2 phenotype under inflammatory conditions. Our findings clarified the therapeutic mechanism of TFDG in RA and further presented a new approach to study the effect of TFDG on inflammatory diseases.
Inhibition of inflammatory cells and cytokines is pivotal to limit the persistence and expansion of inflammation in RA.5,46 TFDG was demonstrated to have a protective effect on inflammatory bowel disease (IBD) by inhibiting the production of inflammatory mediators.43 In addition, Hosokawa et al reported that IL-6 production could be inhibited in human gingival fibroblasts by TFDG.47 In the current research, we observed that collagen-induced arthritis caused paw thickness, arthritis scores and joint destruction to become noticeable, which was consistent with previous studies.48 TFDG treatment alleviated these changes and damage in a concentration-dependent manner, which was in line with the histomorphology assessment. TFDG had a protective effect on the joints of CIA mice.
Macrophage plays an important role in the pathogenesis of RA.49 In this study, we also found that M1 macrophages were upregulated in CIA mice. Besides, cytokines, such as IL-1β, IL-6 and, especially TNF-α, play a fundamental role in the development of RA by upregulating inflammatory cytokine and chemokine expression, facilitating leukocyte activation, promoting angiogenesis and magnifying autoantibody production.50,51 Therefore, TNF-α was chosen for the cell experiments to simulate inflammatory conditions in current study. We observed that TNF-α treatment induced robust inflammation and M1 polarization in vitro. Fortunately, both Low- and High-TFDG had the ability to inhibit TNF-α induced inflammation. Additionally, an increasing number of studies have emphasized the macrophage heterogeneity in treatment of RA.52 It has been proposed that the chronic inflammation of RA is due to breaking balance between M1 and M2 macrophages.5,20 Studies have reported that arthritic inflammation achieved remission by inhibition of M1 macrophages and stimulation of M2 macrophages.21,53,54 In this study, TFDG treatment upregulated the number of M2 macrophages both the in vitro and in vivo, and M1 macrophage and cytokines were both decreased. These results showed that TFDG could regulate macrophage polarization to attenuate chronic inflammation in CIA mice.
Autophagy is an important cellular process associated with the response to extracellular stimuli, maintains cellular homeostasis and facilitates cell metabolism.34,55 Interestingly, when we applied protein-ligand prediction tools to predict the possible targets of TFDG, we found that Bcl-2 was the most candidate protein and BCL-2 could work with Beclin-1 to inhibit autophagic flux. Therefore, we hypothesized that TFDG might act with Bcl-2 to release Beclin-1 and affect the macrophage autophagy. Then, we verified the effects of TFDG on autophagy through Western blot and immunofluorescence analysis. We observed a notably increase in autophagy levels after TFDG treatment. When 3-MA was applied with TFDG, the M2 macrophage polarization was inhibited and the number of M1 macrophage were no significant difference with TNF-α treatment group. Therefore, macrophage polarization was associated with the autophagy level and TFDG had ability to reverse macrophage polarization through recovering the changed autophagy.
In addition, this study had some limitations as well. The in vivo environment of RA is very complex, and the use of TNF-α in vitro is not enough to simulate the in vivo conditions. Besides, RA is mainly characterized by chronic inflammation and subsequent destruction of joints, in which not only the immune cells but also fibroblast-like synoviocytes (FLSs) play an important role. Meanwhile, FLSs and immune cells, such as T cells, B cells and neutrophils can also secrete the same inflammatory cytokines as macrophage. Therefore, future studies in animals should further clarify that whether the treatment worked as expected mainly through the cell types investigated in vitro. In addition, the interaction between Bcl-2 and TFDG, as illustrated above, was indirectly verified and needed more direct evidence to prove the effects of TFDG in Bcl-2. Thus, further studies need to explore the crystal conformation of TFDG and BCL-2 via X-ray crystallography to identify the direct interaction between TFDG and Bcl-2.
Conclusion
The present study demonstrated that TFDG had a notable protective effect on arthritis in CIA mice. Besides, further investigation found that TFDG regulated macrophage polarization to attenuate the expression and secretion of inflammatory cytokines. Mechanistically, TFDG promoted the autophagy levels of macrophage to facilitate M2 polarization. In general, TFDG may be a candidate drug for arthritis of RA and possible for other chronic inflammatory disorders.
Ethics Approval
Ethical approval was obtained from the First Affiliated Hospital of Soochow University. All methods and experimental protocols were carried out in accordance with the guidelines and regulations of the Care and Use of Laboratory Animals of Soochow University.
Funding
This work was supported by the National Nature Science Foundation of China [82072425, 82072498, 81873990, 81873991, 81672238]; the Jiangsu Provincial Medical Youth Talent [QNRC2016751]; the Natural Science Foundation of Jiangsu Province [BK20200198]; the Priority Academic Program Development of Jiangsu Higher Education Institutions [PAPD]; Special Project of Diagnosis and Treatment for Clinical Diseases of Suzhou [LCZX202003], the Program for Talents in Science and Education of Suzhou [KJXW2018079]; the Application Fundamental Research Program of Suzhou [SYS2018032] and the Colleges and Universities Natural Science Foundation in Jiangsu Province [19KJXW2018079].
Disclosure
The authors report no conflicts of interest in this work.
References
1. McInnes IB, Schett G. The pathogenesis of rheumatoid arthritis. N Engl J Med. 2011;365(23):2205–2219. doi:10.1056/NEJMra1004965
2. Firestein GS. Evolving concepts of rheumatoid arthritis. Nature. 2003;423(6937):356–361. doi:10.1038/nature01661
3. Wang W, Zhou H, Liu L. Side effects of methotrexate therapy for rheumatoid arthritis: a systematic review. Eur J Med Chem. 2018;158:502–516. doi:10.1016/j.ejmech.2018.09.027
4. Chatzidionysiou K, Emamikia S, Nam J, et al. Efficacy of glucocorticoids, conventional and targeted synthetic disease-modifying antirheumatic drugs: a systematic literature review informing the 2016 update of the EULAR recommendations for the management of rheumatoid arthritis. Ann Rheum Dis. 2017;76(6):1102–1107. doi:10.1136/annrheumdis-2016-210711
5. Tardito S, Martinelli G, Soldano S, et al. Macrophage M1/M2 polarization and rheumatoid arthritis: a systematic review. Autoimmun Rev. 2019;18(11):102397. doi:10.1016/j.autrev.2019.102397
6. Funes SC, Rios M, Escobar-Vera J, Kalergis AM. Implications of macrophage polarization in autoimmunity. Immunology. 2018;154(2):186–195. doi:10.1111/imm.12910
7. Murray PJ. Macrophage Polarization. Annu Rev Physiol. 2017;79:541–566. doi:10.1146/annurev-physiol-022516-034339
8. Italiani P, Boraschi D. From monocytes to M1/M2 macrophages: phenotypical vs. functional differentiation. Front Immunol. 2014;5:514. doi:10.3389/fimmu.2014.00514
9. Mantovani A, Sica A, Sozzani S, Allavena P, Vecchi A, Locati M. The chemokine system in diverse forms of macrophage activation and polarization. Trends Immunol. 2004;25(12):677–686. doi:10.1016/j.it.2004.09.015
10. Ho VW, Sly LM. Derivation and characterization of murine alternatively activated (M2) macrophages. Methods Mol Biol. 2009;531:173–185. doi:10.1007/978-1-59745-396-7_12
11. Nielsen MC, Hvidbjerg Gantzel R, Claria J, Trebicka J, Moller HJ, Gronbaek H. Macrophage activation markers, CD163 and CD206, in acute-on-chronic liver failure. Cells. 2020;9(5):1175. doi:10.3390/cells9051175
12. Orecchioni M, Ghosheh Y, Pramod AB, Ley K. Macrophage polarization: different gene signatures in M1(LPS+) vs. Classically and M2(LPS-) vs. alternatively activated macrophages. Front Immunol. 2019;10:1084. doi:10.3389/fimmu.2019.01084
13. Wynn TA, Chawla A, Pollard JW. Macrophage biology in development, homeostasis and disease. Nature. 2013;496(7446):445–455. doi:10.1038/nature12034
14. Siouti E, Andreakos E. The many facets of macrophages in rheumatoid arthritis. Biochem Pharmacol. 2019;165:152–169. doi:10.1016/j.bcp.2019.03.029
15. Bluml S, Redlich K, Smolen JS. Mechanisms of tissue damage in arthritis. Semin Immunopathol. 2014;36(5):531–540. doi:10.1007/s00281-014-0442-8
16. Wynn TA, Vannella KM. Macrophages in tissue repair, regeneration, and fibrosis. Immunity. 2016;44(3):450–462. doi:10.1016/j.immuni.2016.02.015
17. Kim H, Wang SY, Kwak G, Yang Y, Kwon IC, Kim SH. Exosome-guided phenotypic switch of M1 to M2 macrophages for cutaneous wound healing. Adv Sci. 2019;6(20):1900513. doi:10.1002/advs.201900513
18. Bouhlel MA, Derudas B, Rigamonti E, et al. PPARgamma activation primes human monocytes into alternative M2 macrophages with anti-inflammatory properties. Cell Metab. 2007;6(2):137–143. doi:10.1016/j.cmet.2007.06.010
19. Di Benedetto P, Ruscitti P, Vadasz Z, Toubi E, Giacomelli R. Macrophages with regulatory functions, a possible new therapeutic perspective in autoimmune diseases. Autoimmun Rev. 2019;18(10):102369. doi:10.1016/j.autrev.2019.102369
20. Yang X, Chang Y, Wei W. Emerging role of targeting macrophages in rheumatoid arthritis: focus on polarization, metabolism and apoptosis. Cell Prolif. 2020;53(7):e12854. doi:10.1111/cpr.12854
21. Peng M, Qiang L, Xu Y, Li C, Li T, Wang J. IL-35 ameliorates collagen-induced arthritis by promoting TNF-alpha-induced apoptosis of synovial fibroblasts and stimulating M2 macrophages polarization. FEBS J. 2019;286(10):1972–1985. doi:10.1111/febs.14801
22. Yang Y, Guo L, Wang Z, et al. Targeted silver nanoparticles for rheumatoid arthritis therapy via macrophage apoptosis and Re-polarization. Biomaterials. 2021;264:120390. doi:10.1016/j.biomaterials.2020.120390
23. Lin JK. Cancer chemoprevention by tea polyphenols through modulating signal transduction pathways. Arch Pharm Res. 2002;25(5):561–571. doi:10.1007/BF02976924
24. Sharma V, Rao LJ. A thought on the biological activities of black tea. Crit Rev Food Sci Nutr. 2009;49(5):379–404. doi:10.1080/10408390802068066
25. Wu Y, Jin F, Wang Y, et al. In vitro and in vivo anti-inflammatory effects of theaflavin-3,3’-digallate on lipopolysaccharide-induced inflammation. Eur J Pharmacol. 2017;794:52–60. doi:10.1016/j.ejphar.2016.11.027
26. Hu X, Ping Z, Gan M, et al. Theaflavin-3,3’-digallate represses osteoclastogenesis and prevents wear debris-induced osteolysis via suppression of ERK pathway. Acta Biomater. 2017;48:479–488. doi:10.1016/j.actbio.2016.11.022
27. Liu W, Li J. Theaflavin-3, 3’-digallate attenuates rheumatoid inflammation in mice through the nuclear factor-kappaB and MAPK pathways. Arch Immunol Ther Exp. 2019;67(3):153–160. doi:10.1007/s00005-019-00536-7
28. Panche AN, Diwan AD, Chandra SR. Flavonoids: an overview. J Nutr Sci. 2016;5:e47. doi:10.1017/jns.2016.41
29. Kaushal N, Singh M, Singh Sangwan R. Flavonoids: food associations, therapeutic mechanisms, metabolism and nanoformulations. Food Res Int. 2022;157:111442. doi:10.1016/j.foodres.2022.111442
30. Telang M, Dhulap S, Mandhare A, Hirwani R. Therapeutic and cosmetic applications of mangiferin: a patent review. Expert Opin Ther Pat. 2013;23(12):1561–1580. doi:10.1517/13543776.2013.836182
31. Adnan M, Rasul A, Hussain G, et al. Ginkgetin: a natural biflavone with versatile pharmacological activities. Food Chem Toxicol. 2020;145:111642. doi:10.1016/j.fct.2020.111642
32. Wei SY, Chen Y, Xu XY. Progress on the pharmacological research of puerarin: a review. Chin J Nat Med. 2014;12(6):407–414. doi:10.1016/s1875-5364(14)60064-9
33. Kim KH, Lee MS. Autophagy–a key player in cellular and body metabolism. Nat Rev Endocrinol. 2014;10(6):322–337. doi:10.1038/nrendo.2014.35
34. Mizushima N, Komatsu M. Autophagy: renovation of cells and tissues. Cell. 2011;147(4):728–741. doi:10.1016/j.cell.2011.10.026
35. Liu T, Wang L, Liang P, et al. USP19 suppresses inflammation and promotes M2-like macrophage polarization by manipulating NLRP3 function via autophagy. Cell Mol Immunol. 2021;18(10):2431–2442. doi:10.1038/s41423-020-00567-7
36. Du S, Li C, Lu Y, et al. Dioscin alleviates crystalline silica-induced pulmonary inflammation and fibrosis through promoting alveolar macrophage autophagy. Theranostics. 2019;9(7):1878–1892. doi:10.7150/thno.29682
37. Liu K, Zhao E, Ilyas G, et al. Impaired macrophage autophagy increases the immune response in obese mice by promoting proinflammatory macrophage polarization. Autophagy. 2015;11(2):271–284. doi:10.1080/15548627.2015.1009787
38. Brand DD, Latham KA, Rosloniec EF. Collagen-induced arthritis. Nat Protoc. 2007;2(5):1269–1275. doi:10.1038/nprot.2007.173
39. Trott O, Olson AJ. AutoDock Vina: improving the speed and accuracy of docking with a new scoring function, efficient optimization, and multithreading. J Comput Chem. 2010;31(2):455–461. doi:10.1002/jcc.21334
40. Cheung TT, McInnes IB. Future therapeutic targets in rheumatoid arthritis? Semin Immunopathol. 2017;39(4):487–500. doi:10.1007/s00281-017-0623-3
41. Costello R, David T, Jani M. Impact of adverse events associated with medications in the treatment and prevention of rheumatoid arthritis. Clin Ther. 2019;41(7):1376–1396. doi:10.1016/j.clinthera.2019.04.030
42. Chauhan S, Dunlap K, Duffy LK. Effects of methylmercury and theaflavin digallate on adipokines in mature 3T3-L1 adipocytes. Int J Mol Sci. 2019;20(11):2755. doi:10.3390/ijms20112755
43. Ukil A, Maity S, Das PK. Protection from experimental colitis by theaflavin-3,3’-digallate correlates with inhibition of IKK and NF-kappaB activation. Br J Pharmacol. 2006;149(1):121–131. doi:10.1038/sj.bjp.0706847
44. Lin YL, Tsai SH, Lin-Shiau SY, Ho CT, Lin JK. Theaflavin-3,3’-digallate from black tea blocks the nitric oxide synthase by down-regulating the activation of NF-kappaB in macrophages. Eur J Pharmacol. 1999;367(2–3):379–388. doi:10.1016/s0014-2999(98)00953-4
45. Pan MH, Lin-Shiau SY, Ho CT, Lin JH, Lin JK. Suppression of lipopolysaccharide-induced nuclear factor-kappaB activity by theaflavin-3,3’-digallate from black tea and other polyphenols through down-regulation of IkappaB kinase activity in macrophages. Biochem Pharmacol. 2000;59(4):357–367. doi:10.1016/s0006-2952(99)00335-4
46. Dinarello CA. The IL-1 family of cytokines and receptors in rheumatic diseases. Nat Rev Rheumatol. 2019;15(10):612–632. doi:10.1038/s41584-019-0277-8
47. Hosokawa Y, Hosokawa I, Ozaki K, Nakanishi T, Nakae H, Matsuo T. Tea polyphenols inhibit IL-6 production in tumor necrosis factor superfamily 14-stimulated human gingival fibroblasts. Mol Nutr Food Res. 2010;54(Suppl 2):S151–S158. doi:10.1002/mnfr.200900549
48. Zhu M, Yu B, Bai J, et al. Cannabinoid receptor 2 agonist prevents local and systemic inflammatory bone destruction in rheumatoid arthritis. J Bone Miner Res. 2019;34(4):739–751. doi:10.1002/jbmr.3637
49. Udalova IA, Mantovani A, Feldmann M. Macrophage heterogeneity in the context of rheumatoid arthritis. Nat Rev Rheumatol. 2016;12(8):472–485. doi:10.1038/nrrheum.2016.91
50. Hess A, Axmann R, Rech J, et al. Blockade of TNF-alpha rapidly inhibits pain responses in the central nervous system. Proc Natl Acad Sci U S A. 2011;108(9):3731–3736. doi:10.1073/pnas.1011774108
51. McInnes IB, Schett G. Cytokines in the pathogenesis of rheumatoid arthritis. Nat Rev Immunol. 2007;7(6):429–442. doi:10.1038/nri2094
52. Alivernini S, MacDonald L, Elmesmari A, et al. Distinct synovial tissue macrophage subsets regulate inflammation and remission in rheumatoid arthritis. Nat Med. 2020;26(8):1295–1306. doi:10.1038/s41591-020-0939-8
53. Hristodorov D, Mladenov R, Fischer R, Barth S, Thepen T. Fully human MAP-fusion protein selectively targets and eliminates proliferating CD64(+) M1 macrophages. Immunol Cell Biol. 2016;94(5):470–478. doi:10.1038/icb.2016.4
54. Shin TH, Kim HS, Kang TW, et al. Human umbilical cord blood-stem cells direct macrophage polarization and block inflammasome activation to alleviate rheumatoid arthritis. Cell Death Dis. 2016;7(12):e2524. doi:10.1038/cddis.2016.442
55. Parzych KR, Klionsky DJ. An overview of autophagy: morphology, mechanism, and regulation. Antioxid Redox Signal. 2014;20(3):460–473. doi:10.1089/ars.2013.5371
 © 2023 The Author(s). This work is published and licensed by Dove Medical Press Limited. The
full terms of this license are available at https://www.dovepress.com/terms
and incorporate the Creative Commons Attribution
- Non Commercial (unported, 3.0) License.
By accessing the work you hereby accept the Terms. Non-commercial uses of the work are permitted
without any further permission from Dove Medical Press Limited, provided the work is properly
attributed. For permission for commercial use of this work, please see paragraphs 4.2 and 5 of our Terms.
© 2023 The Author(s). This work is published and licensed by Dove Medical Press Limited. The
full terms of this license are available at https://www.dovepress.com/terms
and incorporate the Creative Commons Attribution
- Non Commercial (unported, 3.0) License.
By accessing the work you hereby accept the Terms. Non-commercial uses of the work are permitted
without any further permission from Dove Medical Press Limited, provided the work is properly
attributed. For permission for commercial use of this work, please see paragraphs 4.2 and 5 of our Terms.
Recommended articles
Inhibition of miRNA-1-Mediated Inflammation and Autophagy by Astragaloside IV Improves Lipopolysaccharide-Induced Cardiac Dysfunction in Rats
Wang Q, Chen W, Yang X, Song Y, Sun X, Tao G, Wang H, Zhao N, Huang Y, Chai E, Tang F
Journal of Inflammation Research 2022, 15:2617-2629
Published Date: 23 April 2022
AMPK/SIRT1 Deficiency Drives Adjuvant-Induced Arthritis in Rats by Promoting Glycolysis-Mediated Monocytes Inflammatory Polarization
Wang DD, He CY, Wu YJ, Xu L, Shi C, Olatunji OJ, Zuo J, Ji CL
Journal of Inflammation Research 2022, 15:4663-4675
Published Date: 15 August 2022
α-Mangostin Inhibited M1 Polarization of Macrophages/Monocytes in Antigen-Induced Arthritis Mice by Up-Regulating Silent Information Regulator 1 and Peroxisome Proliferators-Activated Receptor γ Simultaneously

Wu YJ, Zhang SS, Yin Q, Lei M, Wang QH, Chen WG, Luo TT, Zhou P, Ji CL
Drug Design, Development and Therapy 2023, 17:563-577
Published Date: 23 February 2023
The Involvement of Glucose and Lipid Metabolism Alteration in Rheumatoid Arthritis and Its Clinical Implication
Luo TT, Wu YJ, Yin Q, Chen WG, Zuo J
Journal of Inflammation Research 2023, 16:1837-1852
Published Date: 26 April 2023
Future Biomarkers for Infection and Inflammation in Rheumatoid Arthritis
Cui S, Qian J
Journal of Inflammation Research 2023, 16:2719-2726
Published Date: 29 June 2023