Back to Journals » Diabetes, Metabolic Syndrome and Obesity » Volume 16
The Triglyceride-Glucose Index is Associated with Vitamin D Status in Metabolic-Associated Fatty Liver Disease
Authors Liu Z ![]() , Zhang W
, Zhang W ![]() , Zhao Z
, Zhao Z ![]() , Li W
, Li W ![]() , Zhang J
, Zhang J ![]()
Received 18 May 2023
Accepted for publication 16 August 2023
Published 31 August 2023 Volume 2023:16 Pages 2651—2660
DOI https://doi.org/10.2147/DMSO.S421840
Checked for plagiarism Yes
Review by Single anonymous peer review
Peer reviewer comments 2
Editor who approved publication: Dr Konstantinos Tziomalos
Zhiping Liu, Wensha Zhang, Zhiwei Zhao, Wenhao Li, Jinhua Zhang
Department of Gastroenterology, Hankou Hospital of Wuhan, Wuhan, Hubei, People’s Republic of China
Correspondence: Jinhua Zhang, Department of Gastroenterology, Hankou Hospital of Wuhan, No. 7, Erqice Road, Jiangan District, Wuhan, Hubei, 430012, People’s Republic of China, Tel +86 27 8228 3181, Email [email protected]
Purpose: Vitamin D deficiency was thought to be associated with insulin resistance and metabolic-associated fatty liver disease (MAFLD). The aim of this study was to investigate the relationship between the triglyceride-glucose (TyG) index, a useful surrogate biomarker of insulin resistance, and vitamin D status in patients with MAFLD.
Patients and Methods: A total of 566 patients with MAFLD were included in this retrospective cross-sectional study. Clinical characteristics were compared between participants with and without vitamin D deficiency. The association between the TyG index and serum 25-hydroxyvitamin D [25(OH)D] levels was determined by Spearman correlation analysis and logistic regression analysis. The receiver operating characteristic curve (ROC) was used to assess the diagnostic efficacy of TyG index for vitamin D deficiency in MAFLD patients.
Results: The TyG index levels were higher in the vitamin D deficient group than in the non-vitamin D deficient group, and serum 25(OH)D was negatively correlated with the TyG index. The TyG index was an independent risk factor for vitamin D deficiency in patients with MAFLD. The area under the curve (AUC) of the TyG index for the identification of vitamin D deficiency in MAFLD patients was 0.744 (95% CI: 0.701– 0.787, p< 0.001).
Conclusion: The TyG index is negatively associated with vitamin D status in patients with MAFLD. In patients with MAFLD, a higher TyG index may be an indication of a higher prevalence of vitamin D deficiency.
Keywords: triglyceride-glucose index, 25-hydroxyvitamin D, metabolic-associated fatty liver disease, insulin resistance
Introduction
Non-alcoholic fatty liver disease (NAFLD) has become a very common disease as a result of changes in diet and lifestyle. NAFLD affects around a quarter of the global adult population, resulting in widespread social and economic implications.1 As well as causing liver damage, NAFLD is also closely associated with metabolic disorders. NAFLD has common clinical and physiopathological profiles with metabolic syndrome, and the increased incidence of metabolic syndrome is associated with an equally significant increase in NAFLD worldwide.2 Therefore, NAFLD is also recognised as a hepatic manifestation of metabolic syndrome. In view of the close relationship between NAFLD and metabolic syndrome, an international panel published a consensus statement proposing to rename NAFLD as metabolic-associated fatty liver disease (MAFLD) in 2020.3 Role of metabolic disorders and insulin resistance in the pathogenesis of fatty liver is emphasised by this new nomenclature.
Vitamin D deficiency is very common in Asian populations, and the factors significantly related to vitamin D deficiency were gender, age, altitude, region, and specific diseases (diabetes, cancer, fracture, systemic lupus erythematosus, fatty liver disease, osteopenia, thyroiditis, anemia, hepatitis, metabolic diseases, and dermatitis).4 Noteworthy, vitamin D deficiency has been closely associated with the severity of NAFLD and has been linked to the pathogenesis of insulin resistance, a critical factor in the development of NAFLD.5 It has been reported by Guo et al that vitamin D supplementation has a favourable effect on glycemic control and insulin sensitivity in patients with NAFLD.6 A recent study has additionally discovered a negative association between serum vitamin D and MAFLD, particularly when the serum vitamin D level reached or exceeded 44.6 nmol/L.7
In recent years, the Triglyceride-Glucose (TyG) index, which is derived from a simple formula based on serum triglyceride and fasting blood glucose levels, has been considered to be a useful surrogate biomarker of insulin resistance.8–10 In addition, Lee et al reported that the prevalence of NAFLD significantly increased with an increase in the TyG index, and the TyG index was superior to homeostasis model assessment of insulin resistance (HOMA-IR) in predicting NAFLD in Korean adults.11 The TyG index was also found to be a risk factor for MAFLD. A meta-analysis conducted by Wang et al demonstrated that the TyG index can diagnose and predict MAFLD patients with good accuracy,12 and combining BMI, ALT, and TyG showed high diagnostic efficiency for MAFLD.13 Previous studies have reported an association between the TyG index and vitamin D deficiency in patients with type 2 diabetes mellitus (T2DM) and suggested that a higher TyG index is linked to an increased risk of vitamin D deficiency.14,15 However, there have been no reports on the relationship between TyG index and vitamin D status in MAFLD patients. In view of the close link between MAFLD and insulin resistance, the aim of this study was to investigate the relationship between TyG index and vitamin D deficiency in patients with MAFLD.
Materials and Methods
Study Population
This retrospective cross-sectional study was conducted at the Department of Gastroenterology, Hankou Hospital of Wuhan from January 2021 to October 2022. At first, 804 participants who met the diagnostic criteria for MAFLD were selected. MAFLD was defined as the presence of fatty liver by abdominal ultrasonography, in addition to one of the following three criteria: namely overweight/obesity, presence of type 2 diabetes mellitus, or evidence of metabolic dysregulation.3 The exclusion criteria were as follows: (1) liver cirrhosis or tumours; (2) active viral hepatitis, drug-induced liver injury, autoimmune liver disease, or Wilson disease; (3) renal failure; (4) parathyroid diseases; (5) receiving vitamin D supplementation or administering medication that affects vitamin D metabolism. Overall, 31 participants who had missing information of key parameters were excluded. Finally, 566 participants were involved in our study (Figure 1). The study protocol was approved by the Ethics Committee of Hankou Hospital of Wuhan (approval number: 2020-HKYY017) and was conducted in accordance with the Declaration of Helsinki. Written informed consent was obtained for all participants prior to study commencement. All subjects’ private information is protected.
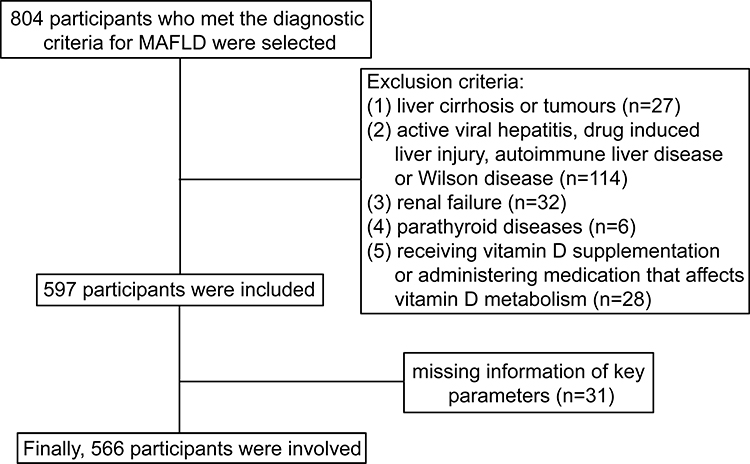 |
Figure 1 Flow chart of the participants selection. |
Data Collection and Laboratory Tests
At enrolment, the following data were collected from all participants: age, gender, body height and weight, medical history, and history of medication. Body mass index (BMI) was calculated as the body weight divided by the square of the body height. Hypertension was defined as repeated measurements of systolic blood pressure ≥140 mmHg and/or diastolic blood pressure ≥90 mmHg. Diabetes mellitus was diagnosed based on WHO criteria for diabetes in 1999. Blood samples were collected after overnight fasting for the following determinations: alanine transaminase (ALT), aspartate aminotransferase (AST), alkaline phosphatase (ALP), γ-glutamyl transferase (GGT), blood urea nitrogen (BUN), serum creatinine (SCr), serum uric acid (SUA), fasting plasma glucose (FPG), total cholesterol (TC), triglyceride (TG), high-density lipoprotein cholesterol (HDL-c), low-density lipoprotein cholesterol (LDL-c), C-reactive protein (CRP), and 25-hydroxyvitamin D [25(OH)D]. Vitamin D deficiency was defined as the serum 25(OH)D level <20 ng/mL, and the level of 25(OH)D ≥20 ng/mL was categorised as non-vitamin D deficiency.16 The TyG index was calculated as ln[fasting TG (mg/dL)×FPG (mg/dL)/2].8 The hepatic steatosis index (HSI) is used for the detection of hepatic steatosis.17
Statistical Analysis
All data were analyzed using SPSS (version 22.0) and GraphPad Prism (version 8.0). Shapiro–Wilk normality tests were performed on continuous variables. The data that were normally distributed were expressed as the mean ± standard deviation (SD), and non-normally distributed data were expressed as median and interquartile range (IQR). Categorical variables were expressed as frequencies and percentages. The Student’s t-test or Mann–Whitney U-test was used to compare the differences between vitamin D deficiency group and non-vitamin D deficiency group. The categorical variables were compared using Chi-square test. Chi-square test for linear trend test was used to assess the linear correlation between vitamin D deficiency prevalence and TyG index quartiles. Spearman correlation analysis was employed to evaluate the correlations between 25(OH)D level and other clinical parameters. A binary logistic regression analysis was performed to investigate the associations between TyG index and risk of vitamin D deficiency. The results were expressed as Odds ratios (OR) and 95% confidence intervals (CI). The diagnostic efficacy of TyG index for vitamin D deficiency in patients with MAFLD was assessed using the receiver operating characteristic (ROC) curves. Statistical significance was defined as a two-tailed p value less than 0.05.
Results
Clinical Characteristics of MAFLD Patients with Different Vitamin D Statuses
A total of 566 participants were included in this analysis. There were 237 (41.87%) women and 329 (58.13%) men, and the interquartile range (25%–75%) of age was 42–60 years (median 52 years). Of these, 366 (64.66%) participants were identified as having vitamin D deficiency according to serum 25(OH)D levels. Clinical characteristics of MAFLD patients with and without vitamin D deficiency are shown in Table 1. There was no significant difference in age, gender, hypertension prevalence, ALT, AST, ALP, BUN, SCr, SUA, TC, LDL-c, CRP, and HSI between the two groups (all p > 0.05). The levels of TyG index, diabetes mellitus prevalence, BMI, GGT, FPG, and TG in MAFLD patients with vitamin D deficiency were significantly higher than in those without vitamin D deficiency (all p < 0.05), whereas the HDL-c levels were significantly lower (p < 0.05).
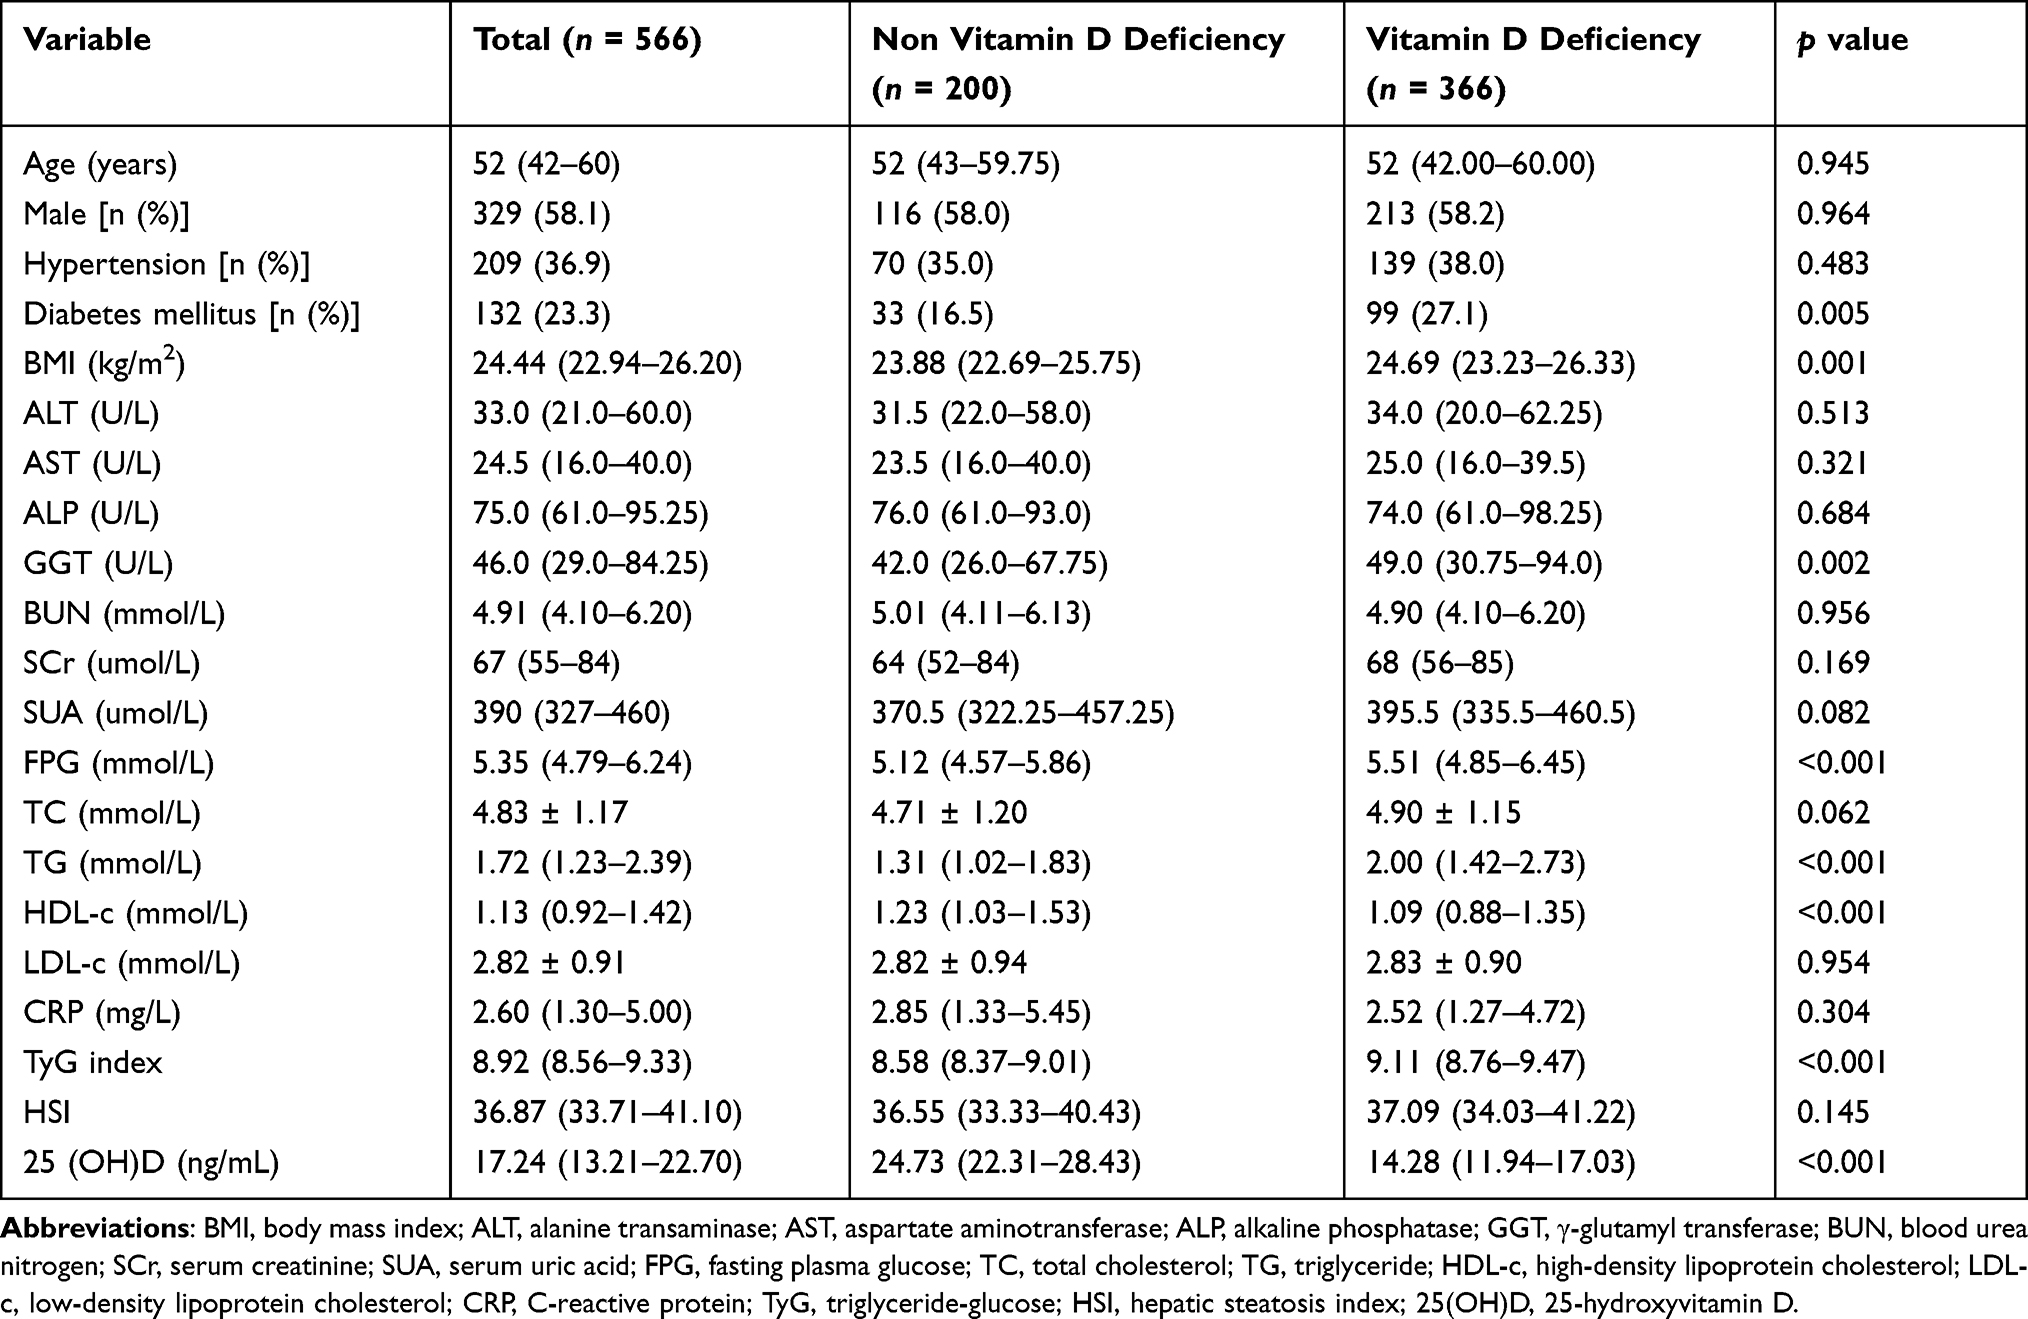 |
Table 1 Clinical Characteristics of MAFLD Patients with Different Vitamin D Statuses |
Comparisons of Vitamin D Deficiency Prevalence in Different TyG Index Quartiles
All subjects were divided into four groups defined by quartiles of the TyG index (Q1: TyG ≤ 8.562, Q2: 8.562 < TyG ≤ 8.917, Q3: 8.917 < TyG ≤ 9.328, Q4: TyG > 9.328). The prevalence of vitamin D deficiency showed a significant increasing trend from the bottom quartile to the top quartile of TyG index, with proportions in the Q1, Q2, Q3, and Q4 groups of 30.99%, 68.09%, 73.24%, and 86.52%, respectively (p for trend <0.001, Figure 2).
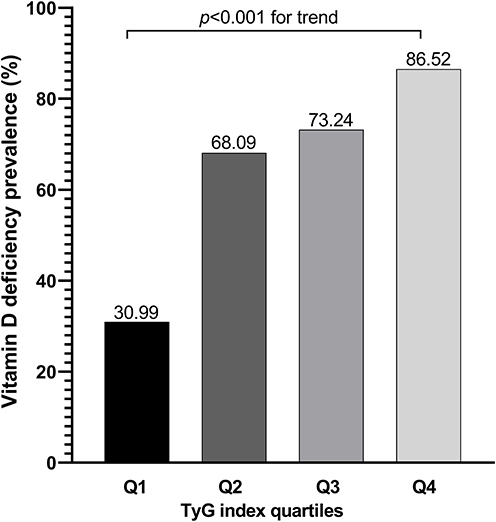 |
Figure 2 Comparisons of vitamin D deficiency prevalence in different TyG index quartiles. |
Correlation of Serum 25(OH)D with Other Clinical Parameters
Seen in Figure 3, Spearman correlation analysis revealed that the serum 25(OH)D level was negatively correlated with BMI (r = −0.113, p=0.007), GGT (r = −0.165, p<0.001), FPG (r = −0.211, p<0.001), TC (r = −0.102, p=0.015), TG (r = −0.375, p<0.001), TyG index (r = −0.434, p<0.001) in all patients with MAFLD, but positively correlated with HDL-c (r = 0.221, p<0.001). But, there was no correlation between 25(OH)D and HSI (r = −0.027, p=0.522).
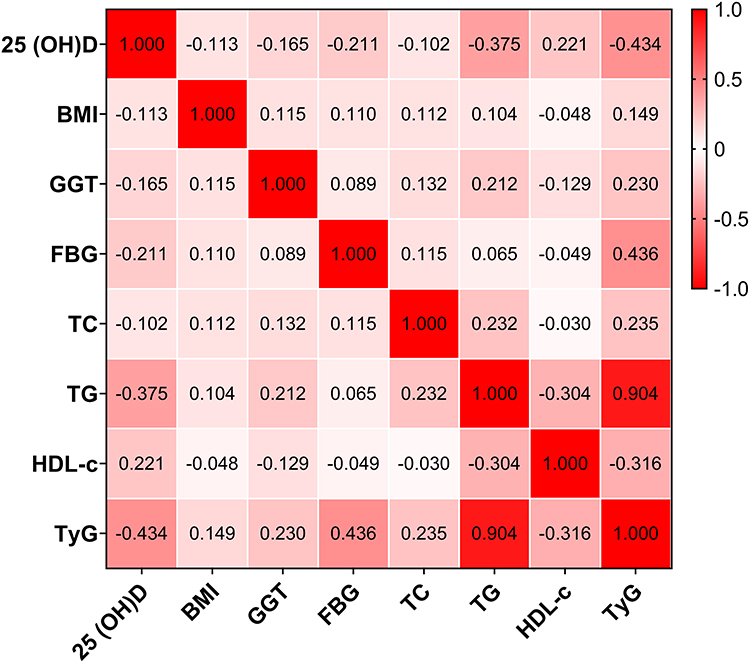 |
Figure 3 Spearman correlation analysis of serum 25(OH)D with other clinical parameters. |
The Association Between TyG Index and Vitamin D Deficiency in Subgroups
The univariable logistic analysis showed that TyG index were associated with vitamin D deficiency in all subjects with MAFLD [OR (95% CI): 4.583 (3.164–6.638), p<0.001]. As shown in Figure 4, similar results were found after stratifying the study population by gender (male or female), BMI (high or normal), and diabetes mellitus status (with or without) (all p<0.05). However, TyG index was only associated with vitamin D deficiency in subjects aged <65 years [OR (95% CI): 5.622 (3.675–8.600), p<0.001] but not in those aged ≥65 years (p>0.05).
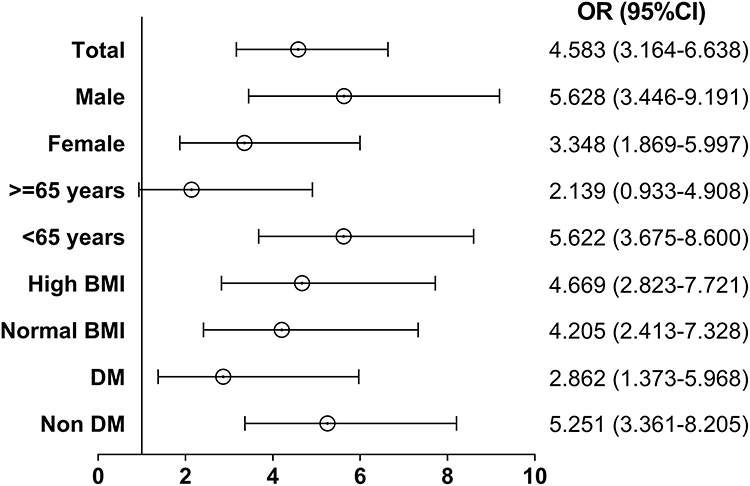 |
Figure 4 The association between the TyG index and vitamin D deficiency in subgroups analysis. |
Multivariable Analysis of the Association Between TyG Index and Vitamin D Deficiency
The binary logistic regression models were performed to assess the association between TyG index quartiles and risk of vitamin D deficiency (Table 2). Taking the lowest quartile of TyG index as a reference, the OR value was increased from the second to the fourth quartile of TyG index [Q2: 4.752 (2.877–7.849), Q3: 6.096 (3.645–10.195), Q4: 14.301 (7.848–26.063), p<0.001 for trend]. The confounding factors that were found to be statistically significant in the univariate analysis were then entered into the logistic regression model. There was a slight increase in the risk of vitamin D deficiency after adjustment for age and gender in Model 1 [Q2: 4.848 (2.926–8.035), Q3: 6.149 (3.670–10.302), Q4: 15.087 (8.209–27.731), p<0.001 for trend]. After further adjustment for BMI, diabetes mellitus status, and HSI (Model 2) and GGT, FPG, TG, HDL-c (Model 3), the multivariable binary logistic regression models showed that increased TyG index was an independent risk factor for vitamin D deficiency in subjects with MAFLD (all p<0.001 for trend).
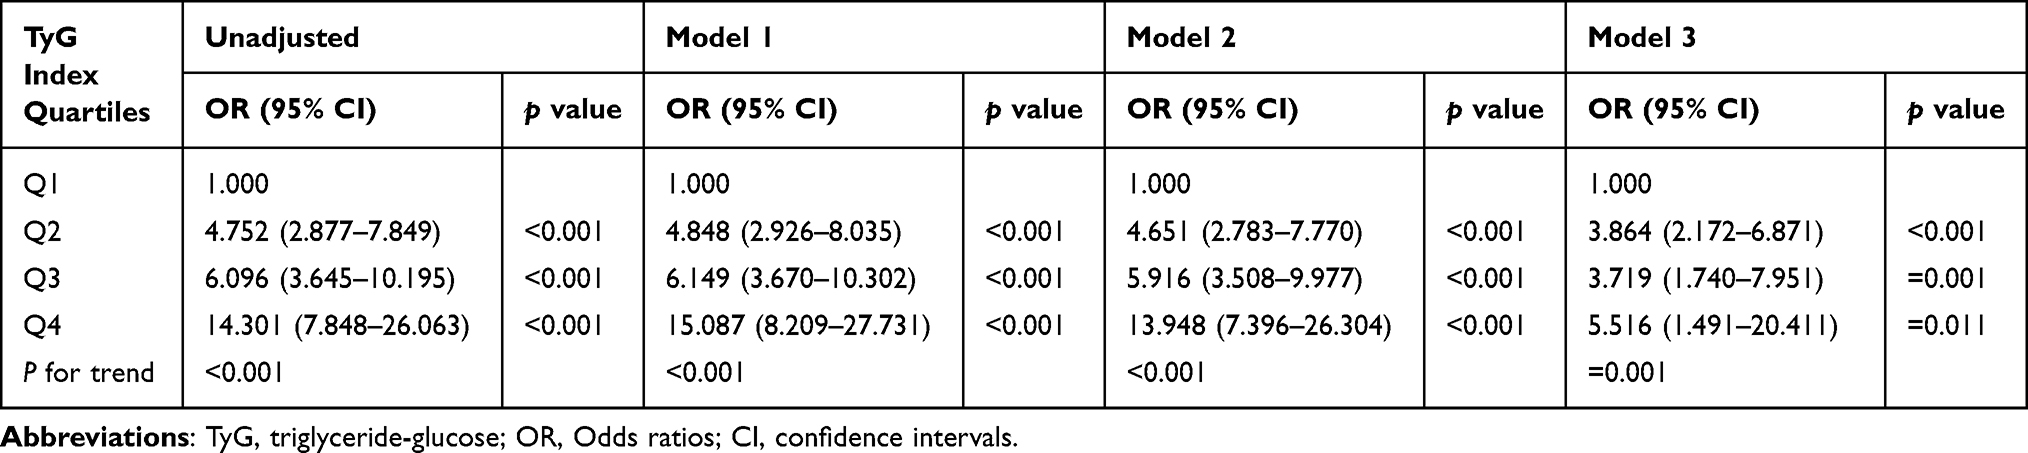 |
Table 2 Logistic Regression Analysis of the Association Between TyG Index and Vitamin D Deficiency |
The Diagnostic Value of TyG Index for Vitamin D Deficiency in Patients with MAFLD
Figure 5 presents the results of the ROC curve analysis of TyG index for the predicting vitamin D deficiency in MAFLD patients. With high sensitivity (76.5%) and specificity (64.5%), the area under the curve (AUC) for the TyG index was 0.744 (95% CI: 0.701–0.787, p<0.001). The cut-off value of the TyG index for the identification of vitamin D deficiency was 8.750, and the maximum Youden’s index was 0.410.
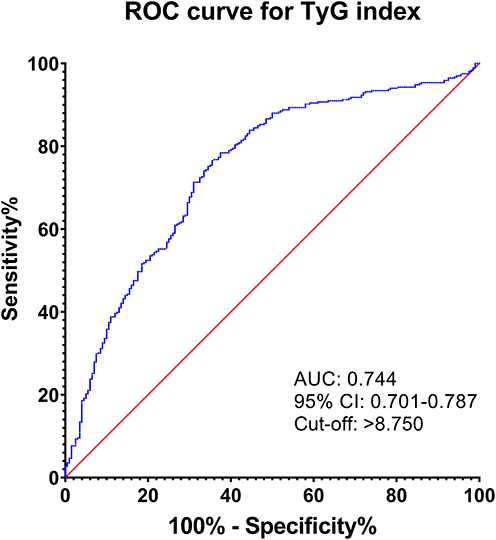 |
Figure 5 ROC curve analysis of TyG index for diagnosing vitamin D deficiency in MAFLD patients. |
Discussion
In the present cross-sectional study, we found that the levels of TyG index were significantly higher in subjects with vitamin D deficiency than in those with non-vitamin D deficiency in MAFLD patients. The prevalence of vitamin D deficiency showed a significant increasing trend from the bottom quartile to the top quartile of the TyG index. Moreover, the TyG index was demonstrated to be an independent risk factor for vitamin D deficiency by multifactorial logistic regression analysis. In particular, the relationship between the TyG index and vitamin D deficiency was independent of HSI. TyG index can be employed as a predictor for the diagnosis of vitamin D deficiency in MAFLD patients. These results indicate that increased TyG index is closely associated with vitamin D deficiency in patients with MAFLD and is not affected by liver steatosis. To our knowledge, the present study is the first to validate the relationship between TyG index and vitamin D status in MAFLD.
The photoconversion of 7-dehydrocholesterol in the epidermis in response to ultraviolet radiation is the major source of vitamin D in humans. Vitamin D is well known to play a key role in maintaining calcium homeostasis and bone health in the body. As interest in vitamin D increased in past decades, more and more diseases have been found to be linked to the metabolic disorders of vitamin D, such as metabolic bone disease, kidney disease, heart disease, skin disorders (psoriasis and acne), autoimmune diseases (including multiple sclerosis, type 1 diabetes, inflammatory bowel disease, lupus erythematosus, and rheumatoid arthritis), cancer, infectious disease, and hypercalcaemia.18 It is also worth noting that vitamin D deficiency is related to many chronic liver diseases including NAFLD and hepatitis C, and the mechanisms involve regulation of cell proliferation and differentiation, immune modulation, anti-inflammation, and anti-fibrosis.5 A recent study based on the Third National Health and Nutrition Examination Survey (NHANES III) showed that vitamin D level was inversely related to the degree of liver steatosis and fibrosis.19 In contrast, another study based on data obtained from the Sixth Korea National Health and Nutrition Examination Survey (KNHANES VI) suggested that vitamin D insufficiency was not associated with the presence of NAFLD as assessed by hepatic steatosis index (HSI).20 Similar results were reported by Dutra et al.21 We also found that there was no correlation between 25(OH)D and HSI in patients with MAFLD. Although these studies did not find a statistically significant association between vitamin D deficiency and NAFLD, there was consistent evidence of a high proportion of vitamin D deficiency in patients with NAFLD.
The most common indicator of vitamin D status in humans is serum 25(OH)D, which is produced by 25 hydroxylation in the liver and has a half-life of 2–3 weeks.5,16 Similarly, a number of studies have reported that the serum 25(OH)D level was also negatively associated with MAFLD, and a higher prevalence of diabetes and more severe disorders of glucolipid metabolism were accompanied by lower vitamin D levels.7,22 As the definition of MAFLD describes, patients with MAFLD usually have dyslipidaemia, glycaemia, and insulin resistance. A review reported by Szymczak-Pajor et al showed that vitamin D deficiency is associated with the pathogenesis of insulin resistance, and vitamin D is also involved in a large number of cellular processes responsible for the homeostasis of glucose and lipid metabolism via insulin signaling pathway.23 But, there were also a number of studies that suggested contradictory conclusions in the association of vitamin D deficiency with insulin resistance or severity of NAFLD.24 The findings from studies on the effects of vitamin D supplementation in patients with NAFLD were also inconsistent.25 As a result, there is still no conclusive evidence on the causal relationship between vitamin D deficiency and insulin resistance.
The TyG index was first known as a surrogate marker of insulin resistance, and it has recently been found to be relevant for many diseases that tend to be accompanied by disorders of glucose and lipid metabolism.26–29 Previous studies have found that TyG index can be used as a screening indicator for diagnosis of MAFLD and had a high diagnostic efficiency for MAFLD when combined with other risk factors including BMI, ALT, waist circumference, and waist-to-height ratio.13,30,31 In addition, recent studies have shown a negative correlation between TyG index and vitamin D deficiency in patients with T2DM.14,15 Similar findings were found for people with MAFLD in our study. However, these studies also showed inconsistent findings in the subgroup analysis. In contrast to previous studies, the correlation between the TyG index and vitamin D was only present in MAFLD patients under 65 years of age. Moreover, the association was not affected by gender or BMI status in our study. Dhas et al reported that serum 25(OH)D was correlated with TG, FPG, TyG index, and HOMA-IR in T2DM patients of both genders aged 30–50 years.32 A significant inverse association between vitamin D and TyG index, independent of gender, was also found in Indian adolescents by Mustafa et al.33 In light of the differences in the association of TyG index with vitamin D status between T2DM and MAFLD, further large-scale cohort studies to address selection bias are necessary.
As TyG index is derived from a simple formula based on serum TG and FPG levels, our study showed that TyG index was closely related to FPG and lipid profiles, especially strongly positively correlated with TG. Lower vitamin D levels have been found to associate with atherogenic lipid profiles, and vitamin D supplementation can improve glycemic control, reduce the levels of TC, TG, and LDL-c while increasing the levels of HDL-c.34,35 And the underlying mechanism of vitamin D in regulation of lipid metabolism is that 25(OH)D impairs sterol regulatory element-binding proteins (SREBPs) activation by inducing proteolytic processing and ubiquitin-mediated degradation of SREBP cleavage-activating protein (SCAP), thereby maintaining lipid homeostasis.36 In addition, serum vitamin D concentration was also observed to increase with body weight and intrahepatic fat reduction, even though total energy and vitamin D intake were reduced.37 Accordingly, it is reasonable to speculate that there may be a mutual causality between vitamin D deficiency and metabolic disorders.
There are several limitations to this study. First, the present study was unable to evaluate the causal relationship between the TyG index and vitamin D because it is based on a cross-sectional, observational study design. Second, this is a single-centre study and the sample size is small, multi-centre and large-scale studies are needed to validate the conclusions in future. Third, potential confounding factors affecting vitamin D status, including season, outdoor activity, and dietary habits, have not been taken into account.
Conclusion
Overall, the TyG index is negatively associated with vitamin D status in patients with MAFLD, and elevated TyG index is an independent risk factor for vitamin D deficiency. Vitamin D deficiency and metabolic disorders may interact to play a role in the pathophysiology of MAFLD.
Abbreviations
MAFLD, metabolic-associated fatty liver disease; TyG, triglyceride-glucose; 25(OH)D, 25-hydroxyvitamin D; ROC, receiver-operating characteristic curves; AUC, area under the curve; NAFLD, non-alcoholic fatty liver disease; HOMA-IR, homeostasis model assessment of insulin resistance; T2DM, type 2 diabetes mellitus; BMI, body mass index; ALT, alanine transaminase; AST, aspartate aminotransferase; ALP, alkaline phosphatase; GGT, γ-glutamyl transferase; BUN, blood urea nitrogen; SCr, serum creatinine; SUA, serum uric acid; FPG, fasting plasma glucose; TC, total cholesterol; TG, triglyceride; HDL-c, high-density lipoprotein cholesterol; LDL-c, low-density lipoprotein cholesterol; CRP, C-reactive protein; HSI, hepatic steatosis index; OR, Odds ratios; CI, confidence intervals; SREBPs, sterol regulatory element-binding proteins; SCAP, SREBP cleavage-activating protein.
Ethics Approval and Consent to Participate
The study protocol complied with the Declaration of Helsinki and was approved by the ethics review committee of Hankou Hospital of Wuhan (approval number: 2020-HKYY017). Written informed consent was obtained for all participants prior to study commencement. Private information of all subjects is protected, and their rights and health will not be adversely affected.
Author Contributions
All authors made a significant contribution to the work reported, whether that is in the conception, study design, execution, acquisition of data, analysis, and interpretation, or in all these areas; took part in drafting, revising, or critically reviewing the article; gave final approval of the version to be published; have agreed on the journal to which the article has been submitted; and agree to be accountable for all aspects of the work.
Funding
This work was supported by grants from the key project of Wuhan Municipal Health Commission (WX20A08).
Disclosure
The authors report no conflicts of interest in this work.
References
1. Lazarus JV, Mark HE, Anstee QM, et al. NAFLD Consensus Consortium. Advancing the global public health agenda for NAFLD: a consensus statement. Nat Rev Gastroenterol Hepatol. 2022;19(1):60–78. doi:10.1038/s41575-021-00523-4
2. Rinaldi L, Pafundi PC, Galiero R, et al. Mechanisms of non-alcoholic fatty liver disease in the metabolic syndrome. a narrative review. Antioxidants. 2021;10(2):270. doi:10.3390/antiox10020270
3. Eslam M, Newsome PN, Sarin SK, et al. A new definition for metabolic dysfunction-associated fatty liver disease: an international expert consensus statement. J Hepatol. 2020;73(1):202–209. doi:10.1016/j.jhep.2020.03.039
4. Jiang Z, Pu R, Li N, et al. High prevalence of vitamin D deficiency in Asia: a systematic review and meta-analysis. Crit Rev Food Sci Nutr. 2021;16:1–10. doi:10.1080/10408398.2021.1990850
5. Kitson MT, Roberts SK. D-livering the message: the importance of vitamin D status in chronic liver disease. J Hepatol. 2012;57(4):897–909. doi:10.1016/j.jhep.2012.04.033
6. Guo XF, Wang C, Yang T, et al. Vitamin D and non-alcoholic fatty liver disease: a meta-analysis of randomized controlled trials. Food Funct. 2020;11(9):7389–7399. doi:10.1039/d0fo01095b
7. Guan Y, Xu Y, Su H, et al. Effect of serum vitamin D on metabolic associated fatty liver disease: a large population-based study. Scand J Gastroenterol. 2022;57(7):862–871. doi:10.1080/00365521.2022.2039284
8. Simental-Mendía LE, Rodríguez-Morán M, Guerrero-Romero F. The product of fasting glucose and triglycerides as surrogate for identifying insulin resistance in apparently healthy subjects. Metab Syndr Relat Disord. 2008;6(4):299–304. doi:10.1089/met.2008.0034
9. Guerrero-Romero F, Simental-Mendía LE, González-Ortiz M, et al. The product of triglycerides and glucose, a simple measure of insulin sensitivity. Comparison with the euglycemic-hyperinsulinemic clamp. J Clin Endocrinol Metab. 2010;95(7):3347–3351. doi:10.1210/jc.2010-0288
10. Ramdas Nayak VK, Satheesh P, Shenoy MT, Kalra S. Triglyceride Glucose (TyG) Index: a surrogate biomarker of insulin resistance. J Pak Med Assoc. 2022;72(5):986–988. doi:10.47391/JPMA.22-63
11. Lee SB, Kim MK, Kang S, et al. Triglyceride Glucose index is superior to the homeostasis model assessment of insulin resistance for predicting nonalcoholic fatty liver disease in Korean adults. Endocrinol Metab. 2019;34(2):179–186. doi:10.3803/EnM.2019.34.2.179
12. Wang J, Yan S, Cui Y, et al. The Diagnostic and Prognostic Value of the Triglyceride-Glucose Index in Metabolic Dysfunction-Associated Fatty Liver Disease (MAFLD): a Systematic Review and Meta-Analysis. Nutrients. 2022;14(23):4969. doi:10.3390/nu14234969
13. Liu Z, He H, Dai Y, et al. Comparison of the diagnostic value between triglyceride-glucose index and triglyceride to high-density lipoprotein cholesterol ratio in metabolic-associated fatty liver disease patients: a retrospective cross-sectional study. Lipids Health Dis. 2022;21(1):55. doi:10.1186/s12944-022-01661-7
14. Jia Y, Song T, Li Z, Zhou L, Chen S. The Relationship Between Triglyceride Glucose Index and Vitamin D in Type 2 Diabetes Mellitus. Diabetes Metab Syndr Obes. 2022;15:511–525. doi:10.2147/DMSO.S348845
15. Xiang Q, Xu H, Zhan J, et al. Association between the Triglyceride-Glucose Index and Vitamin D Status in Type 2 Diabetes Mellitus. Nutrients. 2023;15(3):639. doi:10.3390/nu15030639
16. Holick MF, Binkley NC, Bischoff-Ferrari HA, et al.; Endocrine Society. Evaluation, treatment, and prevention of vitamin D deficiency: an Endocrine Society clinical practice guideline. J Clin Endocrinol Metab. 2011;96(7):1911–1930. doi:10.1210/jc.2011-0385
17. Lee JH, Kim D, Kim HJ, et al. Hepatic steatosis index: a simple screening tool reflecting nonalcoholic fatty liver disease. Dig Liver Dis. 2010;42(7):503–508. doi:10.1016/j.dld.2009.08.002
18. Plum LA, DeLuca HF. Vitamin D, disease and therapeutic opportunities. Nat Rev Drug Discov. 2010;9(12):941–955. doi:10.1038/nrd3318
19. Kim HS, Rotundo L, Kothari N, Kim SH, Pyrsopoulos N. Vitamin D Is Associated with Severity and Mortality of Non-alcoholic Fatty Liver Disease: a US Population-based Study. J Clin Transl Hepatol. 2017;5(3):185–192. doi:10.14218/JCTH.2017.00025
20. Ha Y, Hwang SG, Rim KS. The Association between Vitamin D Insufficiency and Nonalcoholic Fatty Liver Disease: a Population-Based Study. Nutrients. 2017;9(8):806. doi:10.3390/nu9080806
21. Dutra JDM, Lisboa QC, Ferolla SM, et al. Vitamin D levels are not associated with non-alcoholic fatty liver disease severity in a Brazilian population. Int J Vitam Nutr Res. 2021;91(5–6):411–418. doi:10.1024/0300-9831/a000667
22. Wan B, Gao Y, Zheng Y, et al. Association between serum 25-hydroxy vitamin D level and metabolic associated fatty liver disease (MAFLD)-a population-based study. Endocr J. 2021;68(6):631–637. doi:10.1507/endocrj.EJ20-0758
23. Szymczak-Pajor I, Drzewoski J, Śliwińska A. The Molecular Mechanisms by Which Vitamin D Prevents Insulin Resistance and Associated Disorders. Int J Mol Sci. 2020;21(18):6644. doi:10.3390/ijms21186644
24. Sangouni AA, Ghavamzadeh S, Jamalzehi A. A narrative review on effects of vitamin D on main risk factors and severity of Non-Alcoholic Fatty Liver Disease. Diabetes Metab Syndr. 2019;13(3):2260–2265. doi:10.1016/j.dsx.2019.05.013
25. Sharifi N, Amani R. Vitamin D supplementation and non-alcoholic fatty liver disease: a critical and systematic review of clinical trials. Crit Rev Food Sci Nutr. 2019;59(4):693–703. doi:10.1080/10408398.2017.1389693
26. Mirshafiei H, Darroudi S, Ghayour-Mobarhan M, et al. Altered triglyceride glucose index and fasted serum triglyceride high-density lipoprotein cholesterol ratio predict incidence of cardiovascular disease in the Mashhad cohort study. Biofactors. 2022;48(3):643–650. doi:10.1002/biof.1816
27. Kim YM, Kim JH, Park JS, et al. Association between triglyceride-glucose index and gastric carcinogenesis: a health checkup cohort study. Gastric Cancer. 2022;25(1):33–41. doi:10.1007/s10120-021-01222-4
28. O’Hagan R, Gonzalez-Cantero A, Patel N, et al. Association of the triglyceride glucose index with insulin resistance and subclinical atherosclerosis in psoriasis: an observational cohort study. J Am Acad Dermatol. 2023;88(5):1131–1134. doi:10.1016/j.jaad.2022.08.027
29. Chen XX, Rastogi D. Triglyceride-Glucose Index: a Potential New Biomarker for Lung Disease Associated with Metabolic Dysregulation. Chest. 2021;160(3):801–802. doi:10.1016/j.chest.2021.04.027
30. Xue Y, Xu J, Li M, Gao Y. Potential screening indicators for early diagnosis of NAFLD/MAFLD and liver fibrosis: triglyceride glucose index-related parameters. Front Endocrinol (Lausanne). 2022;13:951689. doi:10.3389/fendo.2022.951689
31. Taheri E, Pourhoseingholi MA, Moslem A, et al. The triglyceride-glucose index as a clinical useful marker for metabolic associated fatty liver disease (MAFLD): a population-based study among Iranian adults. J Diabetes Metab Disord. 2022;21(1):97–107. doi:10.1007/s40200-021-00941-w
32. Dhas Y, Banerjee J, Damle G, Mishra N. Association of vitamin D deficiency with insulin resistance in middle-aged type 2 diabetics. Clin Chim Acta. 2019;492:95–101. doi:10.1016/j.cca.2019.02.014
33. Mustafa A, Shekhar C. Association between serum 25-hydroxyvitamin-D and Triglycerides-Glucose index among Indian adolescents. BMC Nutr. 2022;8(1):69. doi:10.1186/s40795-022-00568-x
34. Mohamad MI, El-Sherbeny EE, Bekhet MM. The Effect of Vitamin D Supplementation on Glycemic Control and Lipid Profile in Patients with Type 2 Diabetes Mellitus. J Am Coll Nutr. 2016;35(5):399–404. doi:10.1080/07315724.2015.1026427
35. Surdu AM, Pînzariu O, Ciobanu DM, et al. Vitamin D and Its Role in the Lipid Metabolism and the Development of Atherosclerosis. Biomedicines. 2021;9(2):172. doi:10.3390/biomedicines9020172
36. Asano L, Watanabe M, Ryoden Y, et al. Vitamin D Metabolite, 25-Hydroxyvitamin D, Regulates Lipid Metabolism by Inducing Degradation of SREBP/SCAP. Cell Chem Biol. 2017;24(2):207–217. doi:10.1016/j.chembiol.2016.12.017
37. Lee SM, Jun DW, Cho YK, Jang KS. Vitamin D deficiency in non-alcoholic fatty liver disease: the chicken or the egg? Clin Nutr. 2017;36(1):191–197. doi:10.1016/j.clnu.2015.10.017
 © 2023 The Author(s). This work is published and licensed by Dove Medical Press Limited. The
full terms of this license are available at https://www.dovepress.com/terms
and incorporate the Creative Commons Attribution
- Non Commercial (unported, 3.0) License.
By accessing the work you hereby accept the Terms. Non-commercial uses of the work are permitted
without any further permission from Dove Medical Press Limited, provided the work is properly
attributed. For permission for commercial use of this work, please see paragraphs 4.2 and 5 of our Terms.
© 2023 The Author(s). This work is published and licensed by Dove Medical Press Limited. The
full terms of this license are available at https://www.dovepress.com/terms
and incorporate the Creative Commons Attribution
- Non Commercial (unported, 3.0) License.
By accessing the work you hereby accept the Terms. Non-commercial uses of the work are permitted
without any further permission from Dove Medical Press Limited, provided the work is properly
attributed. For permission for commercial use of this work, please see paragraphs 4.2 and 5 of our Terms.
Recommended articles
Triglyceride-Glucose Index is Significantly Associated with the Risk of Hyperuricemia in Patients with Nonalcoholic Fatty Liver Disease
Qi J, Ren X, Hou Y, Zhang Y, Zhang Y, Tan E, Wang L
Diabetes, Metabolic Syndrome and Obesity 2023, 16:1323-1334
Published Date: 8 May 2023
Association of Triglyceride-Glucose Index with the Risk of Hyperhomocysteinemia Among Chinese Male Bus Drivers: A Longitudinal Study
Xiong J, Wu Y, Huang L, Zheng X
International Journal of General Medicine 2023, 16:2857-2866
Published Date: 4 July 2023
Triglyceride-Glucose Index is an Independent Risk Factor for Hepatocellular Carcinoma Development in Patients with HBV-Related Liver Cirrhosis
Yang SH, He YS, Zheng SQ, Zhang XJ, Dai H, Xue Y
Journal of Hepatocellular Carcinoma 2024, 11:737-746
Published Date: 18 April 2024
Predictive Value of the Triglyceride-Glucose Index for Metabolic-Associated Fatty Liver Disease in Individuals with Different Metabolic Obese Phenotypes
Lv D, Wang Z, Liu H, Meng C
Diabetes, Metabolic Syndrome and Obesity 2025, 18:125-133
Published Date: 15 January 2025
Exploring the Association Between Triglyceride-Glucose Indices and Their Derivatives With Obstructive Sleep Apnea: Insights From the National Health and Nutrition Examination Survey
Zhou Y, Xue F
Nature and Science of Sleep 2025, 17:143-155
Published Date: 23 January 2025