Back to Journals » Cancer Management and Research » Volume 14
The Systemic Immune-Inflammation Index is an Independent Predictor of Survival in Breast Cancer Patients
Authors Zhu M, Chen L ![]() , Kong X, Wang X, Li X, Fang Y
, Kong X, Wang X, Li X, Fang Y ![]() , Wang J
, Wang J ![]()
Received 27 October 2021
Accepted for publication 11 January 2022
Published 25 February 2022 Volume 2022:14 Pages 775—820
DOI https://doi.org/10.2147/CMAR.S346406
Checked for plagiarism Yes
Review by Single anonymous peer review
Peer reviewer comments 2
Editor who approved publication: Professor Harikrishna Nakshatri
Mengliu Zhu,1,* Li Chen,1,2,* Xiangyi Kong,1,* Xiangyu Wang,1,* Xingrui Li,2 Yi Fang,1 Jing Wang1
1Department of Breast Surgical Oncology, National Cancer Center/National Clinical Research Center for Cancer/Cancer Hospital, Chinese Academy of Medical Sciences and Peking Union Medical College, Beijing, 100021, People’s Republic of China; 2Department of Thyroid and Breast Surgery, Tongji Hospital, Tongji Medical College of Huazhong University of Science and Technology, Wuhan, Hubei, 430030, People’s Republic of China
*These authors have contributed equally to this work
Correspondence: Jing Wang; Yi Fang, Department of Breast Surgical Oncology, National Cancer Center/National Clinical Research Center for Cancer/Cancer Hospital, Chinese Academy of Medical Sciences and Peking Union Medical College, Beijing, 100021, People’s Republic of China, Email [email protected]; [email protected]
Purpose: The current investigation examines the potential clinical value and prognostic significance of a systemic immune-inflammation index (SII) in patients with breast cancer.
Patients and Methods: A total of 477 individuals underwent neoadjuvant chemotherapy, and 308 individuals did not at our center between January 1998 and December 2016 were selected. An optimized SII threshold was generated using a receiver operating characteristic curve (ROC). The relationship between various factors and breast cancer in predicting disease-free survival (DFS) and overall survival (OS) were analyzed.
Results: The SII < 560 group (Low SII group) and SII ≥ 560 group (High SII group) are divided according to the threshold value. SII was an independent predictor for breast cancer DFS and OS based on univariate and multivariate analyses. Low SII patients had higher mean DFS and OS in contrast to those in the high SII groups (46.65 vs 27.37 months and 69.92 vs 49.53 months). Those in the low SII cohort who also had early or advanced breast cancer, different molecular subtypes, and with or without lymph vessel invasion all had higher mean survival time of DFS and OS in contrast to those with raised SII values (P< 0.05). The mean DFS and OS durations also varied based on different Miller and Payne grades (MPG) (P < 0.005), and different response groups (P< 0.05).
Conclusion: SII can be used as an easily accessible and minimally invasive potential prognostic factor in individuals with breast cancer and may also guide clinicians in treating and prognosticating patients with breast cancer.
Keywords: breast cancer, neoadjuvant chemotherapy, systemic immune-inflammation index, SII, prognosis, inflammation
Introduction
Breast cancer is perhaps the most frequently encountered malignant tumor around the world. Breast cancer significantly impacts patient quality of life while also posing as a major public health problem.1 GLOBOCAN 2018 reports that there are more than 2 million new cases of breast cancer and 600,000 deaths from breast cancer each year. The incidence of breast cancer has been on the rise annually, and the age of onset has been getting progressively younger.2 Data from National Cancer Center shows that there are 545.29 new cases in every 100,000 people in China every year. Breast cancer has been on the rise, especially in the developing coastal cities, with incidences higher amongst the urban compared to the rural populations. It is estimated that there will be as many as 100 new cases of breast cancer in every 100,000 people amongst postmenopausal women in the future.3 Some studies have pointed out that some immunological indicators (such as PD1, PD-L1, etc.) and histopathological indicators (such as ER, PR, HER2, Ki67, etc.) are closely associated with breast cancer prognosis. However, the acquisition of these indicators is costly and takes very long to be processed, thus greatly limiting their application in clinical treatment.4–7 The tumor microenvironment strongly features inflammation, with minor changes in inflammatory cell profiles having the ability to affect tumor development and progression, including the proliferation, invasion, migration and metastasis of tumor cells.8,9 Recent clinical and epidemiological studies have also found that the inflammatory response shares a certain relationship with breast cancer, and may potentially be targeted for tumor treatment or quantified as a prognostic indicator.10,11 Peripheral venous blood parameters, such as platelet (P), monocyte (M), lymphocyte (L), neutrophil (N), and its derivatives in PLR (platelet/lymphocyte ratio), NLR (neutrophil/lymphocyte ratio), MLR (monocyte/lymphocyte ratio), and LMR (lymphocyte/ monocyte ratio) were previously found to be prognostic in breast cancer patients.12–17 Breast cancer is currently diagnosed based on the gold standard of a combination of core needle biopsy (CNB) and pathological examination, assisted by breast imaging techniques of breast ultrasound, mammography, and magnetic resonance (MR). However, relatively speaking, the peripheral blood examination has the characteristics of simplicity, convenience, strong reproducibility, low cost, and better accessibility. Therefore, our study aims to determine and characterize the value of the prognostic factor of components of the peripheral blood count examination that are relevant to breast cancer,
Materials and Methods
Study Population
A total of 477 patients with neoadjuvant chemotherapy (NACT) and 308 patients who did not receive preoperative chemotherapy who were treated between January 1998 and December 2016 were selected. All included patients underwent a routine examination and examination on admission, a comprehensive assessment of their condition, and provided informed signed consent. All patients had a histopathological diagnosis of breast cancer. TNM stage was determined using the 8th edition American Joint Committee on Cancer (AJCC) and the Union for International Cancer Control (UICC).18,19
Inclusion and Exclusion Criteria
The inclusion criterion was as follows: 1) Breast cancer was confirmed by CNB and pathological examination; 2) Zubrod-Ecog-WHO (ZPS) between 0 and 2 and Karnofsky Performance Scores (KPS) ≥80; 3) Expected to survive more than 3 months; 4) Surgically treated; 5) Admission examination showed no obvious abnormalities in liver, kidney, lung, heart, brain, and bone marrow; 6) Inpatient medical records and postoperative follow-up data were complete.
The following was our exclusion criteria: 1) The possibility of distant organ metastasis was not able to be excluded on imaging examinations such as abdominal B-ultrasound, chest Computed Tomography (CT), and breast MRI, or the breast tumor was not able to be resected due to the definite presence of metastasis; 2) Patients who received anti-tumor therapy, such as radiotherapy, chemotherapy, and targeted therapy; 3) The presence of serious comorbidities that were refractory to treatment such as hypertension, heart disease, and diabetes; 4) Advanced breast cancer, including breast cancer ulcers, inflammatory breast cancer, and infected tumors; 5) Blood transfusion history within one month before receiving NACT; 6) Patients who were poorly compliant and not cooperative with treatment.
Chemotherapy Regimen
Patients with neoadjuvant chemotherapy were included with anthracyclines and/or taxanes, such as AC regimen, ACF regimen, CT regimen, ACT regimen, AT regimen, TP regimen.
Peripheral Venous Blood Collection Method
Patients consented to the collection of peripheral venous blood samples, which were collected using a vacuum anticoagulant tube and analyzed by the laboratory of our hospital. The white blood cell, neutrophils, hemoglobin, lymphocytes, monocytes, platelets, and other hematological parameters in the peripheral venous blood were analyzed. The SII was derived using the following formula: (neutrophil count × platelet count)/lymphocyte count.
Evaluation Assays
Tumor size, the depth of invasion, and the extent of lymph node metastasis were determined by breast ultrasound, mammography, and MRI. Tumor size was derived using the largest diameter as the diameter of the tumor. The 8th edition of AJCC and UICC was used to guide TNM staging.18,19 The main pathological types of breast cancer are invasive lobular or ductal carcinomas. Molecular classification of breast cancer commonly used are Luminal A-type, Luminal B HER2-positive type, Luminal B HER2-negative type, HER2 overexpression type, and triple-negative type.20 The Miller and Payne grade (MPG) histological grade was used to evaluate the reduction of tumor cells after neoadjuvant chemotherapy, which was divided into 5 grades.21 The tumor lesions after neoadjuvant chemotherapy treatment were evaluated according to the RECIST criteria that had been published and implemented in 2000.22 The histological classification of breast cancer is based on the Nottingham System (Scarff-Bloom-Richardson grading system by Elston and Ellis).23 Chemotherapy toxicity and adverse reactions were evaluated based on the National Cancer Institute Common Toxicity Criteria (NCI-CTC).24
Follow-Up
Follow-up was performed according to the NCCN (2020) guidelines: all patients were evaluated 3-monthly for the first 1–2 years, 6-monthly for the following 3–5 years, then annually until death. Disease-free survival (DFS) was defined as the duration between the first postoperative day to the detection of tumor recurrence, distant metastasis, or death from other causes. The time from the first day after surgery until the last follow-up or death was defined as Overall Survival (OS).
Statistical Analysis
All statistical analyses were carried out using the SPSS 17.0 (version 17.0; SPSS Inc., Chicago, IL, USA) and GraphPad Prism Software (Version 8.0; GraphPad Inc., La Jolla, CA, USA) program. ROCs were utilized to identify critical optimal threshold values of related variables, and the accuracy of prognosis was evaluated by the area under the curve (AUC). The number of cases (%) was incorporated in describing qualitative data, and the χ2 test or Fisher’s exact test was used for comparison between groups. Overall survival time was evaluated using the Kaplan-Meier assay. The survival rate between various groups was compared using the Log Rank method. Univariate and multivariate Cox Proportional Hazards Regression Models were used to analyze relevant prognostic factors. The relationships between various parameters and breast cancer prognosis were described using hazard ratios (HRs) and 95% confidence intervals (CIs). Statistical significance was determined with a two-tailed P value of less than 0.05.
Results
Demographic and Clinicopathologic Characteristics of All Breast Cancer Patients
The optimal cutoff value of SII was 560 based on ROC curve analysis. All patients were grouped into either the low (< 560) or the high SII group (> 560). All enrolled patients were female who were between 22 to 82 years of age (median age 47 years). BMI ranged from 16.36 to 38.19, with a median BMI of 24. 493 patients were premenopausal patients (62.80%), and 292 patients were postmenopausal (37.20%). ABO blood group distribution showed that there were 214 cases of type A (27.26%), 262 cases of type B (33.38%), 234 cases of type O (29.81%), and 75 cases of type AB (9.55%). 416 cases (52.99%) had left breast cancer, and 369 cases (47.01%) had right breast cancer. All patients received surgical treatment. 606 cases (77.20%) underwent total resection of breast cancer, and 179 cases (22.80%) underwent breast-conserving surgery. Based on the histological classification of breast cancer, there were 133 cases of grade I (16.94%), 431 cases of grade II (54.90%), and 221 cases of grade III (28.15%). Based on clinicopathological stages, there were 92 cases of stage I (11.72%), 382 cases of stage II (48.66%), and 311 cases of stage III (39.62%) prior to treatment. There were 516 cases (65.73%) who received postoperative chemotherapy and 269 cases (34.27%) who did not. There were 483 cases (61.53%) who received endocrine therapy after breast cancer surgery and 302 cases (38.47%) who did not. There were 202 cases (25.73%) who received targeted therapy after breast cancer surgery, while 583 cases (74.27%) did not. The clinical data of 785 breast cancer patients are shown in Table 1.
- In all breast cancer patients, there were 398 cases in the low SII group and 387 cases in the high SII group. Statistical analysis showed that menopausal status (χ2=7.033, P=0.008), clinical T stage (χ2=25.424, P <0.0001), clinical N stage (χ2=22.656, P=0.002), clinical TNM stage (χ2=21.459, P <0.0001), postoperative radiotherapy (χ2=5.820, P=0.016), and postoperative targeted therapy (χ2=10.053, P=0.002) were statistically significant.
- In the NACT group (477 patients), there were 217 cases in the low SII group and 260 cases in the high SII group. Statistical analysis showed that menopausal status (χ2=10.533, P=0.001), clinical T stage (χ2=12.659, P=0.013), clinical TNM stage (χ2=6.364, P=0.042), neoadjuvant chemotherapy regimen (χ2=10.210, P=0.037), pathological N stage (χ2=9.799, P=0.044), pathological TNM stage (χ2=9.882, P=0.043) and postoperative targeted (χ2=5.720, P=0.017) were statistically significant.
- In the non-NACT group (308 breast cancer patients), there were 181 cases in the low SII group and 127 cases in the high SII group. Statistical analysis showed that postoperative chemotherapy (χ2=7.447, P=0.006) and postoperative radiotherapy (χ2=6.793, P=0.009) were statistically significant.
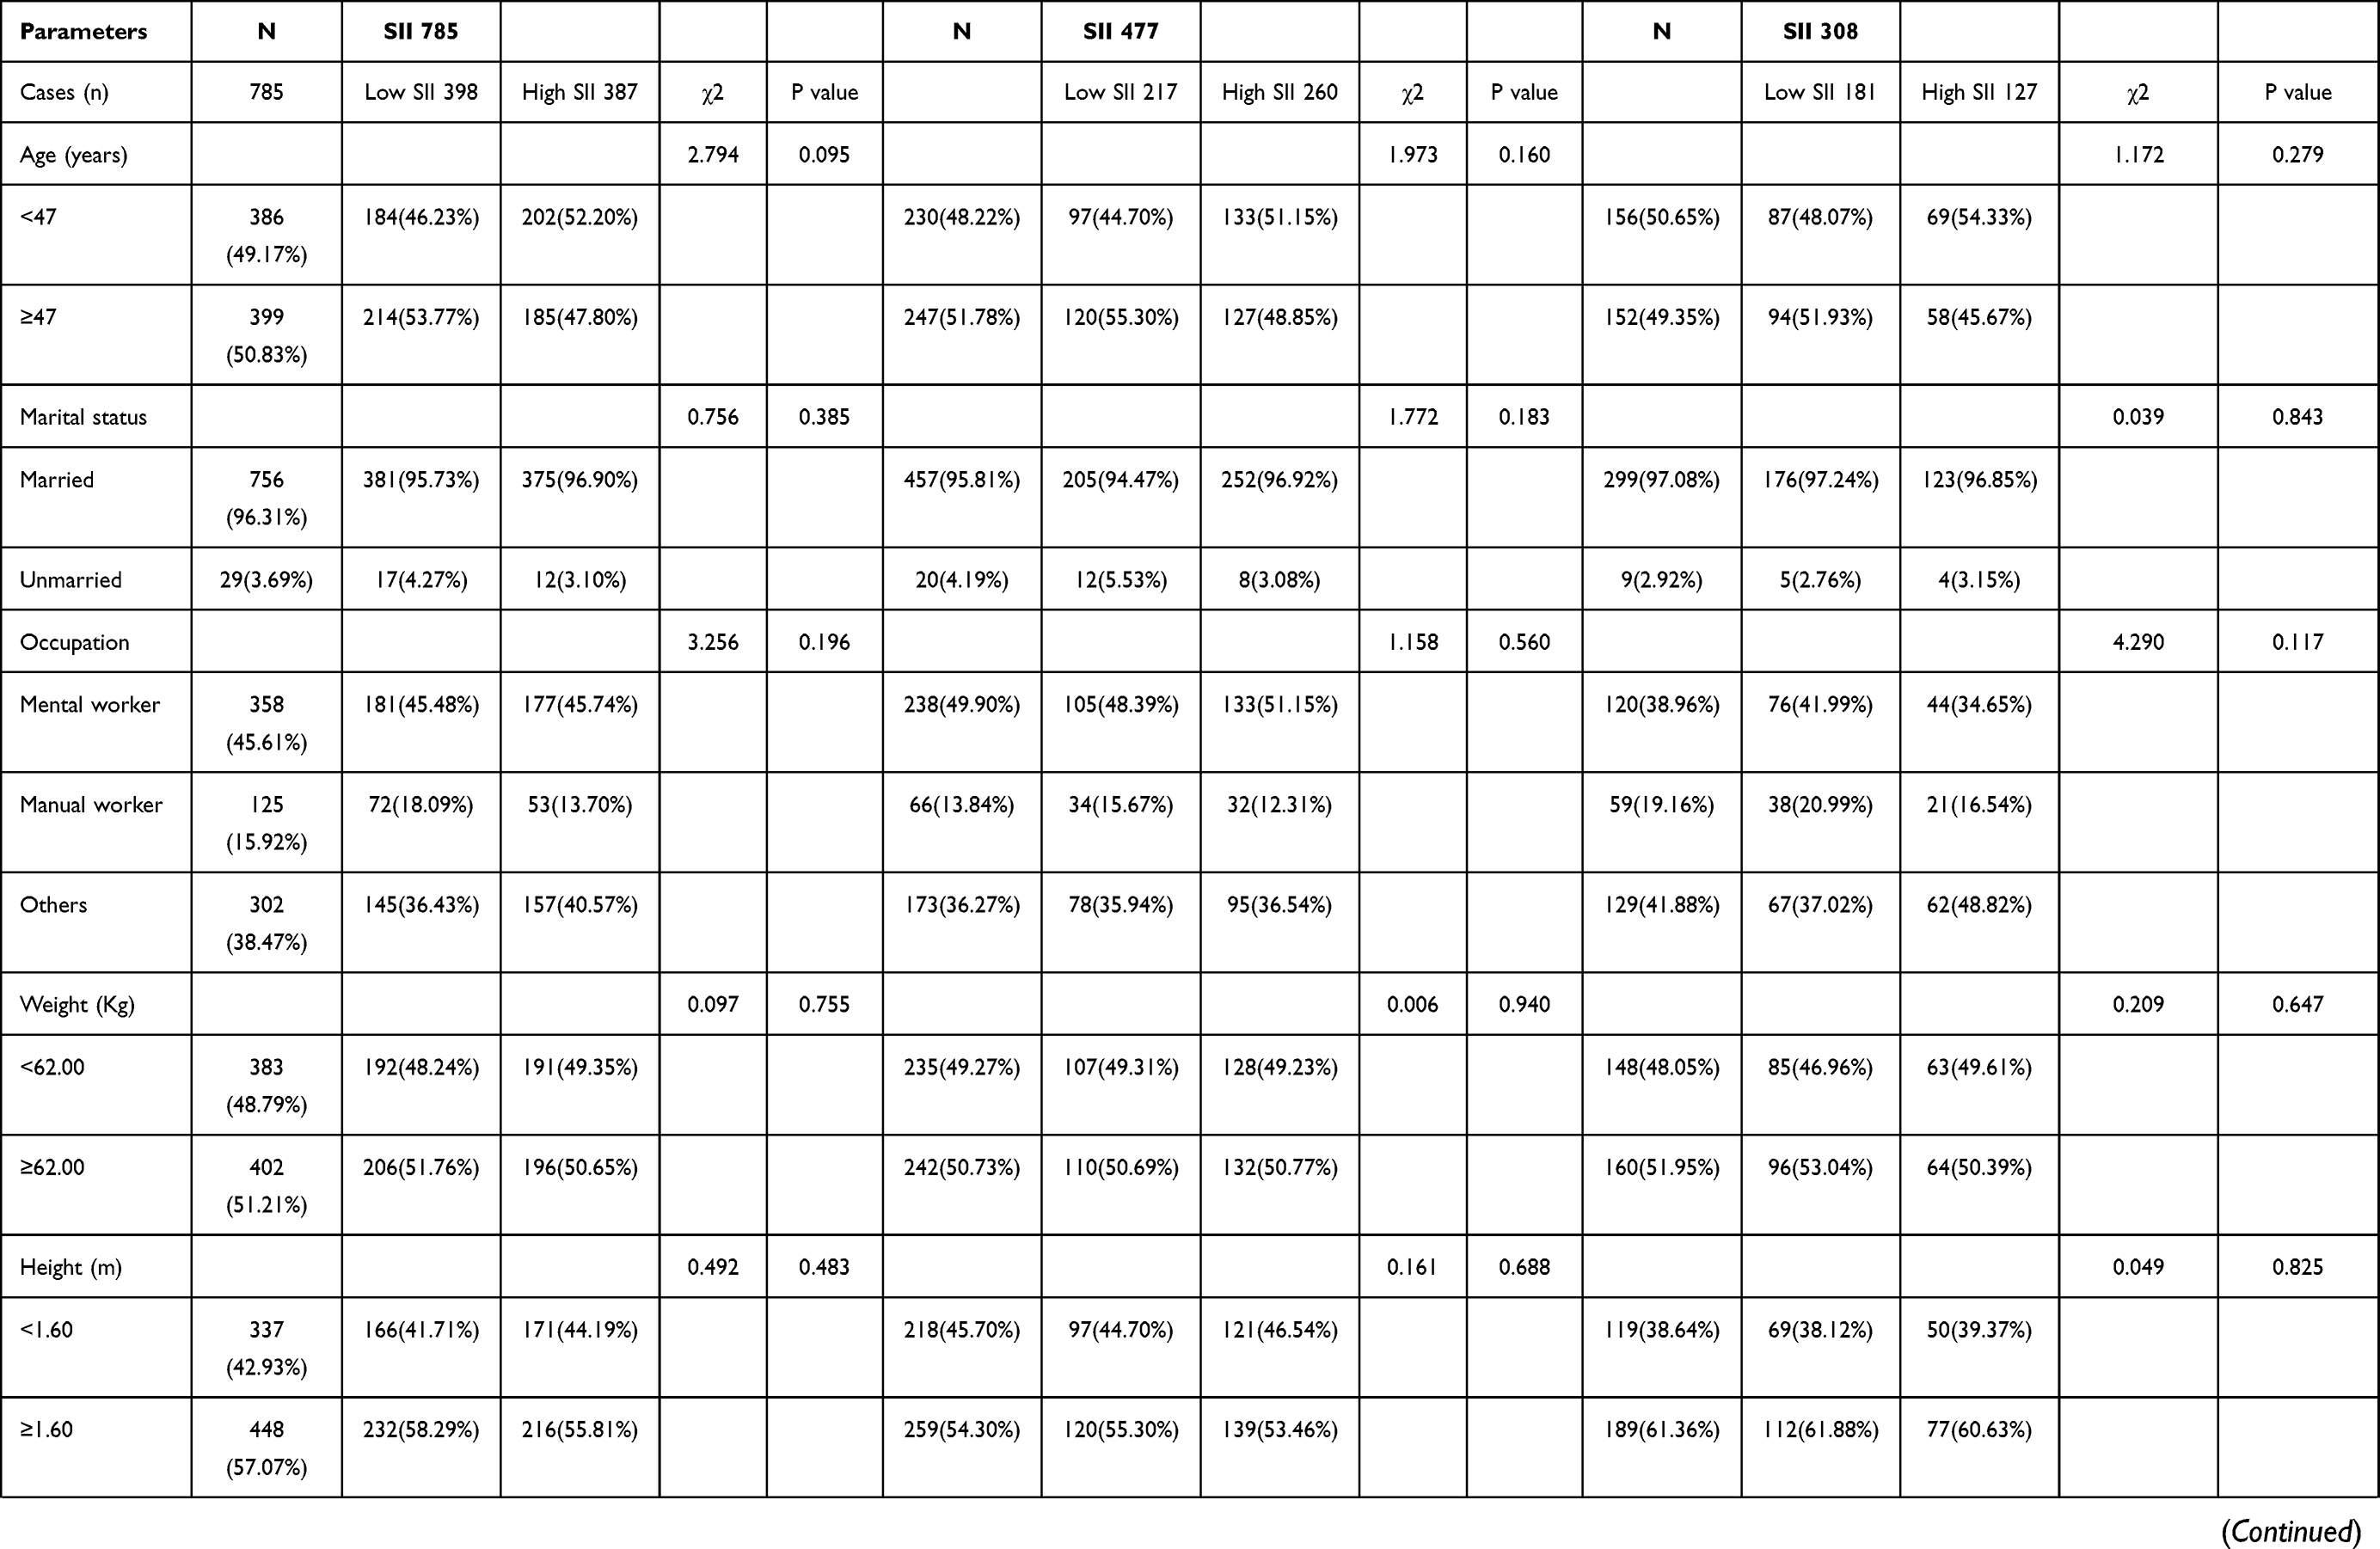 | 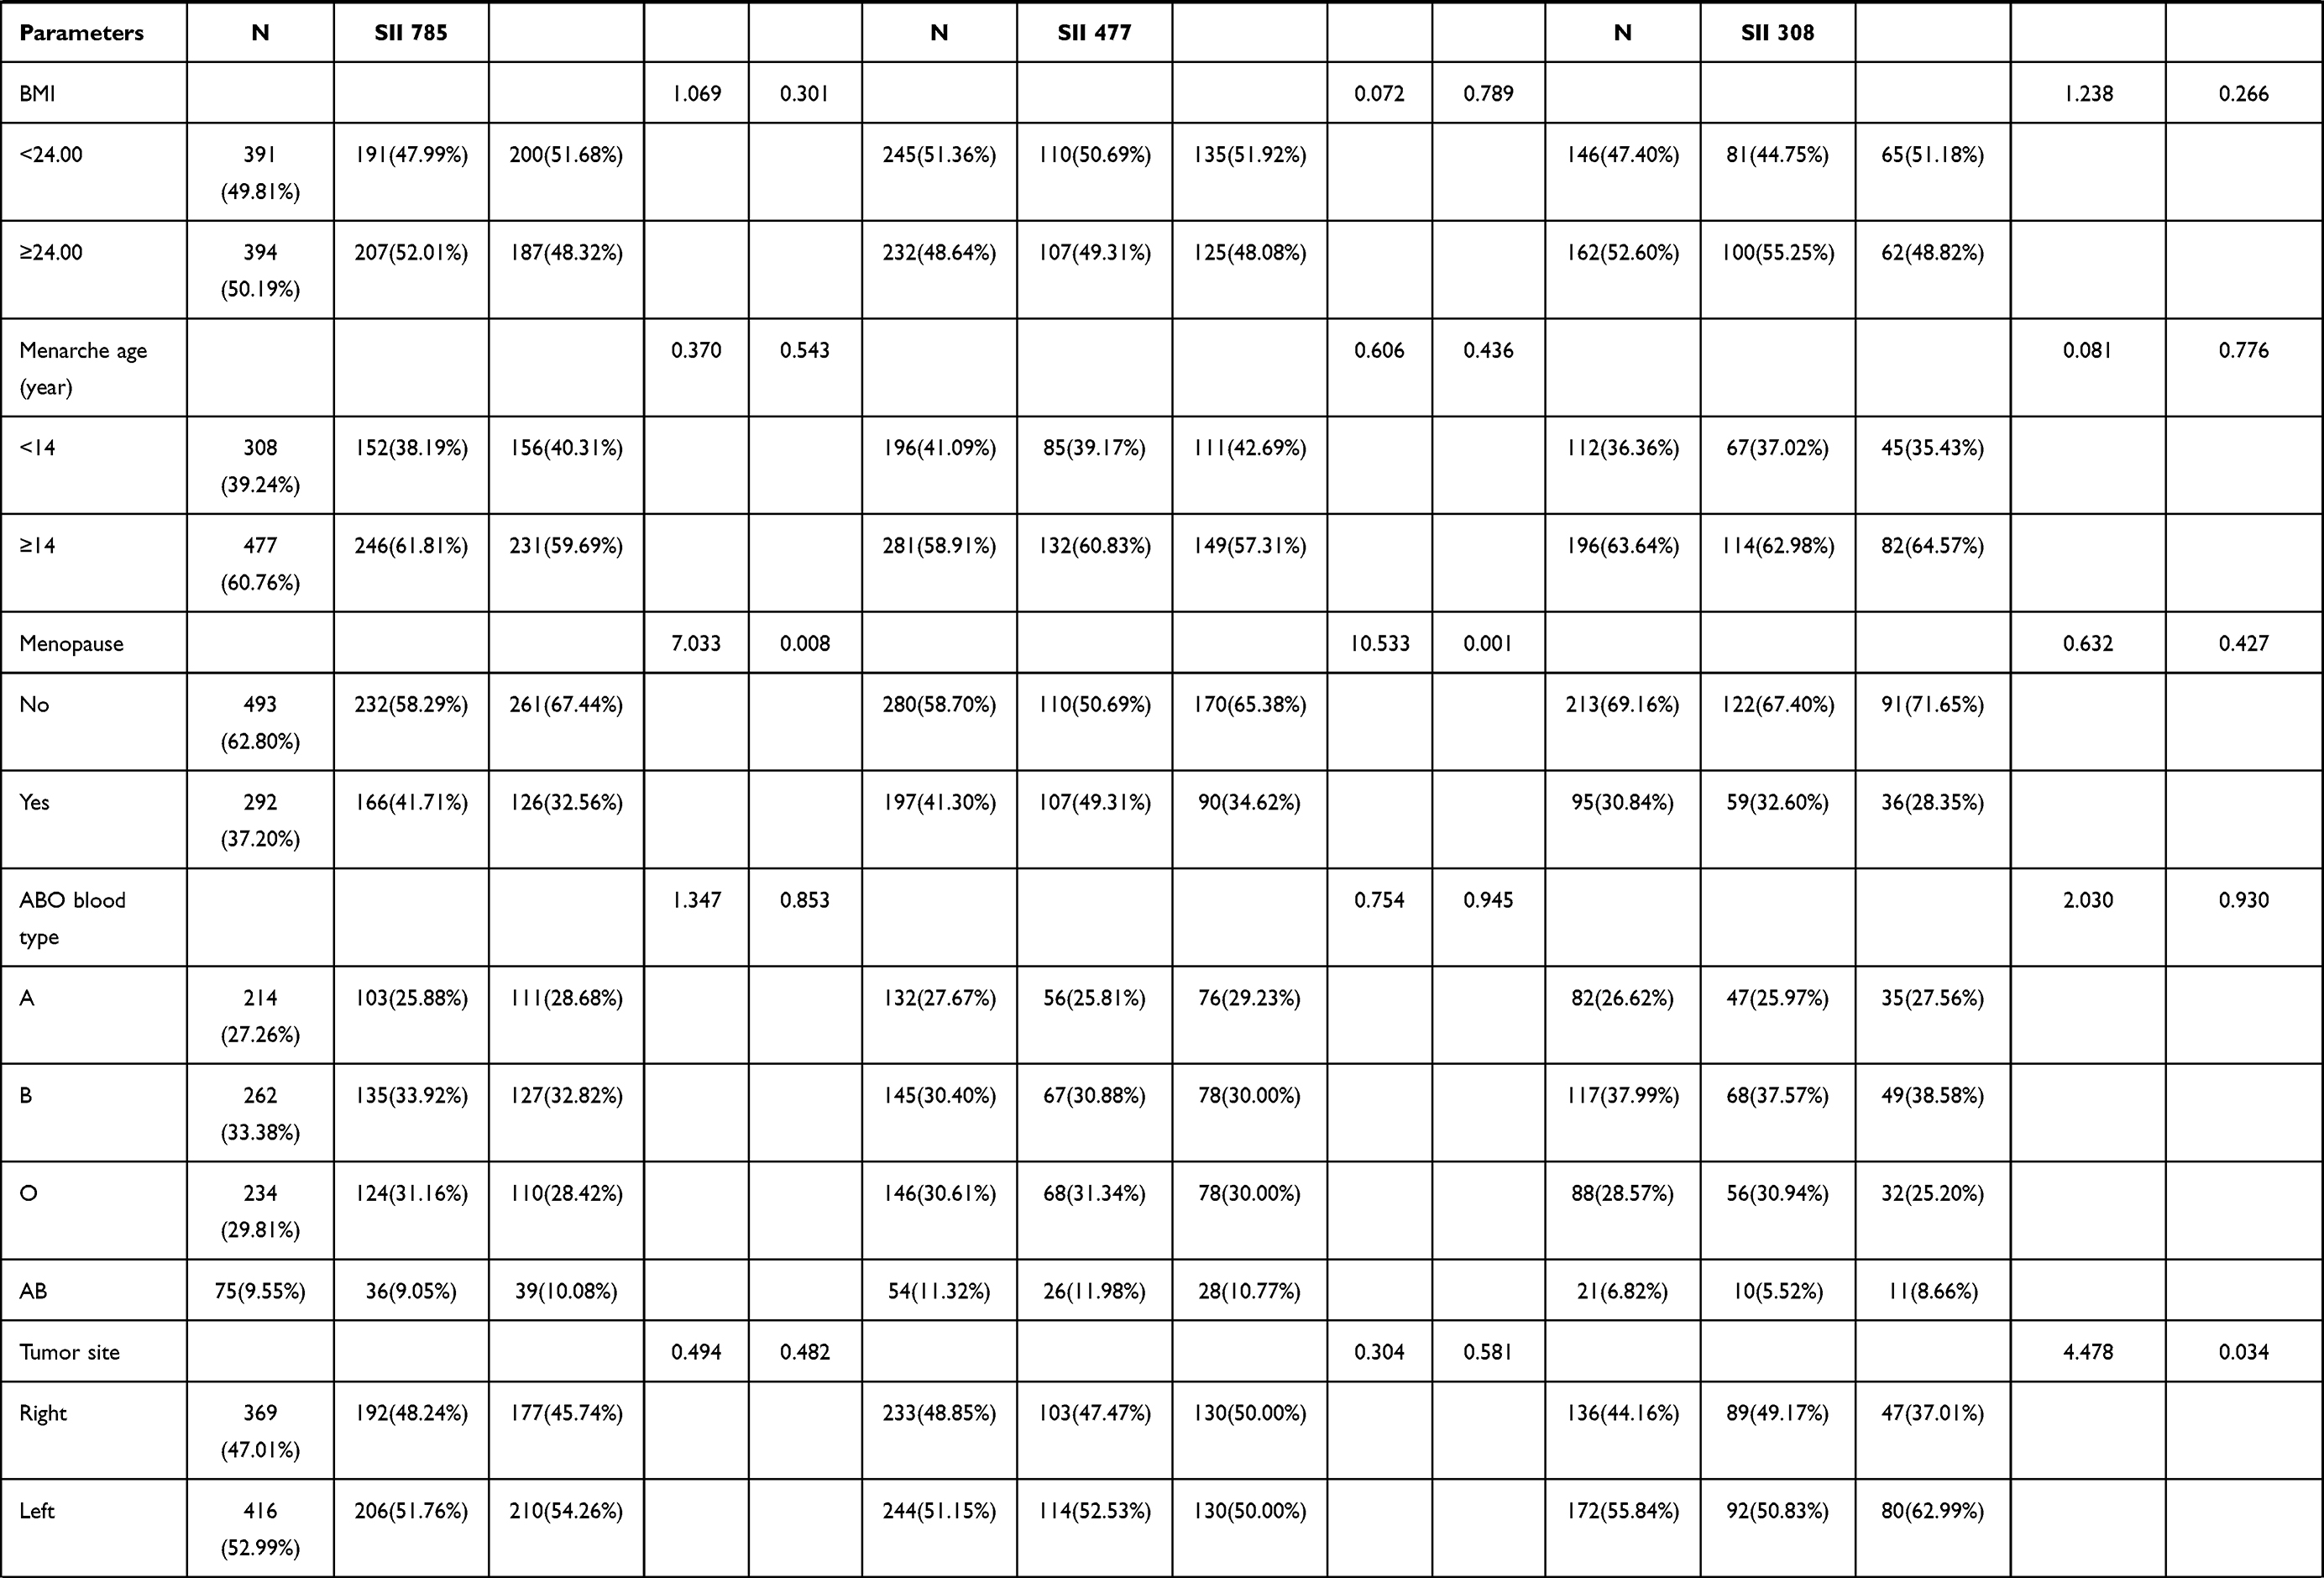 | 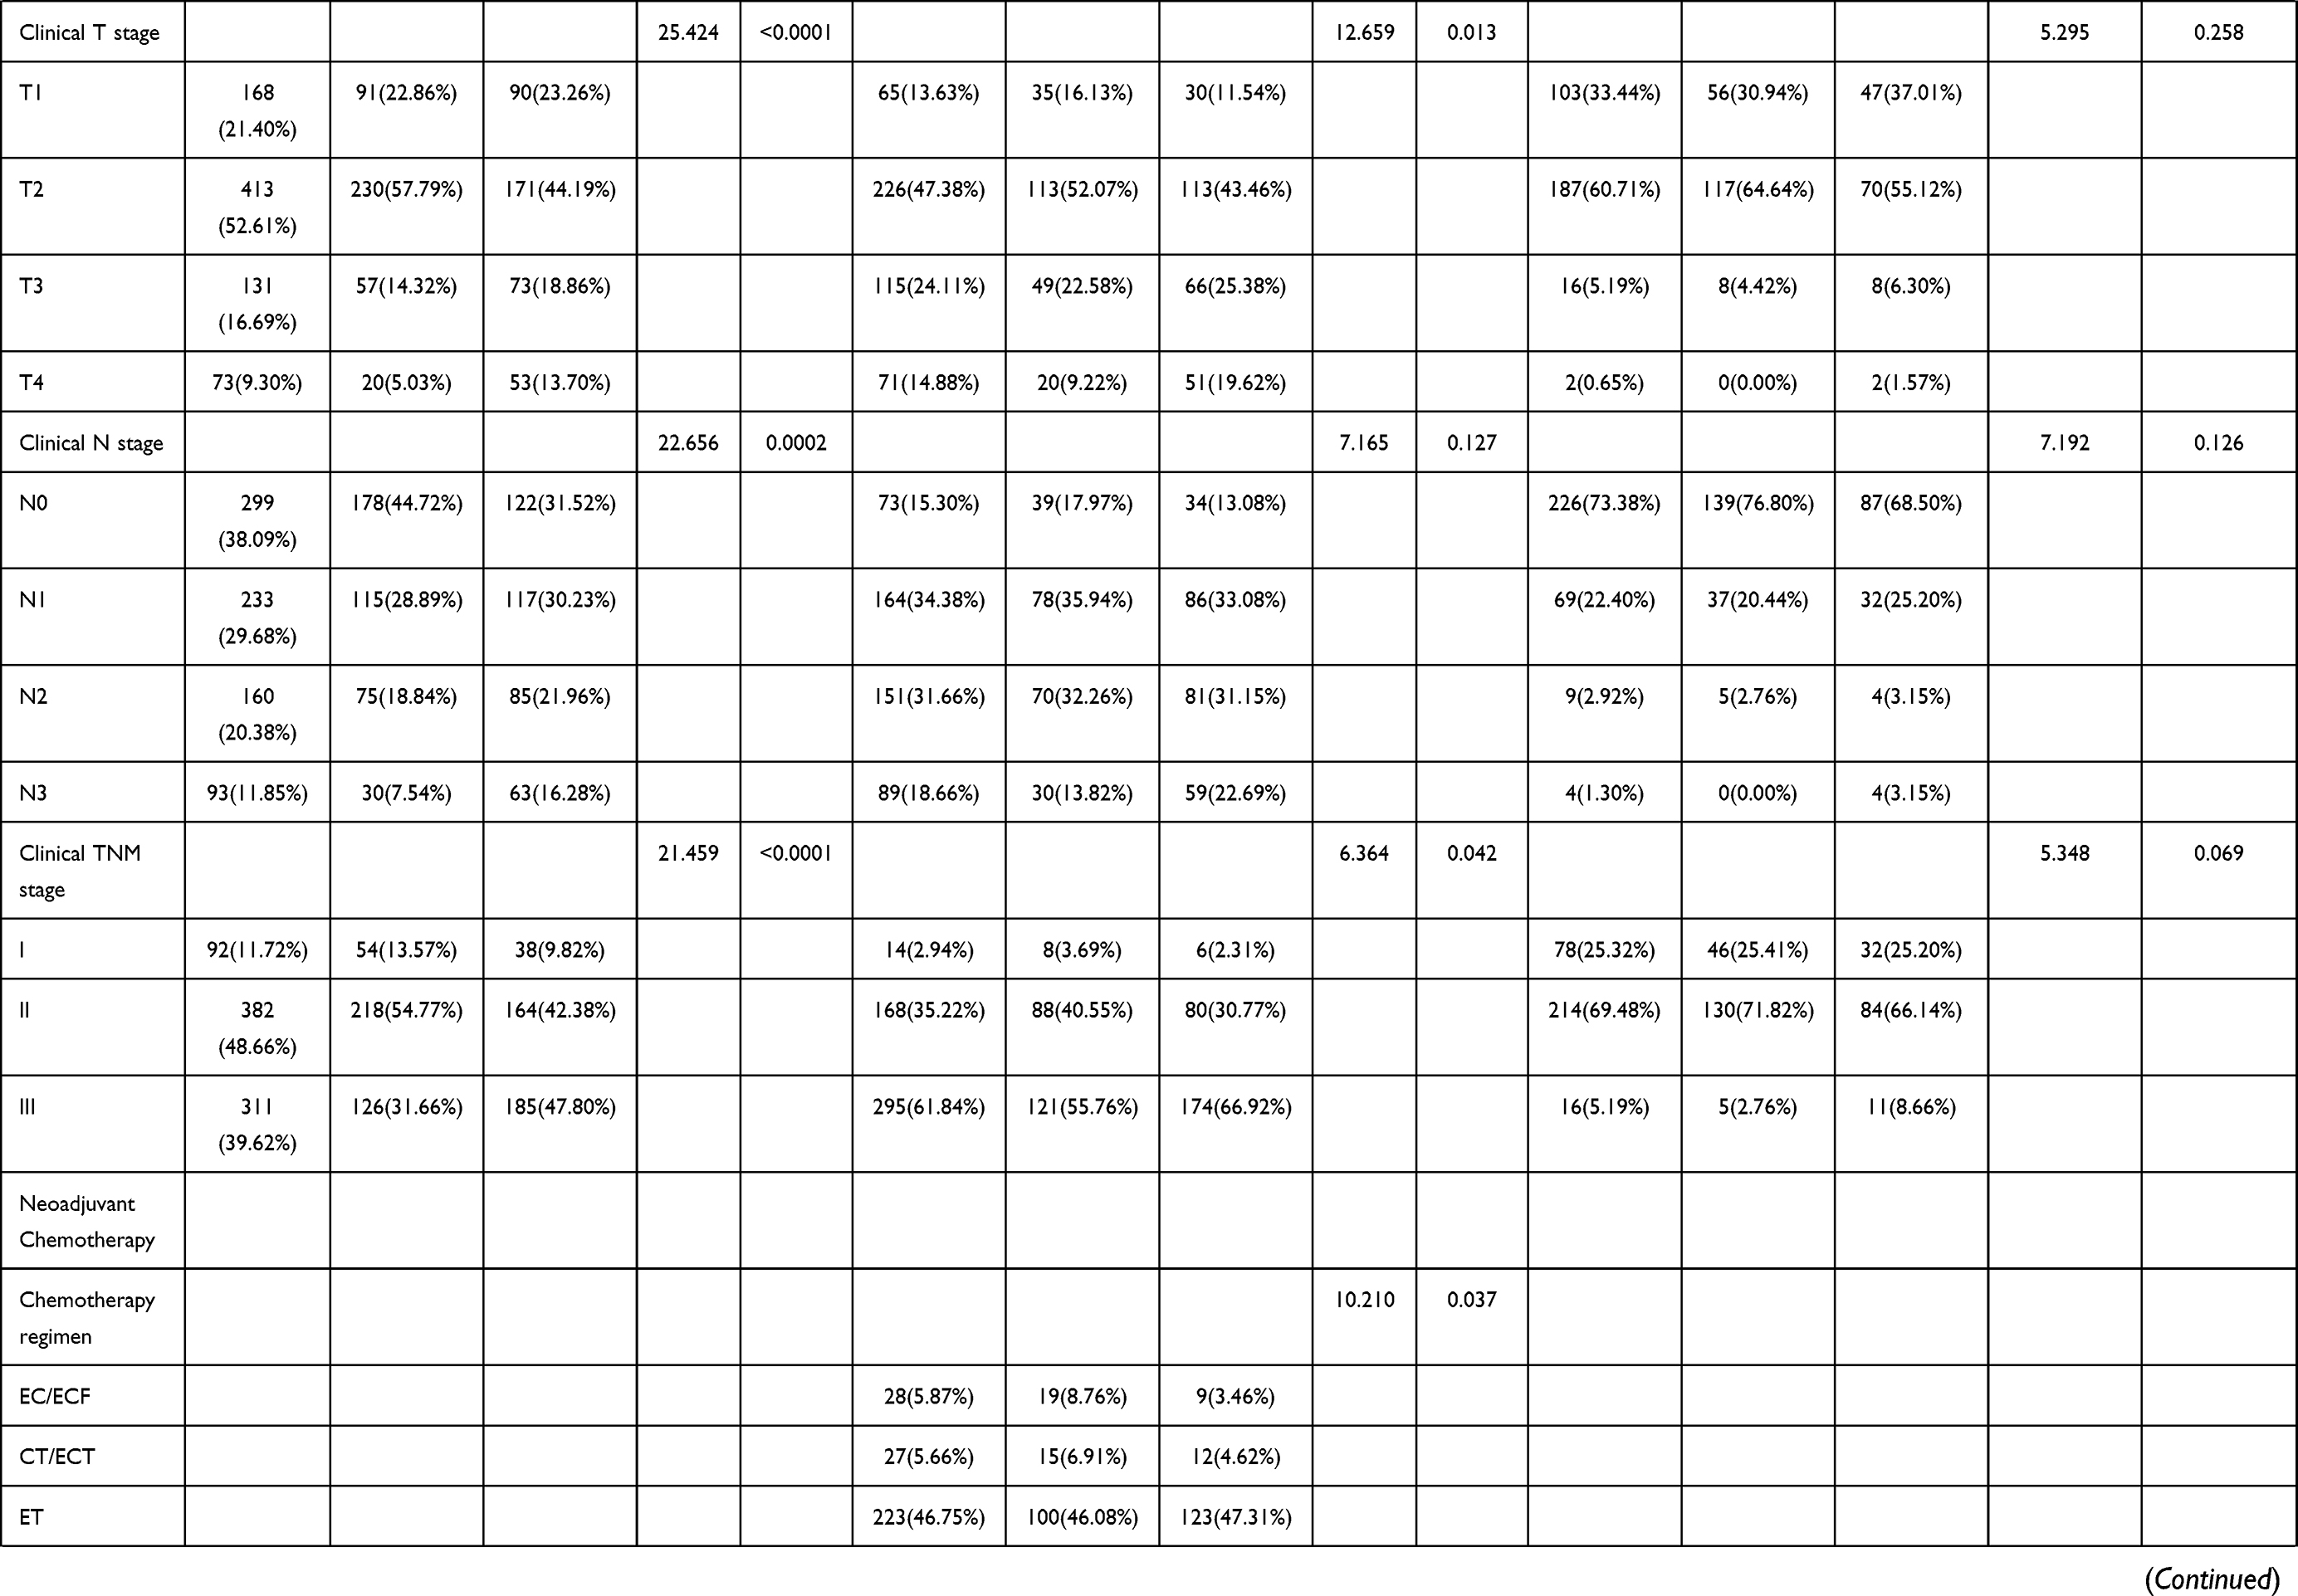 | 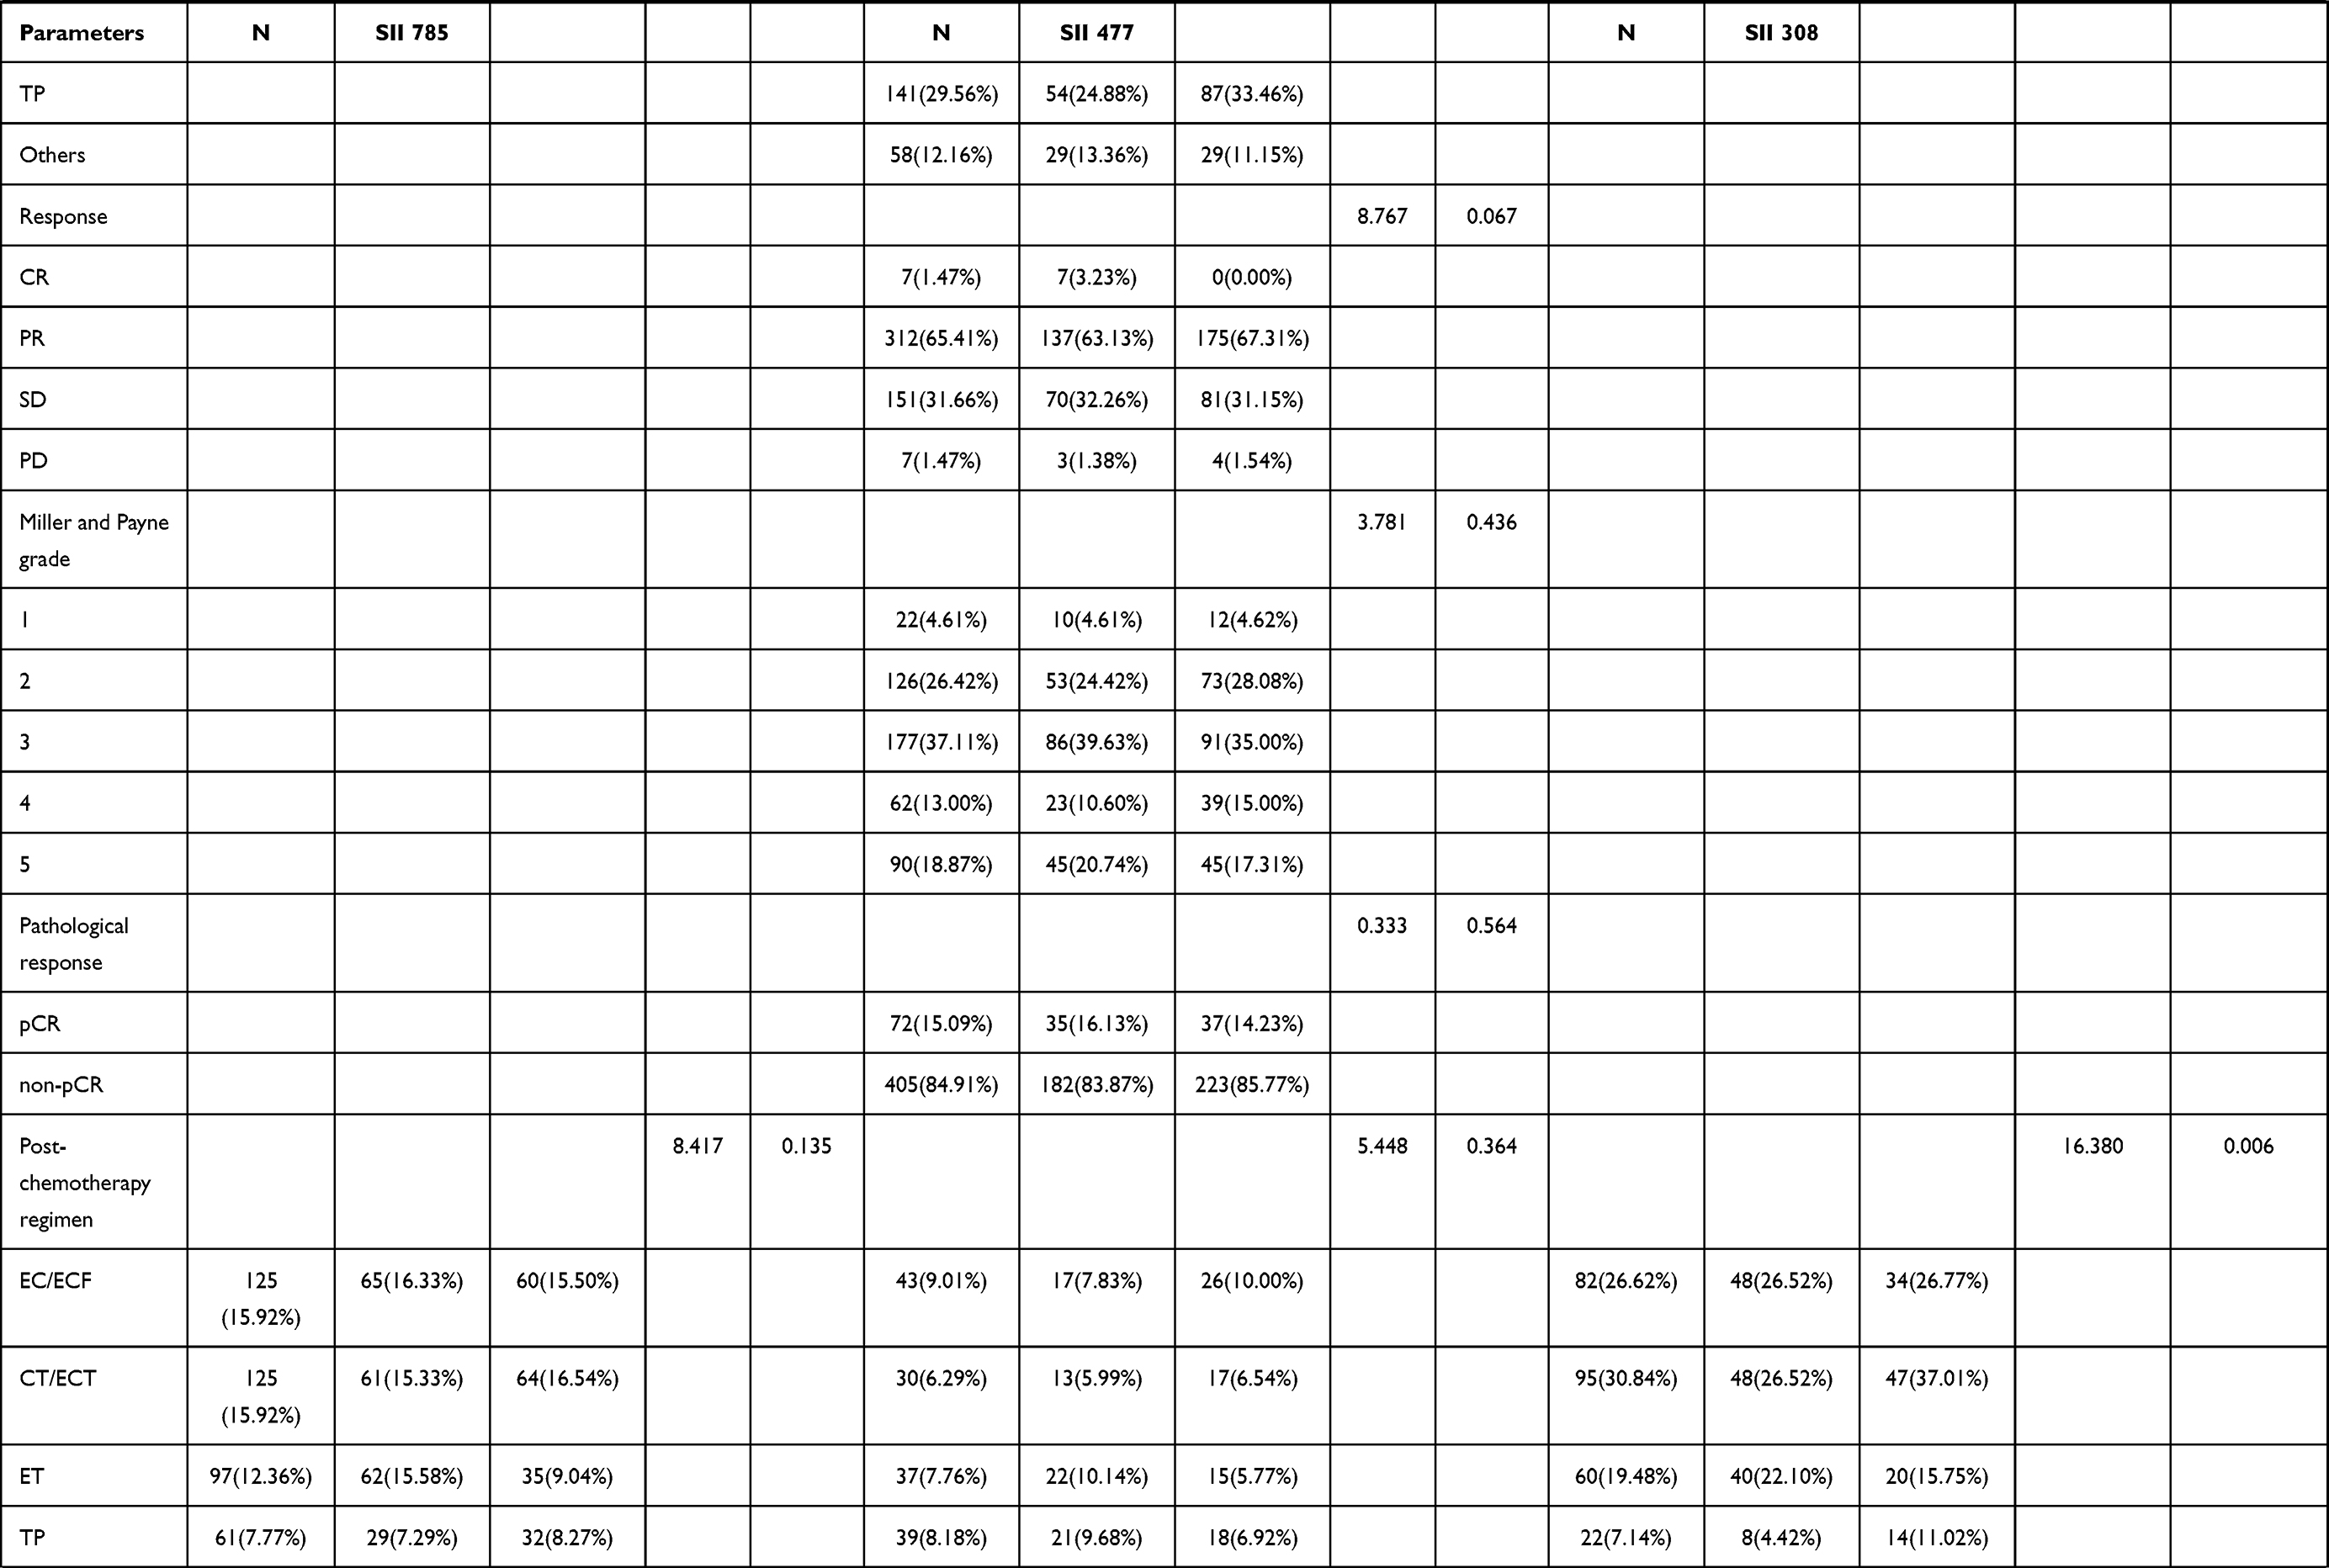 | 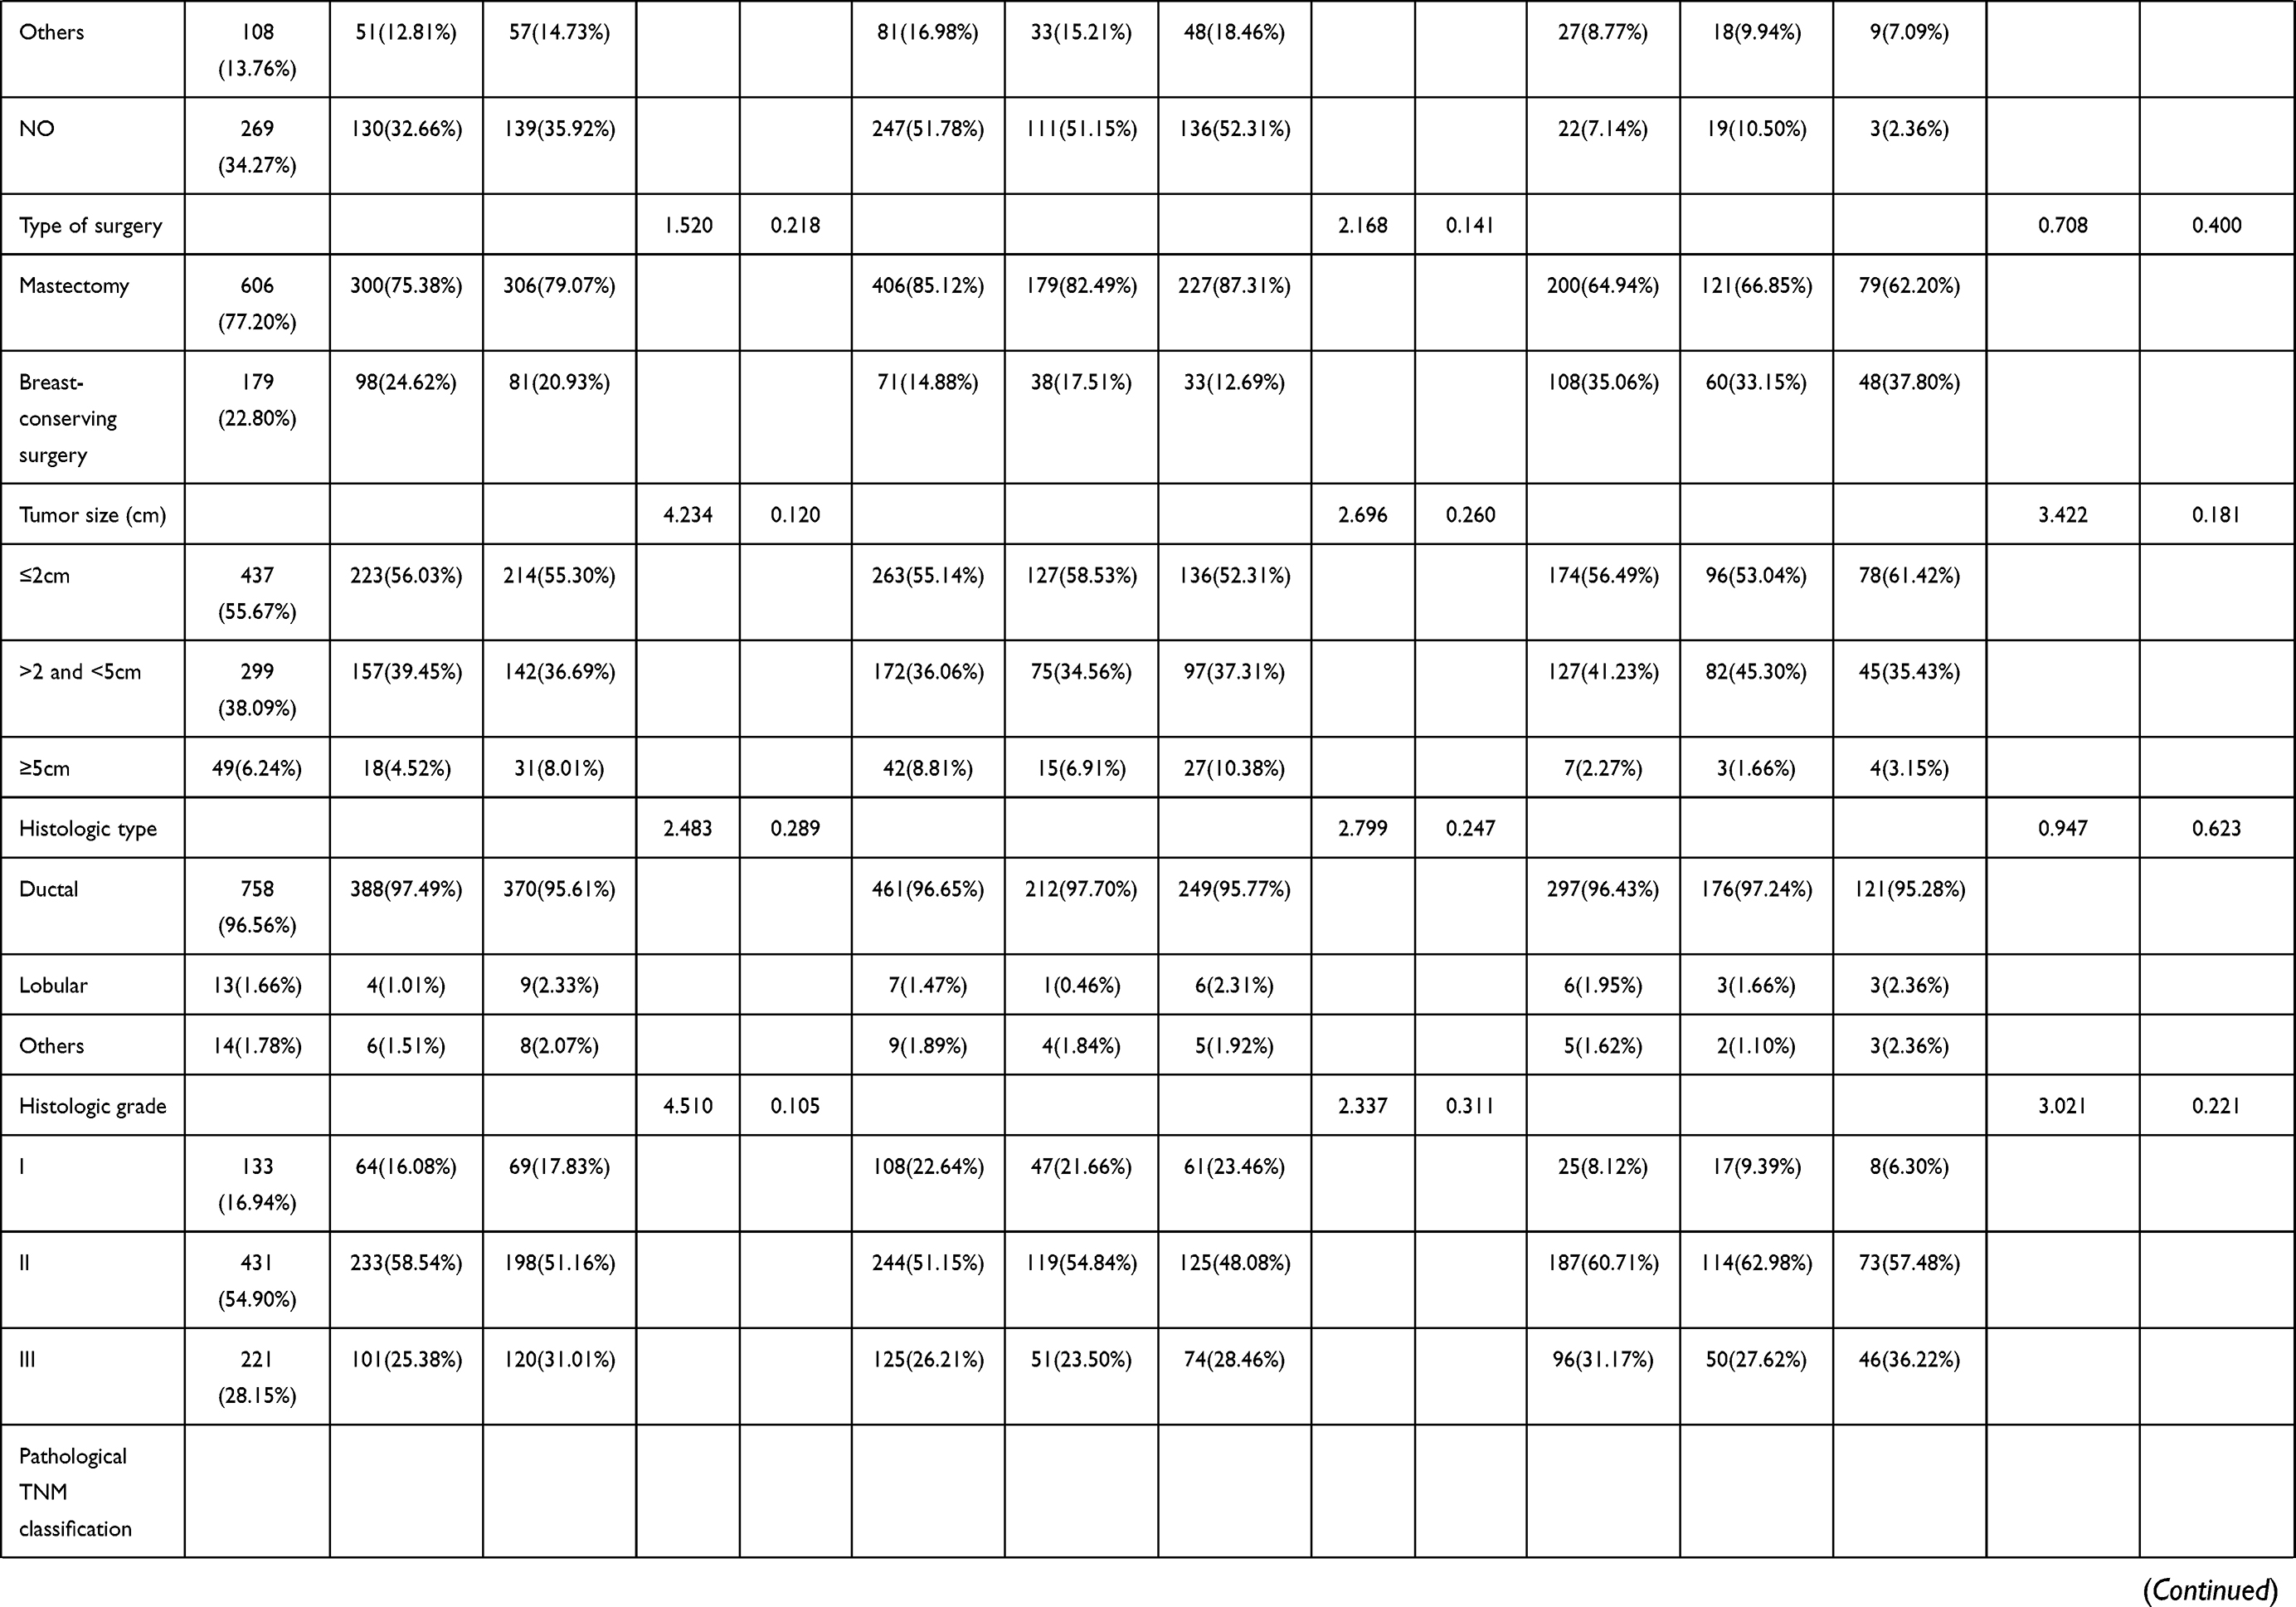 | 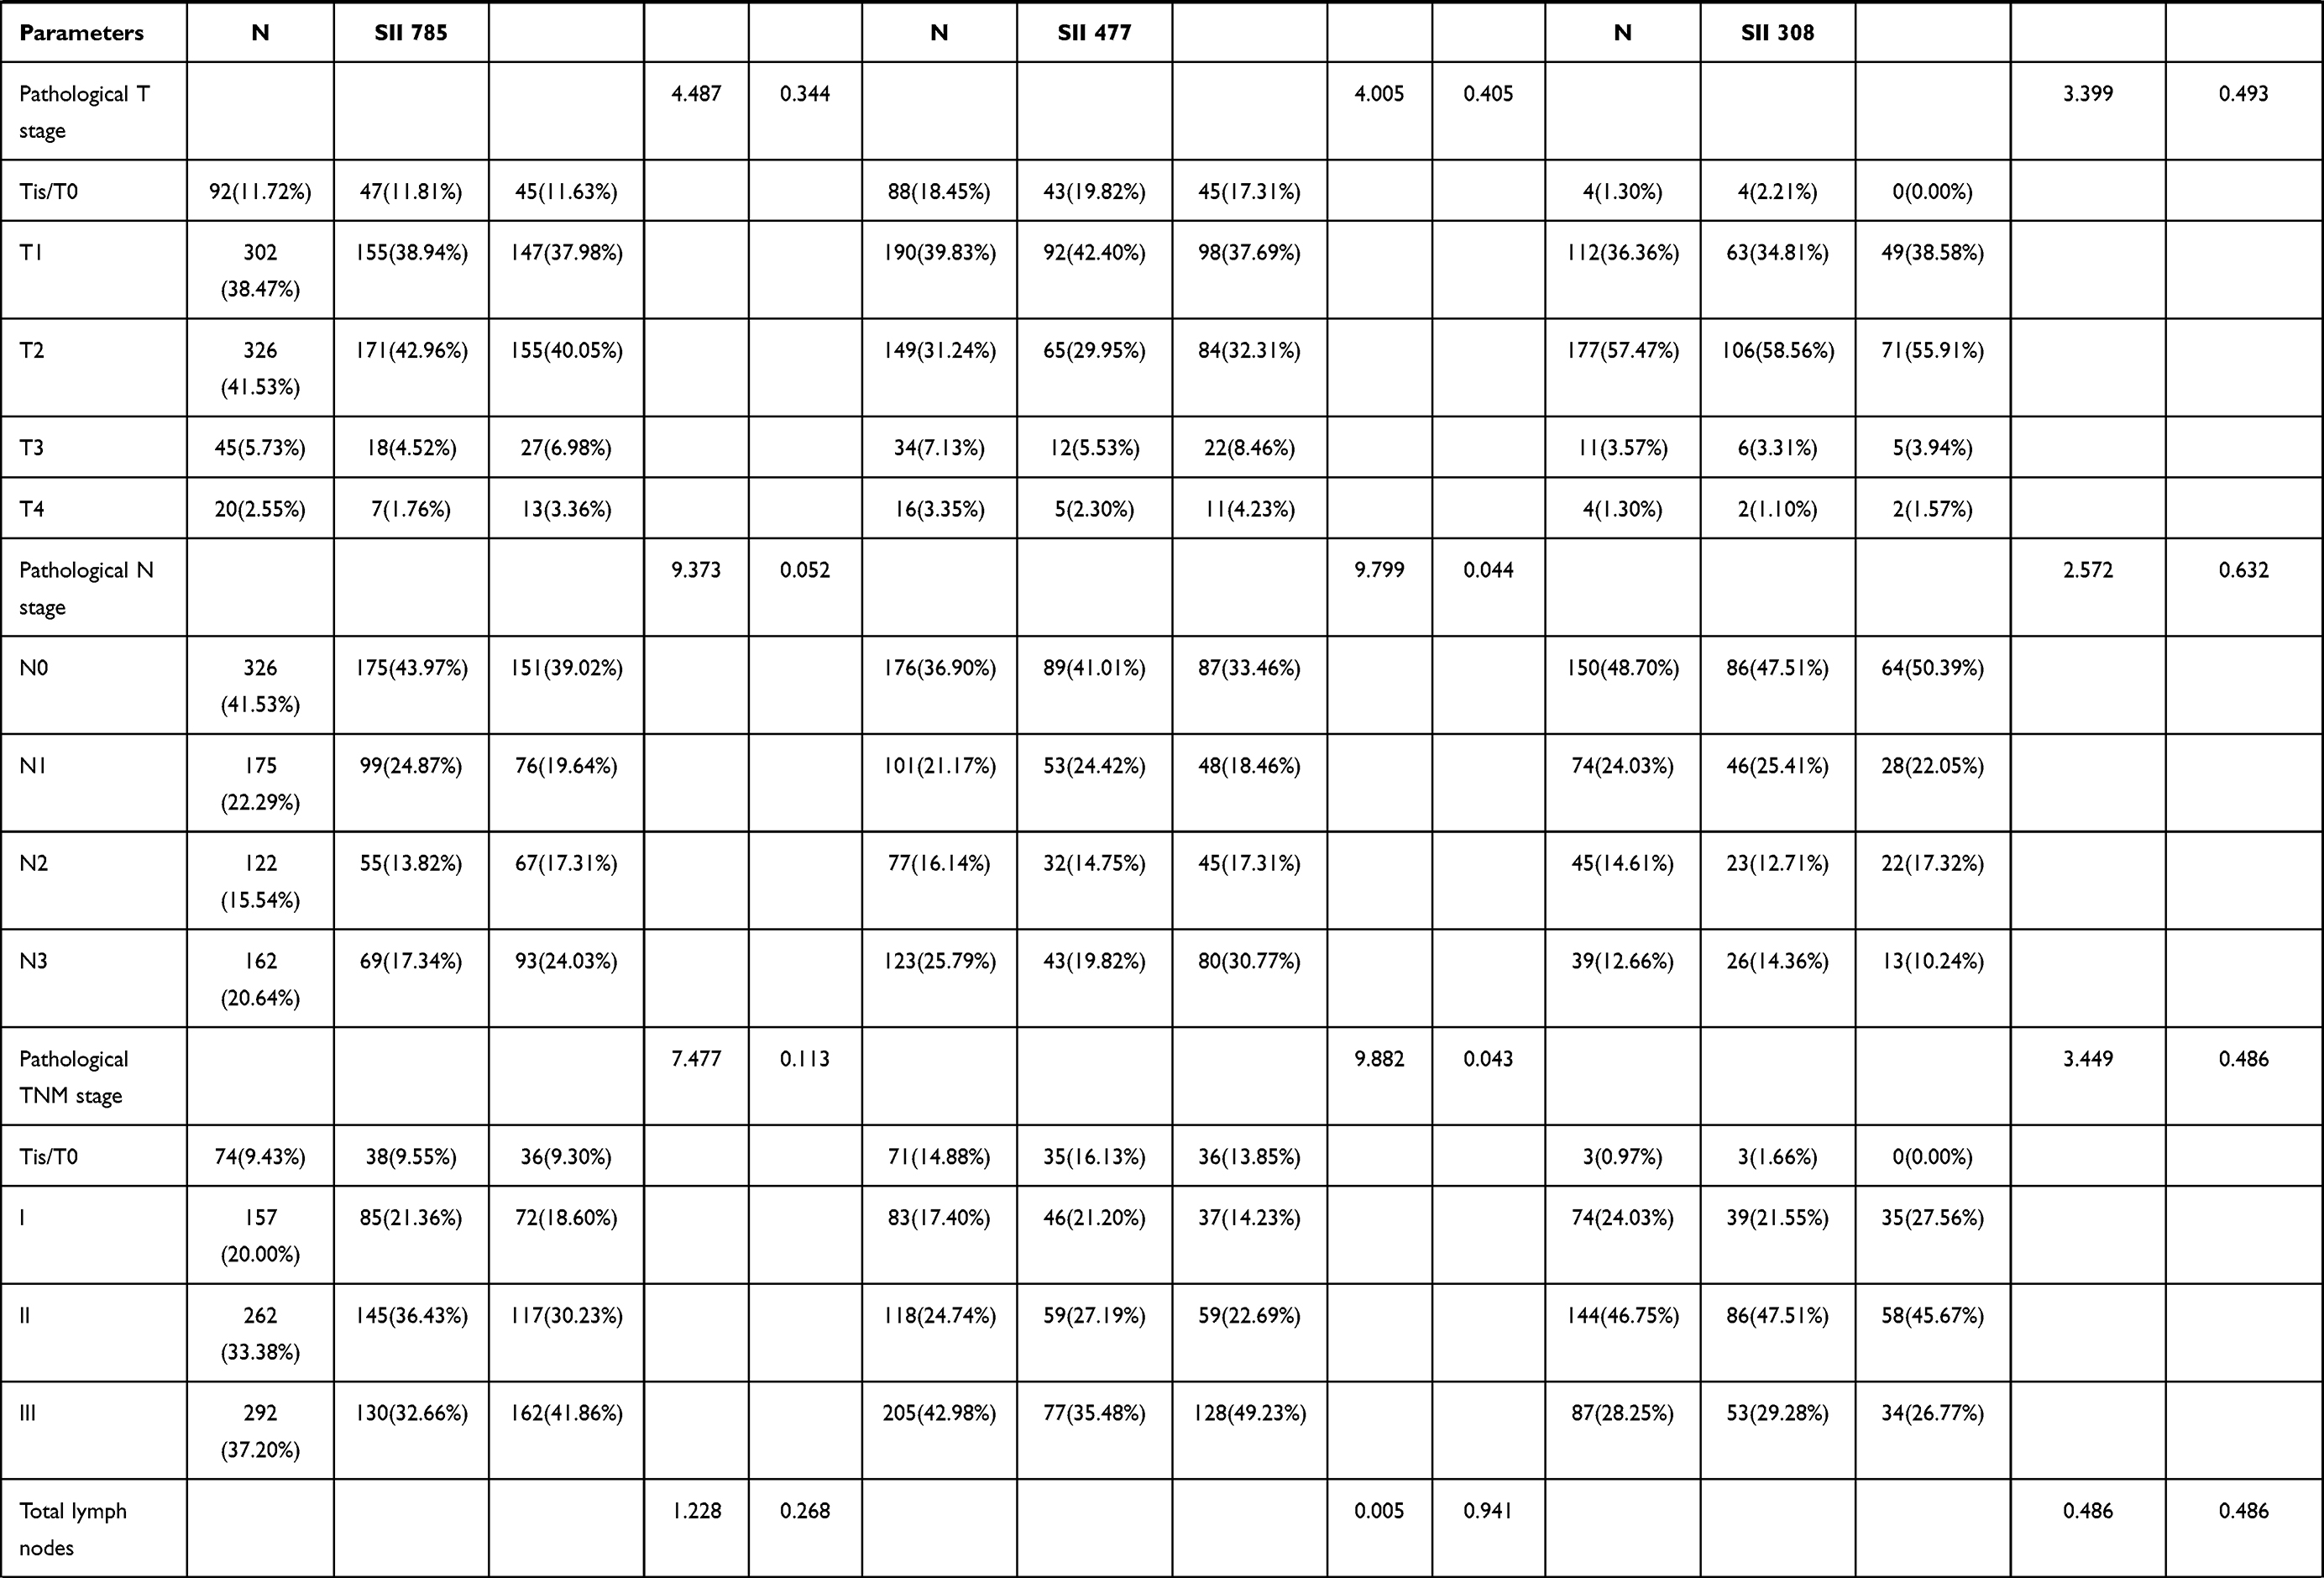 | 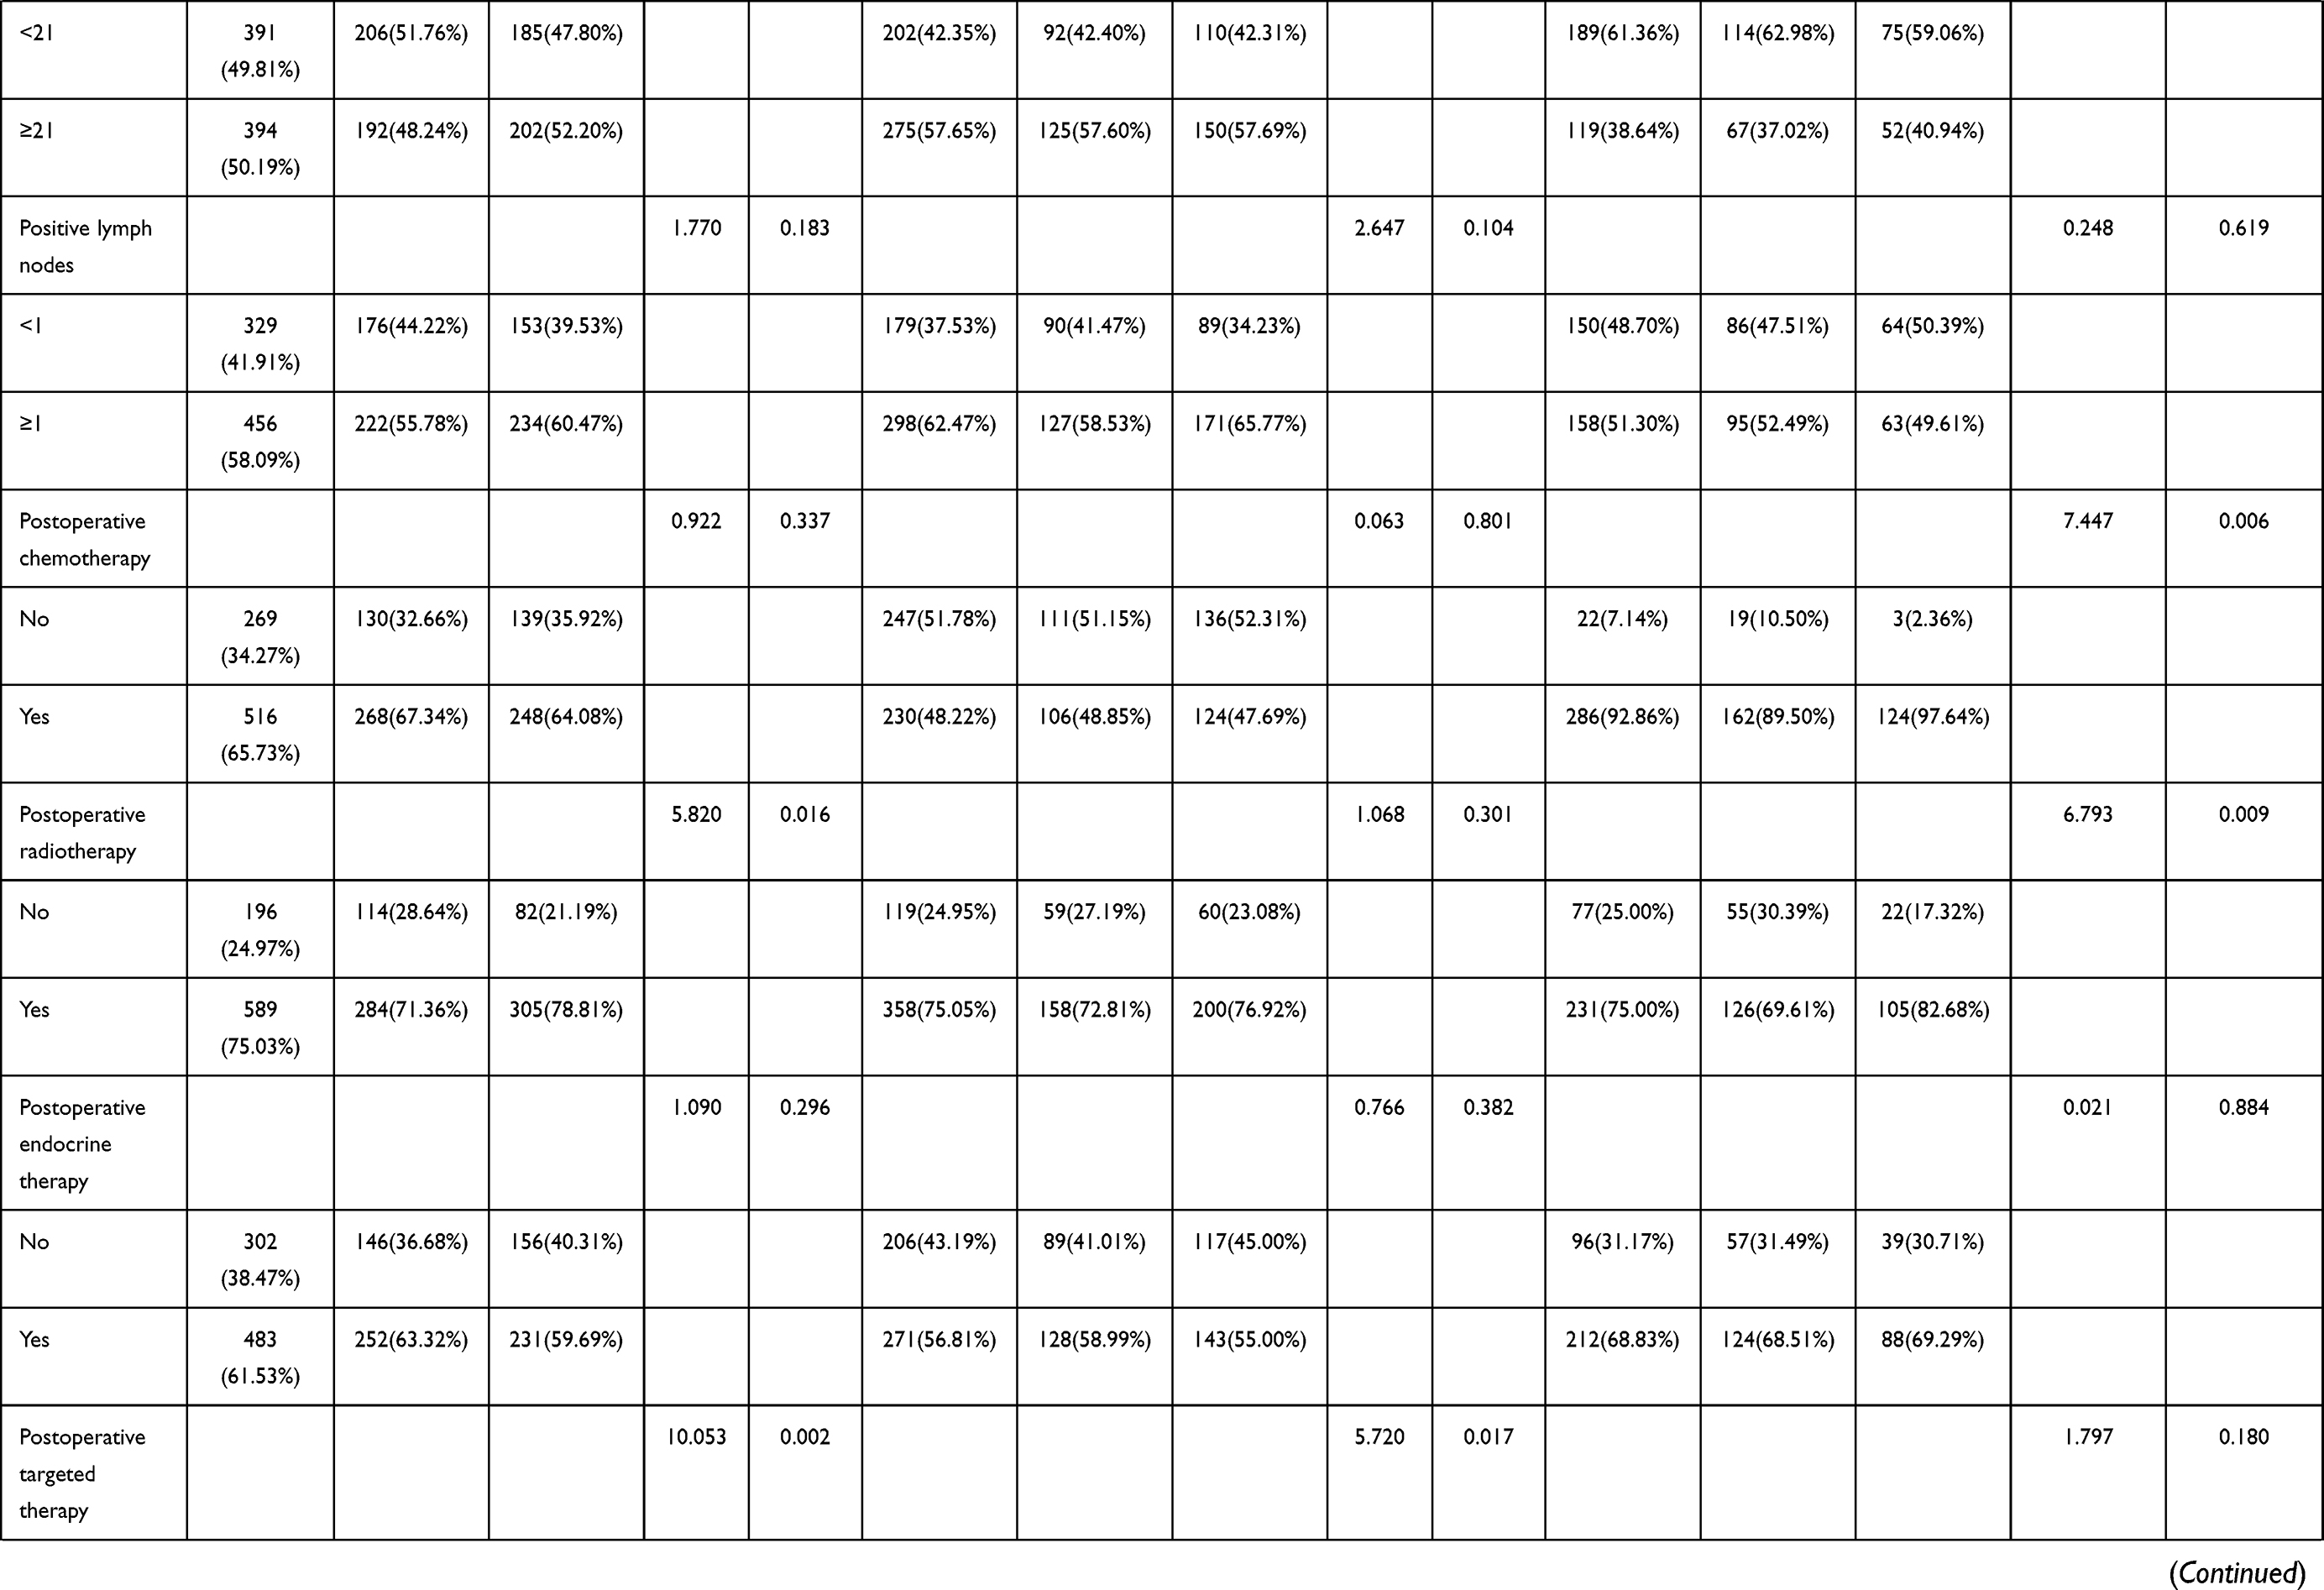 |
Table 1 Demographic and Clinicopathologic Characteristics of 785 Patients with Breast Cancer |
Hematology Parameters
Alanine aminotransferase (ALT), aspartate aminotransferase (AST), lactate dehydrogenase (LDH), r-glutamyltranspeptidase (GGT), alkaline phosphatase (ALP), blood glucose (GLU), immunoglobulin A (IgA) and albumin (ALB) were used to evaluate the nutritional status of breast cancer. The median values were 15.00U/L, 18.00U/L, 167.00 U/L, 17.00U/L, 64.00 U/L, 5.33mmol/L, 2.30 g/L, 45.2 g/L, respectively. Our analysis of inflammatory markers associated with breast cancer included C-reactive protein (CRP), carbohydrate antigen 125 (CA125), carbohydrate antigen (CA15-3), carcinoembryonic antigen (CEA), plasma D-dimer (D-D), fibrinogen (FIB), the international standardized ratio of prothrombin time (INR), fibrinogen degradation products (FDP), and various peripheral blood count parameters such as white blood cell (W), red blood cell (R), hemoglobin (Hb), N, L, M, eosinophils (E), basophils (B), and P. Their median values were 0.20 mg/dl, 13.35 U/mL, 11.63 U/mL, 1.66 ng/mL, 0.29 mg/L, 2.85 g/L, 0.93, 1.40 ug/mL, 6.01×10⁹/L, 4.40×10¹²/L, 132g/L, 3.68×10⁹/L, 1.76×10⁹/L, 0.35×10⁹/L, 0.06×10⁹/L, 0.02×10⁹/L, and 243×109/L, respectively. These findings are depicted in Table 2.
- In all breast cancer patients, LDH (χ2=8.470, P=0.004), ALB (χ2=13.001, P=0.0003), CA125 (χ2=9.201, P=0.003), FIB (χ2=8.387, P=0.004), INR (χ2=10.784, P=0.001), W (χ2=50.511, P<0.0001), R (χ2=7.186, P=0.007), N (χ2=148.170, P<0.0001), L (χ2=43.588, P<0.0001), E (χ2=19.123, P<0.0001), B (χ2=11.478, P=0.001), and P (χ2=66.899, P<0.0001) were statistically significant.
- In the NACT group (477 patients), LDH (χ2=9.209, P=0.002), ALB (χ2=7.705, P=0.006), CA125 (χ2=10.367, P=0.001), CA153 (χ2=4.449, P=0.035), FIB (χ2=4.700, P=0.030), INR (χ2=6.581, P=0.010), W (χ2=39.723, P<0.0001), R (χ2=4.946, P=0.026), N (χ2=90.962, P<0.0001), L (χ2=15.549, P<0.0001), E (χ2=6.290, P=0.012, P (χ2=49.263, P<0.0001) were statistically significant.
- In the non-NACT group (308 breast cancer patients), ALB (χ2=5.083, P=0.024), CA153 (χ2=4.644, P=0.031), W (χ2=13.475, P=0.0002), N (χ2=55.799, P<0.0001), L (χ2=26.815, P<0.0001), E (χ2=10.563, P=0.001), B (χ2=15.340, P<0.0001), P (χ2=16.716, P<0.0001) were statistically significant.
 | 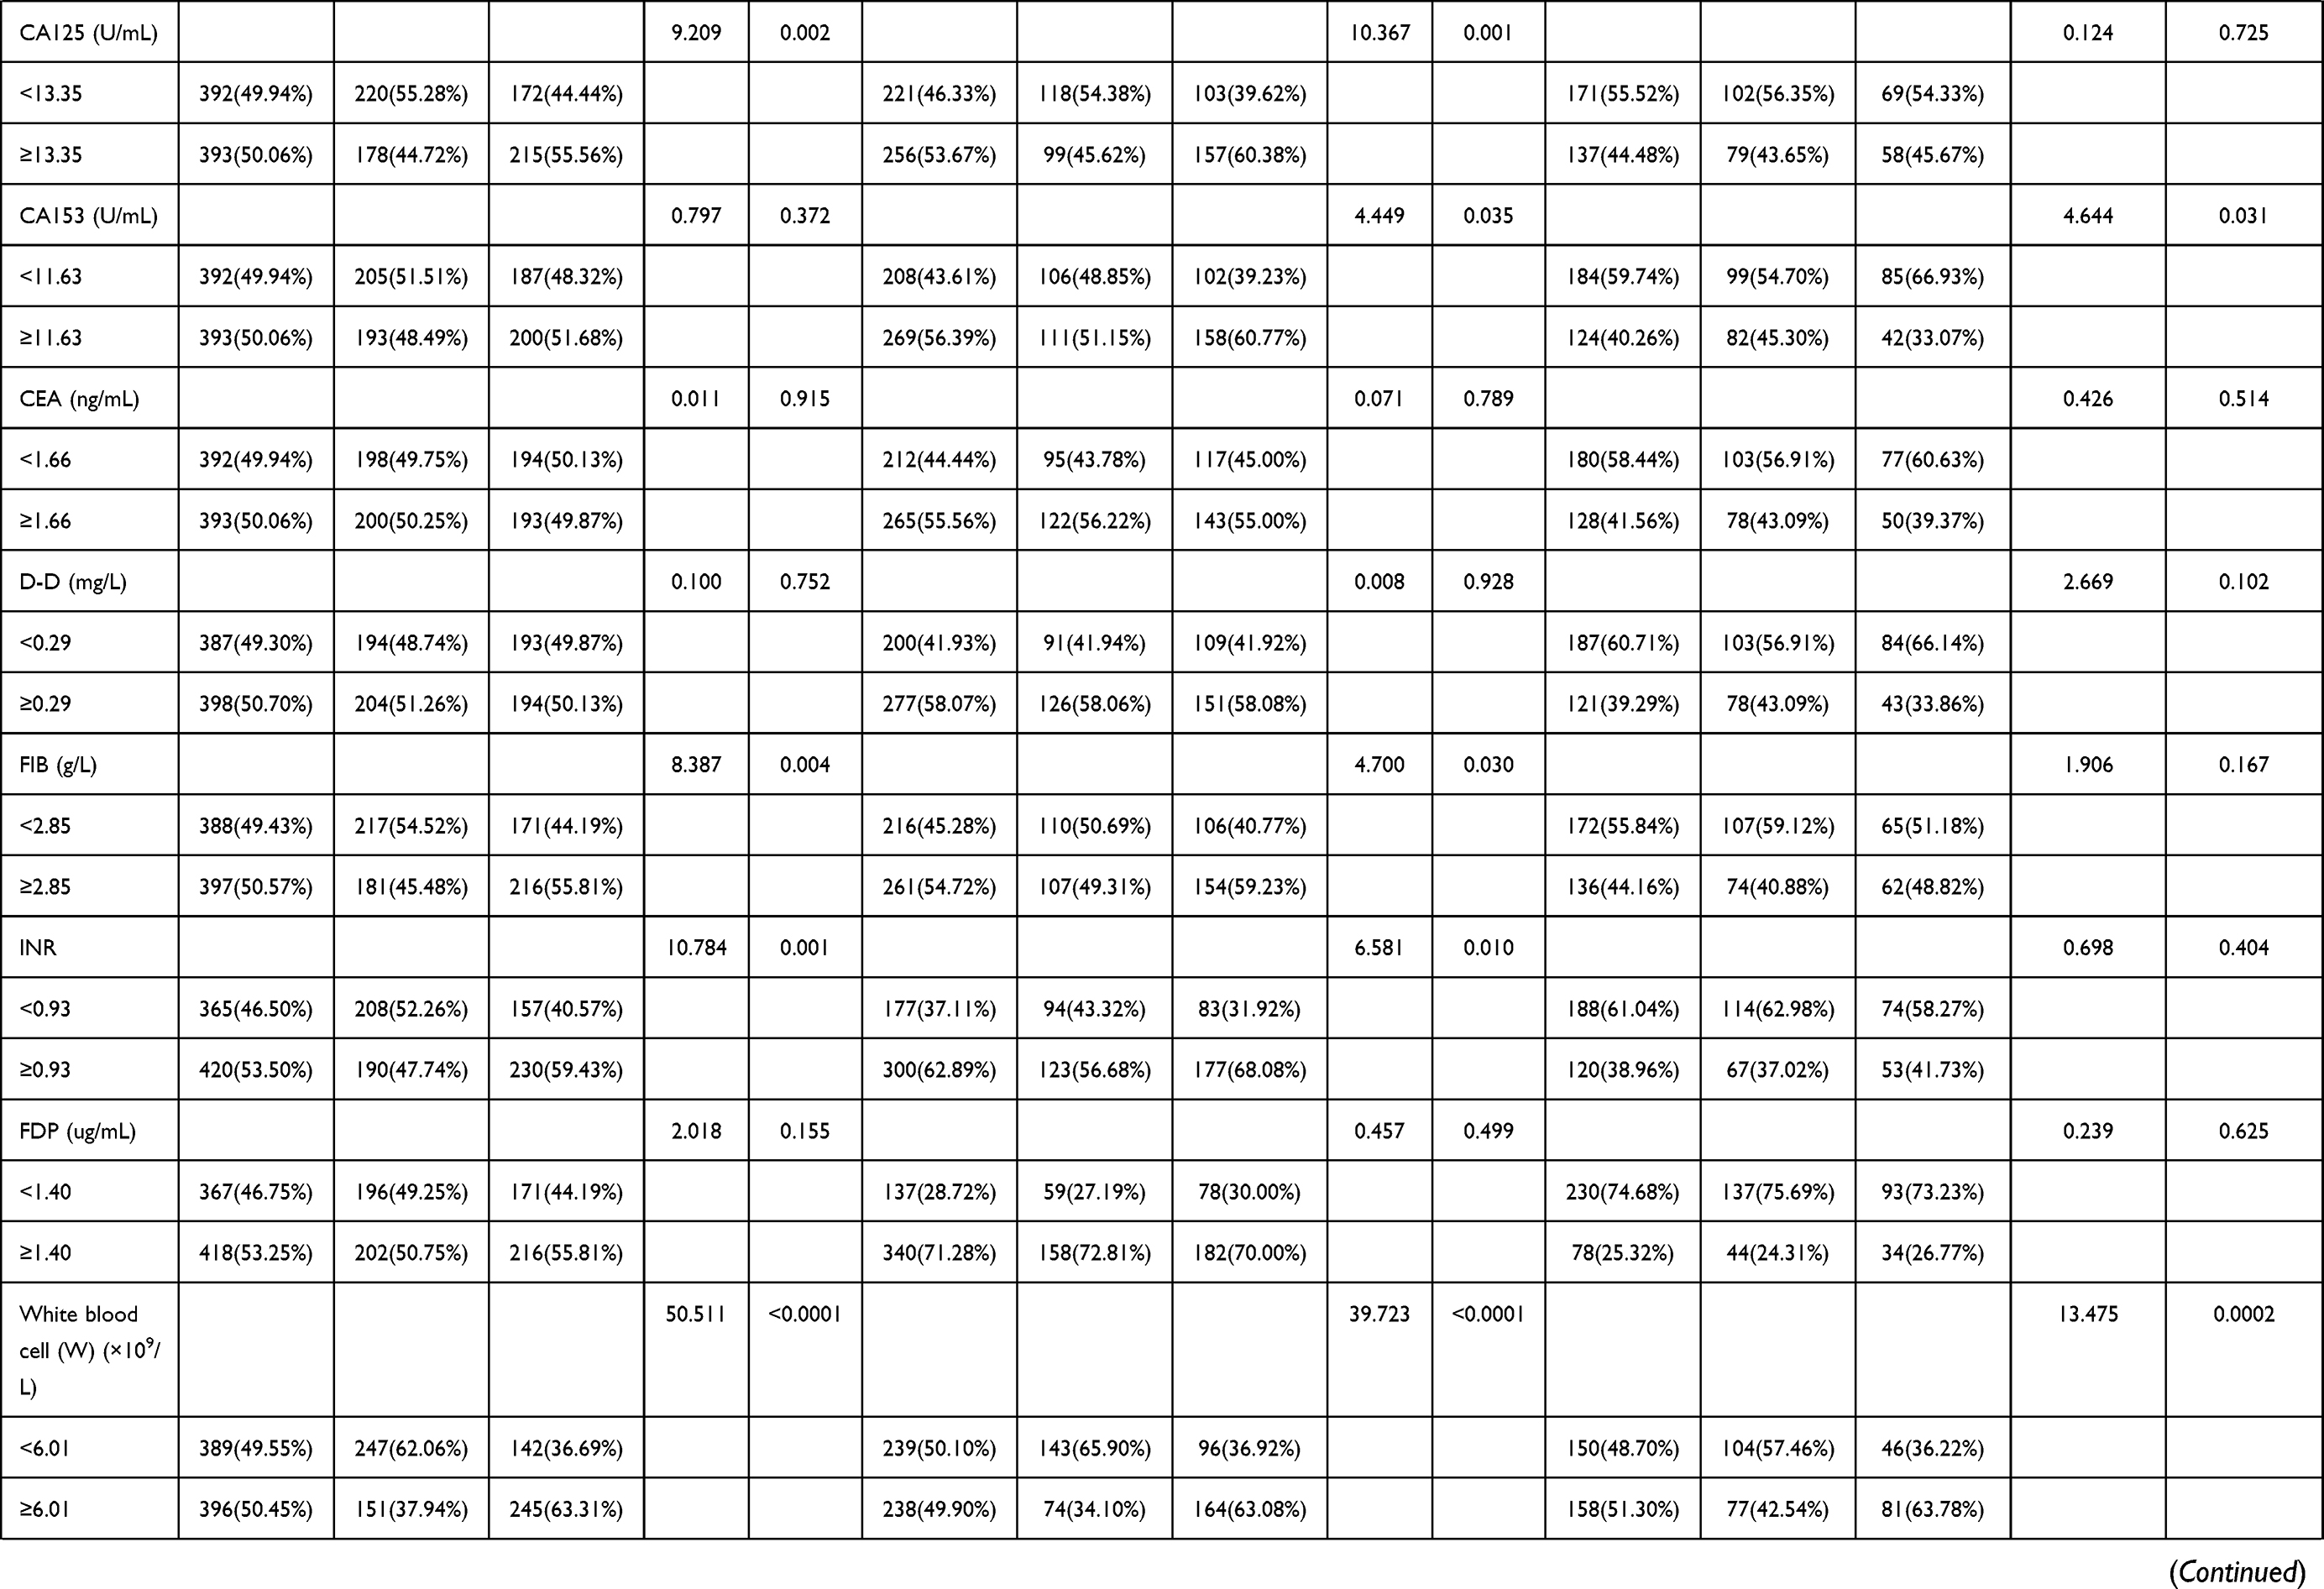 | 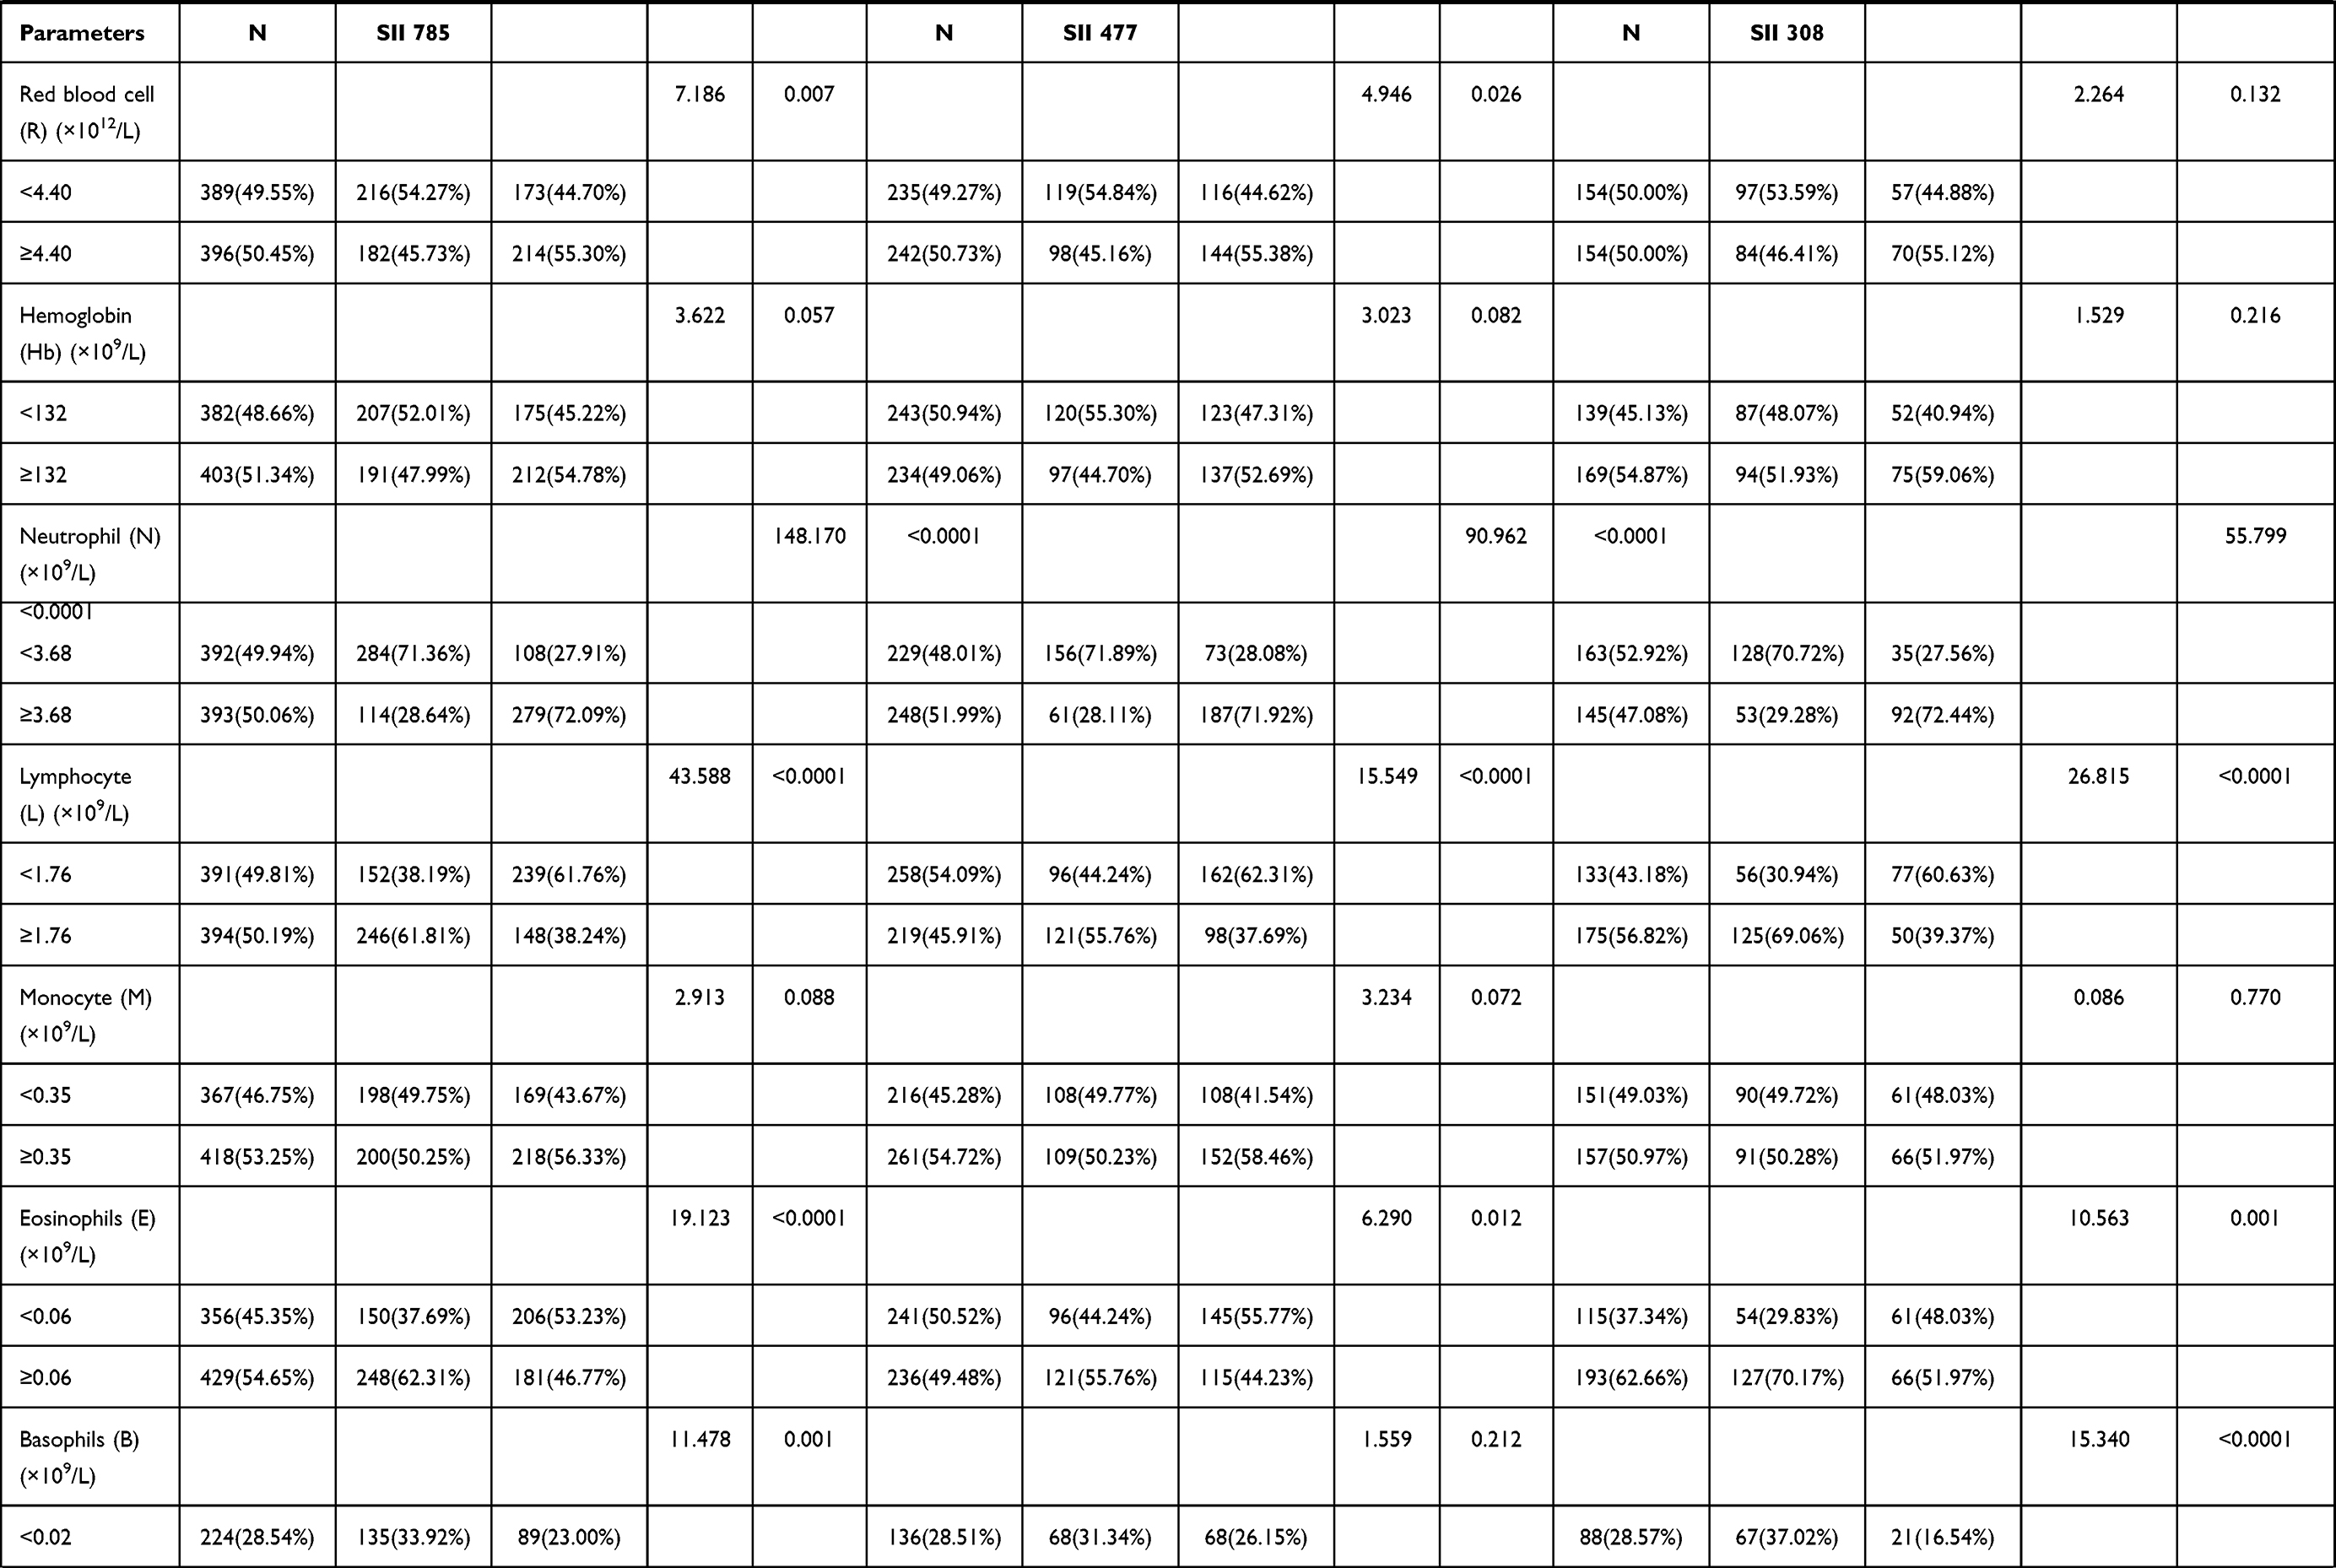 |  |
Table 2 The Correlations Between Nutritional Parameters/Blood Parameters and SII |
Univariate and Multivariate Cox Regression Survival Analyses
Based on univariate analysis, independent factors that led to enhanced DFS and OS were menopausal status, blood glucose, FDP, eosinophil, platelet, SII, clinical T stage, histological type, pathological N stage, molecular type, Ki-67, CK5/6, lymphatic invasion, postoperative chemotherapy, and postoperative targeted therapy. Additional multivariate analysis revealed menopausal status, blood glucose, CA153, INR, lymphocytes, monocytes, SII, clinical T stage, histological type, pathological N and TNM stages, Ki-67, CK5/6, E-cad, postoperative targeted therapy, postoperative chemotherapy, and lymph vessel invasion were independent factors for improving DFS and OS. The above findings are depicted in Table 3.
 | 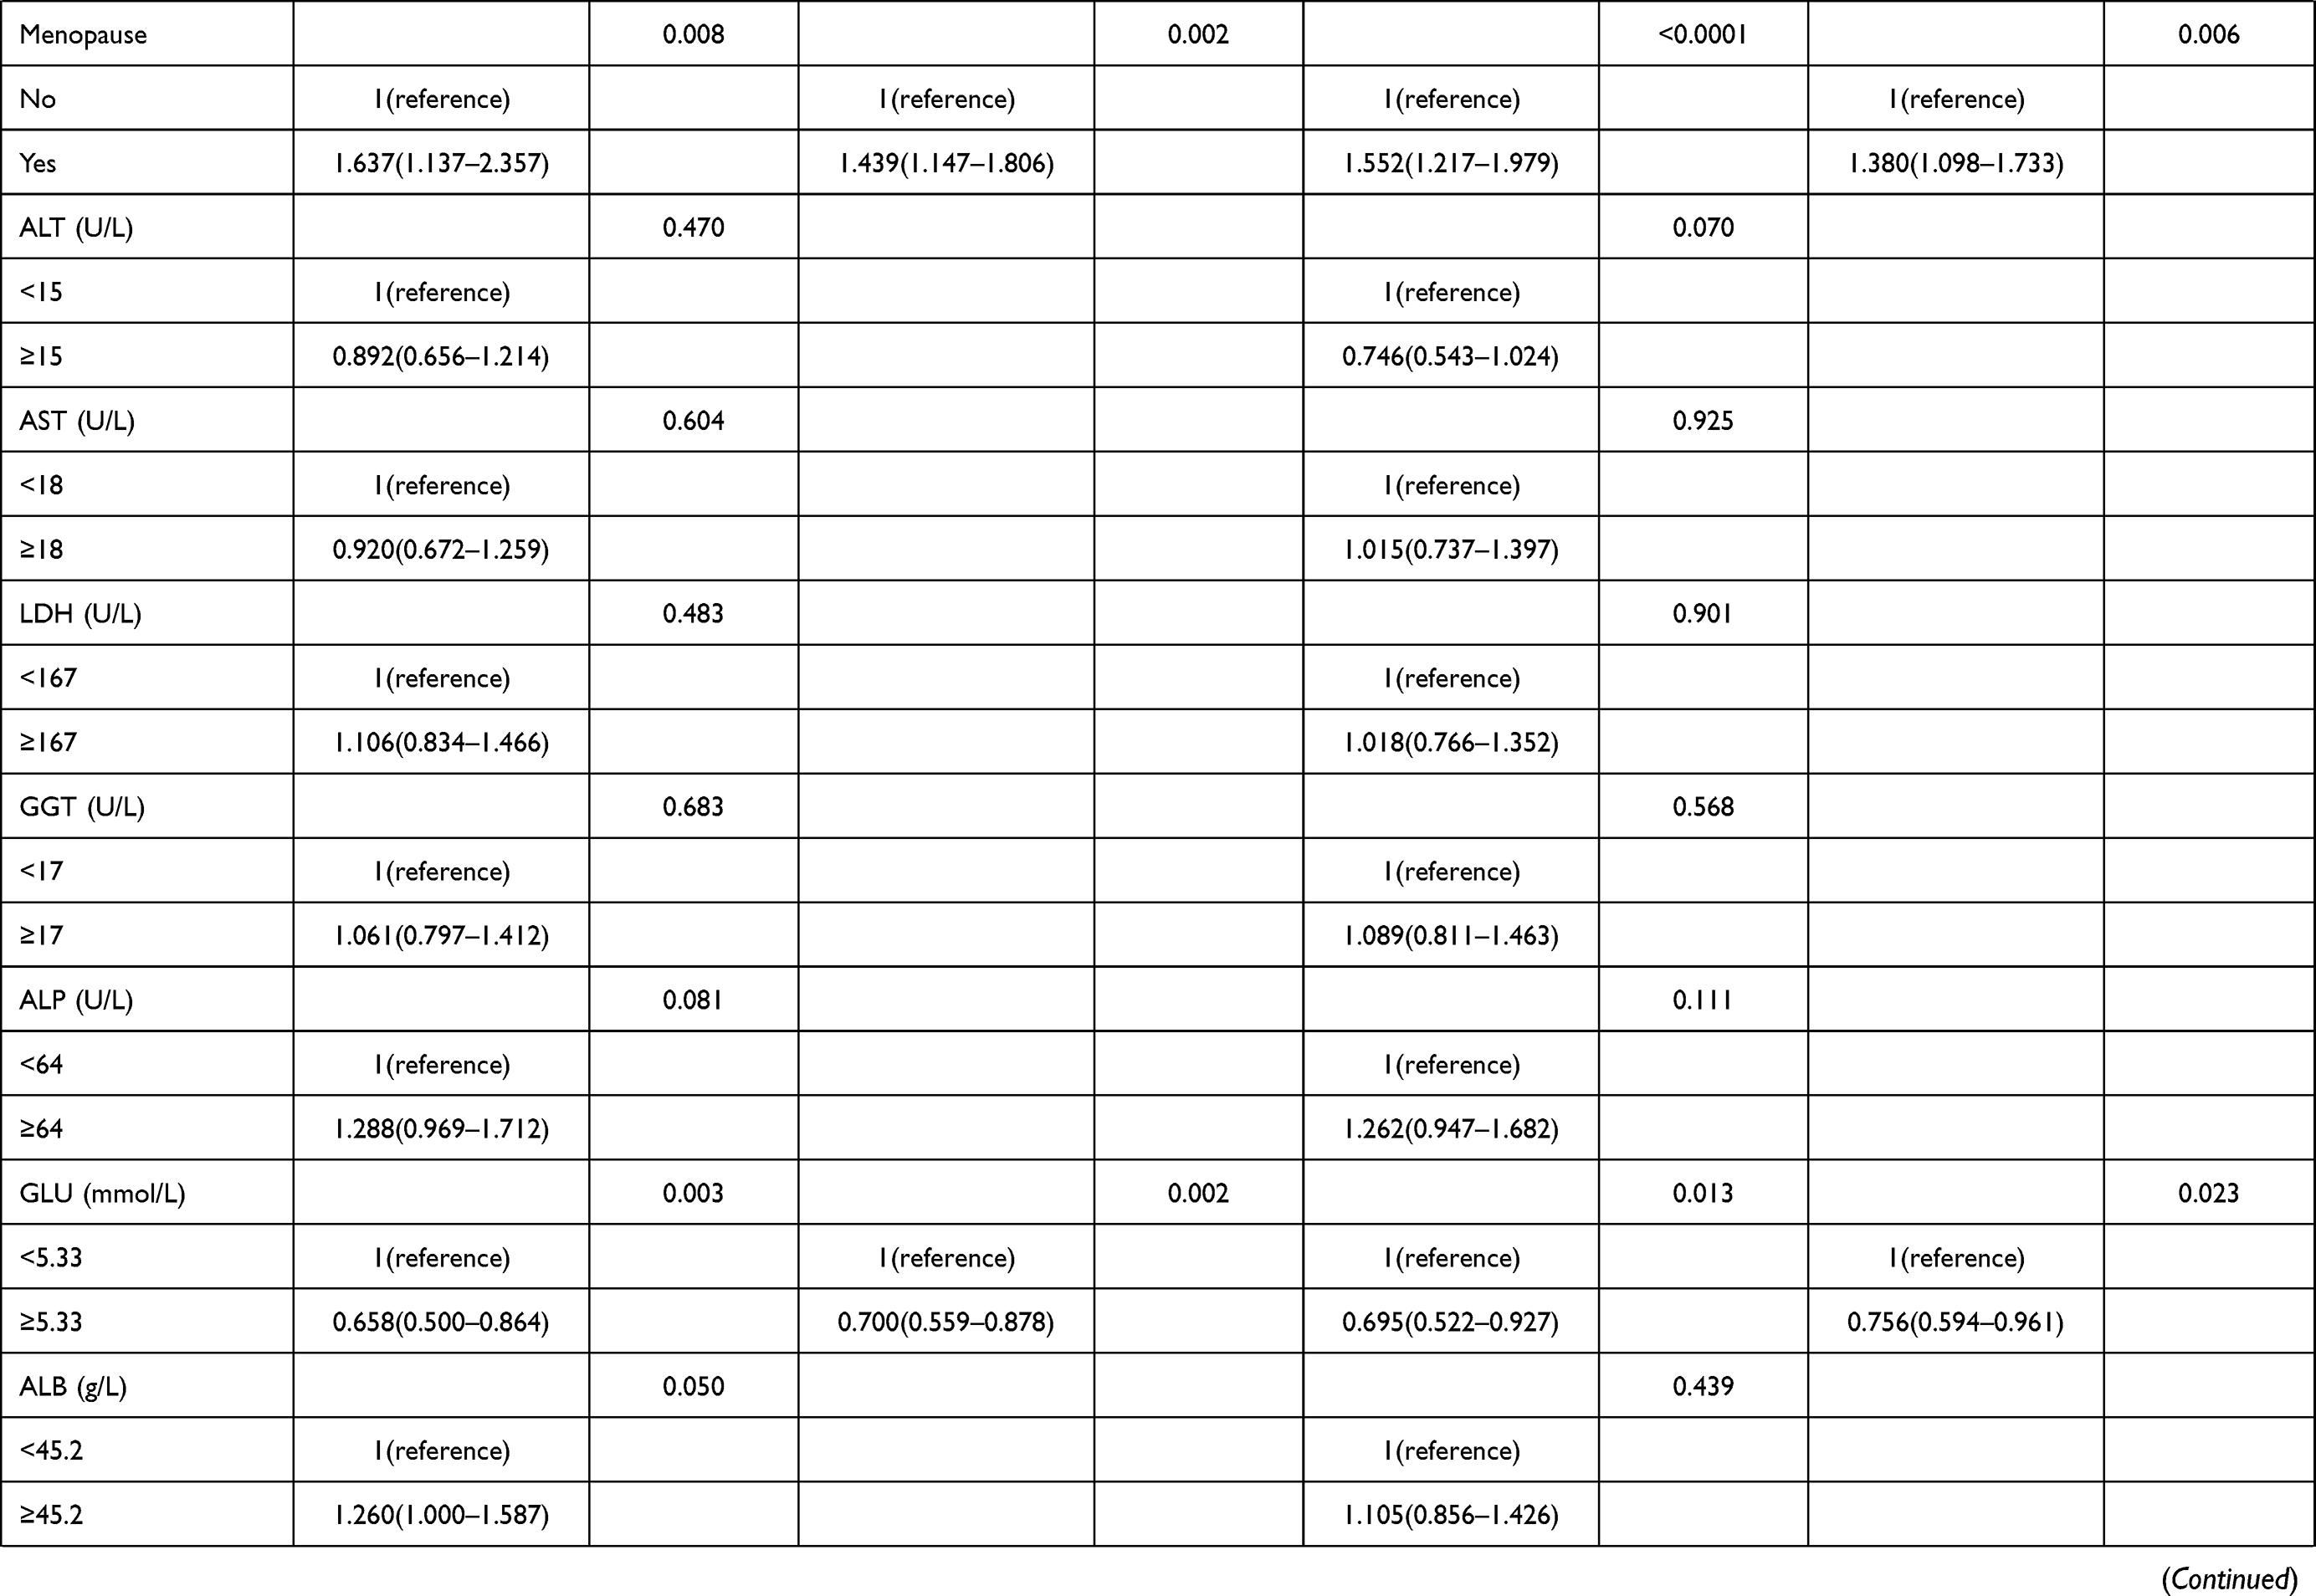 | 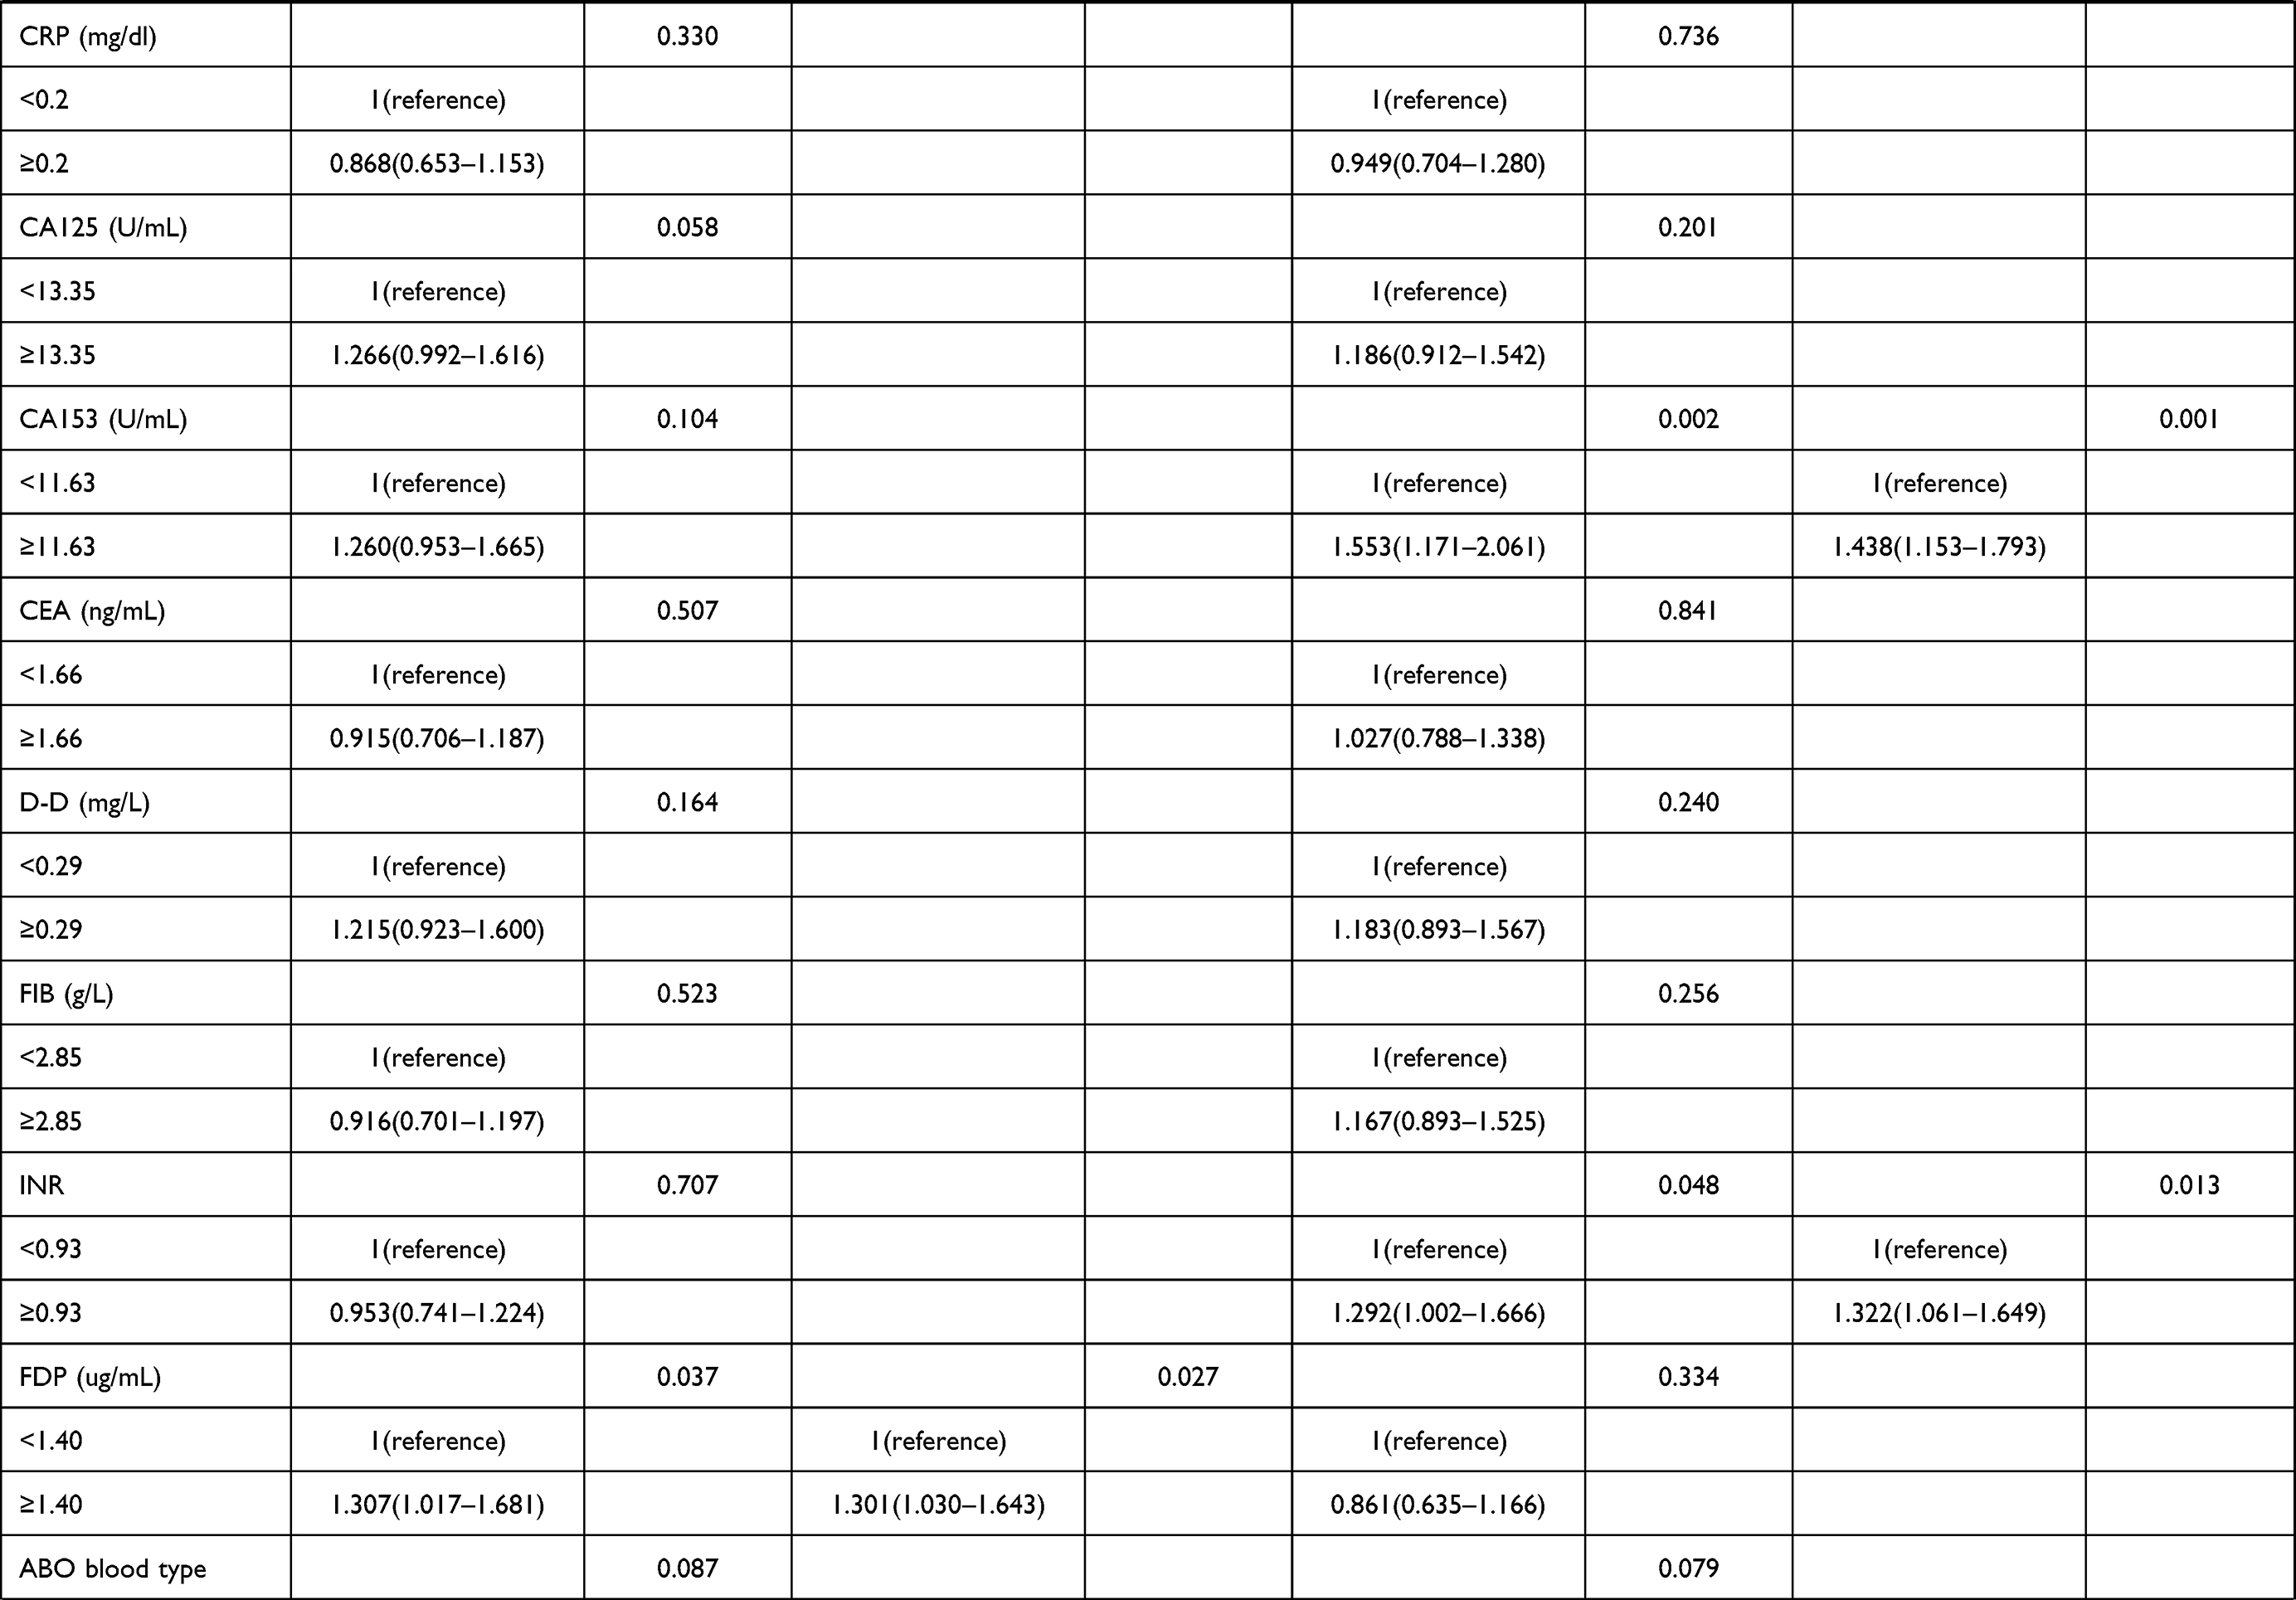 | 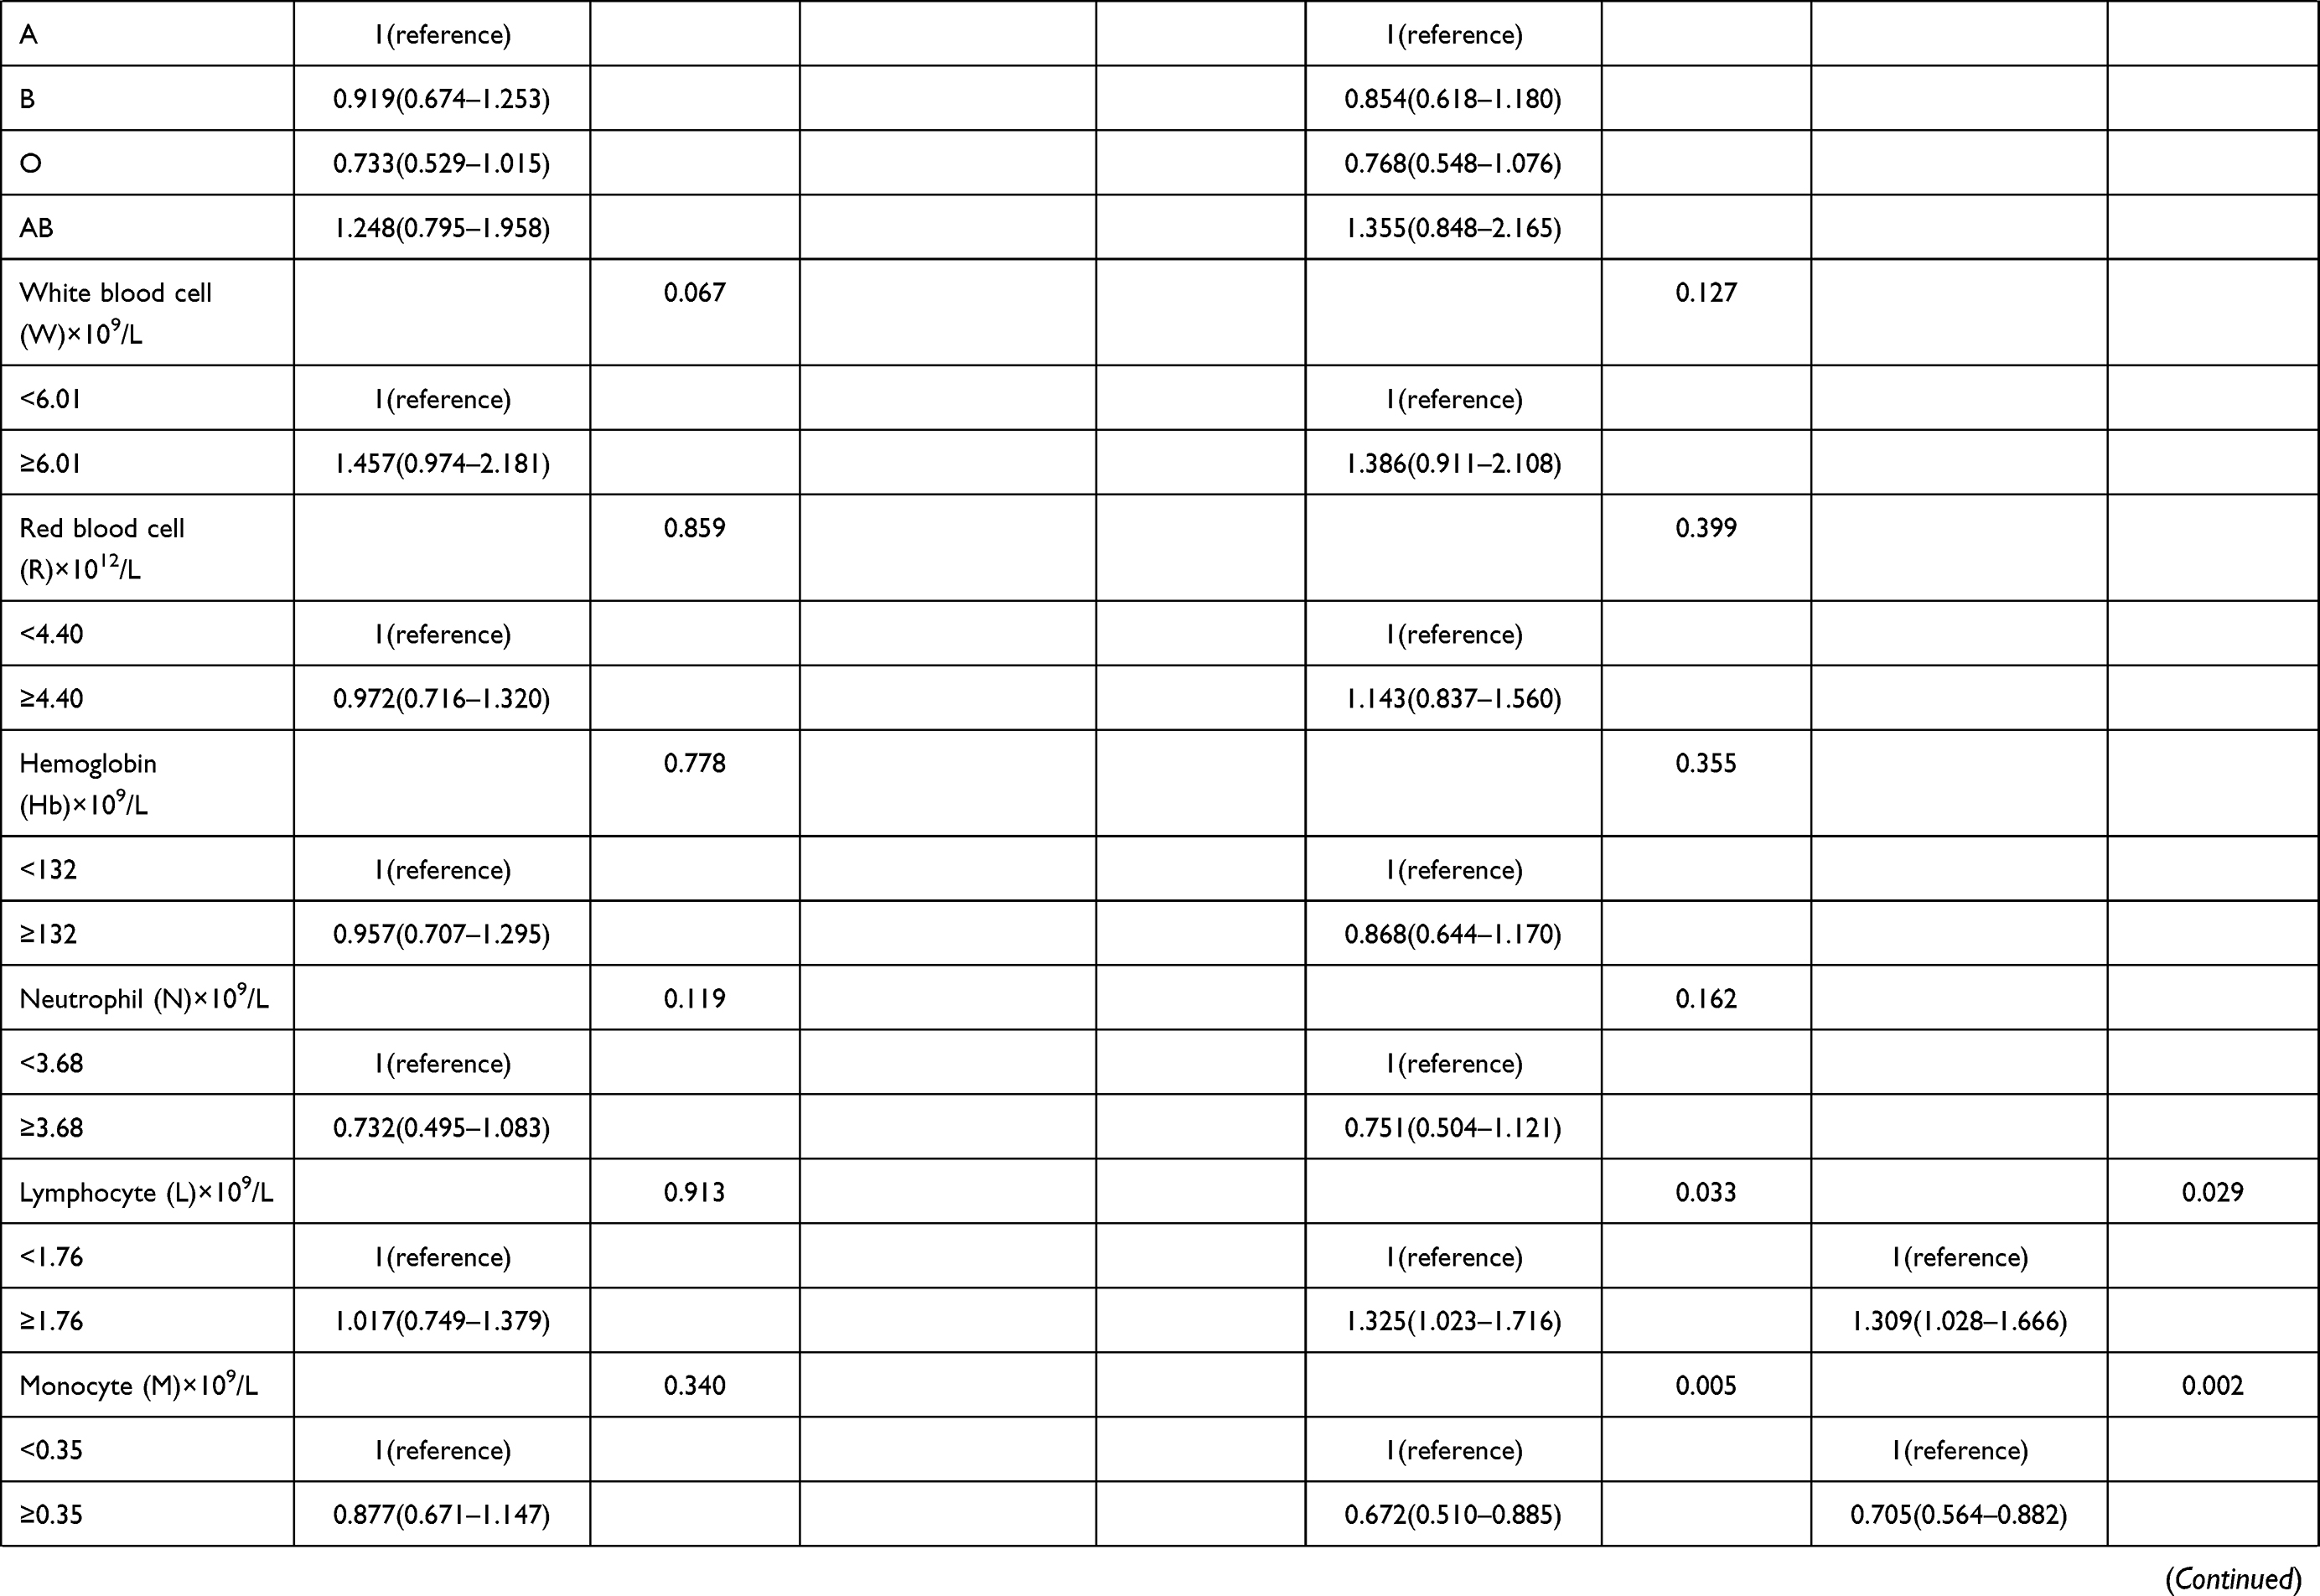 |  | 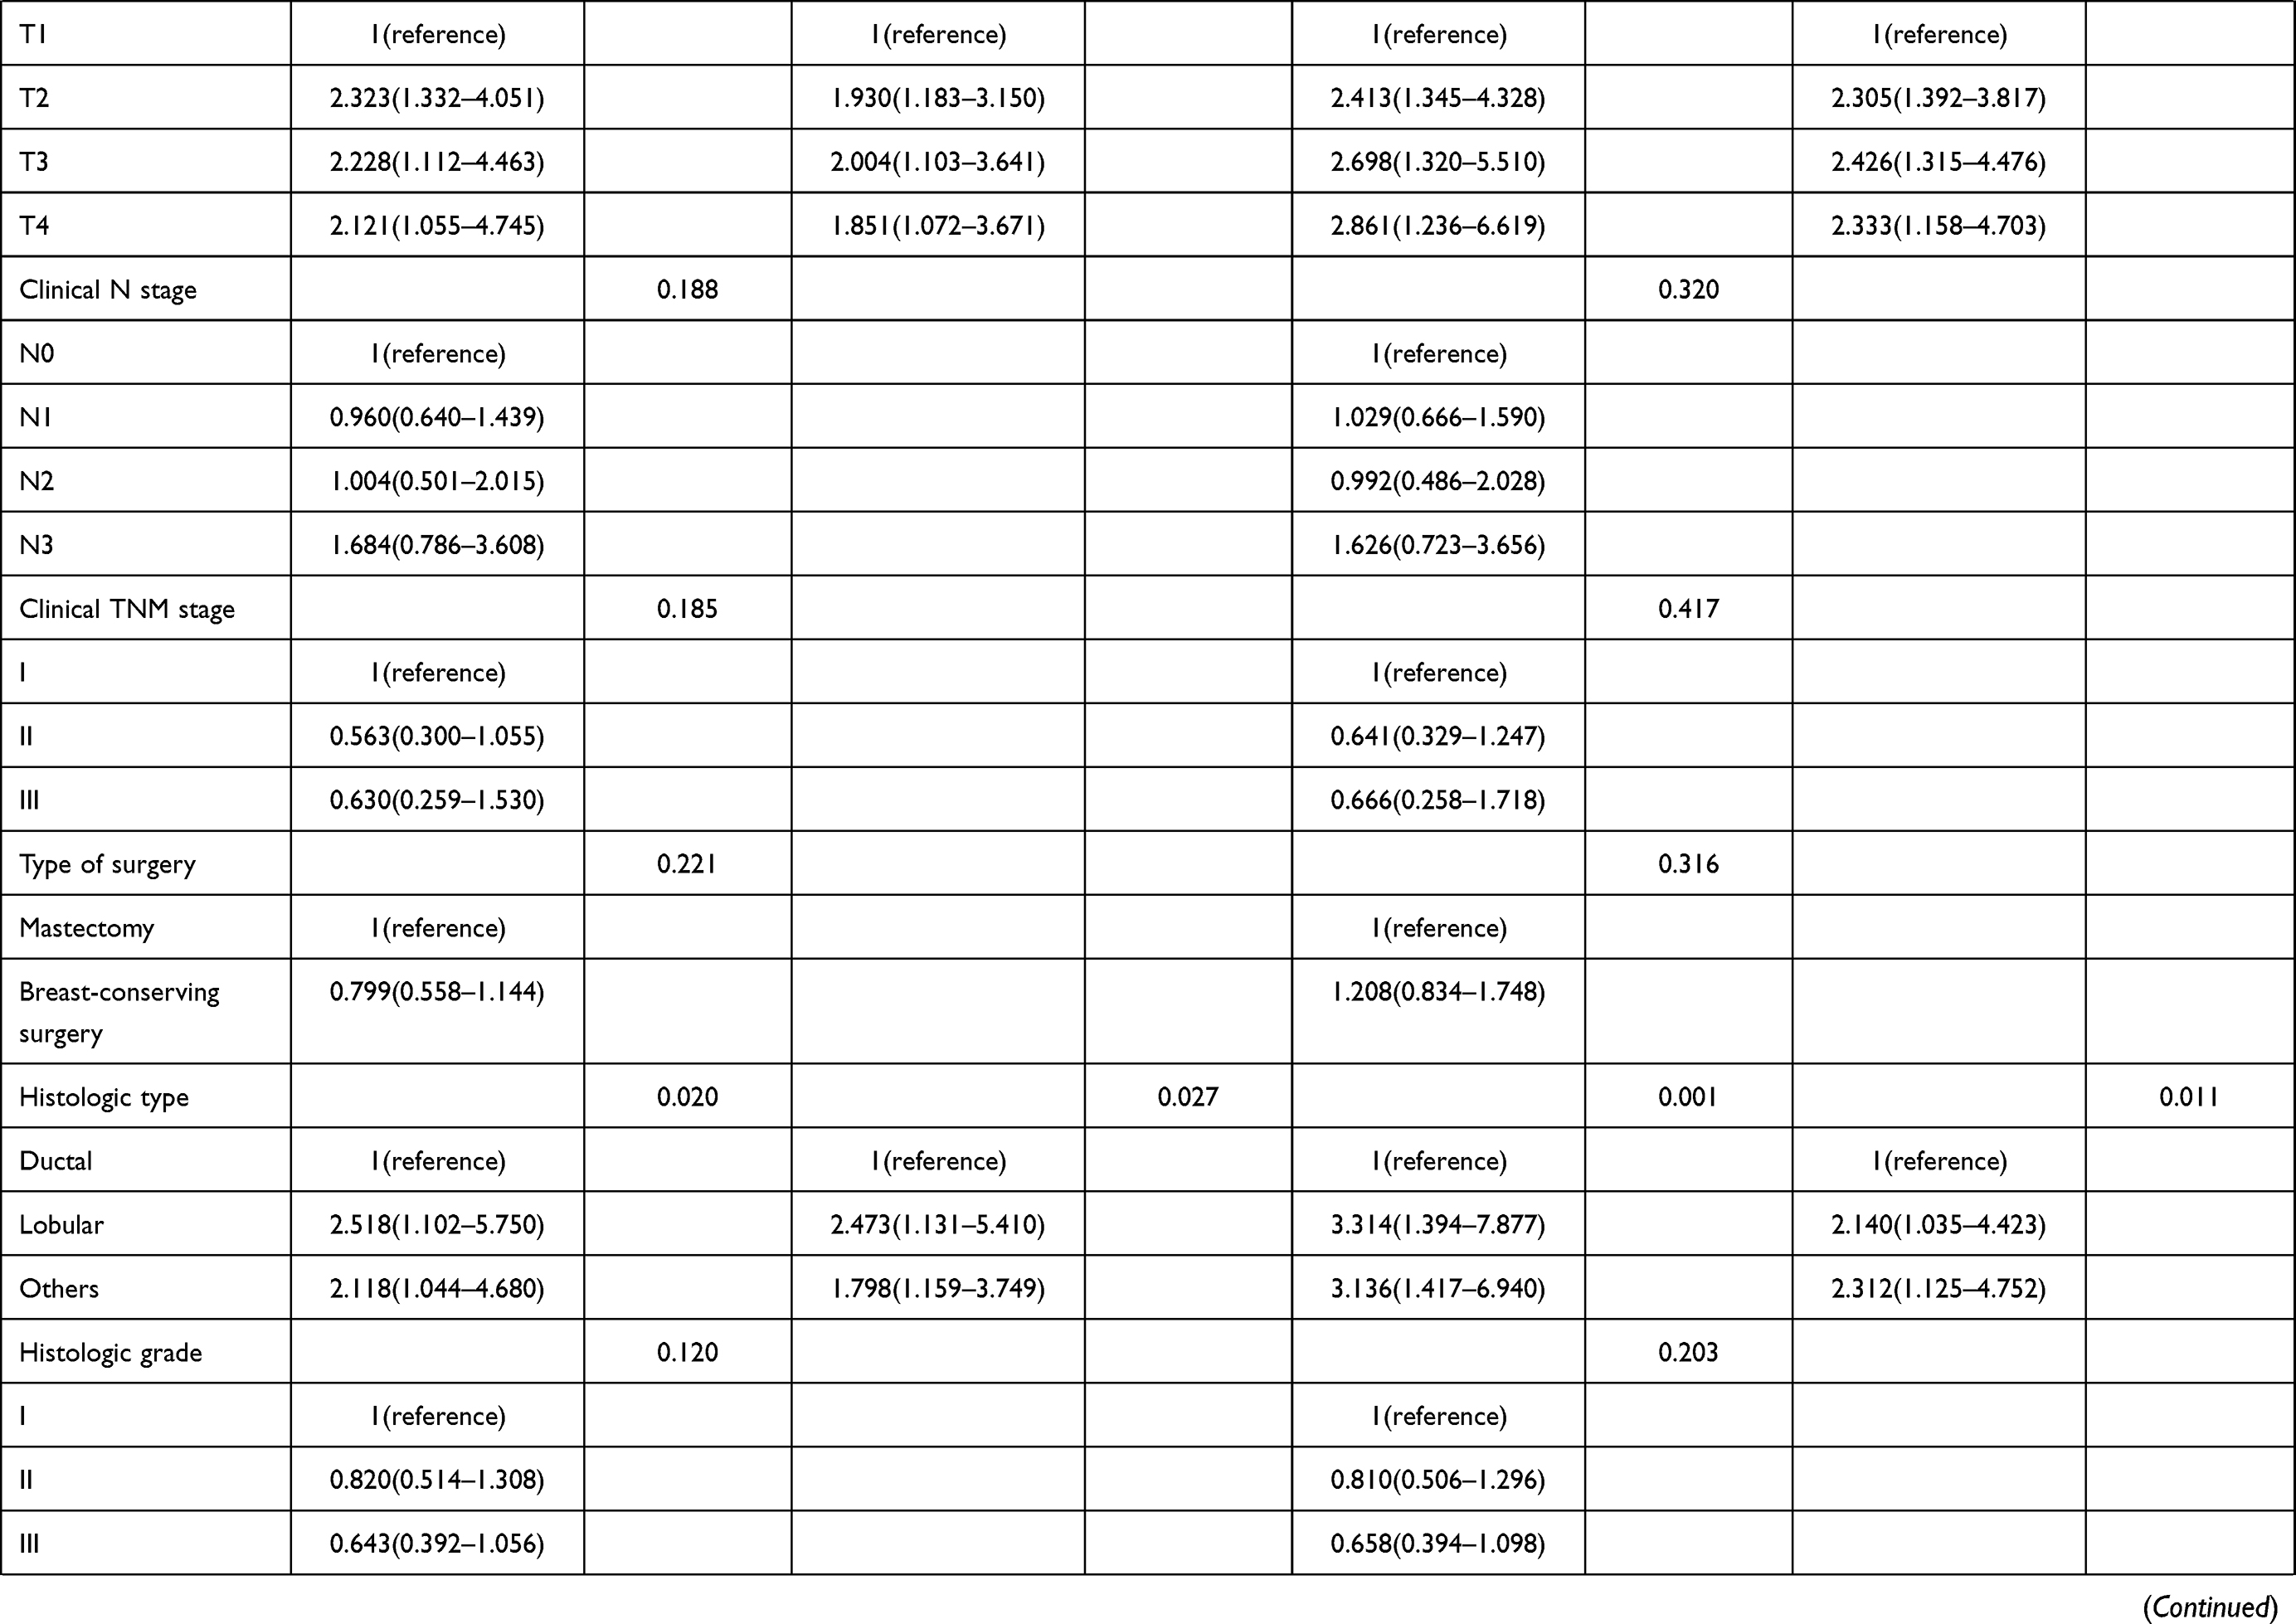 | 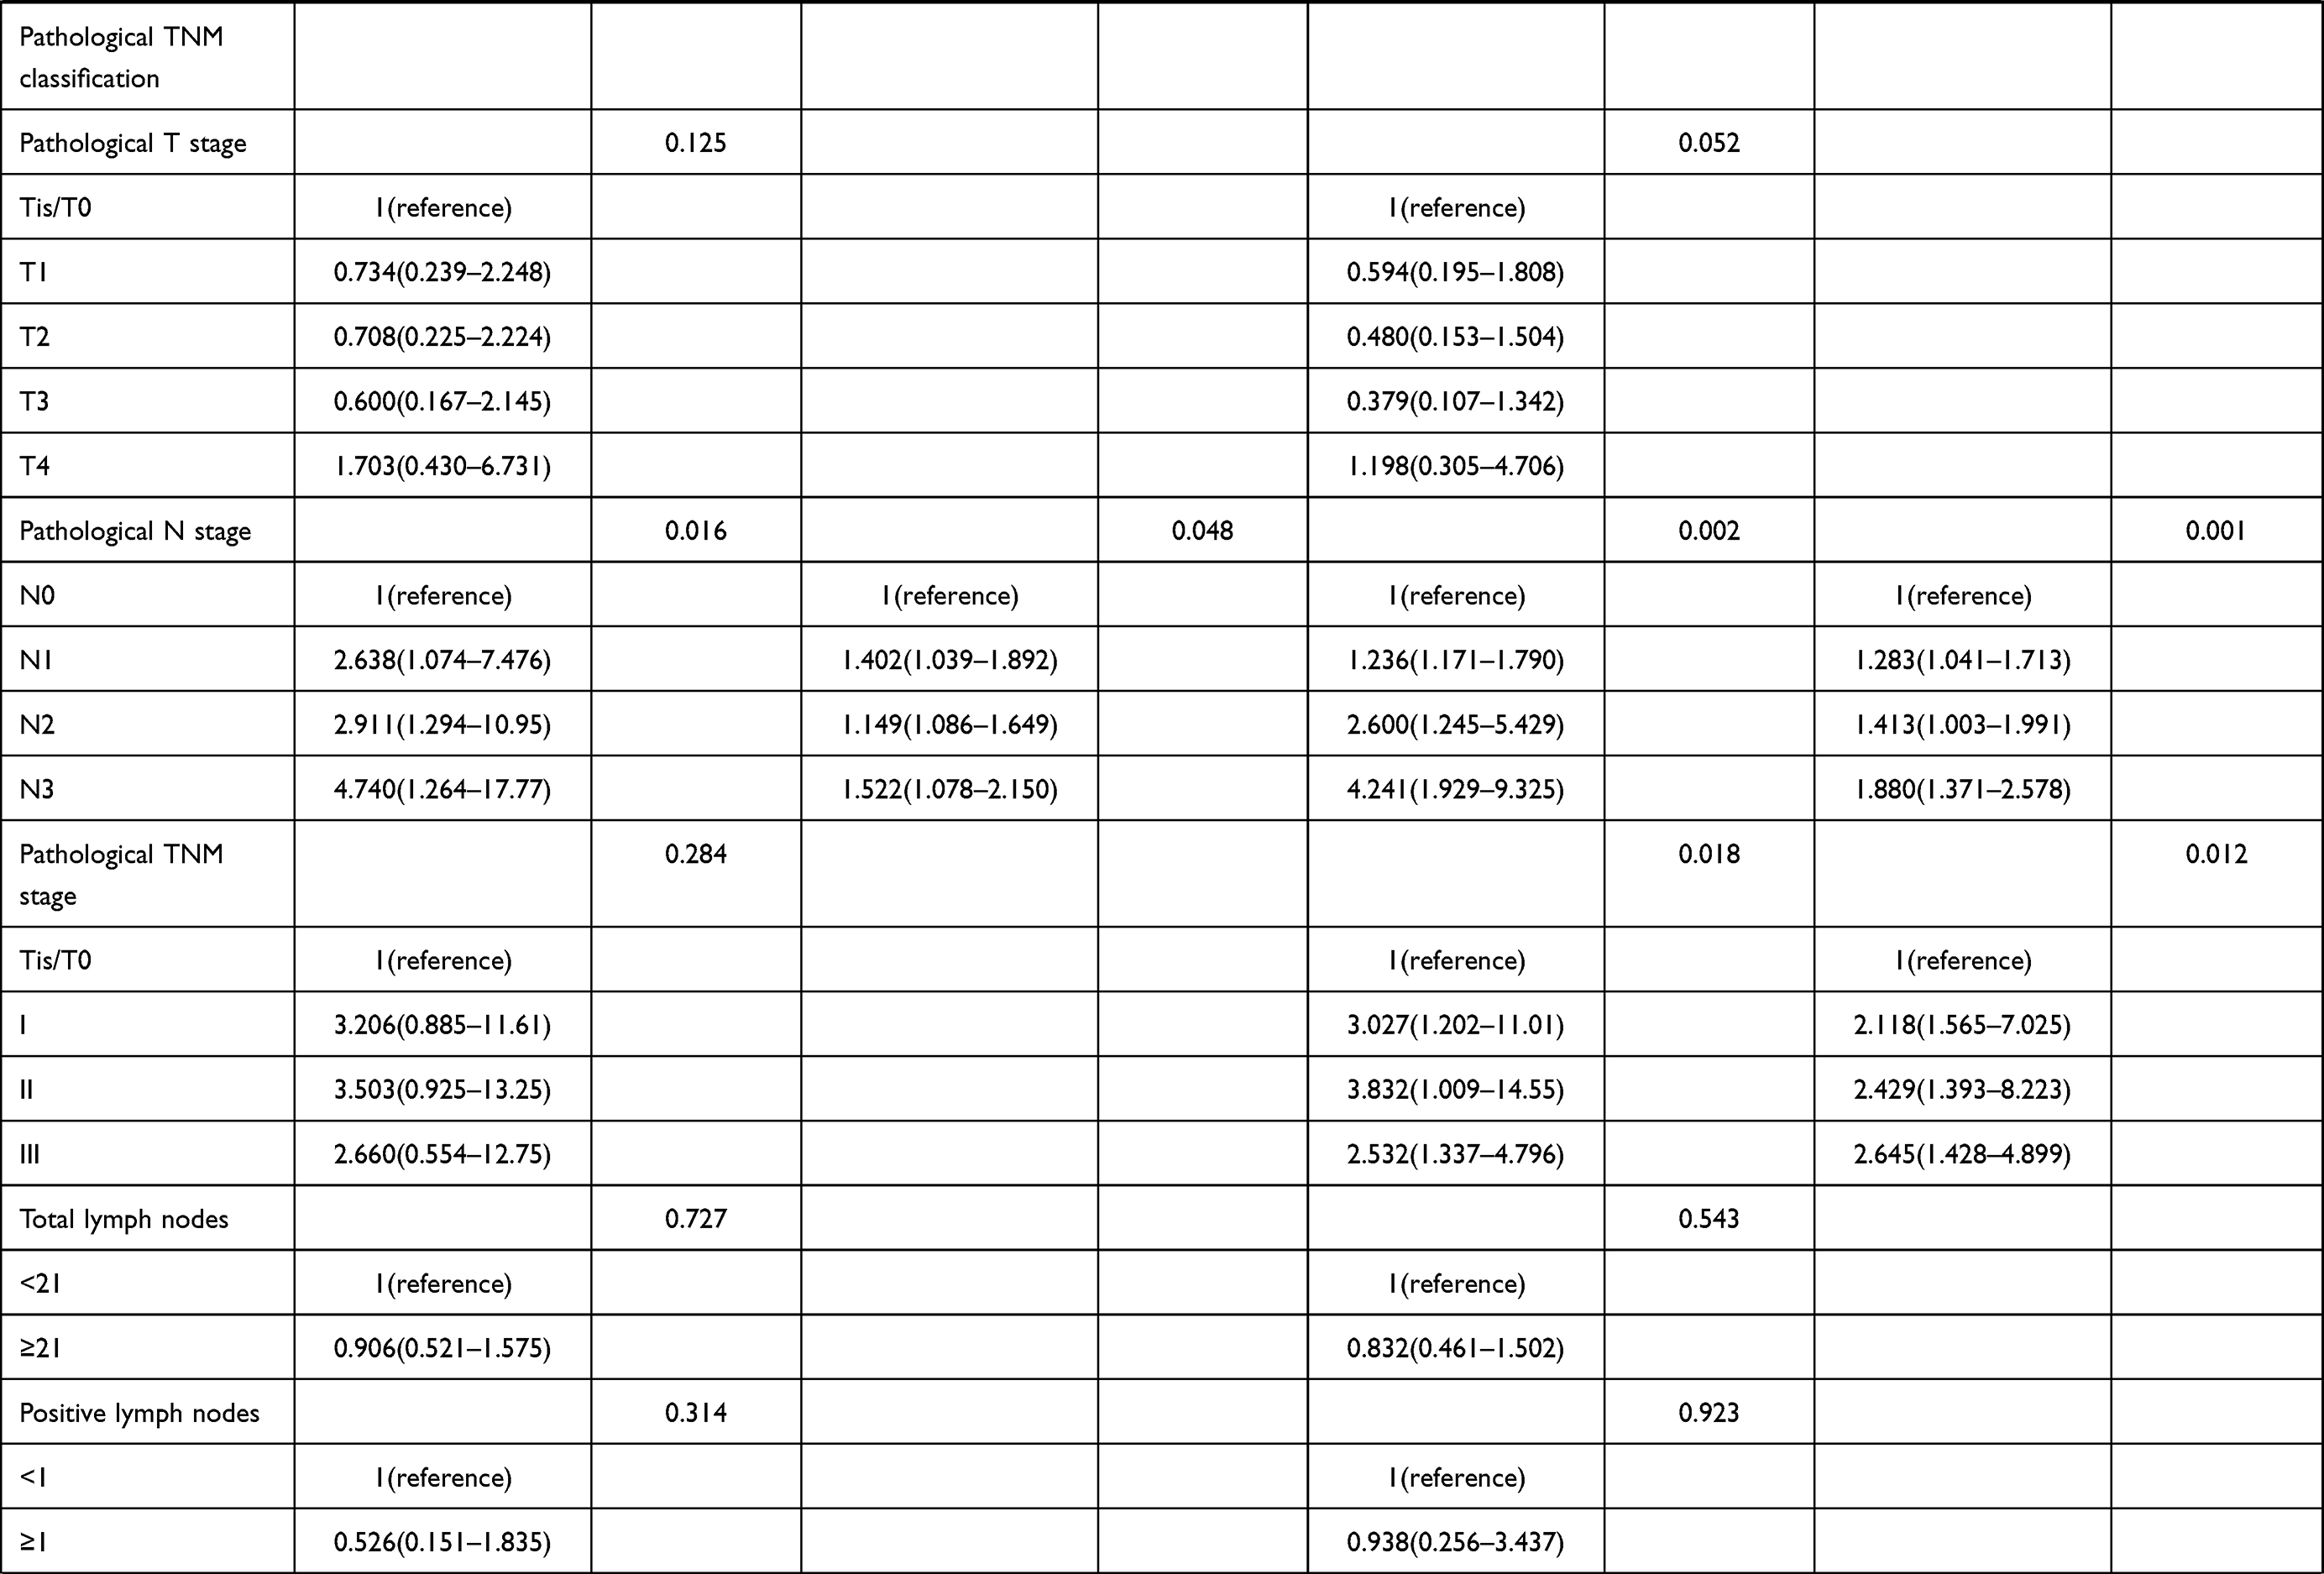 |  | 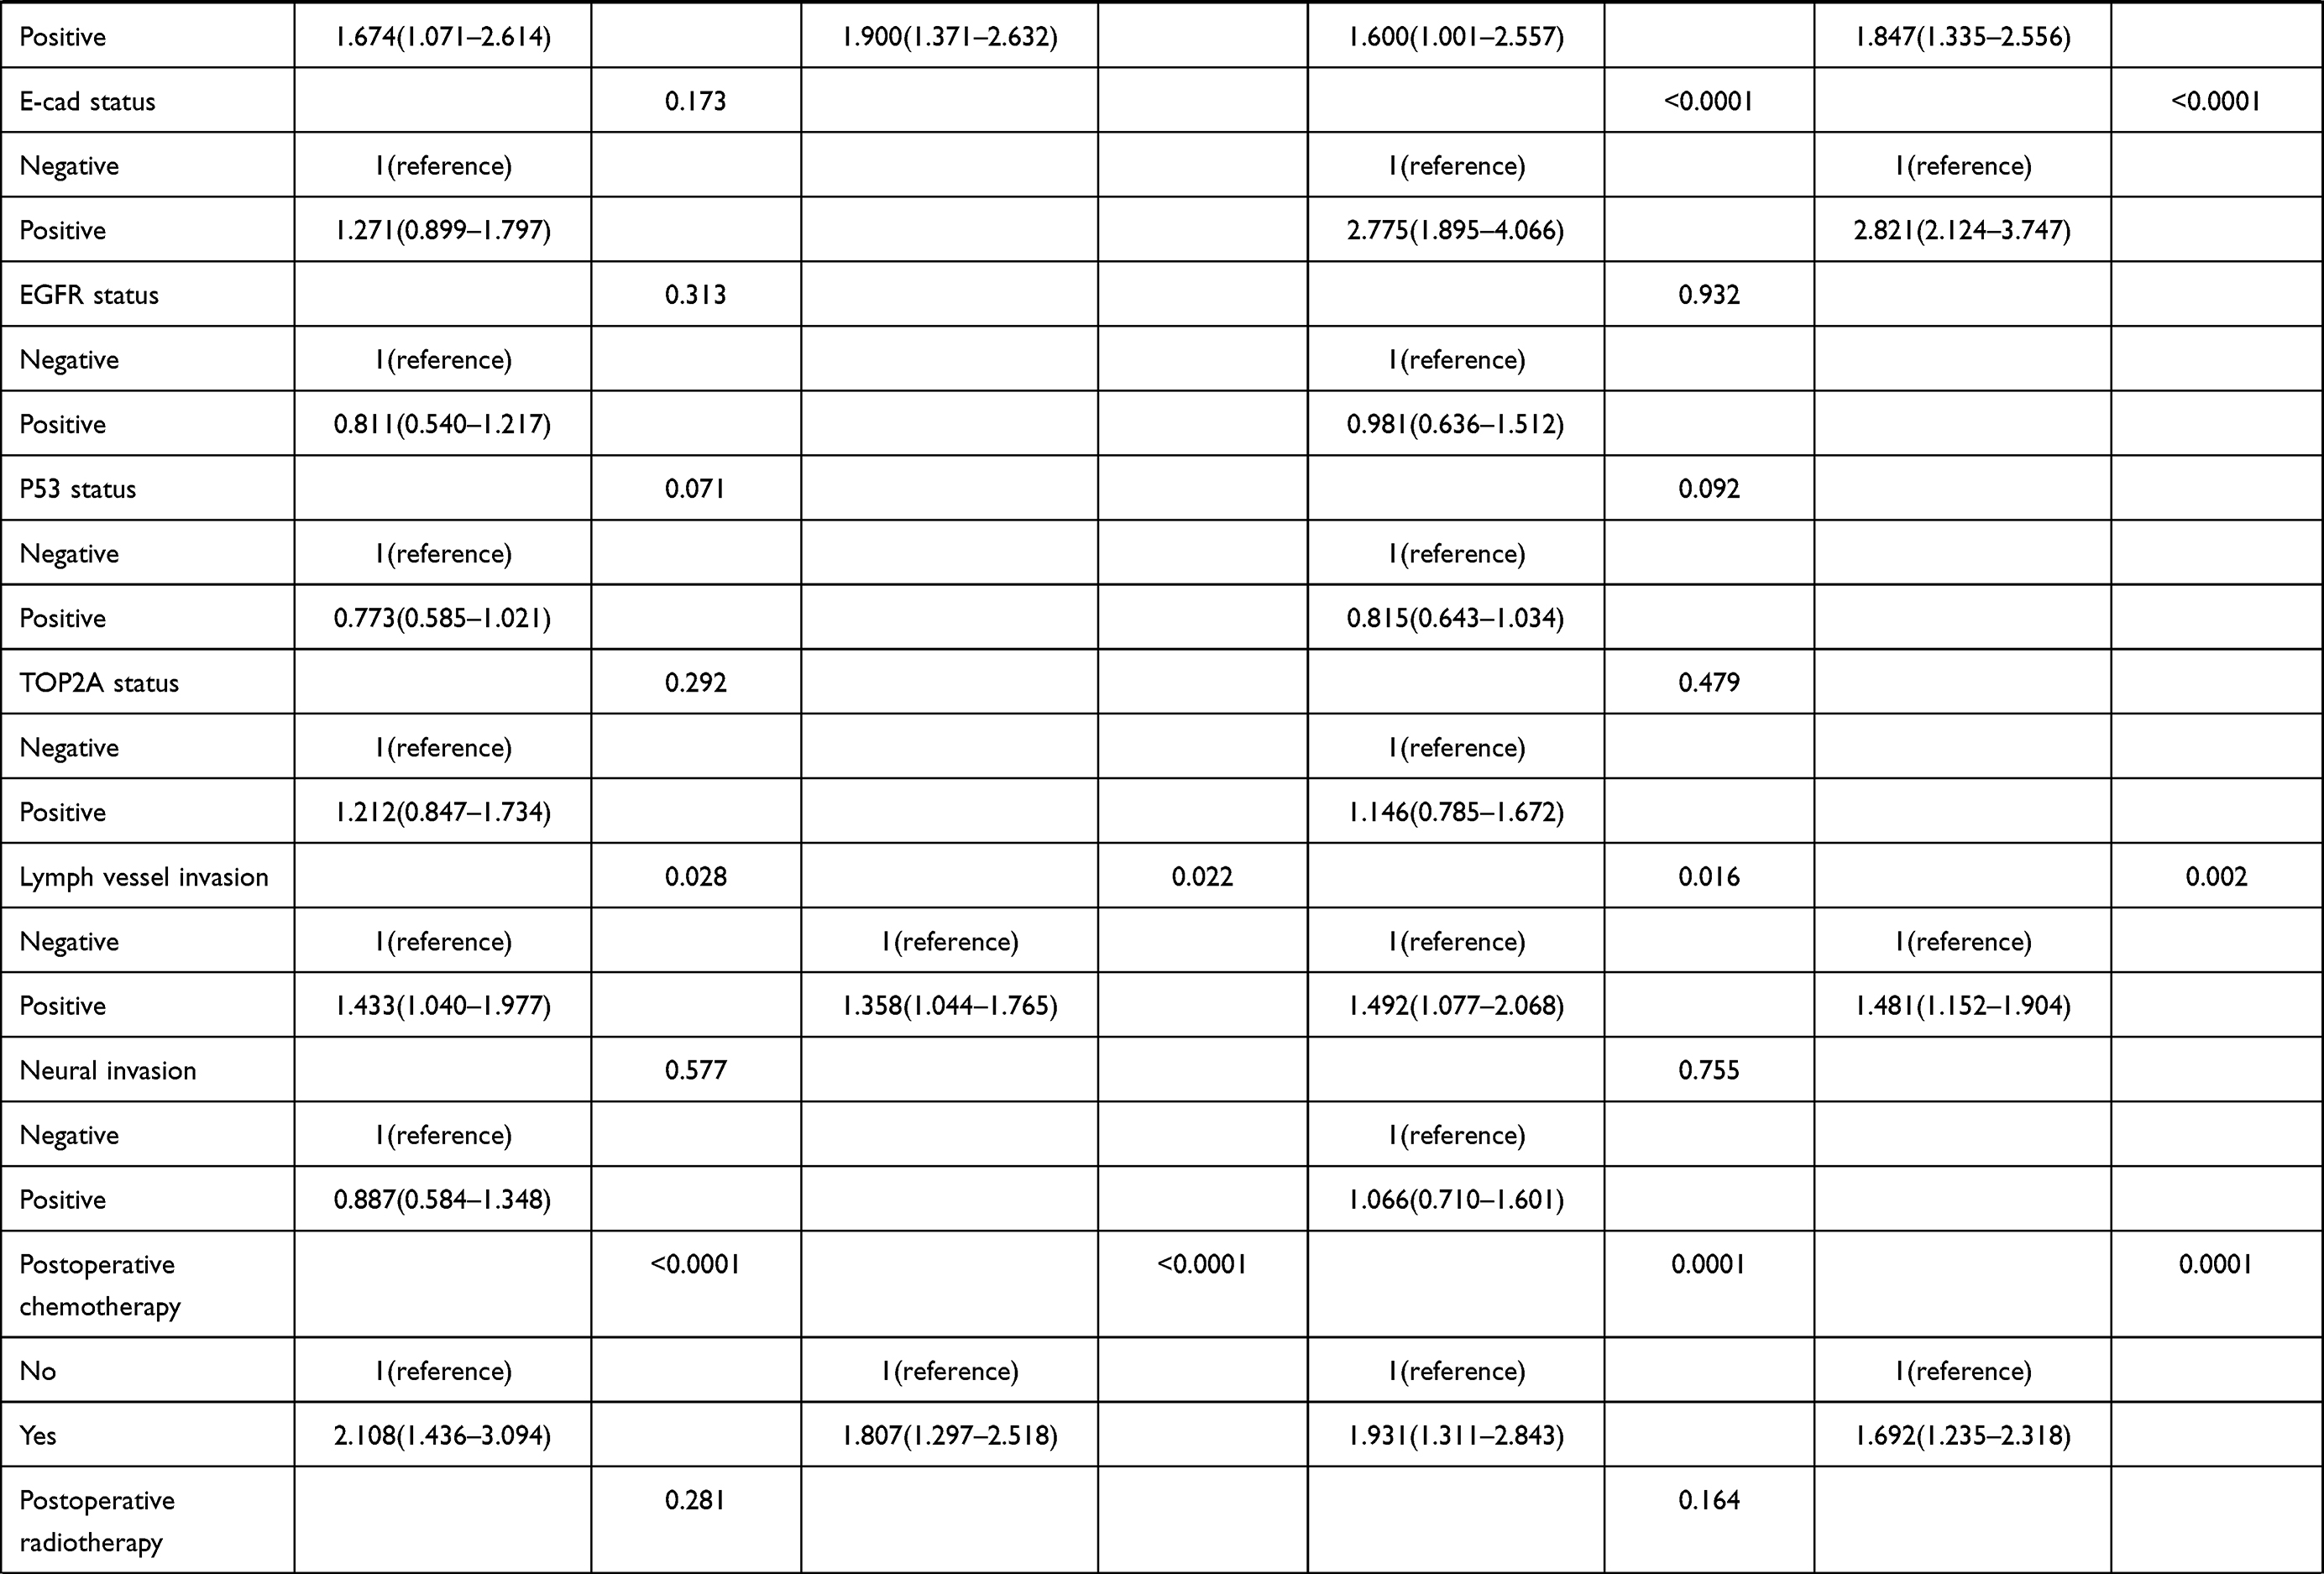 |  |
Table 3 Univariate and Multivariate Cox Regression Survival Analyses of the SII for the Prediction of DFS and OS in Breast Cancer Patients |
DFS and OS
Both univariate and multivariate analyses found SII to be an independent factor that improves DFS and OS. Univariate analysis demonstrated that the low SII group remarkably improved DFS and OS (HR: 1.965, 95% CI: 1.430–2.701, P <0.0001 and HR: 1.676, 95% CI: 1.334–2.105, P <0.0001). Subsequent multivariate analysis also mirrored these findings, with the low group SII predictive for better DFS and OS (HR: 2.086, 95% CI: 1.518–2.868, P <0.0001) and HR: 2.073, 95% CI: 1.640–2.622, P <0.0001).
The mean DFS and OS in the low group were 46.65 months (3.10–238.00 months) and 69.92 months (6.43–260.00 months); The mean survival time of DFS and OS in the high SII group was 27.37 months (3.13–205.50 months) and 49.53 months (10.77–247.30 months). Log-rank analysis showed that the mean survival time of DFS and OS in the low SII group was significantly higher than that in the high SII group (χ2=19.840, P <0.0001 and χ2=24.050, P <0.0001) (Figure 1).
 |
Figure 1 DFS and OS of breast cancer patients. (A) Kaplan–Meier analysis of DFS for the SII of all patients with breast cancer. (B) Kaplan–Meier analysis of OS for the SII of all patients with breast cancer. (C) Kaplan–Meier analysis of DFS for the SII of patients with breast cancer (NACT group). (D) Kaplan–Meier analysis of OS for the SII of patients with breast cancer (NACT group). (E) Kaplan–Meier analysis of DFS for the SII of patients with breast cancer (non-NACT group). (F) Kaplan–Meier analysis of OS for the SII of patients with breast cancer (non-NACT group). |
SII and Pathological TNM Stage
Both univariate and multivariate pathology revealed that the N stage represented an independent influencer of DFS and OS. Moreover, the pathological TNM stage also represented an independent factor of OS. To further analyze the SII prognostic value, we analyzed the relationship between SII and the TNM stage. We defined pathological stages Tis/T0+I as early breast cancer and pathological stage II+III as advanced breast cancer.
Patients in the low SII group with early-stage breast cancer had significantly longer mean DFS and OS in contrast to those with high SII indices (χ2=6.119, P=0.013, and χ2=9.155, P=0.003). Similarly, patients in the low SII group with advanced breast cancer had significantly longer mean DFS and OS in contrast to those with high SII indices (χ2=13.320, P=0.0003, and χ2=15.460, P <0.0001) (Figure 2).
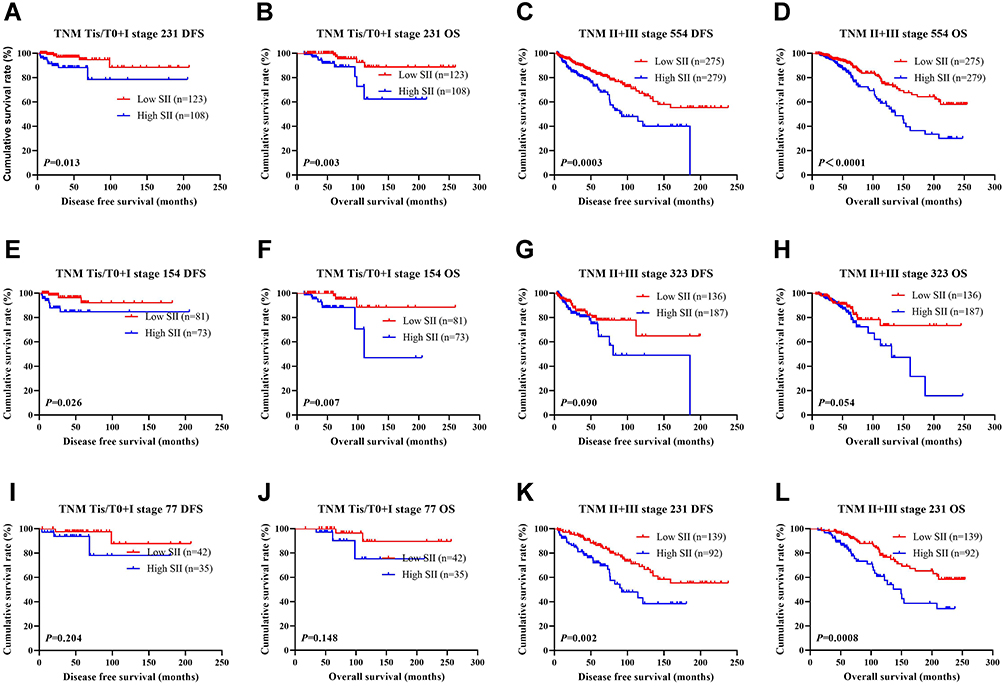 |
Figure 2 DFS and OS based on SII scores of patients with breast cancer of different pathological stage. (A) Kaplan–Meier analysis of DFS for the SII of patients with early breast cancer. (B) Kaplan–Meier analysis of OS for the SII of patients with early breast cancer. (C) Kaplan–Meier analysis of DFS for the SII of patients with advanced breast cancer. (D) Kaplan–Meier analysis of OS for the SII of patients with advanced breast cancer. (E) Kaplan–Meier analysis of DFS for the SII of patients with early breast cancer (NACT group). (F) Kaplan–Meier analysis of OS for the SII of patients with early breast cancer (NACT group). (G) Kaplan–Meier analysis of DFS for the SII of patients with advanced breast cancer (NACT group). (H) Kaplan–Meier analysis of OS for the SII of patients with advanced breast cancer (NACT group). (I) Kaplan–Meier analysis of DFS for the SII of patients with early breast cancer (non-NACT group). (J) Kaplan–Meier analysis of OS for the SII of patients with early breast cancer (non-NACT group). (K) Kaplan–Meier analysis of DFS for the SII of patients with advanced breast cancer (non-NACT group). (L) Kaplan–Meier analysis of OS for the SII of patients with advanced breast cancer (non-NACT group). |
Molecular Type and SII in Breast Cancer
Another independent factor of DFS and OS was the molecular subtype of breast cancer, as uncovered by both univariate and multivariate analyses. Of the 785 patients, 62 were Luminal A, 98 were Luminal B HER2-positive, 325 were Luminal B HER2-negative, 129 were HER2-overexpressing, and 171 were triple-negative. Table 4 shows the detailed information of the molecular type of breast cancer.
- In all breast cancer patients, AR (χ2=14.812, P=0.0002), E-cad (χ2=22.464, P <0.0001), TOP2A (χ2=5.817, P=0.016), lymph vessel invasion (χ2=9.036, P=0.003), nerve invasion (χ2=4.329, P=0.038) were statistically significant.
- In the NACT group (477 patients), AR (χ2=8.194, P=0.004), E-cad (χ2=5.013, P=0.025), P53 (χ2=4.437, P=0.035) and lymph vessel invasion (χ2=4.160, P=0.041) were statistically significant.
- In the non-NACT group (308 breast cancer patients), E-cad (χ2=13.277, P=0.0003) and TOP2A (χ2=5.731, P=0.017) were statistically significant.
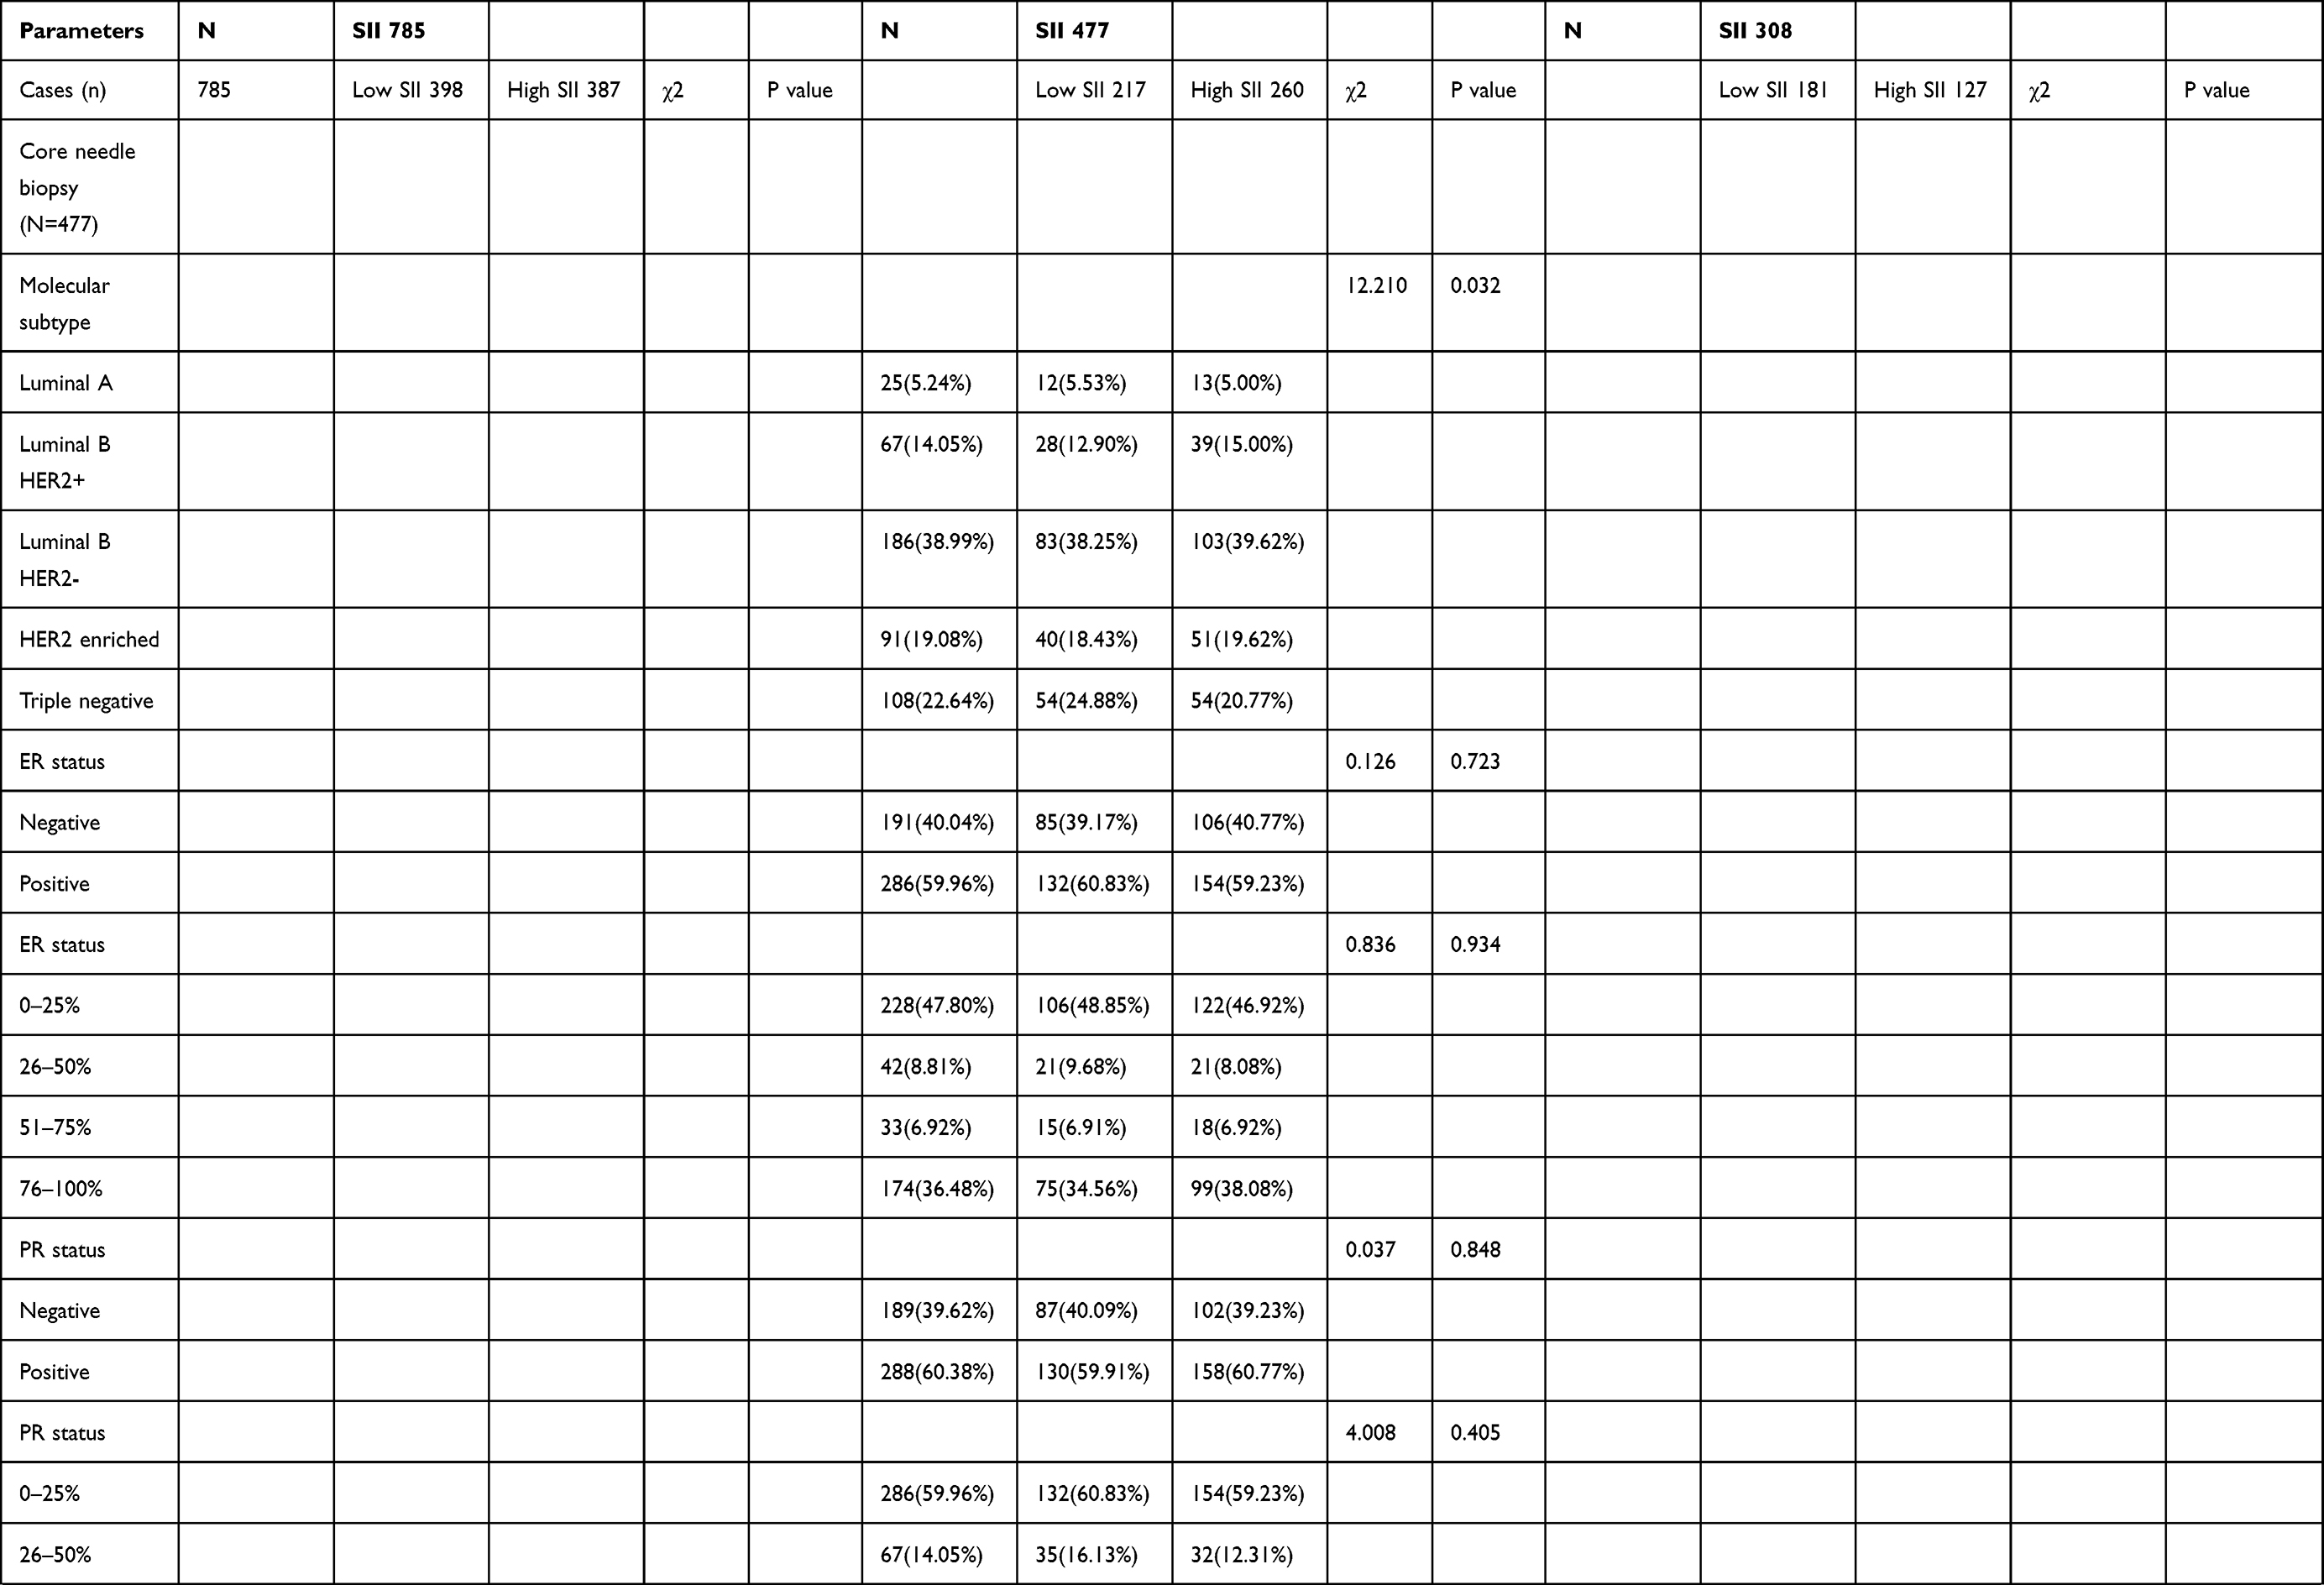 | 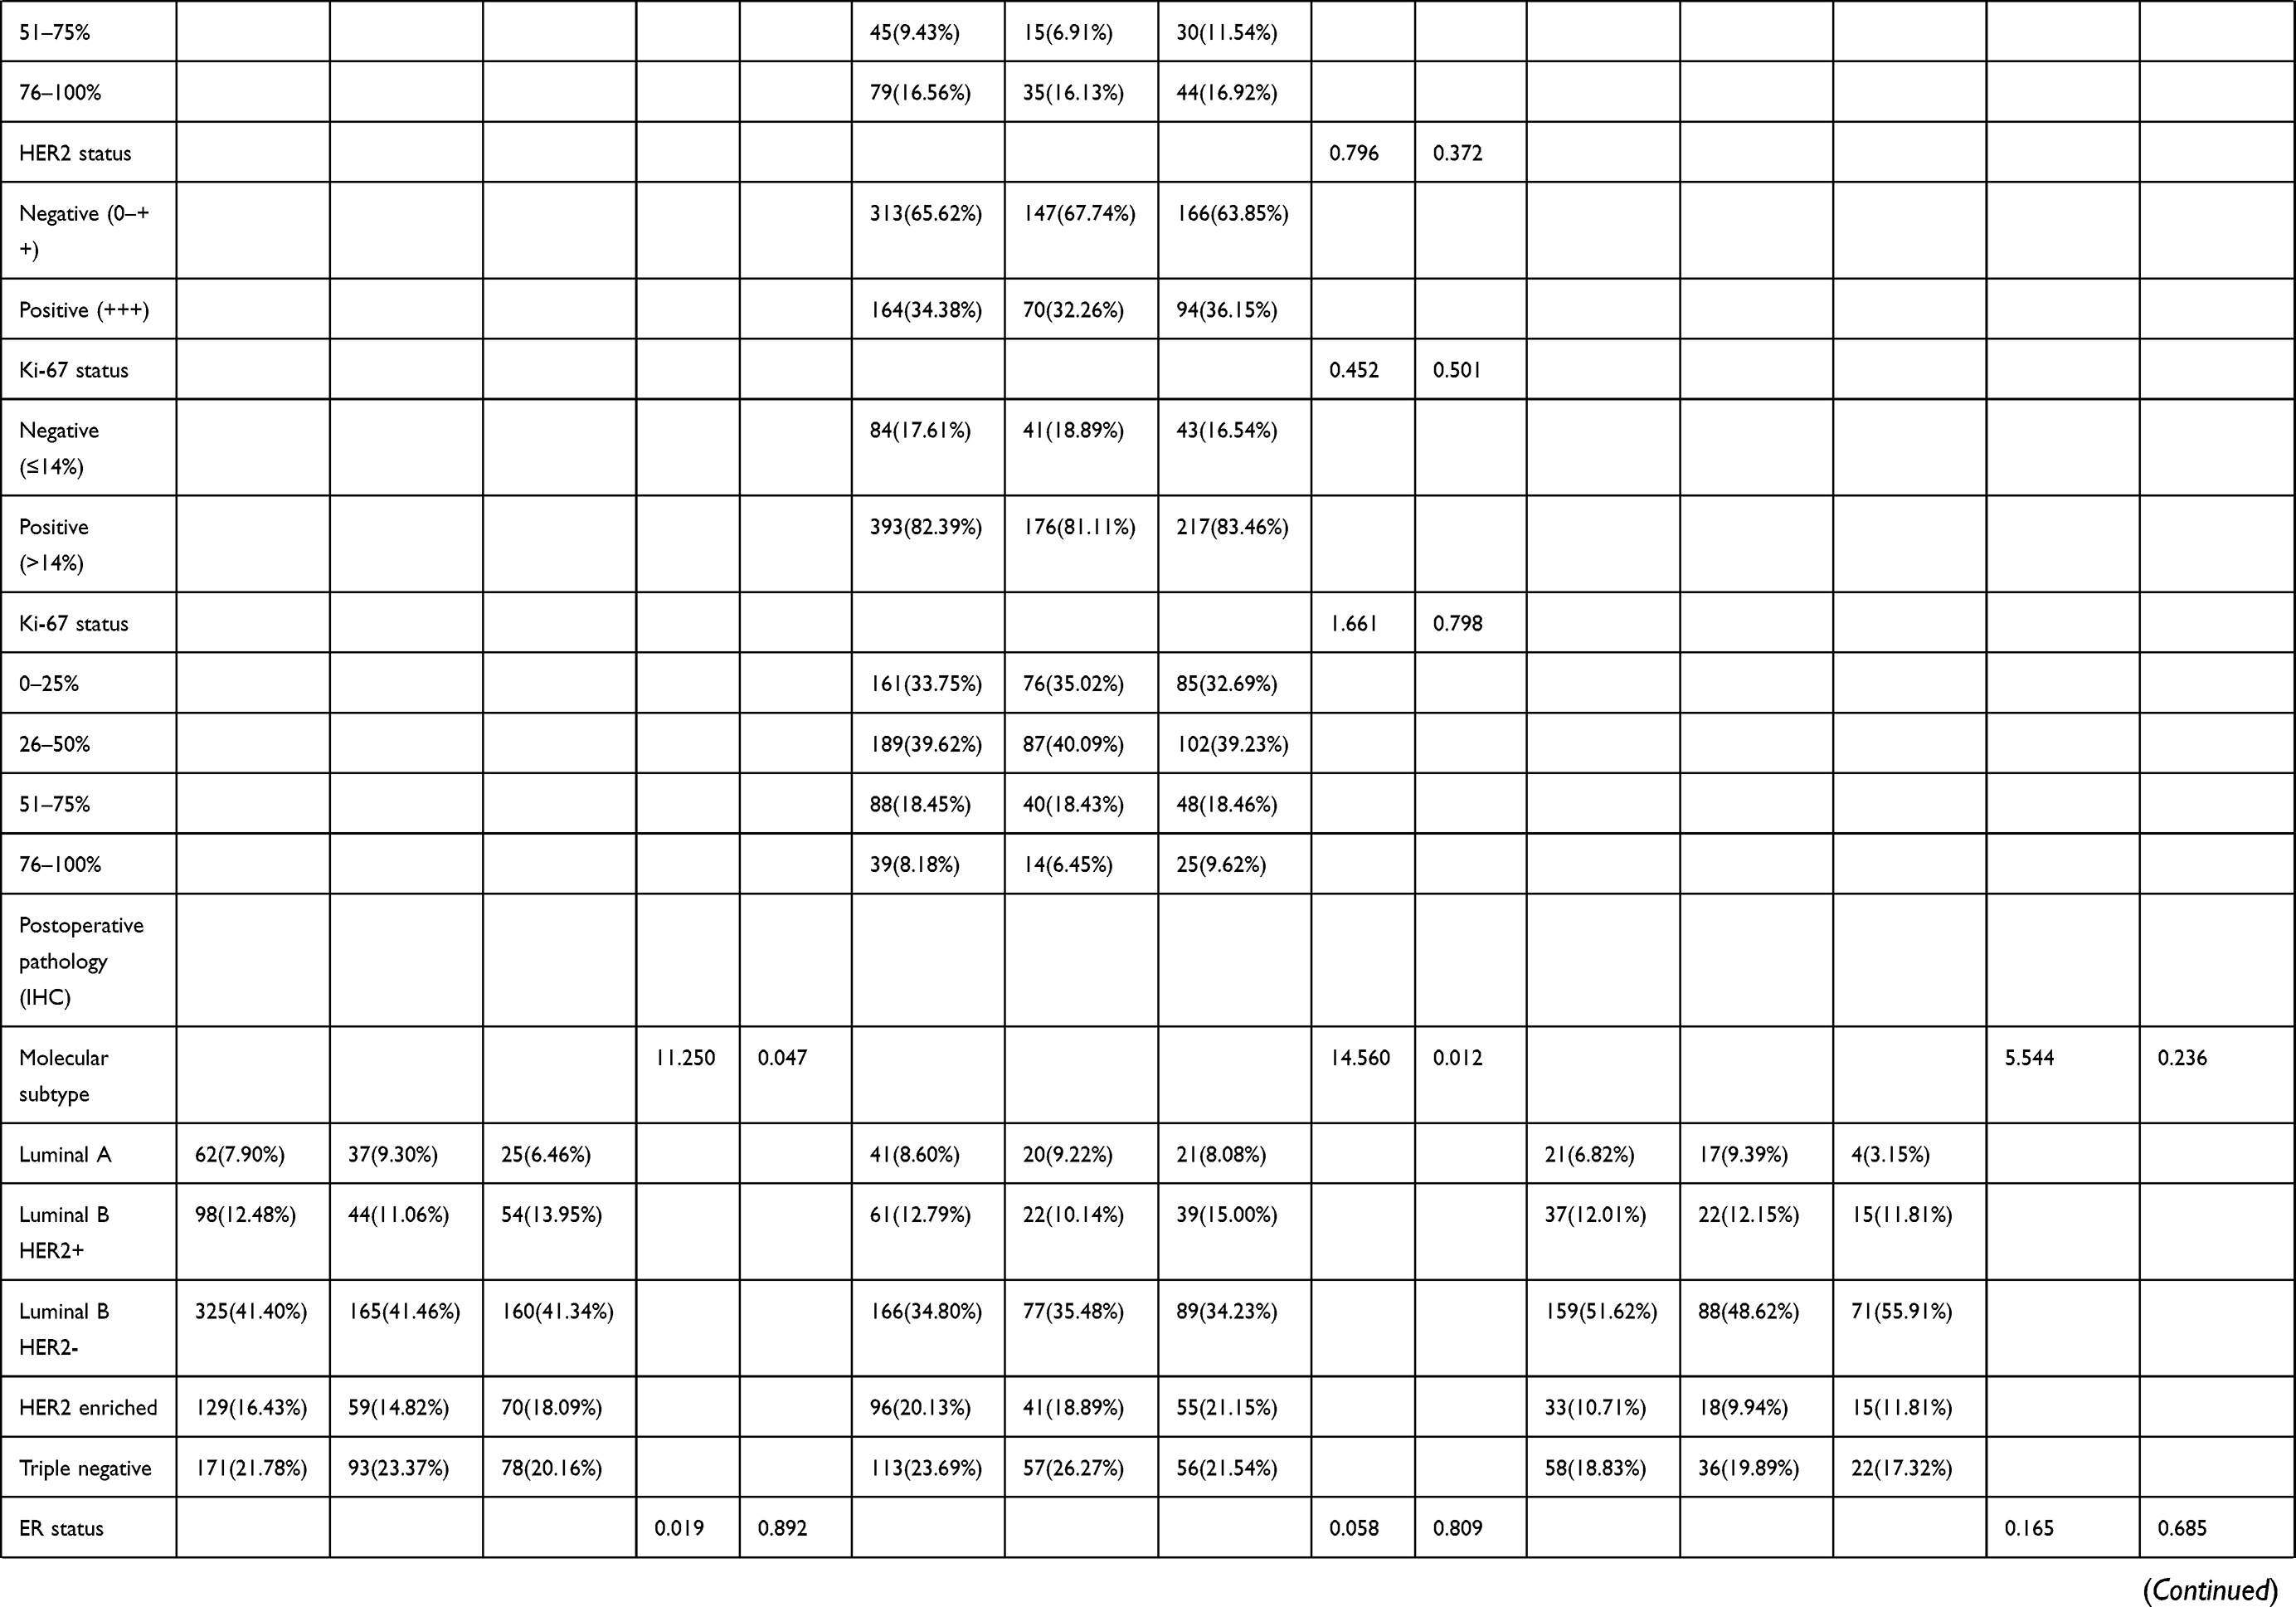 | 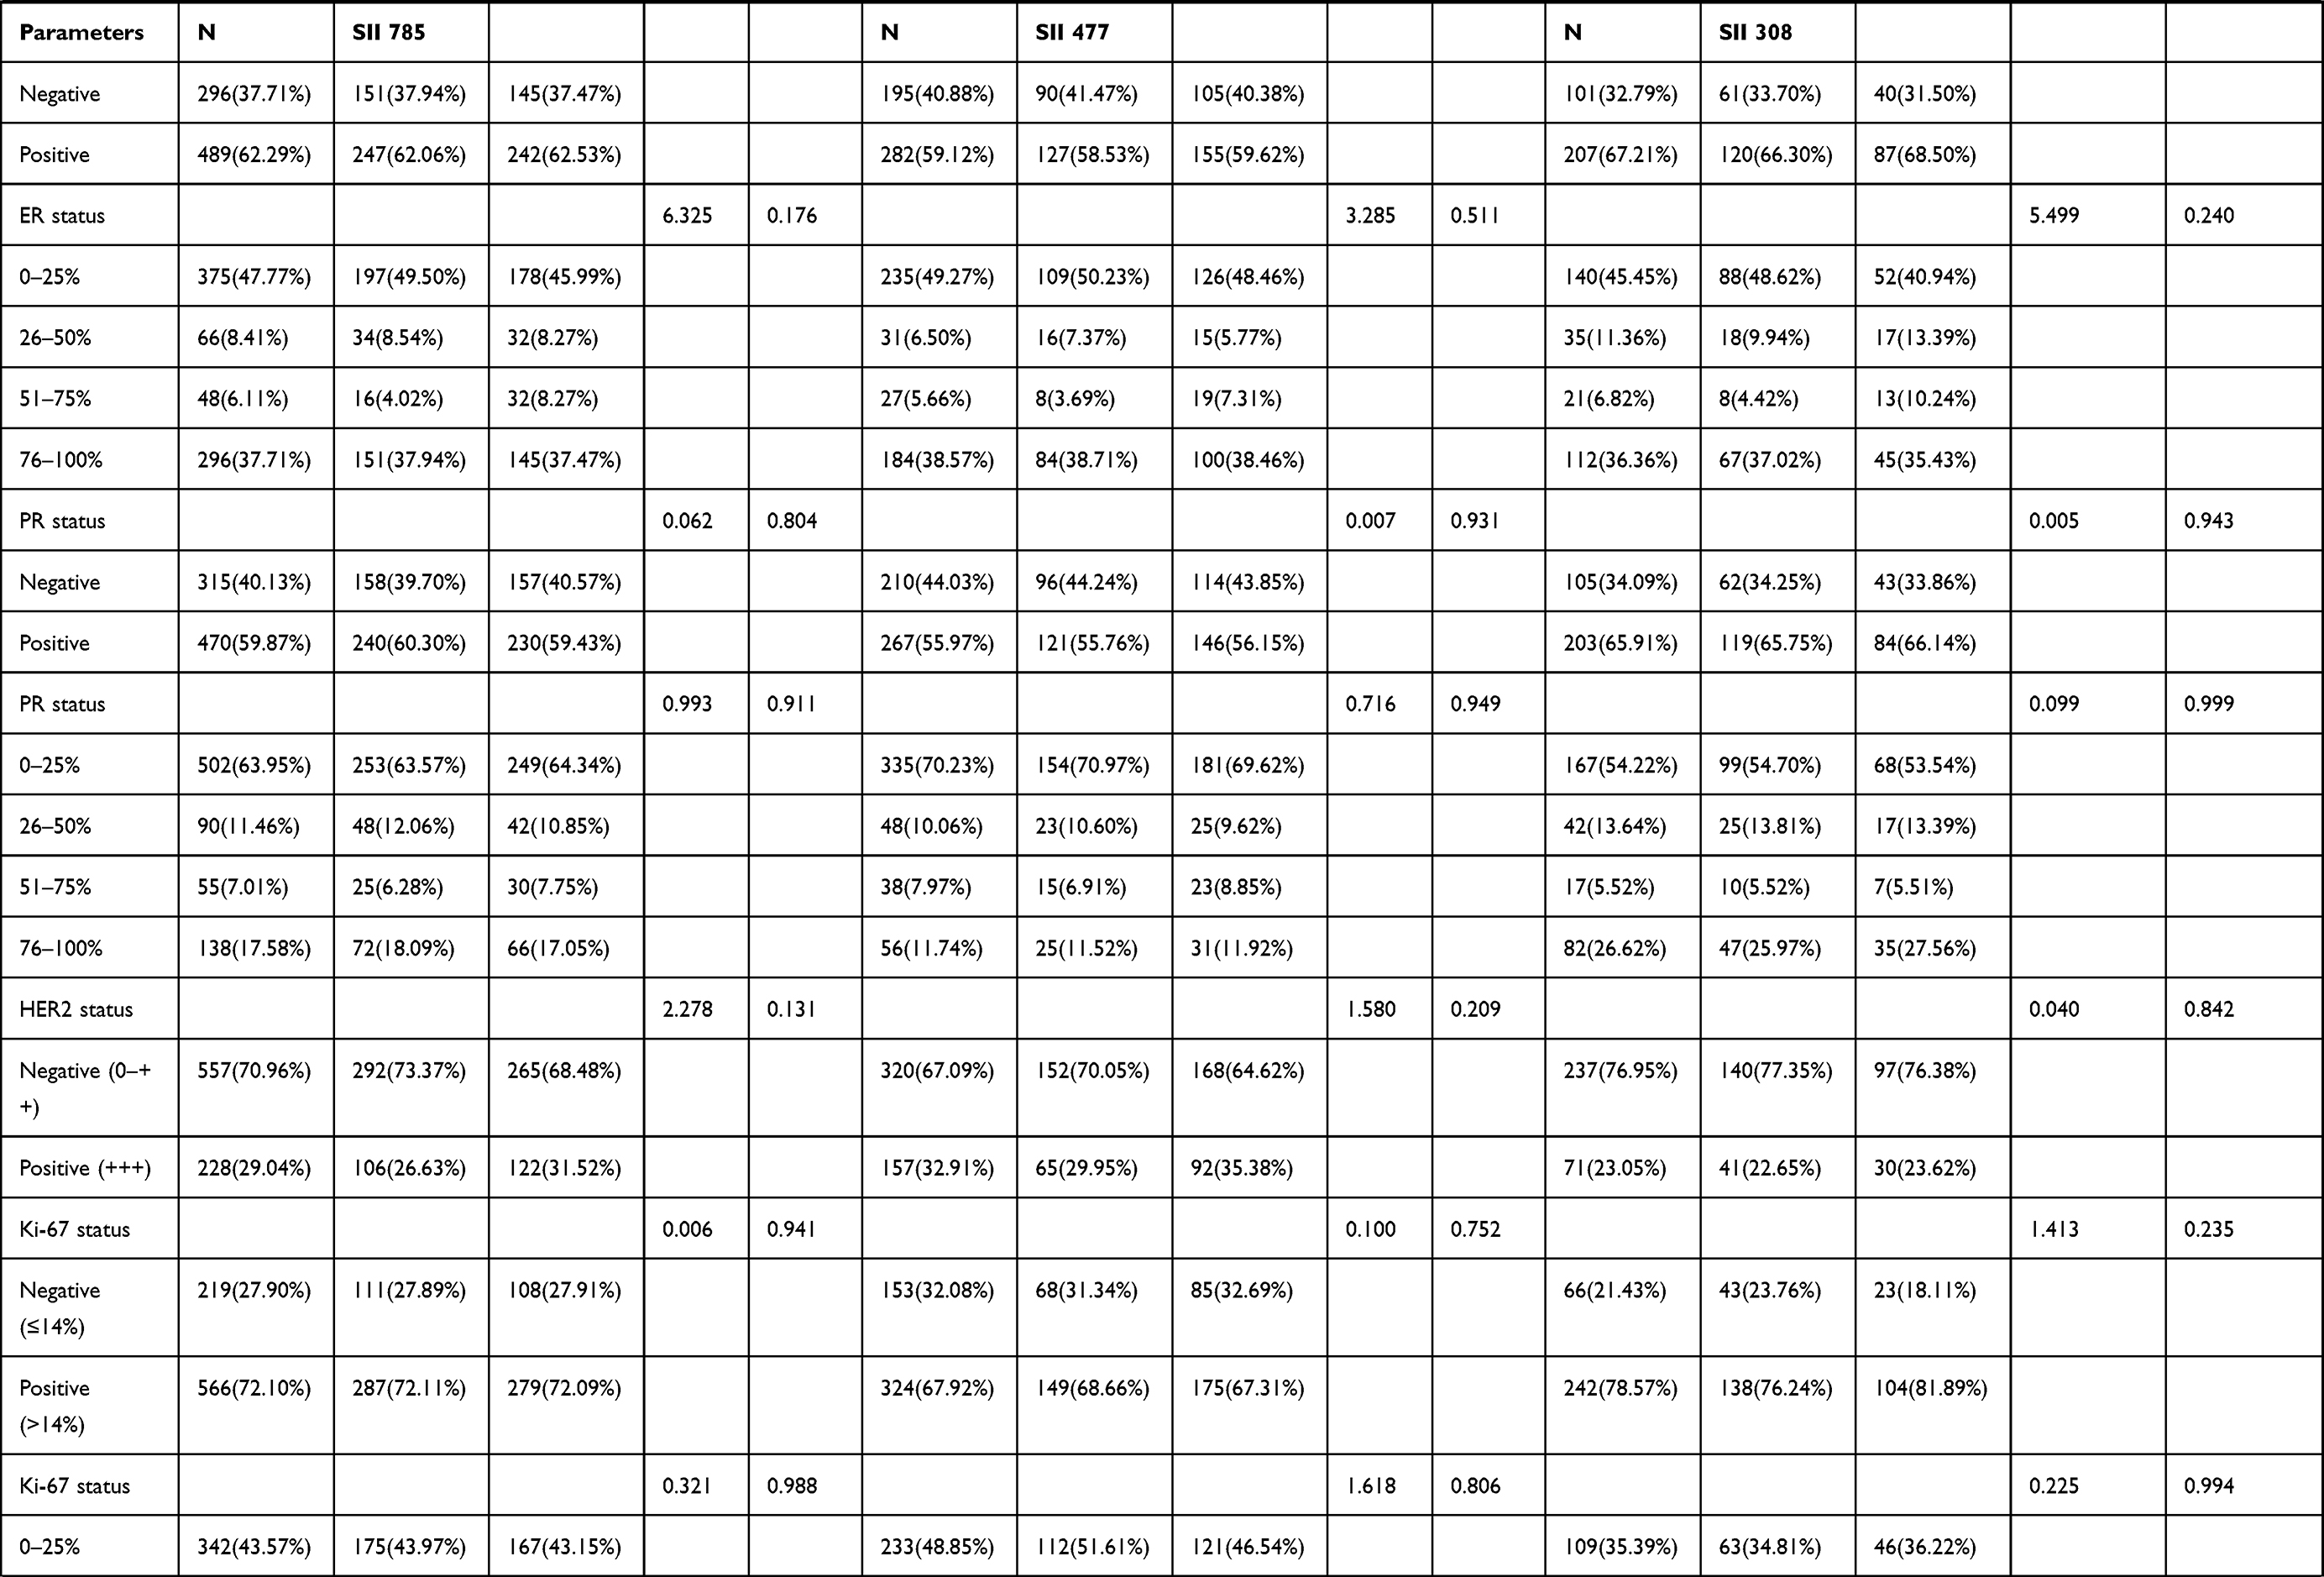 | 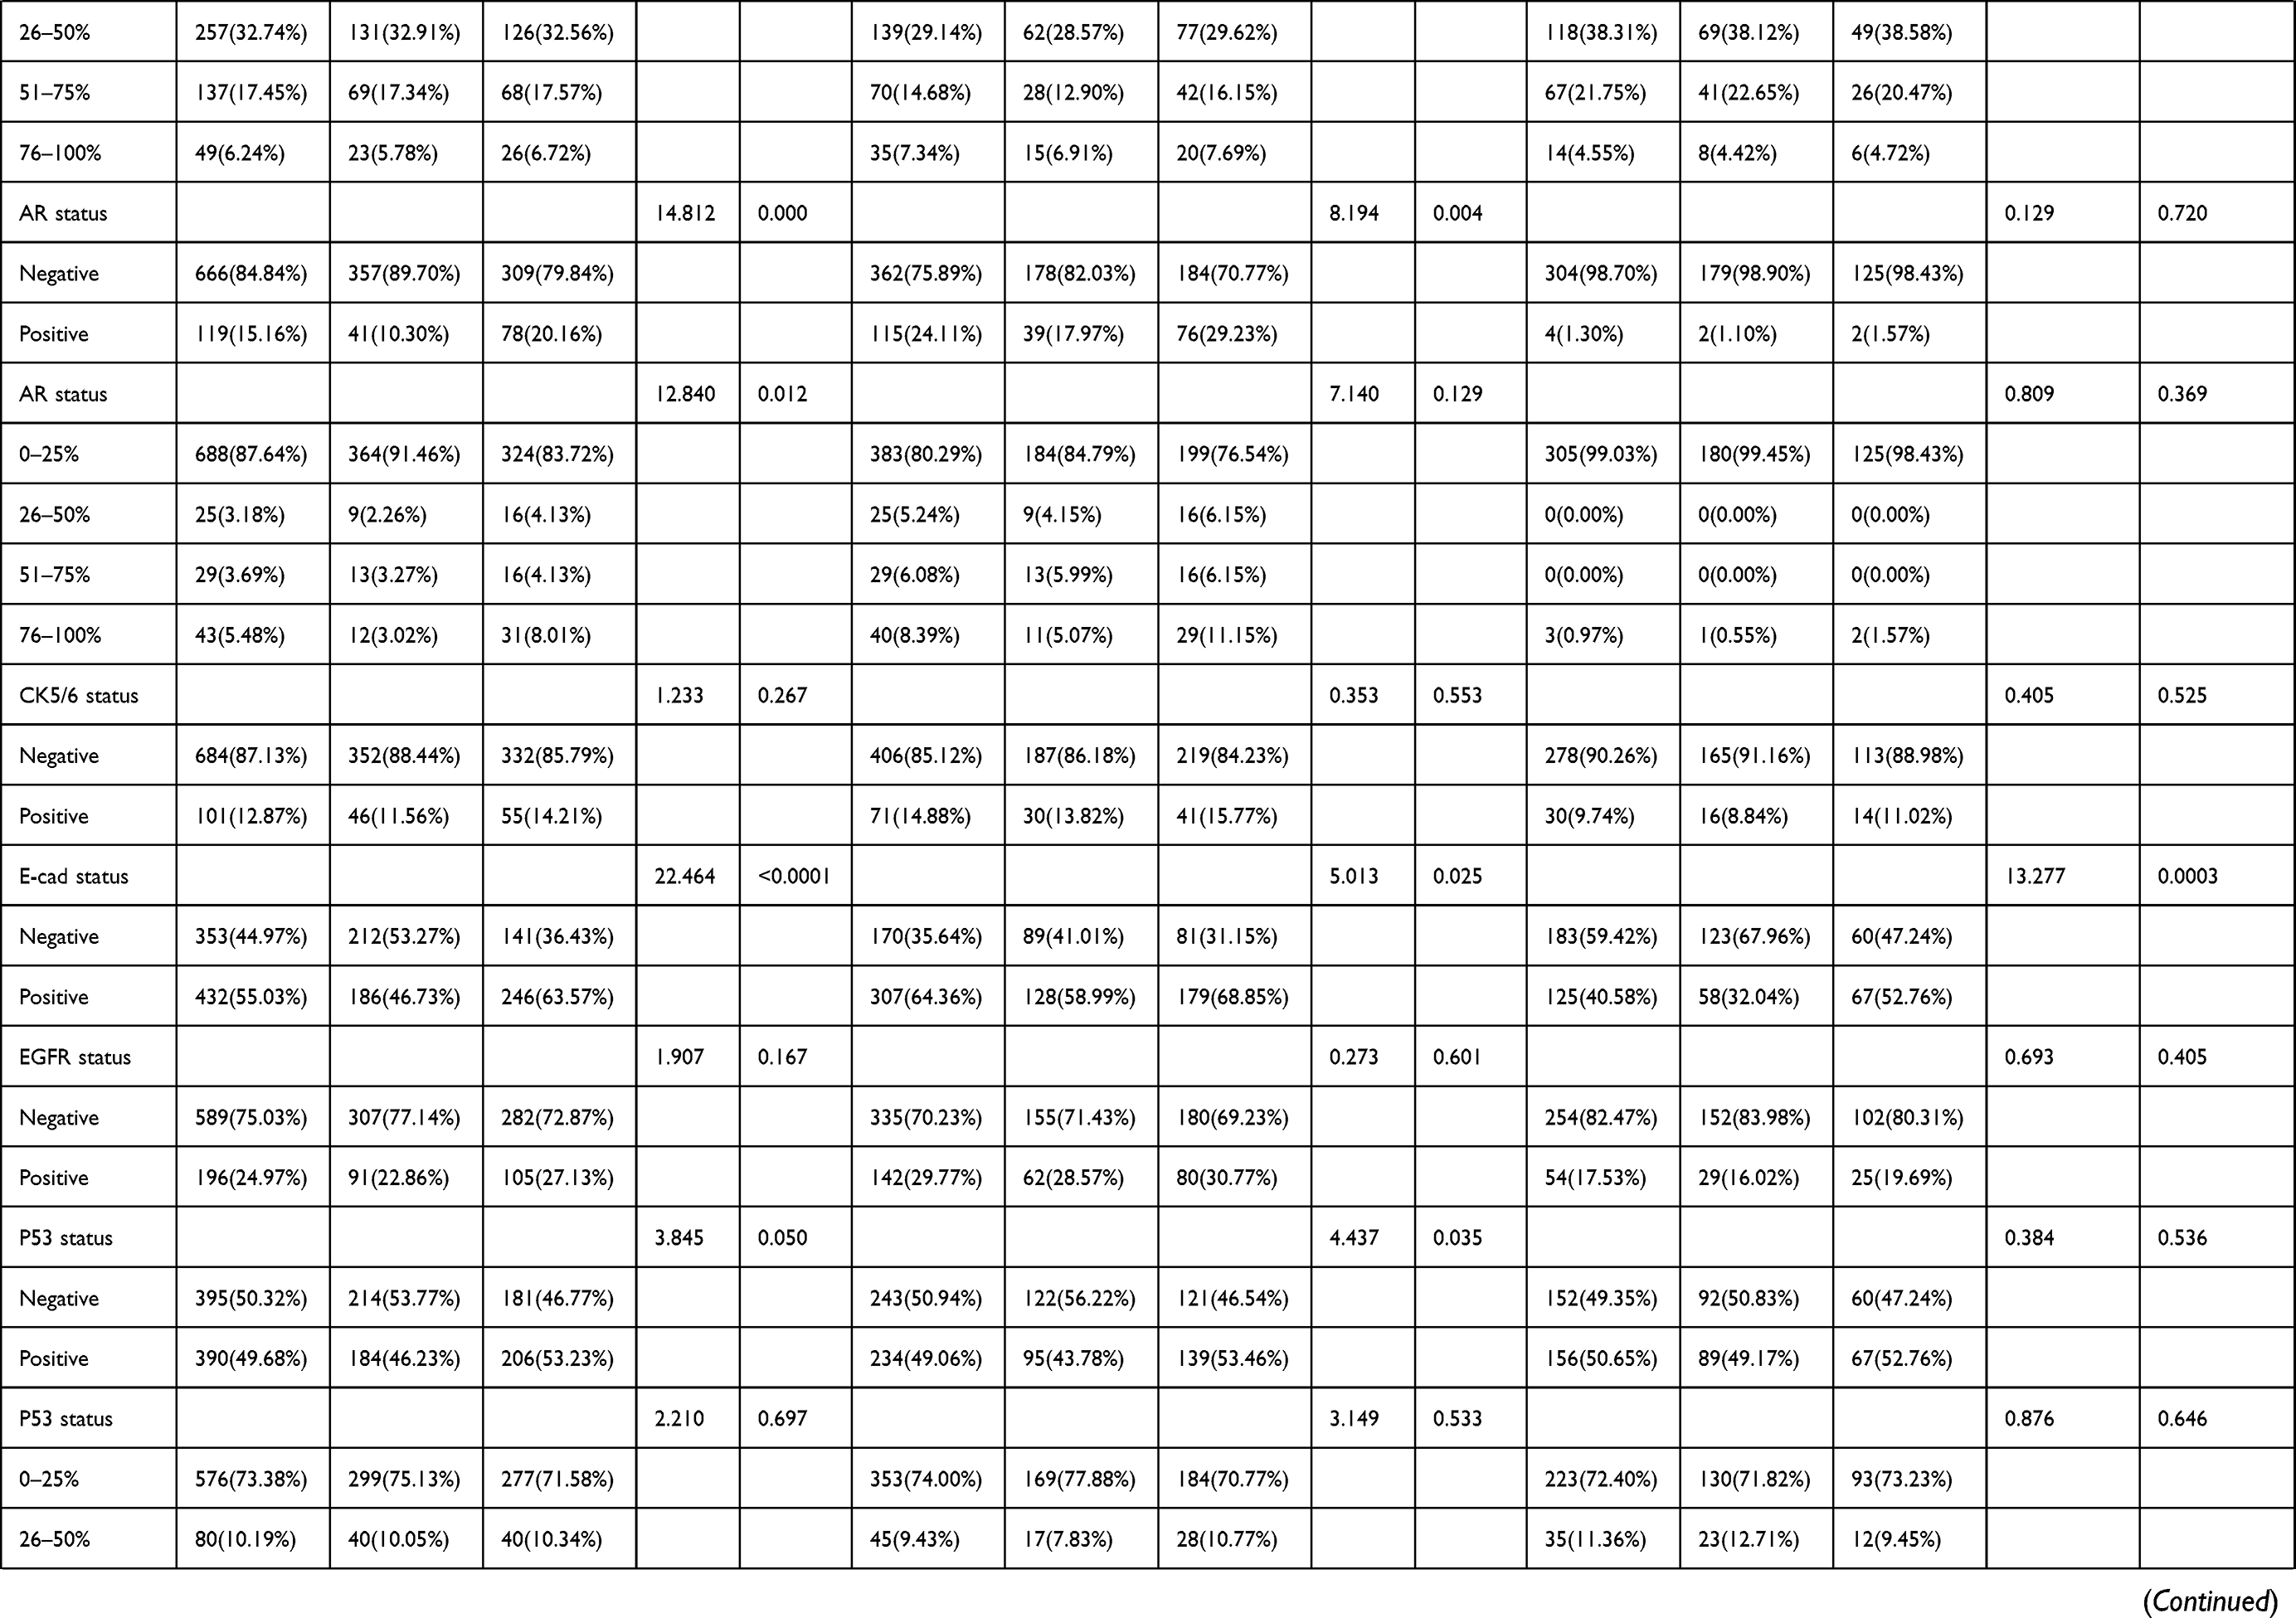 |
Table 4 Association of Molecular Subtype and SII in Patients with Breast Cancer |
To further analyze the prognostic value of SII, we examined the association between SII and molecular typing of breast cancer (Figures 3–Figure 5). A log-rank analysis revealed that the low SII group had longer DFS and OS when compared against the high SII group.
 |
Figure 3 DFS and OS based on SII scores in patients with breast cancer of various molecular subtypes. (A) DFS as shown by Kaplan–Meier analysis based on the SII of patients with luminal A breast cancer. (B) OS as shown by Kaplan–Meier analysis based on the SII of patients with luminal A breast cancer. (C) DFS, as shown by Kaplan–Meier based on the SII of patients with luminal B HER2-positive breast cancer. (D) OS, as shown by Kaplan–Meier based on the SII of patients with luminal B HER2-positive breast cancer. (E) DFS, as shown by Kaplan–Meier based on the SII of patients with luminal B HER2-negative breast cancer. (F) OS, as shown by Kaplan–Meier based on the SII of patients with luminal B HER2-negative breast cancer. (G) DFS, as shown by Kaplan–Meier based on the SII of patients with HER2-enriched breast cancer. (H) OS, as shown by Kaplan–Meier based on the SII of patients with luminal B HER2-positive breast cancer. (I) DFS, as shown by Kaplan–Meier based on the SII of patients with triple-negative breast cancer. (J) OS, as shown by Kaplan–Meier based on the SII of patients with triple-negative breast cancer. |
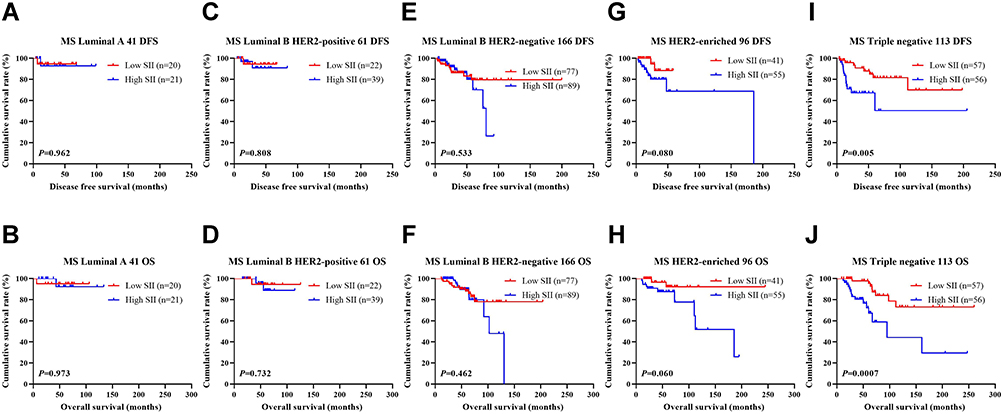 |
Figure 4 DFS and OS based on SII scores in patients with breast cancer of various molecular subtypes (NACT group). (A) DFS as shown by Kaplan–Meier analysis based on the SII of patients with luminal A breast cancer. (B) OS as shown by Kaplan–Meier analysis based on the SII of patients with luminal A breast cancer. (C) DFS, as shown by Kaplan–Meier based on the SII of patients with luminal B HER2-positive breast cancer. (D) OS, as shown by Kaplan–Meier based on the SII of patients with luminal B HER2-positive breast cancer. (E) DFS, as shown by Kaplan–Meier based on the SII of patients with luminal B HER2-negative breast cancer. (F) OS, as shown by Kaplan–Meier based on the SII of patients with luminal B HER2-negative breast cancer. (G) DFS, as shown by Kaplan–Meier based on the SII of patients with HER2-enriched breast cancer. (H) OS, as shown by Kaplan–Meier based on the SII of patients with luminal B HER2-positive breast cancer. (I) DFS, as shown by Kaplan–Meier based on the SII of patients with triple-negative breast cancer. (J) OS, as shown by Kaplan–Meier based on the SII of patients with triple-negative breast cancer. |
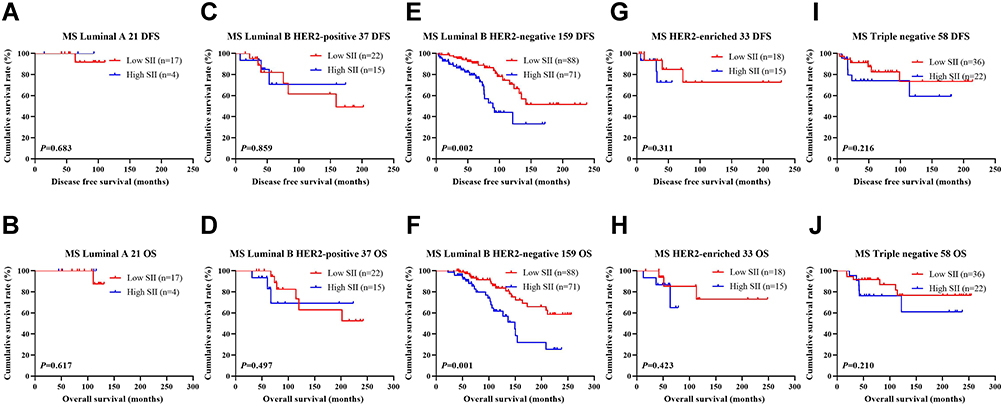 |
Figure 5 DFS and OS based on SII scores in patients with breast cancer of various molecular subtypes (Non-NACT group). (A) DFS as shown by Kaplan–Meier analysis based on the SII of patients with luminal A breast cancer. (B) OS as shown by Kaplan–Meier analysis based on the SII of patients with luminal A breast cancer. (C) DFS, as shown by Kaplan–Meier based on the SII of patients with luminal B HER2-positive breast cancer. (D) OS, as shown by Kaplan–Meier based on the SII of patients with luminal B HER2-positive breast cancer. (E) DFS, as shown by Kaplan–Meier based on the SII of patients with luminal B HER2-negative breast cancer. (F) OS, as shown by Kaplan–Meier based on the SII of patients with luminal B HER2-negative breast cancer. (G) DFS, as shown by Kaplan–Meier based on the SII of patients with HER2-enriched breast cancer. (H) OS, as shown by Kaplan–Meier based on the SII of patients with luminal B HER2-positive breast cancer. (I) DFS, as shown by Kaplan–Meier based on the SII of patients with triple-negative breast cancer. (J) OS, as shown by Kaplan–Meier based on the SII of patients with triple-negative breast cancer. |
SII and Lymph Vessel Invasion
Univariate and multivariate analysis also uncovered lymph vessel invasion as an independent factor of DFS and OS. Of the 785 cases, 227 cases were associated with lymph vessel invasion, and 558 cases were without that. Additional analysis on the relationship between the prognostic value of SII and lymphatic invasion was also performed. The mean DFS and OS in patients without lymph vessel invasion were 50.96 months and 79.65 months, respectively. The mean DFS and OS in patients with lymphatic invasion were 28.97 months and 53.37 months, respectively. Patients who had no evidence of lymphatic invasion had a much higher DFS and OS in comparison to those with lymph vessel invasion (χ2=20.940, P <0.0001 and χ2=26.540, P <0.0001). Among the 558 patients without lymph vessel invasion, those who had low SII indices had enhanced DFS and OS compared to those in the high SII group (χ2=13.170, P=0.0003, and χ2=15.950, P <0.0001). Among the 227 patients with lymph vessel invasion, those who had low SII indices had augmented DFS and OS compared to those in the high SII group (χ2=3.209, P=0.073, and χ2=4.894, P=0.027) (Figure 6). In the NACT group (477 patients receiving neoadjuvant chemotherapy), the DFS and OS of SII and vascular tumor thrombus were shown in Figure 7. In the non-NACT group (308 breast cancer patients), the DFS and OS of SII and vascular tumor thrombus were shown in Figure 8.
 |
Figure 6 DFS and OS based on the presence of lymph vessel invasion in breast cancer patients. (A) DFS, as shown by Kaplan–Meier analysis based on the SII of all patients with breast cancer. (B) OS, as shown by Kaplan–Meier analysis based on the SII of all patients with breast cancer. (C) DFS, as shown by Kaplan–Meier analysis based on the SII of breast cancer patients without lymph vessel invasion. (D) OS, as shown by Kaplan–Meier analysis based on the SII of breast cancer patients without lymph vessel invasion. (E) DFS, as shown by Kaplan–Meier analysis based on the SII of breast cancer patients with lymph vessel invasion. (F) OS, as shown by Kaplan–Meier analysis based on the SII of breast cancer patients with lymph vessel invasion. |
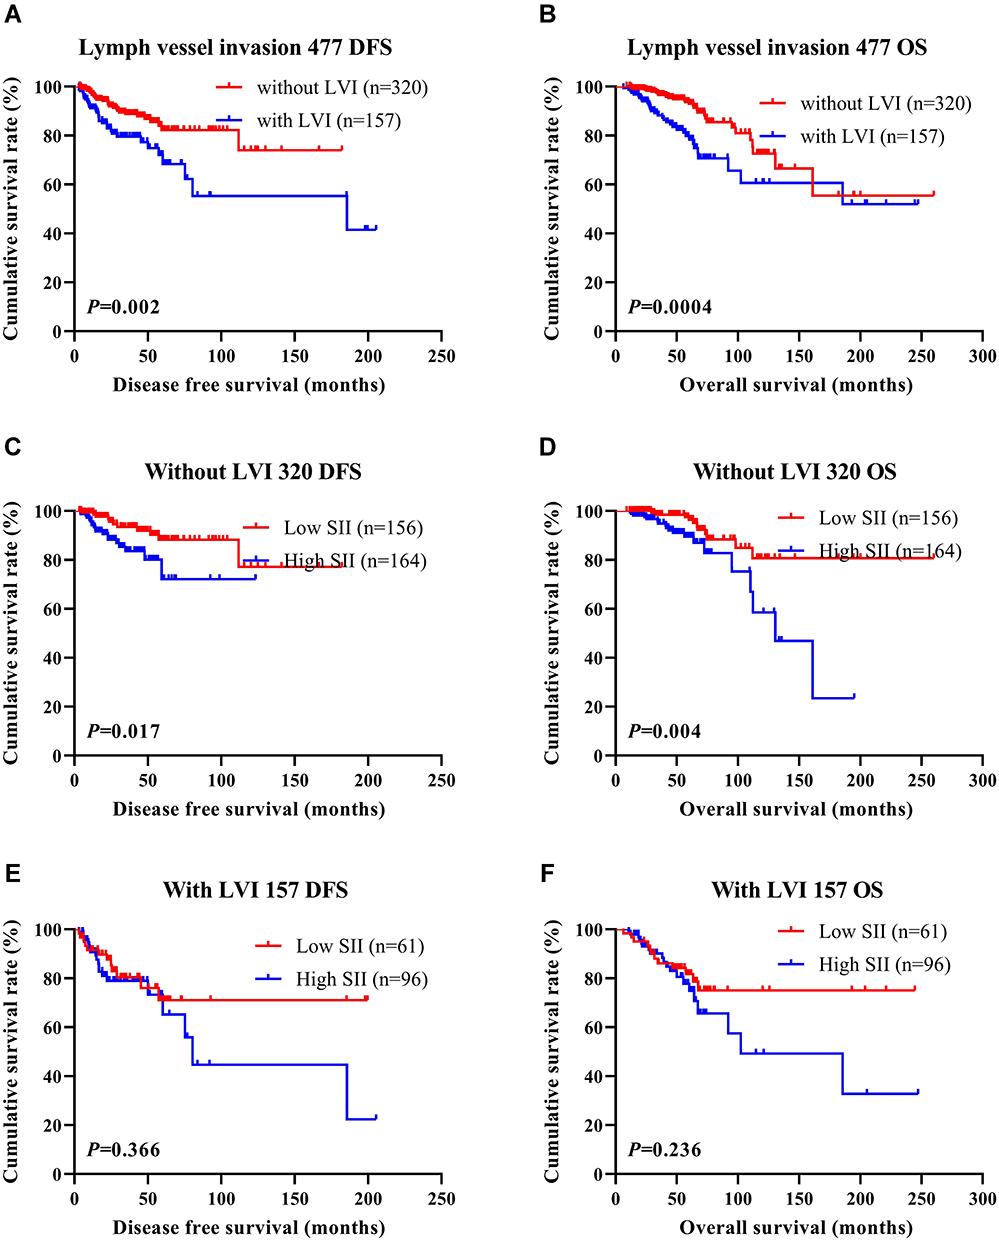 |
Figure 7 DFS and OS based on the presence of lymph vessel invasion in breast cancer patients (NACT group). (A) DFS, as shown by Kaplan–Meier analysis based on the SII of all patients with breast cancer. (B) OS, as shown by Kaplan–Meier analysis based on the SII of all patients with breast cancer. (C) DFS, as shown by Kaplan–Meier analysis based on the SII of breast cancer patients without lymph vessel invasion. (D) OS, as shown by Kaplan–Meier analysis based on the SII of breast cancer patients without lymph vessel invasion. (E) DFS, as shown by Kaplan–Meier analysis based on the SII of breast cancer patients with lymph vessel invasion. (F) OS, as shown by Kaplan–Meier analysis based on the SII of breast cancer patients with lymph vessel invasion. |
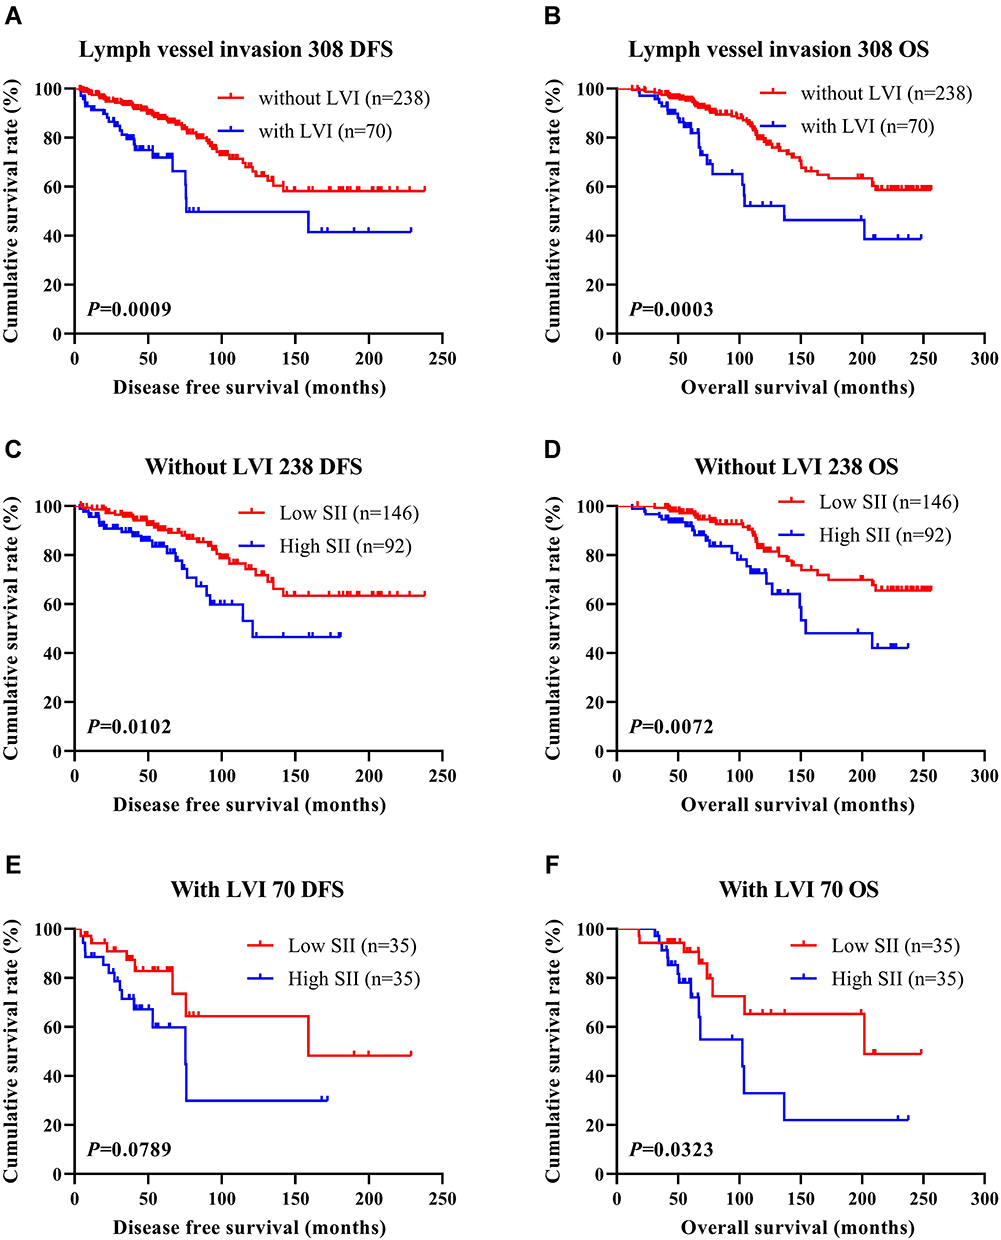 |
Figure 8 DFS and OS based on the presence of lymph vessel invasion in breast cancer patients (non-NACT group). (A) DFS, as shown by Kaplan–Meier analysis based on the SII of all patients with breast cancer. (B) OS, as shown by Kaplan–Meier analysis based on the SII of all patients with breast cancer. (C) DFS, as shown by Kaplan–Meier analysis based on the SII of breast cancer patients without lymph vessel invasion. (D) OS, as shown by Kaplan–Meier analysis based on the SII of breast cancer patients without lymph vessel invasion. (E) DFS, as shown by Kaplan–Meier analysis based on the SII of breast cancer patients with lymph vessel invasion. (F) OS, as shown by Kaplan–Meier analysis based on the SII of breast cancer patients with lymph vessel invasion. |
SII and Neoadjuvant Chemotherapy/Postoperative Chemotherapy
Among those in the NACT cohort, 28 patients were exposed to the AC/ACF regimen; 27 patients were treated exposed to the CT/ACT regimen; 223 patients were exposed to the AT regimen; 141 patients were exposed to the TP regimen; 58 patients were exposed to one other regimen. All 477 patients received surgical treatment after neoadjuvant chemotherapy. Of these patients, 247 did not receive postoperative chemotherapy, and 230 did. Of all patients who received postoperative chemotherapy, 43 patients were exposed to the AC/ACF chemotherapy regimen; 30 patients were exposed to the CT/ACT chemotherapy regimen; 37 patients were exposed to the AT chemotherapy regimen; 39 patients were exposed to the TP chemotherapy regimen, and 81 patients exposed to other chemotherapy regimens. 66.88% (319/477) patients achieved the clinical objective response rate (CR+PR), and 98.53% (470/477) achieved the clinical benefit rate (CR+PR +SD). The pathological response to neoadjuvant chemotherapy was evaluated using the MPG grading system. There were 22 cases of MPG 1 (4.61%), 126 cases of MPG 2 (26.42%), 177 cases of MPG 3 (37.11%), 62 cases of MPG4 (13.00%), and 90 cases of MPG 5 (18.87%). To further analyze the prognostic value of SII, the relationship between SII and MPG was scrutinized. Log-rank analysis revealed that the mean survival time of DFS and OS was significantly different among different MPG grades (χ2=18.290, P <0.0001 and χ2=18.020, P <0.0001) (Figure 9).
 |
Figure 9 The impact of Miller and Payne grade (MPG) on DFS and OS in breast cancer patients who received NACT. (A) DFS as shown by Kaplan–Meier analysis based on the MPG and the SII of patients with breast cancer. (B) OS as shown by Kaplan–Meier analysis based on the MPG and the SII of patients with breast cancer. (C) Kaplan–Meier analysis of DFS based on MPG1 for the SII of patients with breast cancer. (D) Kaplan–Meier analysis of OS based on MPG1 for the SII of patients with breast cancer. (E) Kaplan–Meier analysis of DFS based on MPG2 for the SII of patients with breast cancer. (F) Kaplan–Meier analysis of OS based on MPG2 for the SII of patients with breast cancer. (G) Kaplan–Meier analysis of DFS based on MPG3 for the SII of patients with breast cancer. (H) Kaplan–Meier analysis of OS based on MPG3 for the SII of patients with breast cancer. (I) Kaplan–Meier analysis of DFS based on MPG4 for the SII of patients with breast cancer. (J) Kaplan–Meier analysis of OS based on MPG4 for the SII of patients with breast cancer. (K) Kaplan–Meier analysis of DFS based on MPG5 for the SII of patients with breast cancer. (L) Kaplan–Meier analysis of OS based on MPG5 for the SII of patients with breast cancer. |
The association between SII and treatment response groups was also studied. Log-rank analysis showed that the mean DFS and OS among different Response groups were statistically significant (χ2=12.540, P=0.006 and χ2=10.820, P=0.013) (Figure 10).
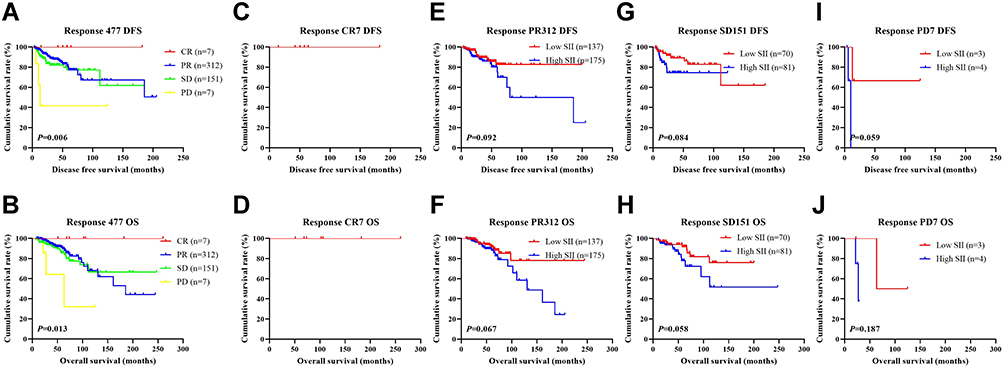 |
Figure 10 The impact of response to neoadjuvant chemotherapy in breast cancer patients who received NACT on DFS and OS. (A) Kaplan–Meier analysis of DFS for SII based on the response to neoadjuvant chemotherapy in breast cancer patients who received NACT. (B) Kaplan–Meier analysis of OS for SII based on the response to neoadjuvant chemotherapy in breast cancer patients who received NACT. (C) Kaplan–Meier analysis of DFS for SII based on CR response to neoadjuvant chemotherapy in breast cancer patients who received NACT. (D) Kaplan–Meier analysis of OS for SII based on CR response to neoadjuvant chemotherapy in breast cancer patients who received NACT. (E) Kaplan–Meier analysis of DFS for SII based on PR response to neoadjuvant chemotherapy in breast cancer patients who received NACT. (F) Kaplan–Meier analysis of OS for SII based on PR response to neoadjuvant chemotherapy in breast cancer patients who received NACT. (G) Kaplan–Meier analysis of DFS for SII based on SD response to neoadjuvant chemotherapy in breast cancer patients who received NACT. (H) Kaplan–Meier analysis of OS for SII based on SD response to neoadjuvant chemotherapy in breast cancer patients who received NACT. (I) Kaplan–Meier analysis of DFS for SII based on PD response to neoadjuvant chemotherapy in breast cancer patients who received NACT. (J) Kaplan–Meier analysis of OS for SII based on PD response to neoadjuvant chemotherapy in breast cancer patients who received NACT. |
Correlation Between SII and Toxicity Assessment
Neoadjuvant chemotherapy toxicity and adverse reactions were recorded after each participant underwent two cycles of neoadjuvant chemotherapy. In the NACT group, common chemotherapeutic side effects included liver dysfunction, myelosuppression, gastrointestinal reactions, thrombocytopenia, neutropenia, leucopenia, anemia, peripheral neurotoxicity, alopecia, mouth ulcers, diarrhea, vomiting, nausea, and decreased appetite. None of the patients experienced chemotherapy-related death. The difference in the incidence of peripheral neurotoxicity was statistically significant between the groups (χ2=5.032, P=0.025), as shown in Table 5.
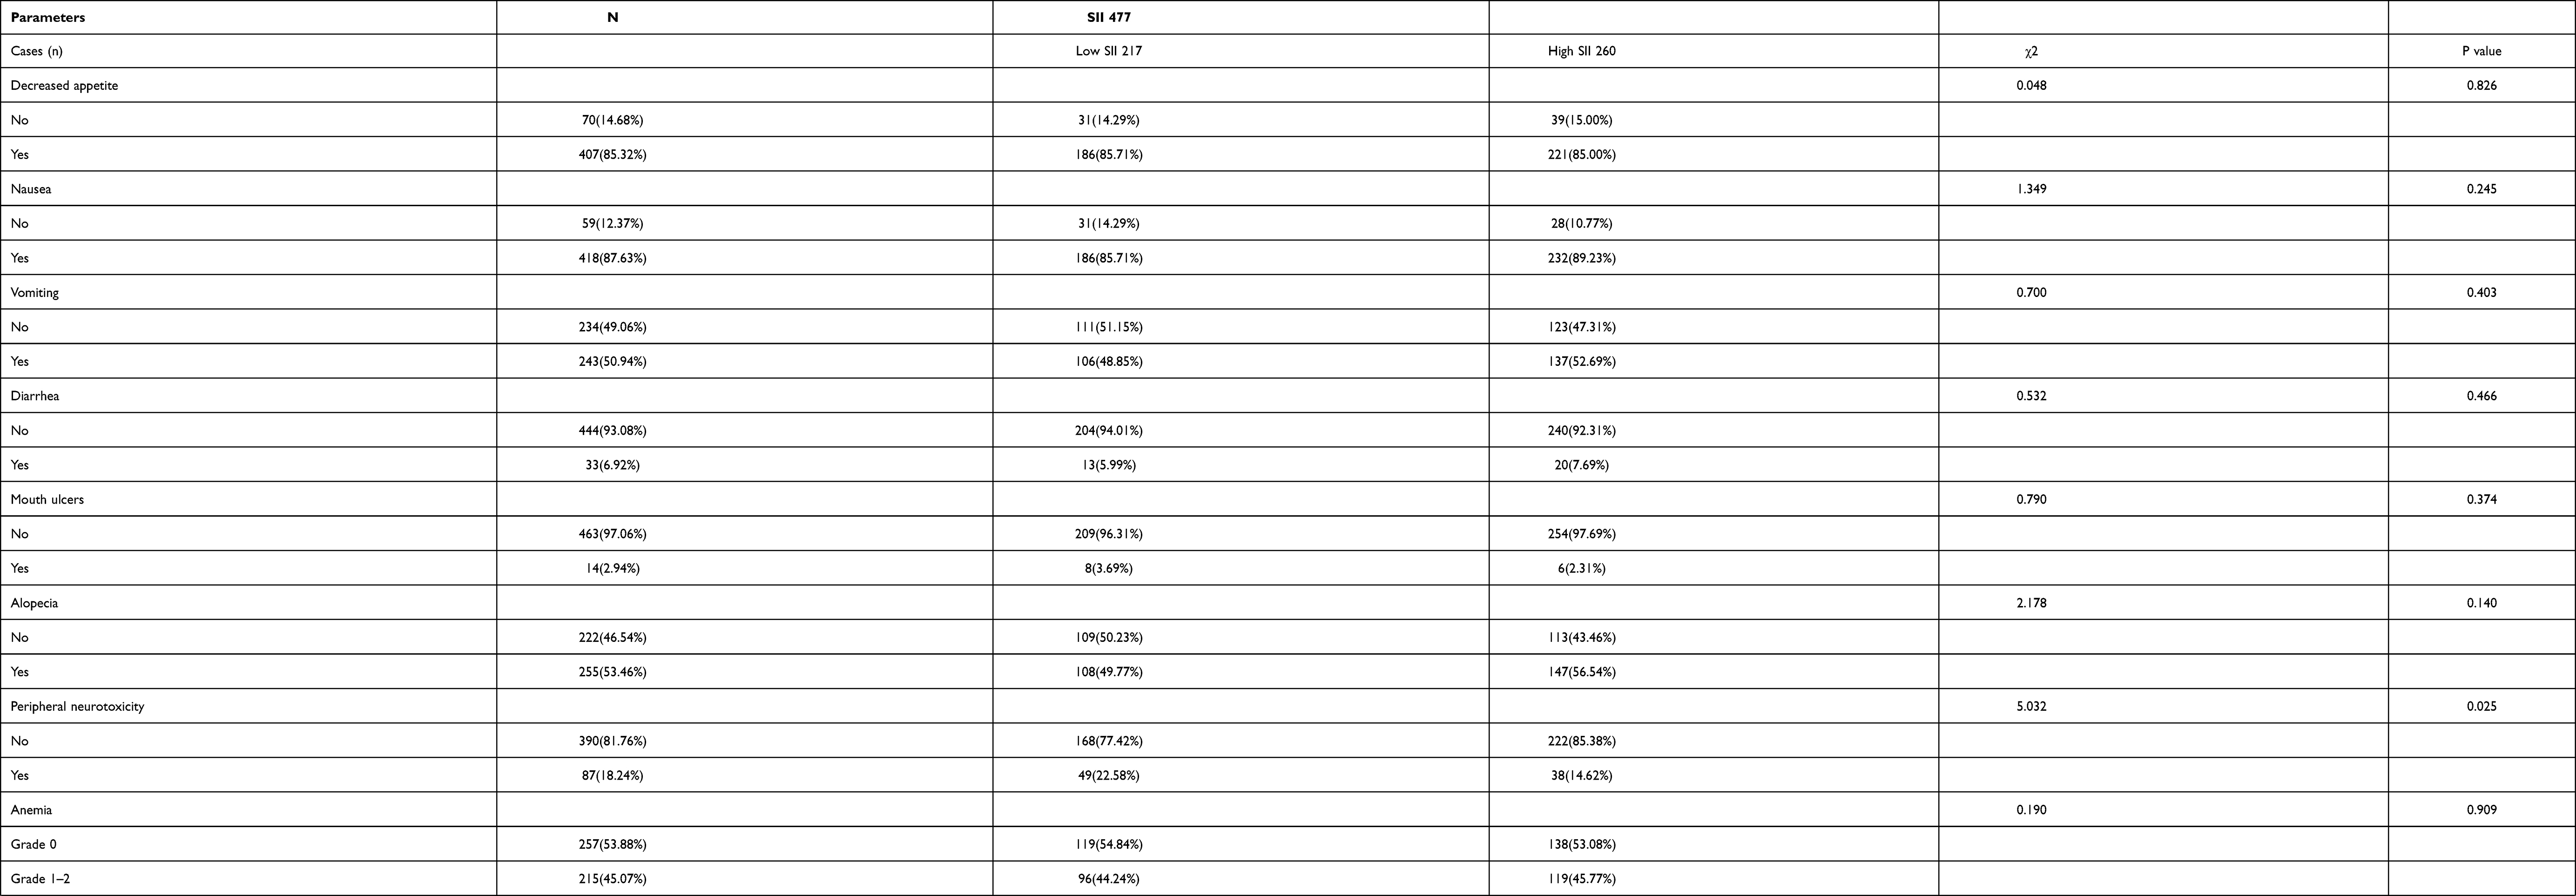 |
Table 5 Correlation Between SII and Toxicity Assessment |
Discussion
Breast cancer is one of the most common female malignancies, with its incidence surpassing that of lung cancer.25 2.26 million of the 19.29 million new cancer cases reported by the International Agency for Research on Cancer (IARC) were breast cancer, making it the most numerous cancer in the world. In 2020, the statistics of the China National Cancer Center show that of the 420,000 new female breast cancer patients, 120,000 women died of breast cancer. Breast cancer-associated mortality rates are expected to rise annually. This has been attributed to various sociodemographic risk factors for breast cancer, such as late birth, fewer births, and obesity, to name a few. At present, the primary means of treating breast cancer is via surgery, with chemoradiotherapy, endocrine therapy, and targeted therapy acting as effective adjuvants and neoadjuvants that improve the survival time and quality of life of breast cancer patients.
Studies have pointed out that systemic inflammatory response is closely related to the prognosis of several malignant tumors. The application of changes of inflammatory cells in peripheral blood to predict tumor prognosis has received more and more attention, but the mechanism of inflammatory cells causing tumor prognosis remains unclear.26 Studies have shown that inflammatory cells such as lymphocytes, neutrophils, and platelets, have the potential to prognosticate several malignancies.27–29 Neutrophils are the primary responders to inflammation and infection and important participants in the process of cancer development and are therefore associated with tumor progression.30–32 Platelets secrete a large number of microparticles and exosomes, promoting the interaction between tumor cells and may act as a prerequisite for hematological metastasis, while secreted chemokines can recruit myeloid cells and mediate vascular occlusion with platelet thrombi.28,33,34 Another critical component of tumor immunity is lymphocytes, which can inhibit tumor progression and metastasis.35–37 The SII represents an effective indicator of the immune status of malignant tumors and is based on the neutrophils, platelet, and lymphocyte counts.38–40 Studies have also found that SII functions as an independent prognostic factor for a variety of malignant tumors.41–44 Wang et al report that preoperative SII and BI-RADS 5 were independent prognostic factors for triple-negative breast cancer, and patients with decreased SII had improved chances of having longer DFS and OS.45 Liu et al documents SII to be an independent and effective predictor of triple-negative breast cancer, and those with increased SII values were more likely to have shorter DFS, OS, and distant metastasis-free survival.46 Jiang et al found that SII was an independent prognostic factor for DFS and OS in HER2-positive breast cancer, which was superior to NLR, PLR, and other inflammatory indexes in terms of prognostic reliability.47 However, few studies have examined the relationship between SII and breast cancer with neoadjuvant treatment. Therefore, this study retrospectively studied the effect of SII on breast cancer patient survival and prognosis in those who received neoadjuvant chemotherapy.
Our team has published similar results on SII and breast cancer in 2020, and this study was a follow-up study.48 We analyzed the association between SII and clinicopathology in patients with breast cancer. The results showed that the clinicopathological characteristics, including clinical data (menopausal status, US tumor location, US tumor size, US-LNM, clinical T, N, and TNM stages, duration of surgery, postoperative radiotherapy, and postoperative targeted therapy were improved in the low SII group. Nutritional and hematological parameters (LDH, ALB, CA125, FIB, INR, W, R, N, L, E, B, P). Both univariate and multivariate analyses revealed menopausal status, blood glucose, SII, clinical T stage, histological type, pathological N stage, Ki-67, CK5/6, lymph vessel invasion, postoperative targeted therapy, and postoperative chemotherapy to be independent predictors of improvement in DFS and OS. The optimal threshold value of 560 for SII was obtained using a ROC curve. Subsequent results showed that the mean survival times of DFS and OS in the low SII group were increased in contrast to those of the high SII group.
At the same time, we analyzed the relationship between SII and pathological TNM stage. We discovered that those in the low SII group had shorter DFS and OS compared to those in the high SII group in both early and advanced breast cancer. Those in the NACT group who had low SII demonstrated increased average DFS and OS in contrast to those of the high SII group, but this difference was not significant. We also analyzed the relationship between SII and postoperative molecular type of breast cancer. The average DFS and OS in the low SII group were longer in contrast to those of the high SII group across various molecular subtypes, especially in Luminal B HER2-negative type, HER2 enriched type, and triple-negative type.
Lymph vessel invasions are closely related to malignant tumors, with a high degree of invasion corresponding to a poorer prognosis.49 The average DFS and OS of breast cancer patients with lymph vessel invasion were lower compared to individuals without lymphatic invasion. A meta-study by Mari et al also pointed out that lymphatic invasion was a critical prognostic factor for the poor prognosis of patients with bladder cancer after radical cystectomy. In triple-negative breast cancer, the lymphatic invasion was an important prognostic factor, especially in those with lymph node metastasis. We further analyzed the relationship between SII and lymphatic invasion. Those lacking lymphatic invasion in the low SII group had a much enhanced DFS and OS compared to those with increased SII scores. However, the two breast cancer patient groups had similar DFS and OS between those with lymphatic invasion. Amongst those in the NACT group, there was no significant difference in SII between the two groups for breast cancer patients with lymph vessel invasion.
The efficacy of chemotherapy was assessed in patients receiving neoadjuvant chemotherapy after two cycles. After the end of the chemotherapy cycle, all patients received surgical treatment, and the postoperative pathology was evaluated using MPG. We analyzed the relationship among SII, MPG, and Response. In different MPG stages, the mean DFS and OS in the low SII group were increased in contrast to those with raised scores. However, these differences were not statistically significant. Similar trends were seen across different Response groups, with the differences also remaining statistically insignificant. Nevertheless, patients with a lower SII score were less likely to experience peripheral neurotoxicity compared to those with a higher SII score.
Inflammatory cells infiltrate the tumor microenvironment and affect tumor cell growth and development. Neutrophils and monocytes, which are differentiated granulocyte-mononuclear progenitor cells, promote tumor cell growth and angiogenesis by releasing various pro-inflammatory mediators, such as epidermal growth factor, tumor necrosis factor, and vascular endothelial growth factor, in a similar way to the development of inflammation. Chemokine-mediated platelet aggregation occludes blood vessels and promotes the occurrence and progression of malignant tumors. Lymphocytes are critical in mediating the tumor-specific immune response and are integral components of immune surveillance. The increase in the absolute value of neutrophils and platelets and the decrease in the absolute value of lymphocytes in peripheral blood is associated with the occurrence, proliferation, and progression of tumors. Therefore, SII can be used as a practical clinical indicator for tumor progression and prognosis. In this study, we found that the use of SII is not commonly used to stratify breast cancer patients undergoing neoadjuvant chemotherapy. The number of breast cancer patients in China is on the rise year by year. Considering the imbalanced distribution of medical resources and medical conditions in China, these reproducible and minimally-invasive indicators are very useful in guiding clinical treatment and prevention of breast cancer and can provide an effective and powerful point of reference for clinical practice.
Conclusion
In conclusion, we outlined the relationship between SII and breast cancer and demonstrated that low SII is beneficial in breast cancer patient prognosis. Nevertheless, the patients in this study were from a single center and were relatively few in number, a relatively small patient base, and a large number of advanced patients receiving neoadjuvant therapy would help in improving the strength of this study. The optimal threshold SII value appears to be related to the number of patients included and pathological conditions. Therefore, the optimal threshold value of SII in this study still needs to be further studied and verified.
Data Sharing Statement
All data utilized in this study are included in this article, and all data supporting the findings of this study are available on reasonable request from the corresponding author.
Ethics Statement
The studies involving human participants were reviewed and approved by National Cancer Center/National Clinical Research Center for Cancer/Cancer Hospital Chinese Academy of Medical Sciences and Peking Union Medical College (reference NCC2018-034). The patients/participants provided their written informed consent to participate in this study. The study was conducted in accordance with the Declaration of Helsinki.
Acknowledgments
The authors thank the helpful comments of Department of Breast Surgical Oncology, National Cancer Center/National Clinical Research Center for Cancer/Cancer Hospital.
Funding
This study was supported by grants from Natural Science Foundation of China (No. 81872160), Capital Public Health Education, Beijing Science and Technology Program (No. Z171100000417028), Peking Union Medical College Youth Research Funds (No.3332015157) and National Key R&D Program of China (Grant No. 2018YFC1312100).
Disclosure
The authors report no conflicts of interest in this work.
References
1. Siegel RL, Miller KD, Jemal A. Cancer statistics, 2020. CA Cancer J Clin. 2020;70(1):7–30. doi:10.3322/caac.21590
2. Bray F, Ferlay J, Soerjomataram I, Siegel RL, Torre LA, Jemal A. Global cancer statistics 2018: GLOBOCAN estimates of incidence and mortality worldwide for 36 cancers in 185 countries (vol 68, pg 394, 2018). CA Cancer J Clin. 2020;70(4):313.
3. Chen W, Zheng R, Zhang S, et al. Cancer incidence and mortality in China in 2013: an analysis based on urbanization level. Chin J Cancer Res. 2017;29(1):1–10. doi:10.21147/j.issn.1000-9604.2017.01.01
4. Penault-Llorca F, Radosevic-Robin N. Ki67 assessment in breast cancer: an update. Pathology. 2017;49(2):166–171. doi:10.1016/j.pathol.2016.11.006
5. Yip C-H, Rhodes A. Estrogen and progesterone receptors in breast cancer. Fut Oncol. 2014;10(14):2293–2301. doi:10.2217/fon.14.110
6. Krishnamurti U, Silverman JF. HER2 in Breast Cancer: a Review and Update. Adv Anat Pathol. 2014;21(2):100–107. doi:10.1097/PAP.0000000000000015
7. Bertucci F, Goncalves A. Immunotherapy in breast cancer: the emerging role of PD-1 and PD-L1. Curr Oncol Rep. 2017;19(10). doi:10.1007/s11912-017-0627-0
8. Singh N, Baby D, Rajguru JP, Patil PB, Thakkannavar SS, Pujari VB. Inflammation and cancer. Ann Afr Med. 2019;18(3):121–126. doi:10.4103/aam.aam_56_18
9. Greten FR, Grivennikov SI. Inflammation and cancer: triggers, mechanisms, and consequences. Immunity. 2019;51(1):27–41. doi:10.1016/j.immuni.2019.06.025
10. Tobias DK, Akinkuolie AO, Chandler PD, et al. Markers of inflammation and incident breast cancer risk in the women’s health study. Am J Epidemiol. 2018;187(4):705–716. doi:10.1093/aje/kwx250
11. Jiang X, Shapiro DJ. The immune system and inflammation in breast cancer. Mol Cell Endocrinol. 2014;382(1):673–682. doi:10.1016/j.mce.2013.06.003
12. Corbeau I, Thezenas S, Maran-Gonzalez A, Colombo P-E, Jacot W, Guiu S. Inflammatory blood markers as prognostic and predictive factors in early breast cancer patients receiving neoadjuvant chemotherapy. Cancers. 2020;12(9):2666. doi:10.3390/cancers12092666
13. Graziano V, Grassadonia A, Iezzi L, et al. Combination of peripheral neutrophil-to-lymphocyte ratio and platelet-to-lymphocyte ratio is predictive of pathological complete response after neoadjuvant chemotherapy in breast cancer patients. Breast. 2019;44:33–38. doi:10.1016/j.breast.2018.12.014
14. Xu J, Ni C, Ma C, et al. Association of neutrophil/lymphocyte ratio and platelet/lymphocyte ratio with ER and PR in breast cancer patients and their changes after neoadjuvant chemotherapy. Clin Transl Oncol. 2017;19(8):989–996. doi:10.1007/s12094-017-1630-5
15. Wang C, Jin S, Xu S, Cao S. High Systemic Immune-Inflammation Index (SII) represents an unfavorable prognostic factor for small cell lung cancer treated with etoposide and platinum-based chemotherapy. Lung. 2020;198(2):405–414. doi:10.1007/s00408-020-00333-6
16. Li S, Yang Z, Du H, Zhang W, Che G, Liu L. Novel systemic inflammation response index to predict prognosis after thoracoscopic lung cancer surgery: a propensity score-matching study. ANZ J Surg. 2019;89(11):E507–E13. doi:10.1111/ans.15480
17. Okadome K, Baba Y, Yagi T, et al. Prognostic nutritional index, tumor-infiltrating lymphocytes, and prognosis in patients with esophageal cancer. Ann Surg. 2020;271(4):693–700. doi:10.1097/SLA.0000000000002985
18. Amin MB, Greene FL, Edge SB, et al. The Eighth Edition AJCC Cancer Staging Manual: continuing to build a bridge from a population-based to a more “personalized” approach to cancer staging. CA Cancer J Clin. 2017;67(2):93–99. doi:10.3322/caac.21388
19. Cserni G, Chmielik E, Cserni B, Tot T. The new TNM-based staging of breast cancer. Virchows Arch. 2018;472(5):697–703. doi:10.1007/s00428-018-2301-9
20. Weigelt B, Reis-Filho JS. Histological and molecular types of breast cancer: is there a unifying taxonomy? Nat Rev Clin Oncol. 2009;6(12):718–730. doi:10.1038/nrclinonc.2009.166
21. Ogston KN, Miller ID, Payne S, et al. A new histological grading system to assess response of breast cancers to primary chemotherapy: prognostic significance and survival. Breast. 2003;12(5):320–327. doi:10.1016/S0960-9776(03)00106-1
22. Therasse P, Arbuck SG, Eisenhauer EA, et al. New guidelines to evaluate the response to treatment in solid tumors. J Natl Cancer Inst. 2000;92(3):205–216. doi:10.1093/jnci/92.3.205
23. Amat S, Penault-Llorca F, Cure H, et al. Scarff-Bloom-Richardson (SBR) grading: a pleiotropic marker of chemosensitivity in invasive ductal breast carcinomas treated by neoadjuvant chemotherapy. Int J Oncol. 2002;20(4):791–796.
24. Kaba H, Fukuda H, Yamamoto S, Ohashi Y. Reliability at the National Cancer Institute-Common Toxicity Criteria version 2.0. Gan to Kagaku Ryoho. 2004;31(8):1187–1192.
25. Diakos CI, Charles KA, McMillan DC, Clarke SJ. Cancer-related inflammation and treatment effectiveness. Lancet Oncol. 2014;15(11):E493–E503. doi:10.1016/S1470-2045(14)70263-3
26. Grivennikov SI, Greten FR, Karin M. Immunity, inflammation, and cancer. Cell. 2010;140(6):883–899. doi:10.1016/j.cell.2010.01.025
27. Mollinedo F. Neutrophil degranulation, plasticity, and cancer metastasis. Trends Immunol. 2019;40(3):228–242. doi:10.1016/j.it.2019.01.006
28. Haemmerle M, Stone RL, Menter DG, Afshar-Kharghan V, Sood AK. The platelet lifeline to cancer: challenges and opportunities. Cancer Cell. 2018;33(6):965–983. doi:10.1016/j.ccell.2018.03.002
29. Yang J, Xu J, Ying E, Sun T. Predictive and prognostic value of circulating blood lymphocyte subsets in metastatic breast cancer. Cancer Med. 2019;8(2):492–500. doi:10.1002/cam4.1891
30. Powell DR, Huttenlocher A. Neutrophils in the Tumor Microenvironment. Trends Immunol. 2016;37(1):41–52. doi:10.1016/j.it.2015.11.008
31. Rakic A, Beaudry P, Mahoney DJ. The complex interplay between neutrophils and cancer. Cell Tissue Res. 2018;371(3):517–529. doi:10.1007/s00441-017-2777-7
32. Papayannopoulos V. Neutrophil extracellular traps in immunity and disease. Nat Rev Immunol. 2018;18(2):134–147. doi:10.1038/nri.2017.105
33. Schlesinger M. Role of platelets and platelet receptors in cancer metastasis. J Hematol Oncol. 2018;11(1). doi:10.1186/s13045-018-0669-2
34. Gresele P, Malvestiti M, Momi S. Anti-platelet treatments in cancer: basic and clinical research. Thromb Res. 2018;164:S106–S11. doi:10.1016/j.thromres.2017.12.016
35. Dupre A, Malik HZ. Inflammation and cancer: what a surgical oncologist should know. Eur J Surg Oncol. 2018;44(5):566–570. doi:10.1016/j.ejso.2018.02.209
36. Hall M, Liu H, Malafa M, et al. Expansion of tumor-infiltrating lymphocytes (TIL) from human pancreatic tumors. J Immunother Cancer. 2016;4(1). doi:10.1186/s40425-016-0164-7.
37. Zhou G, Sprengers D, Boor PPC, et al. Antibodies against immune checkpoint molecules restore functions of tumor-infiltrating T cells in hepatocellular carcinomas. Gastroenterology. 2017;153(4):110. doi:10.1053/j.gastro.2017.06.017
38. Zhang Y, Xiao G, Wang R. Clinical significance of systemic immune-inflammation index (SII) and C-reactive protein-to-albumin ratio (CAR) in patients with esophageal cancer: a meta-analysis. Cancer Manag Res. 2019;11:4185–4200. doi:10.2147/CMAR.S190006
39. Chen J-H, Zhai E-T, Yuan Y-J, et al. Systemic immune-inflammation index for predicting prognosis of colorectal cancer. World J Gastroenterol. 2017;23(34):6261–6272. doi:10.3748/wjg.v23.i34.6261
40. Dong M, Shi Y, Yang J, et al. Prognostic and clinicopathological significance of systemic immune-inflammation index in colorectal cancer: a meta-analysis. Ther Adv Med Oncol. 2020;12:175883592093742. doi:10.1177/1758835920937425
41. Yang R, Chang Q, Meng X, Gao N, Wang W. Prognostic value of systemic immune-inflammation index in cancer: a meta-analysis. J Cancer. 2018;9(18):3295–3302. doi:10.7150/jca.25691
42. Zhang W, Wang R, Ma W, et al. Systemic immune-inflammation index predicts prognosis of bladder cancer patients after radical cystectomy. Ann Transl Med. 2019;7(18):431.
43. Hu B, Yang X-R, Xu Y, et al. Systemic immune-inflammation index predicts prognosis of patients after curative resection for hepatocellular carcinoma. Clin Cancer Res. 2014;20(23):6212–6222. doi:10.1158/1078-0432.CCR-14-0442
44. Murthy P, Zenati MS, Al Abbas AI, et al. Prognostic value of the Systemic Immune-Inflammation Index (SII) after neoadjuvant therapy for patients with resected pancreatic cancer. Ann Surg Oncol. 2020;27(3):898–906. doi:10.1245/s10434-019-08094-0
45. Wang P, Yue W, Li W, et al. Systemic immune-inflammation index and ultrasonographic classification of breast imaging-reporting and data system predict outcomes of triple-negative breast cancer. Cancer Manag Res. 2019;11:813–819. doi:10.2147/CMAR.S185890
46. Liu J, Shi Z, Bai Y, Liu L, Cheng K. Prognostic significance of systemic immune-inflammation index in triple-negative breast cancer. Cancer Manag Res. 2019;11:4471–4480. doi:10.2147/CMAR.S197623
47. Jiang L, Fang J, Ding J. High systemic immune-inflammation index predicts poor survival in patients with human epidermal growth factor receptor-2 positive breast cancer receiving adjuvant trastuzumab. Cancer Manag Res. 2020;12:475–484. doi:10.2147/CMAR.S231444
48. Chen L, Kong X, Wang Z, Wang X, Fang Y, Wang J. Pre-treatment systemic immune-inflammation index is a useful prognostic indicator in patients with breast cancer undergoing neoadjuvant chemotherapy. J Cell Mol Med. 2020;24(5):2993–3021. doi:10.1111/jcmm.14934
49. Thompson N, Storr S, Zhang S, Martin S. Lymphovascular invasion: assessment and prognostic impact in melanoma and breast cancer. Histol Histopathol. 2015;30(9):1001–1009. doi:10.14670/HH-11-615
 © 2022 The Author(s). This work is published and licensed by Dove Medical Press Limited. The
full terms of this license are available at https://www.dovepress.com/terms
and incorporate the Creative Commons Attribution
- Non Commercial (unported, 3.0) License.
By accessing the work you hereby accept the Terms. Non-commercial uses of the work are permitted
without any further permission from Dove Medical Press Limited, provided the work is properly
attributed. For permission for commercial use of this work, please see paragraphs 4.2 and 5 of our Terms.
© 2022 The Author(s). This work is published and licensed by Dove Medical Press Limited. The
full terms of this license are available at https://www.dovepress.com/terms
and incorporate the Creative Commons Attribution
- Non Commercial (unported, 3.0) License.
By accessing the work you hereby accept the Terms. Non-commercial uses of the work are permitted
without any further permission from Dove Medical Press Limited, provided the work is properly
attributed. For permission for commercial use of this work, please see paragraphs 4.2 and 5 of our Terms.