")
Back to Journals » Journal of Hepatocellular Carcinoma » Volume 11
The Role of GNMT and MMP12 Expression in Determining TACE Efficacy: Validation at Transcription and Protein Levels
Authors Cong T, Yang C, Cao Q, Ren J, Luo Y , Yuan P, Zheng B, Liu Y, Yang H , Kang W, Ou A, Li X
Received 12 October 2023
Accepted for publication 21 December 2023
Published 17 January 2024 Volume 2024:11 Pages 95—111
DOI https://doi.org/10.2147/JHC.S441179
Checked for plagiarism Yes
Review by Single anonymous peer review
Peer reviewer comments 3
Editor who approved publication: Prof. Dr. Jörg Trojan
Tianhao Cong,1 Chao Yang,1 Qi Cao,2 Jinrui Ren,1 Yingen Luo,1 Pei Yuan,2 Bo Zheng,2 Yu Liu,1 Hongcai Yang,1 Wendi Kang,1 Aixin Ou,1 Xiao Li1
1Department of Interventional Therapy, National Cancer Center/National Clinical Research Center for Cancer/Cancer Hospital, Chinese Academy of Medical Sciences and Peking Union Medical College, Beijing, People’s Republic of China; 2Department of Pathology, National Cancer Center/National Clinical Research Center for Cancer/Cancer Hospital, Chinese Academy of Medical Sciences and Peking Union Medical College, Beijing, People’s Republic of China
Correspondence: Xiao Li, Department of Interventional Therapy, National Cancer Center/National Clinical Research Center for Cancer/Cancer Hospital, Chinese Academy of Medical Sciences and Peking Union Medical College, Beijing, 100021, People’s Republic of China, Tel +86-13910309111, Fax +86-028-88092354, Email [email protected]
Purpose: Transarterial chemoembolization (TACE) represents a significant therapeutic modality for hepatocellular carcinoma (HCC). We aimed to develop a gene signature to accurately predict patient TACE response and explore the underlying mechanisms.
Methods: Three independent datasets were utilized, including GSE104580, GSE14520 and external validation from the Cancer Hospital Chinese Academy of Medical Sciences. GSE104580 was randomly partitioned into a training set and a validation set, whereas GSE14520 was categorized into a resection group and a TACE group. Logistic regression was used to develop a TACE effectiveness model. Immunohistochemistry is utilized to confirm the protein expression trends of the signature genes. Immune infiltration and functional enrichment analyses were conducted to investigate the potential underlying mechanisms.
Results: A 2-gene signature consisting of glycine N-methyltransferase (GNMT) and matrix metalloproteinase-12 (MMP12) was constructed, and based on this, all the patients were assigned TACE effectiveness scores and categorized into high effectiveness (HE) and low effectiveness (LE) groups. The HE group exhibited a better prognosis than the LE group in the various cohorts (p < 0.05). In the external validation set, immunohistochemistry confirmed the expression of the signature genes exhibiting an upregulated trend of GNMT in the HE group and MMP12 in the LE group, the LE group also exhibited a poorer prognosis [for overall survival (OS), HE group: 881 days vs LE group: 273 days (p < 0.05), and for progression-free survival (PFS), HE group: 458 days vs LE group: 136 days (p < 0.05)]. Multivariate analysis in all the datasets identified LE status as an independent risk factor for OS, disease-free survival (DFS) and PFS. The infiltration level of M0 macrophages and activated mast cells in the LE group was significantly higher than in the HE group. The hypoxia signaling pathway and glycolysis pathway were significantly enriched in the LE group.
Conclusion: The loss of GNMT and the overexpression of MMP12 may be critical factors influencing TACE efficacy.
Keywords: hepatocellular carcinoma, transarterial chemoembolization, immune infiltration, mast cell, glucose metabolism, hypoxic microenvironment
Introduction
Primary liver cancer is the sixth most common cancer in the world, with the third highest mortality rate, and hepatocellular carcinoma (HCC) accounts for 75%-80% of primary liver cancers.1 Currently, the 5-year survival rate of HCC is 18%, one of the key reasons may be the high heterogeneity of HCC.2,3 Due to this high heterogeneity, even when receiving the same treatment, there are considerable differences in patient outcomes, with several patients still not deriving benefits from the therapy.4 Therefore, the realization of precision individualized medical care is crucial for improving the prognosis of HCC patients.
Transarterial chemoembolization (TACE) is a treatment that leads to localized ischemic necrosis and induces cell death by infusion of embolic agents and chemotherapeutic drugs into the hepatic artery.5 It is not only a first-line therapy for HCC patients with intermediate stage [Barcelona Clinic Liver Cancer (BCLC)-B stage] disease but also an important platform for downstaging, conversion therapy and combination therapy.6,7 The overall survival (OS) rate of HCC patients treated with TACE was 70.3% at 1 year, 51.8% at 2 years, 40.4% at 3 years, and 32.4% at 5 years.8 However, only a subset of patients exhibited a survival benefit from TACE.8,9 At present, there are several criteria for evaluating the efficacy of TACE. The modified Response Evaluation Criteria in Solid Tumors (mRECIST) criteria can evaluate the changes in tumor areas after TACE and then evaluate the efficacy of TACE.10 The concept of “TACE refractoriness/TACE failure” was initially put forward by the Japan Society of Hepatology (JSH), it refers to a condition where certain patients did not respond effectively to TACE treatment, represented by outcomes such as tumor progression after two or more consecutive TACE procedures, inadequate responses in the targeted lesions (viable lesions > 50%), or the emergence of new tumor lesions despite changing the chemotherapeutic agents.11 However, there is still no consensus on this concept in the international community, and TACE refractoriness does not fully represent the poor prognosis.12 More importantly, the above criteria cannot reliably reflect the long-term prognosis of patients directly and cannot accurately stratify patients before treatment. Although studies have used clinical information or extracted imaging features to develop a model to predict the efficacy of TACE. Niu et al13 constructed a computed tomography-based radiomics nomogram for the prediction of TACE refractoriness, Maesaka et al14 indicated that hypovascular hepatic nodules are a predictive factor for TACE refractoriness. Most of these studies focused on the concept of TACE refractoriness, paid more attention to the deposition effect of lipiodol, or analyzed related anatomical or clinical features rather than directly assessing long-term prognosis based on the molecular mechanism that affects TACE. Fako et al15 and He et al16 had previously developed gene models to predict the prognosis of patients undergoing TACE. However, these models were not validated at the protein level, and the included patients were affected by treatment modalities beyond TACE.
In this study, we explored the molecular mechanisms that affect the effectiveness of TACE and constructed a gene signature to precisely predict the effectiveness of TACE in patients, which was validated at the protein expression level. Furthermore, given the encouraging results of interventional therapy combined with targeted therapy and immunotherapy, we also investigated the correlation between TACE effectiveness and the immune microenvironment and immunotherapy of HCC.
Materials and Methods
Data Collection
A total of three datasets were included in this study. GSE104580 (Figure 1A) contained 81 tissue RNA samples from TACE responders and 66 tissue RNA samples from TACE non-responders. All samples were derived from tumor biopsies of patients with HCC before TACE treatment. Extramural reviewers utilized the modified Response Evaluation Criteria in Solid Tumors to assess the response to TACE within 3 months. Within this study, the primary endpoint for the final grouping was the tumor response. Patients achieving a complete response (CR) or partial response (PR) were categorized as TACE responders, while those with stable disease (SD) or progressive disease (PD) were classified as non-responders. Before reaching the primary endpoint, TACE was the only treatment.17 We randomly divided GSE104580 into two cohorts at a ratio of 3:2: cohort 1 (n = 89, 49 responders and 40 non-responders) was used as the training set, and cohort 2 (n = 58, 32 responders and 26 non-responders) was used as the verification set. GSE14520 (Figure 1B) contained tumor tissue mRNA transcriptional data of 247 Chinese patients with HCC at the initial stage of treatment. After excluding 7 patients with incomplete clinical information and 51 patients who received treatment other than TACE or surgical resection, the remaining 189 patients were divided into the resection group (n = 85) and TACE group (n = 104), according to whether patients received TACE treatment after resection. Among the TACE group, 74 patients received adjuvant TACE after surgical tumor resection (adjuvant set), and 30 patients received TACE therapy only after tumor relapse (relapse set). Notably, the purpose of adjuvant TACE is to reduce the risk of tumor recurrence.18 Patients who were considered to have a high probability of recurrence, such as those with vascular invasion, multiple tumor nodules, or tumor size > 10 cm, received adjuvant TACE therapy.15,19,20 The expression profiles of GSE104580 and GSE14520 were downloaded from the GEO database (http://www.ncbi.nlm.nih.gov/GEO). Then, we included patients who were treated with TACE as the initial treatment at the Cancer Hospital Chinese Academy of Medical Sciences from February 2014 to February 2018. Inclusion criteria for the study were as follows: (1) diagnosis with HCC by biopsy, (2) availability of pathological HCC tissues, (3) age ≥ 18, (4) Child-Pugh stage A or B, (5) ECOG performance score ≤ 1, (6) initial treatment of TACE, and (7) life expectancy of over 3 months. The exclusion criteria were as follows: (1) use of another antitumor treatment after TACE, (2) occurrence of other malignant tumors, (3) extrahepatic metastasis and (4) incomplete clinical data. Finally, 29 samples of available archived formalin-fixed paraffin-embedded (FFPE) puncture pathological tissue of HCC were included in the external validation set (Figure 1C). The purpose of selecting puncture tissue before treatment was to avoid the influence of resection on the research as much as possible. The institutional review board approved the use of these FFPE tissues and waived the requirement for informed consent. The clinical baseline characteristics of patients in the GSE14520 and external verification sets are shown in Tables 1 and 2, respectively.
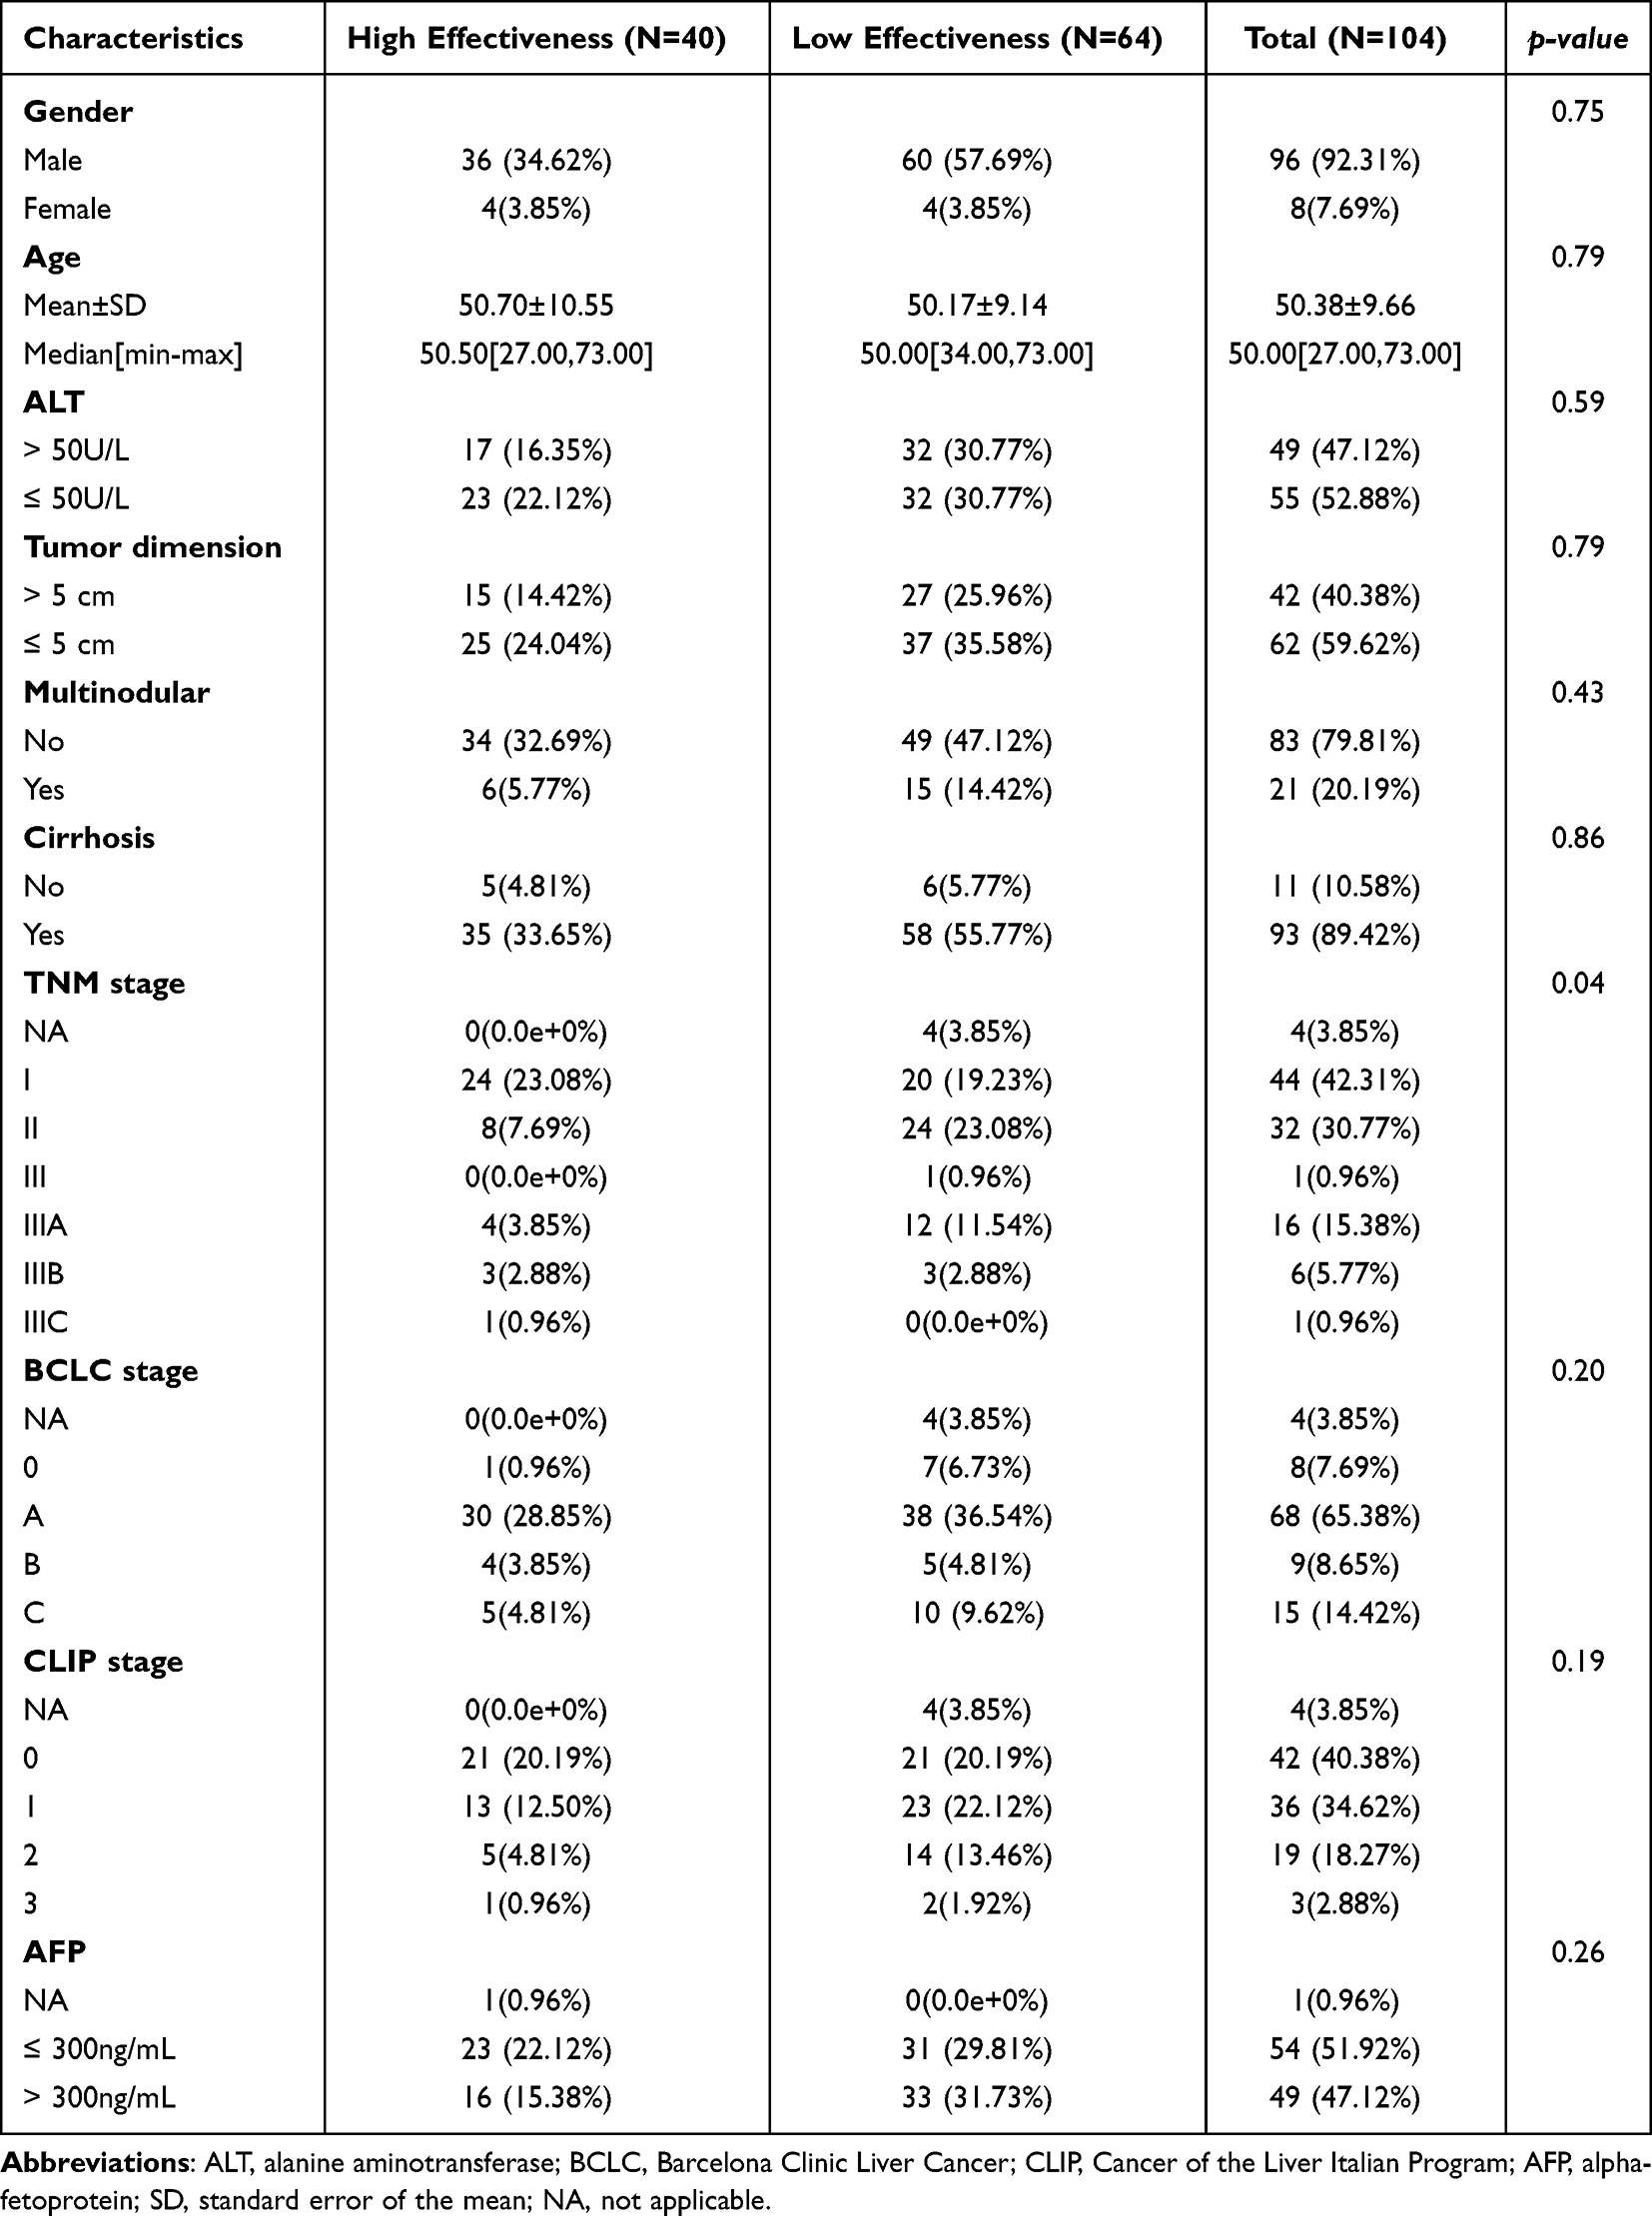 |
Table 1 The Clinical Baseline Characteristics of Patients in GSE14520 |
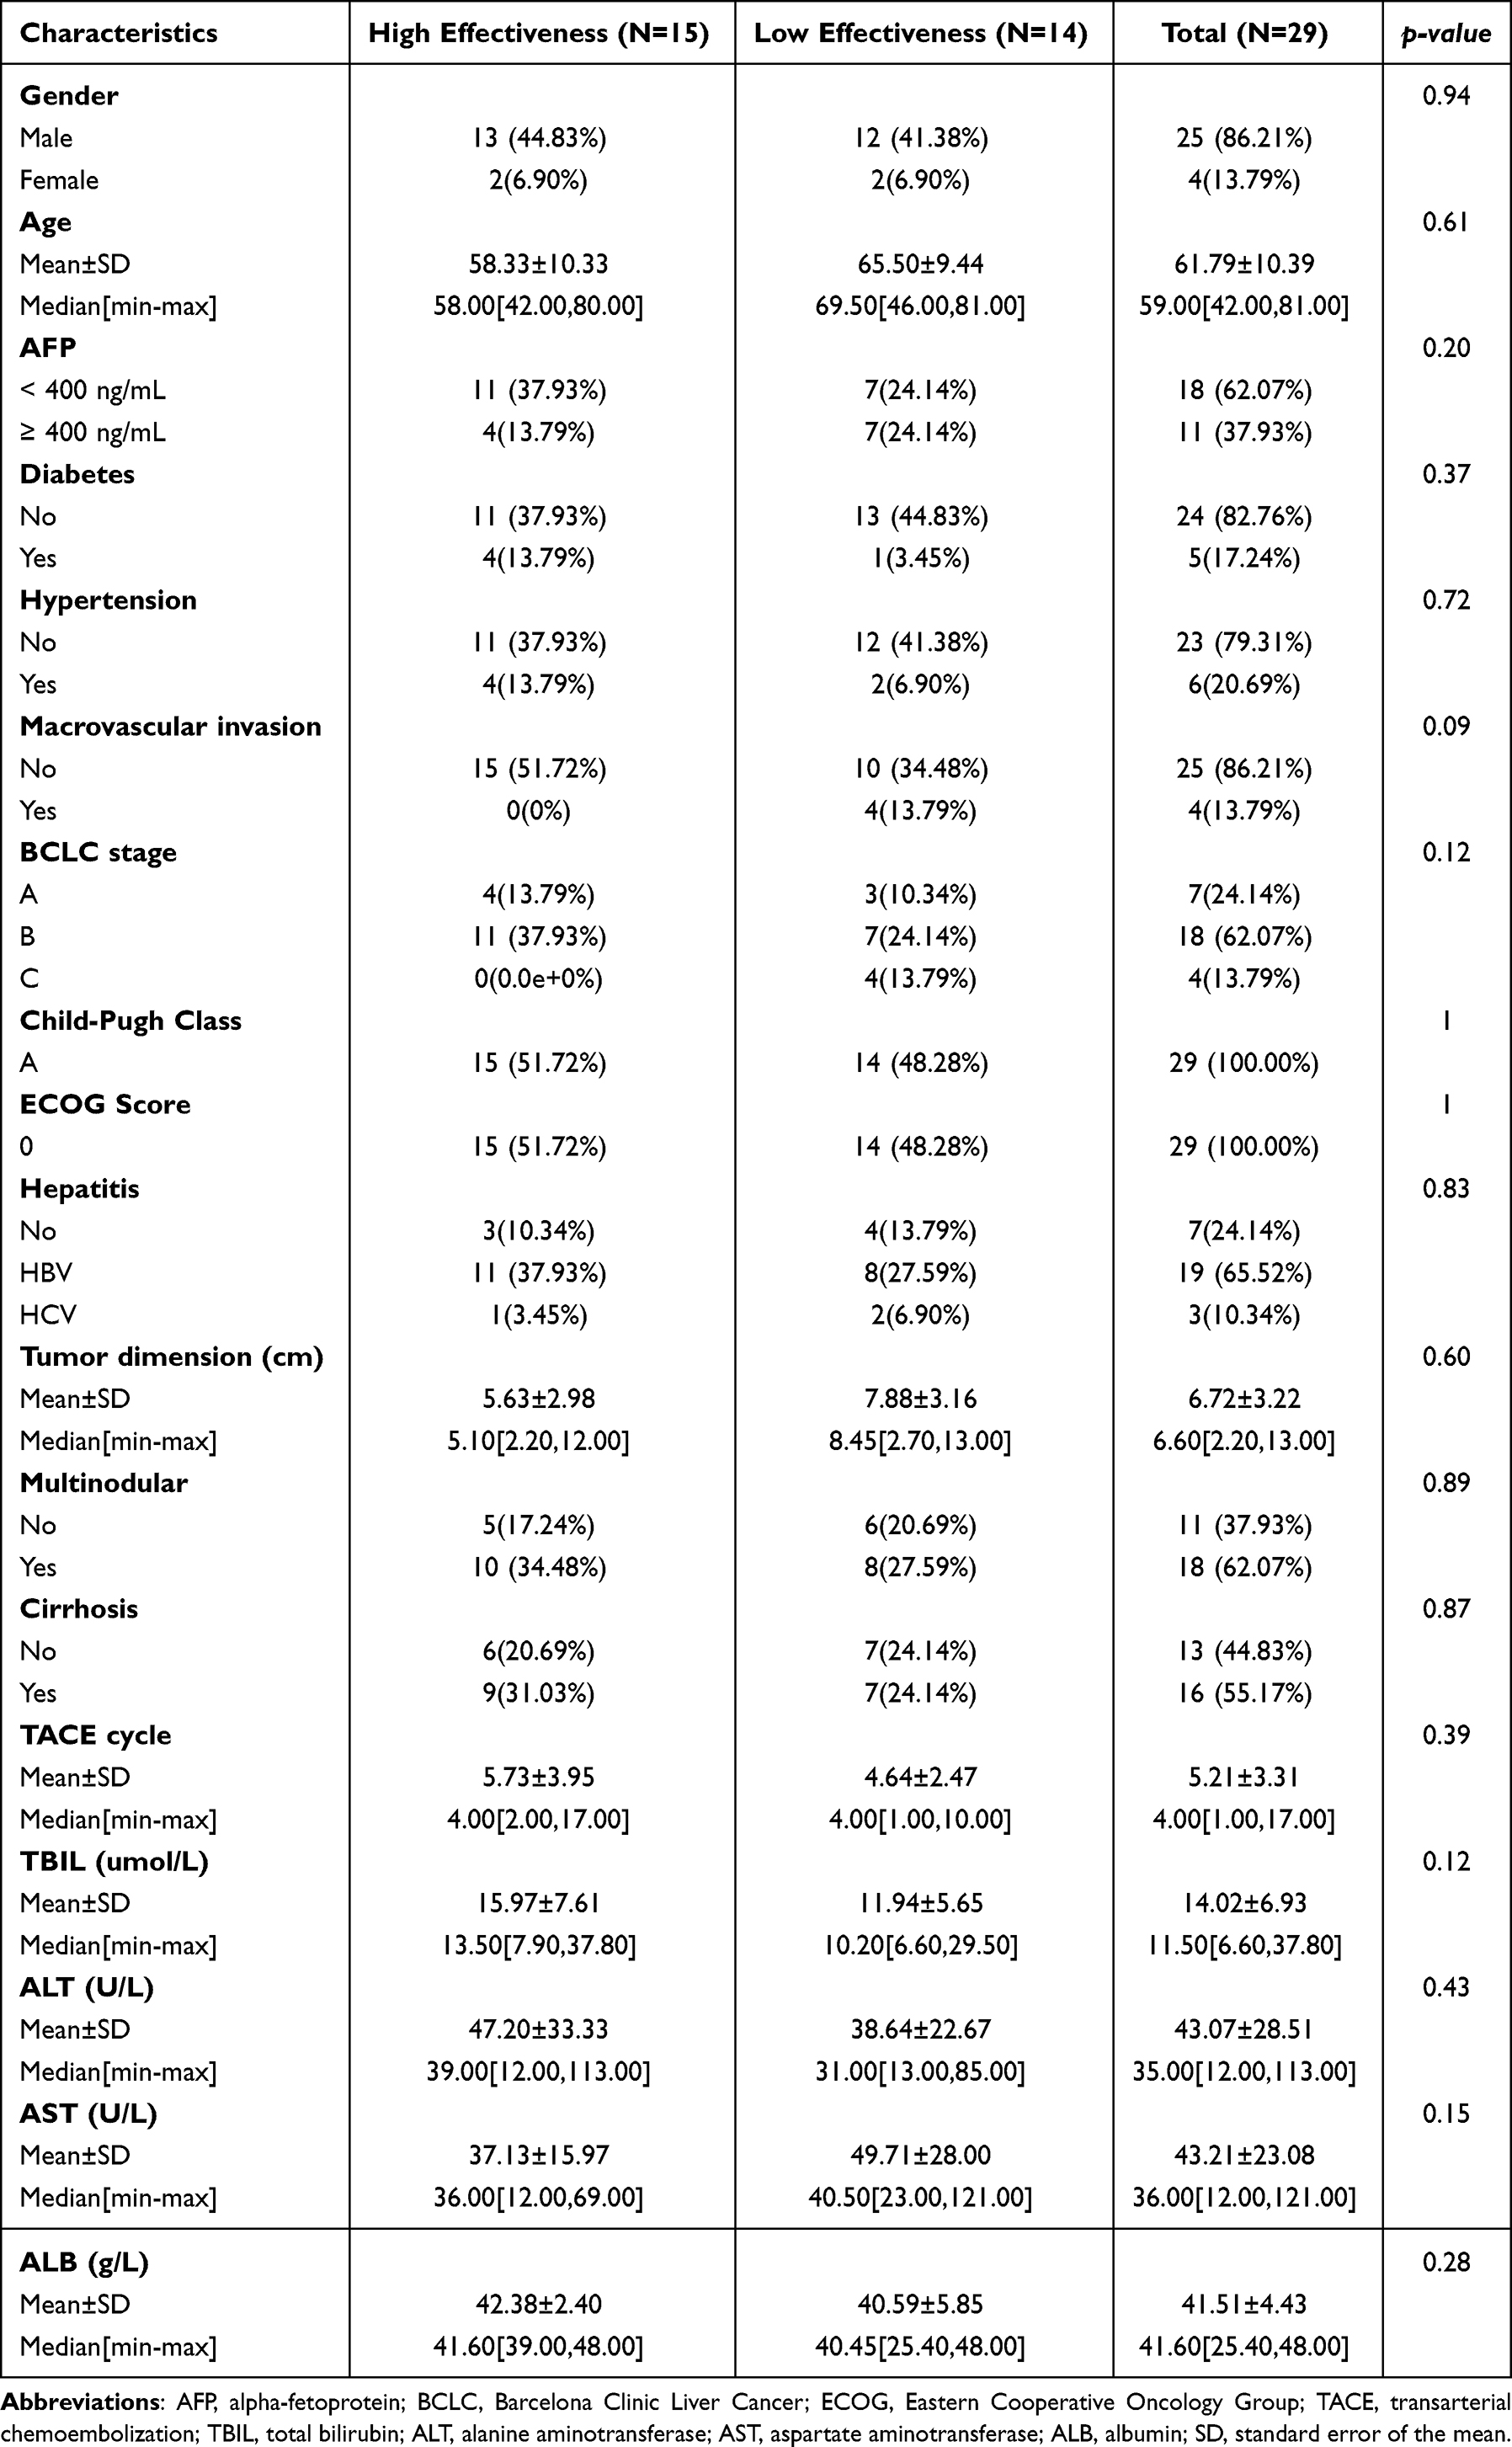 |
Table 2 The Clinical Baseline Characteristics of Patients in the External Validation Set |
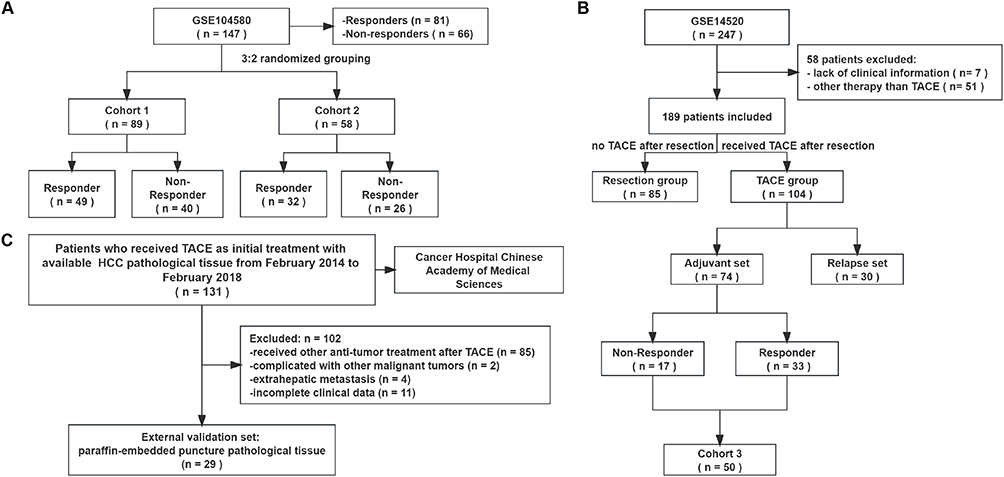 |
Figure 1 The grouping and inclusion/exclusion of datasets in this study. (A) The description and grouping of GSE104580. (B) After applying the exclusion criteria, group GSE14520 was based on the treatment approach. (C) The description and inclusion/exclusion of external validation set. Abbreviation: TACE, transarterial chemoembolization. |
Development of the TACE Effectiveness Model
Identification of Differentially Expressed Genes
The “Limma” package was used to identify the differentially expressed genes between TACE responders and non-responders in cohort 1 (|Fold Change| > 1.3, p < 0.05). Studies have shown that the early recurrence of tumors after resection was related to the early dissemination of the primary tumor,18,21 which may mean that in the adjuvant TACE set, patients with recurrence within 1 year may have poor reactivity to TACE. Similar to Wei et al20 to investigate the genetic signature related to TACE responsiveness, we compared the differences in transcriptional characteristics between patients with recurrence within 1 year (n = 17) and without recurrence after 2 years (n = 33) in the adjuvant set (|fold change| > 1.3, p < 0.05), and we enrolled these 50 patients in cohort 3 (Figure 1B). Finally, the common differentially expressed genes of cohort 1 and cohort 3 were obtained and visualized by the “venndiag” package.
Calculation of TACE Effectiveness Score
The intersection of differential genes was used to construct a TACE effectiveness model in cohort 1. The “glmnet” R package was used to integrate the differential gene expression data and patient response to TACE, and logistic regression analysis was utilized to develop the prediction model in cohort 1. Subsequently, the regression coefficients of each signature gene and the formula for calculating the effectiveness score of TACE were determined:

To balance the false positive rate and false negative rate, we set the threshold of this model to 0.5. In general, the TACE effectiveness score of patients was calculated based on the expression of signature genes and the corresponding regression coefficients. When the score was greater than 0.5, we speculated that this patient may exhibit better responsiveness to TACE (high TACE effectiveness), indicating a more favorable prognosis associated with undergoing the TACE treatment. Conversely, if the score was below 0.5, the patient’s prognosis following TACE treatment may be less favorable (low TACE effectiveness). Eventually, all patients were divided into the TACE high effectiveness group (HE group) and the TACE low effectiveness group (LE group).
Verification of the TACE Effectiveness Model
First, receiver operating characteristic (ROC) curve analysis was used to illustrate the accuracy of our model in evaluating the effectiveness of TACE in HCC patients. In addition to the evaluation of cohort 1 and cohort 2, we also evaluated the prediction accuracy of our model in cohort 3. As mentioned earlier, we regard patients with recurrence within 1 year as TACE low effectiveness and patients without recurrence after 2 years as TACE high effectiveness. Subsequently, the “survival” and “survfit” packages were utilized to develop Kaplan‒Meier survival curves to analyze the difference in prognosis between the HE and LE groups in GSE14520. OS was defined as the time interval from initial TACE treatment to death from any cause, disease-free survival (DFS) was defined as the time interval between initial TACE treatment (adjuvant TACE) and the recurrence of disease or death from any cause, and progression-free survival (PFS) was defined as the time interval from initial TACE treatment to tumor progression or death for any reason. Furthermore, a survival heatmap was used to show the relationship between patient prognosis, TACE effectiveness score and signature gene expression. The prcomp function in the “stats” package was used for principal component analysis (PCA).
Immunohistochemistry Analysis
To further verify the ability of our signature to predict the effectiveness of TACE, immunohistochemical (IHC) staining of the paraffin-embedded HCC biopsy tissues of patients in the external verification was performed according to the manufacturer’s instructions. Anti-GNMT antibody (Abcam, #ab224753, 1:1000) and anti-MMP12 antibody (Abcam, #ab137444, 1:100) were used for IHC. The staining score indicative of relative protein expression levels was calculated according to the mean optical density (OD) value of the randomly selected visual field by ImageJ (2.9.0/1.53t). Following this, we employed the staining scores of the two proteins as relative protein expression levels to calculate the relative TACE effectiveness scores for each patient in the external validation set using the same formula and methodology. Subsequently, patients were categorized into HE and LE groups based on the median score of relative TACE effectiveness scores. The above operations were performed by two independent pathologists.
Immune Infiltration Analysis
CIBERSORTx22 (https://cibersortx.stanford.edu) was used to evaluate and quantify the infiltration levels of various immune cells in each sample. Subsequently, we further compared the difference in immune cell infiltration between the HE and LE groups, as well as TACE responders and non-responders. In addition, simulation studies were carried out using the Tumor Immune Dysfunction and Exclusion (TIDE) algorithm (http://tide.dfci.harvard.edu/), which can simulate the primary mechanisms of tumor immune escape, including T-cell dysfunction in tumors, cytotoxic T lymphocyte (CTL) invasion levels, and the exclusion properties of T cells in tumors with low levels of CTL invasion, and the final TIDE score can be given to predict the tumor response to immunotherapy.23
Functional Enrichment Analysis
The potential molecular mechanisms and biological functions related to TACE effectiveness were explored by gene set enrichment analysis (GSEA) and Kyoto Encyclopedia of Genes and Genomes (KEGG) enrichment analysis. The GSEA method was used to understand the enriched pathways in both groups. The molecular signature dataset was analyzed by Java GSEA v.4.2.2 and h. all. v7.5.1 symbols. gmt [Hallmarks] [threshold criteria: |NES| > 1.4, p < 0.05 and false discovery rate (FDR) < 0.21]. The differentially expressed genes (|fold change| > 1.2, p < 0.05) between TACE responders and non-responders in GSE104580, and the HE and LE groups in the TACE group were included in the KEGG enrichment analysis (https://www.kegg.jp/kegg/rest/keggapi.html, FDR < 0.1, p < 0.05).
Statistical Analysis
R version 3.6.1 and 4.1.1 were used to conduct statistical analyses. Pearson’s or Spearman’s rank correlation coefficients were used to investigate the relationship between variables. The continuous variables and normal distributions recorded for the two groups were compared using a t-test or Mann‒Whitney U-test. Categorical variables were compared using Fisher’s exact or chi-squared tests. The Kaplan‒Meier (KM) method was used to plot receiver operating characteristic (ROC) curves. The statistical significance was determined using Log rank tests (statistical significance: p < 0.05).
Results
Construction of a Gene Signature for Predicting the Effectiveness of TACE
As shown in Figure 2, we first identified the differentially expressed genes between TACE responders and non-responders in cohort 1 and cohort 3 (Figure 2A and B). Then, we obtained the intersection of the differentially expressed genes in the two cohorts (Figure 2C), namely, matrix metallopeptidase 12 (MMP12), glycine N-methyltransferase (GNMT) and anterior gradient 2 (AGR2). Among them, MMP12 and AGR2 exhibited a downregulated trend, while GNMT exhibited an upregulated trend in TACE responders compared with TACE non-responders (Figure 2A and B).
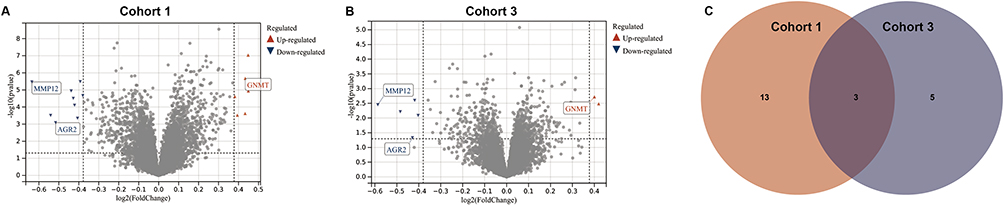 |
Figure 2 Screening of differential genes related to the effectiveness of TACE. Differentially expressed genes between responders and non-responders in cohort 1 (A) and cohort 3 (B). (C) The Venn diagram showed the intersection of differential genes related to TACE effectiveness in Cohort 1 and Cohort 3. Abbreviations: MMP12, matrix metalloproteinase-12; GNMT, glycine N-methyltransferase; AGR2, anterior gradient 2. |
Afterward, using these three genes, we constructed a gene signature for calculating the TACE effectiveness score of patients by logistic regression. Ultimately, the TACE effectiveness score for each patient was calculated based on the following equation:
TACE Effectiveness Score = (expression level of GNMT * 0.393480404) - (expression level of MMP12 * 0.295095776) - 0.882549992
All patients were divided into HE and LE groups according to the TACE effectiveness score, the grouping threshold was established at 0.5. When the effectiveness score surpasses 0.5, the patient falls into the HE group and, conversely falls into the LE group.
The 2-Gene Signature Can Accurately Predict the Effectiveness of TACE in Patients
ROC analysis illustrated the accuracy of our 2-gene signature in predicting TACE effectiveness. As shown in Figure 3A-C, the area under the curve (AUC) was 0.83 in cohort 1, 0.83 in cohort 2 and 0.80 in cohort 3.
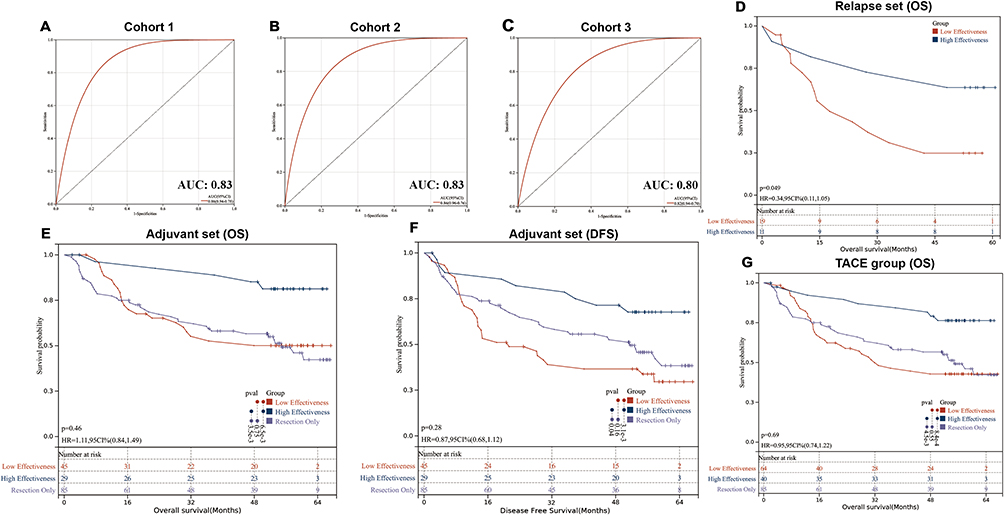 |
Figure 3 Evaluation of the predictive ability of the TACE effectiveness model by the receiver operating characteristic (ROC) analysis and Kaplan-Meier (KM) analysis. The ROC curves of our model for predicting patients’ response to TACE in cohort 1 (A), cohort 2 (B), and cohort 3 (C). KM analysis of overall survival and disease-free survival between low effectiveness and high effectiveness groups in relapse set (D), adjuvant set (E and F), and TACE group (G). Abbreviations: AUC, the area under the curve; OS, overall survival; DFS, disease-free survival; pval, p-value; HR, hazard ratio; CI, confidence interval. |
Subsequently, we compared the OS and DFS between patients in the HE and LE groups in each subgroup of GSE14520, including the relapse set, adjuvant set, TACE group and resection group. For patients with a high risk of recurrence, adjuvant TACE was conducted, and other patients were treated with TACE at the time of recurrence. At this time, the long-term prognosis of patients depends largely on their responsiveness to TACE.15,20 In the relapse set, the OS of patients in the HE group was significantly higher than that of patients in the LE group (Figure 3D, p < 0.05), which indicated that the HE group had a higher responsiveness to TACE than the LE group among patients who received only TACE treatment after tumor recurrence. In the adjuvant set, patients in the HE group had a significantly better OS and DFS than the LE group and resection group (Figure 3E and F, p < 0.05), and there was no significant difference in OS and DFS between the LE group and resection group (Figure 3E and F), which demonstrated that most of the patients in the LE group did not benefit significantly from TACE treatment. In the whole TACE group, patients in the HE group still had a better prognosis, and no significant difference was found between the LE and resection groups (Figure 3G). ROC curve analysis showed the accuracy of our model in predicting OS and PFS (Supplementary Figure 1A and B). Interestingly, when comparing the prognosis of HE and LE group patients in the resection group, we found no significant difference in OS or DFS (Figure 4A and B), and the univariate and multivariate Cox regression analyses revealed that the grouping generated by our model does not emerge as a significant factor influencing the prognosis of surgical patients, which indicated the specificity of our model (Supplementary Figure 1C-F).
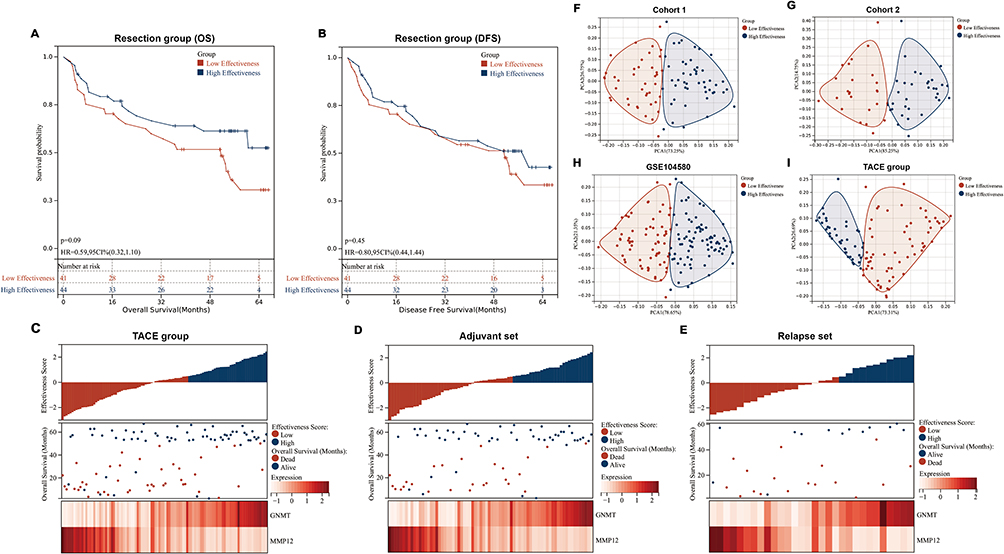 |
Figure 4 Evaluation of the prediction performance of our model by Kaplan-Meier (KM) analysis, principal component analysis, and survival heat map. KM analysis of overall survival and disease-free survival between low and high effectiveness groups in resection group (A, B). The survival heatmap displayed the distribution of patients’ effectiveness score, prognostic performance, and the expression of signature genes in the TACE group (C), adjuvant set (D), and relapse set (E). The principal component analysis of patients in cohort 1 (F), cohort 2 (G), GSE104580 (H), and TACE group (I) is based on the TACE effectiveness model. Abbreviations: TACE, transarterial chemoembolization; MMP12, matrix metalloproteinase-12; GNMT, glycine N-methyltransferase; OS, overall survival; DFS, disease-free survival; pval, p-value; HR, hazard ratio. |
The survival heatmap revealed that with the decrease in MMP12 expression and the increase in GNMT expression, the effectiveness score increased gradually; when the effectiveness score was less than 0.5, the OS of patients was lower, and more patients died, and when the score was higher than 0.5, the prognosis of patients was better (Figure 4C-E). Furthermore, the PCA yielded a two-way distribution for patients between the HE and LE groups in various cohorts (Figure 4F-I).
Finally, the statistically significant results of univariate regression were incorporated into multivariate Cox regression analysis, which demonstrated that the LE group was an independent risk factor for OS (HR: 3.890, 95% CI: 1.673–9.043, p < 0.05) and DFS (HR: 2.451, 95% CI: 1.119–5.369, p < 0.05) in patients treated with TACE (Figure 5A-D).
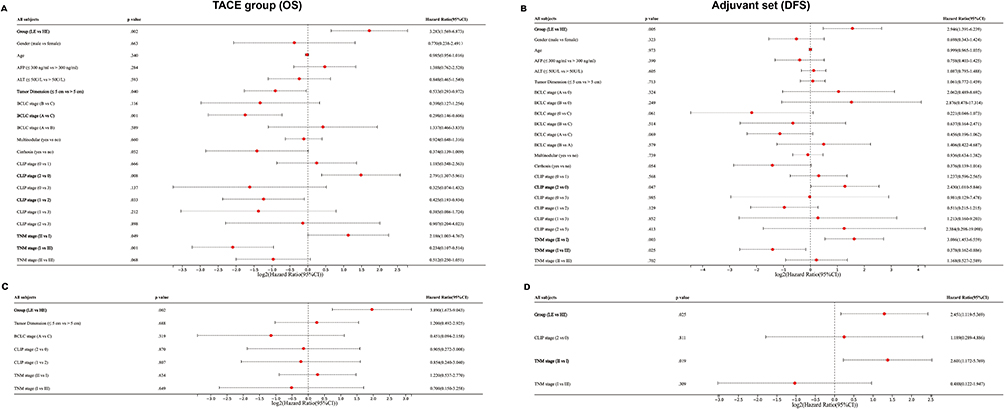 |
Figure 5 Univariate and multivariate analysis to evaluate the factors influencing the effectiveness of TACE. Univariate analysis to evaluate the factors influencing overall survival (OS) and disease-free survival (DFS) of patients treated with TACE in TACE group (A) and adjuvant set (B). The statistically significant factors identified through univariate analysis were included in the multivariate analysis to assess the independent risk factors influencing OS and DFS in patients treated with TACE in the TACE group (C) and adjuvant set (D). Bolded text indicates statistical significance (p < 0.05). Abbreviations: LE, low effectiveness; HE, high effectiveness; AFP, alpha-fetoprotein; BCLC, Barcelona Clinic Liver Cancer; TACE, transarterial chemoembolization; ALT, alanine aminotransferase; CLIP, Cancer of the Liver Italian Program; OS, overall survival; DFS, disease-free survival; CI, confidence interval. |
Further Verification of IHC Analysis
A total of 29 patients were selected for inclusion in the external validation set. The baseline characteristics of the two groups are shown in Table 2, and there was no significant difference in baseline data including age, TACE cycle, number and dimension of tumor between the two groups (p > 0.05). After obtaining the IHC staining scores of GNMT and MMP12 in the external verification set, we scored the relative TACE effectiveness of each patient through our model and then similarly divided the patients into the HE and LE groups (Figure 6A). The relative expression of GNMT was significantly higher and MMP12 was lower in the HE group than in the LE group (Figure 6B and C, p < 0.05). Additionally, KM survival and univariate and multivariate Cox regression analyses were performed. The results of the KM survival curve illustrated that TACE was more effective for HE group patients (Figure 7A and B, p < 0.05). The median OS was 881 days (95% CI: 719–1043 days) in the HE group and 273 days (95% CI: 190–356 days) in the LE group. The median PFS of the HE group was 458 days (95% CI: 309–607 days), and that of the LE group was only 136 days (95% CI: 82–190 days). We included the statistically significant indicators in univariate regression (Supplementary Figure 2A and B) in multivariate regression analysis (Figure 7C and D) and finally verified that LE status was an independent risk factor for OS (HR: 2.661, 95% CI: 1.042–6.797, p < 0.05) and PFS (HR: 2.607, 95% CI: 1.054–6.448, p < 0.05). In addition, the TACE cycle and tumor dimension were also independent influencing factors for OS (Figure 7C).
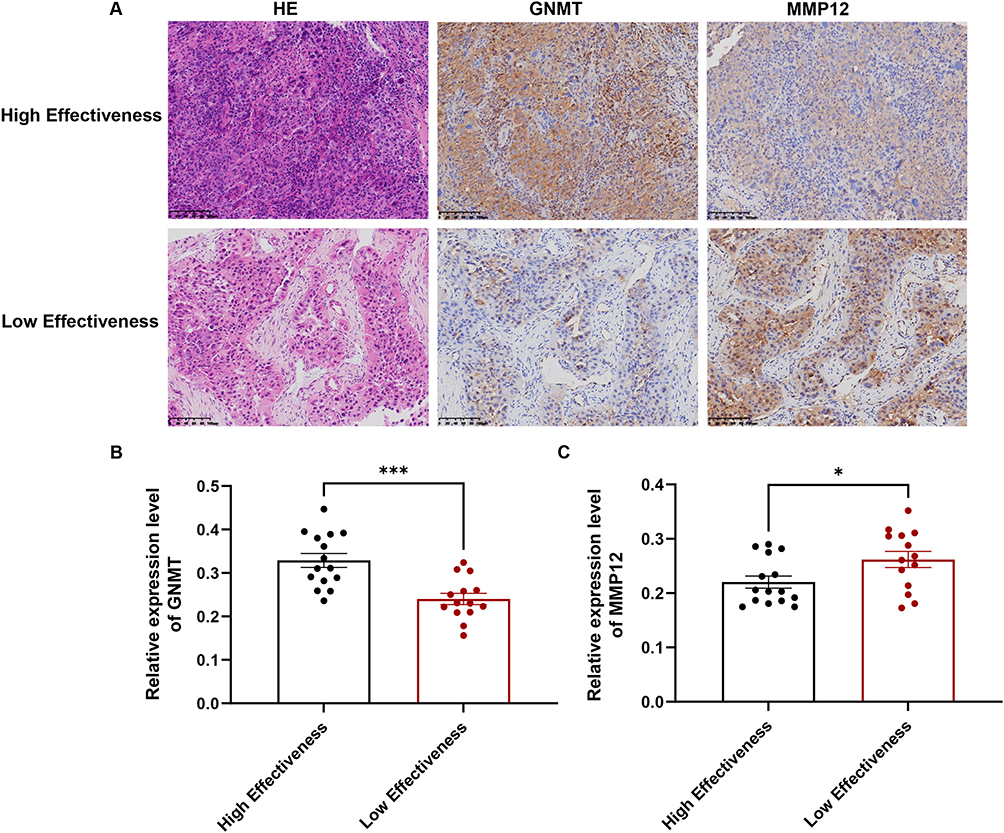 |
Figure 6 Immunohistochemical (IHC) staining analysis on external validation set to validate the expression trends of the signature genes. (A) Hematoxylin eosin staining and the IHC staining analysis of GNMT and MMP12 in high and low effectiveness group patients. The difference of GNMT (B) and MMP12 (C) relative expression levels between high and low effectiveness group patients. (* p < 0.05; *** p < 0.001). Abbreviations: MMP12, matrix metalloproteinase-12; GNMT, glycine N-methyltransferase; HE, hematoxylin-eosin staining. |
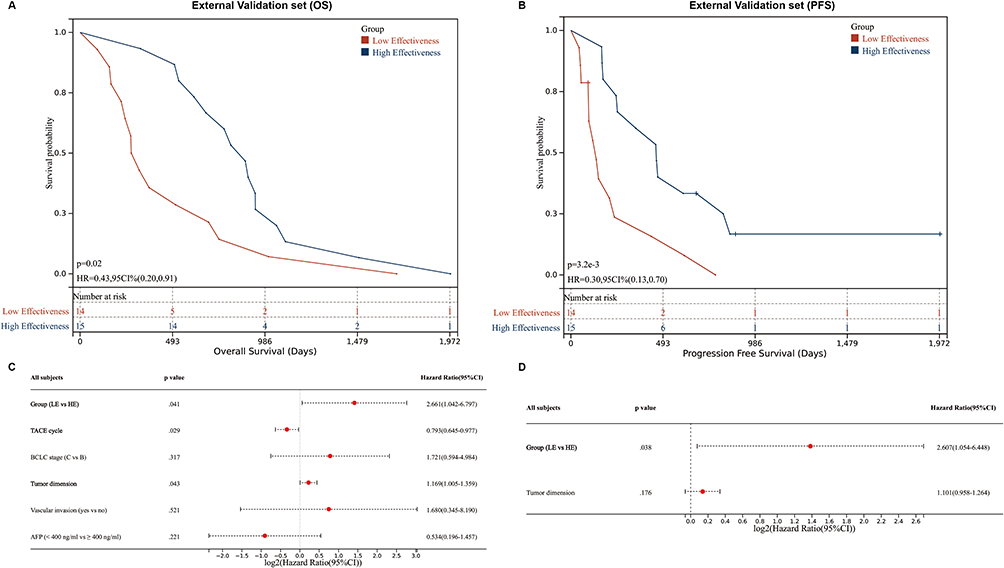 |
Figure 7 Validation for the predictive ability of the TACE effectiveness model by Kaplan-Meier (KM) analysis and multivariate analysis in external validation set. KM analysis of overall survival (A) and progression-free survival (B) in external validation set. The statistically significant factors identified through univariate analysis were included in the multivariate analysis to assess the independent risk factors influencing overall survival (C) and progression-free survival (D) in patients undergoing TACE in an external validation set. Bolded text indicates statistical significance (p < 0.05). Abbreviations: LE, low effectiveness; HE, high effectiveness; AFP, alpha-fetoprotein; BCLC, Barcelona Clinic Liver Cancer; TACE, transarterial chemoembolization; OS, overall survival; DFS, disease-free survival; HR, hazard ratio; CI, confidence interval. |
Immune Infiltration Analysis
We investigated the relationship between the HCC immune microenvironment and the efficacy of TACE. As shown in Figure 8A, in terms of the TACE group, the infiltration level of M0 macrophages and activated mast cells in the LE group was significantly higher than that in the HE group (p < 0.05), while the level of resting mast cells was significantly lower than that in the HE group (p < 0.05). The same results were verified in GSE104580, whether it was non-responders vs responders or LE vs HE divided according to the model (Figure 8B and C). The TIDE algorithm was then applied to gain insights into the mechanisms involved in HCC immune evasion and forecast the potential response to immunotherapy for patients with different efficacies of TACE. Figure 8D showed that the TIDE scores of HE group patients were significantly lower than those of LE group patients (p < 0.05), which indicated that patients who exhibit better responsiveness to TACE may also demonstrate a favorable response to immunotherapy. This result was verified in GSE104580 (LE vs HE) (Figure 8F), and showed the same trend in non-responder vs responder, while it did not reach statistical significance (Figure 8E). Similarly, an analogous result was found in terms of T-cell exclusion; that is, more significant T-cell exclusion occurred in patients with poor TACE effectiveness. In addition, HE or responder group patients had higher microsatellite instability (MSI) expression and fewer myeloid-derived suppressor cells (MDSCs) in both datasets (p < 0.05, Figure 8D–F). Research has shown that CD24+ HCC cells possessed a significantly high survival ability after exposure to doxorubicin under hypoxia,20 and there was a significant negative correlation between the expression of CD24 and our effectiveness score (r = −0.54 in GSE104580 and −0.40 in GSE14520, p < 0.05, Supplementary Figure 3A and B).
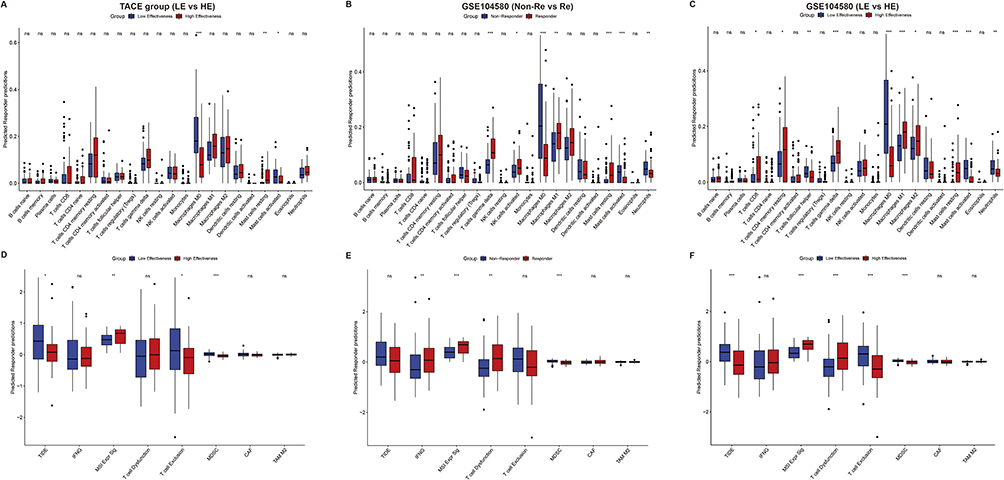 |
Figure 8 Immune infiltration and immune simulation analysis to evaluate the infiltration levels of various immune cells and the efficacy of immunotherapy between different groups. The immune infiltration analysis showed the differential infiltration of various immune cells between the low and high effectiveness group in TACE group (A), the non-responder and responder groups in GSE104580 (B), low and high effectiveness group in GSE104580 (C). The immune simulation analysis showed the difference in various immune scores between the low and high effectiveness groups in the TACE group (D), non-responder and responder groups in GSE104580 (E), and LE and HE group in GSE104580 (F). TIDE, tumor immune dysfunction, and exclusion; IFNG, interferon-gamma; MSI, microsatellite instability; MDSC, myeloid-derived suppressor cells; CAF, cancer-associated fibroblasts; TAM, tumor-associated macrophages; LE, low effectiveness; HE, high effectiveness; Re, responder. (* p < 0.05; ** p < 0.01; *** p < 0.001). Abbreviation: ns, no statistical significance. |
Functional Enrichment Analysis Based on the Signature
To explore the mechanism of the poor response to TACE in the LE group, GSEA and KEGG enrichment analyses were conducted. First, GSEA showed that the hypoxia signaling pathway, unfolded protein response, G2M checkpoint, mechanistic target of rapamycin complex 1 (mTORC1) signaling and MYC targets version 1 pathway were enriched in the LE group (|NES| > 1.4, p < 0.05 and false discovery rate (FDR) < 0.21). These results were consistent in the TACE group and GSE104580 (Figure 9A and B). Additionally, KEGG enrichment analysis was carried out. Ninety-seven differentially expressed genes between responders and non-responders in GSE104580 and 98 differentially expressed genes between the HE and LE groups in the TACE group were screened out (|Fold Change| > 1.2, p < 0.05). The results revealed that the differentially expressed genes related to the efficacy of TACE were mainly enriched in metabolic pathways, the hypoxia-inducible factor-1 (HIF-1) signaling pathway, the glycolysis pathway and the bile secretion pathway (FDR < 0.1, p < 0.05, Figure 9C and D).
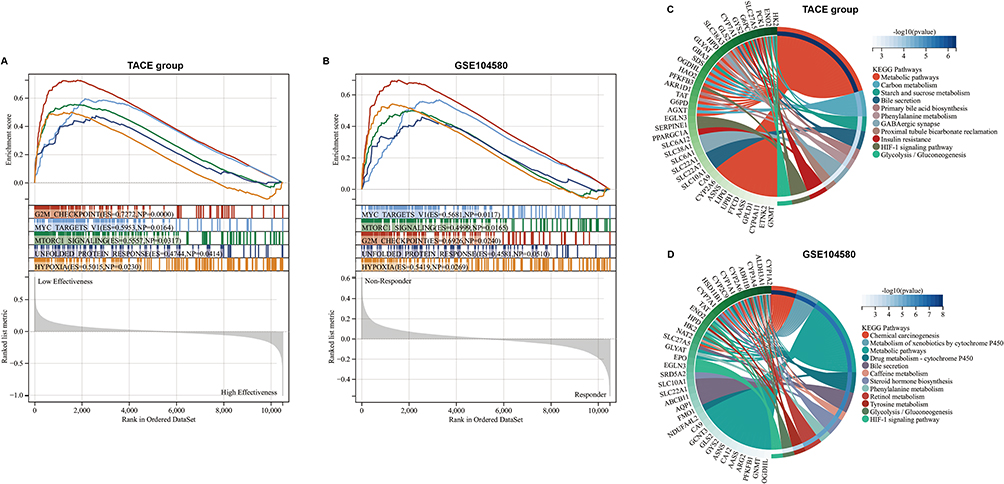 |
Figure 9 Exploration for related pathways influencing the effectiveness of TACE by functional enrichment analysis. Gene set enrichment analysis exhibited that five hallmark pathways were all enriched in the low effectiveness patients in the TACE group (A) and non-responders in GSE104580 (B). Kyoto Encyclopedia of Genes and Genomes enrichment analysis exhibited that differentially expressed genes between low and high effectiveness groups in TACE (C), non-responder, and responder groups in GSE104580 (D) were enriched in several same pathways. Abbreviation: TACE, transarterial chemoembolization. |
Discussion
Currently, TACE holds a crucial position within the treatment paradigm of HCC. At least 30% of patients receive TACE treatment in the course of HCC treatment,20 whether as a first-line therapeutic approach or as a pivotal component of combination or conversion therapy. However, even when the same TACE procedure is applied, patients may exhibit substantial differences in survival benefits. The majority of previous studies have focused on the performance of lipiodol deposition or the prediction of patient prognosis based on other imaging features or clinical characteristics, while this phenomenon has not been explored at the molecular level (which may be attributed to the practical clinical situation: the diagnosis of HCC does not rely on pathological examination, resulting in a limited availability of sufficient TACE treatment-related samples). Indeed, the true biological status of lesions filled with lipiodol remains unclear, and the precise molecular mechanisms underlying TACE treatment and its impact on efficacy have yet to be determined.
In this study, we collected a total of three datasets for model construction and validation. Among them, patients from the adjuvant TACE group were considered to have a high risk of recurrence, as they were likely to have residual tumor cells even after surgical resection. Therefore, we hypothesize that the OS and DFS of these patients primarily depend on the efficacy of adjuvant TACE, which is consistent with previous research. Additionally, FFPE samples from HCC patients who received TACE monotherapy were collected as an external validation set. The purpose of selecting patients receiving TACE monotherapy was to minimize the impact of other treatment interventions on the outcomes, thereby enhancing the reliability of the validation results. However, as mentioned earlier, the main disadvantage of this approach is the limited sample size.
Our 2-gene signature can accurately differentiate between HE and LE patients. The results indicated that in various cohorts, including the external validation set, patients in the HE group exhibited significantly higher OS, DFS and PFS than those in the LE group. The study findings revealed that the median OS for TACE treatment in HCC was 19.4 months, accompanied by a median PFS spanning from 3 to 9 months.8 Within this study, LE group patients displayed a notably lower median OS of only 237 days and a median PFS of 136 days, the HE group exhibited a substantially higher median OS of 881 days and a median PFS of 458 days. Furthermore, in the study conducted by Fako et al,15 TACE Non-Responders in the TACE group demonstrated a median OS of 39.5 months, whereas, in our study, the LE group of patients within the TACE group showed a lower median OS of only 31.9 months. Moreover, in comparison to the resection group, whether in the TACE group or the adjuvant set, patients in the LE group did not experience a significant improvement in prognosis, even receiving additional TACE treatment after resection. This suggests that patients in the LE group did not derive significant benefits from TACE therapy. Furthermore, our model did not demonstrate any efficacy in the resection group, indicating that it was effective only in patients who received TACE treatment. This observation suggests that the signature genes were not solely associated with prognosis but also have underlying connections to the molecular mechanisms of TACE therapy. Multiple studies have demonstrated that GNMT, as a tumor suppressor in HCC, can inhibit HCC proliferation through various pathways.24–27 Loss of GNMT has been shown to result in spontaneous hepatic steatosis and HCC in mice.24 What truly intrigues us, however, is that Curtis et al28 discovered that the lack of GNMT can reduce glucose production from glycogen and gluconeogenic sources. This effect may occur through the redirection of glucose precursor flux toward pathways involved in regulating the liver redox state and tumorigenesis, including de novo glutathione synthesis and the pentose phosphate pathway. Theoretically, the reduction in hepatic glucose production not only contributes to the occurrence and development of HCC but also sustains the growth and proliferation of HCC by conserving nutrients and energy resources.29–32 Curtis et al found an increase in glucose-6-phosphate dehydrogenase (G6PDH) and a decrease in the ratio of glucose-6-phosphate (G6P) to ribulose 5-phosphate (R5P) in GNMT-knockout (GNMT-KO) mice. The former is a key regulator of the flux in the oxidative pentose phosphate pathway, which is routinely observed to be higher in HCC models with elevated pentose phosphate pathway flux,33 and the latter serves as an indicator of increased flux in the oxidative pentose phosphate pathway.34 Importantly, the reducing potential generated through the pentose phosphate pathway can alleviate oxidative stress and provide protection to tumor cells.35 This implied that the loss of GNMT may enable HCC cells to develop resistance against oxidative stress induced by TACE, potentially by increasing the flux in the oxidative pentose phosphate pathway. On the other hand, increased de novo synthesis of glutathione (GSH) was observed in the livers of GNMT-KO mice. GSH, as a crucial intracellular antioxidant, may also serve as a significant factor in combating oxidative stress responses induced by TACE therapy.36 In addition, the loss of GNMT can stimulate dormant hepatic cancer stem/progenitor cells to replicate,37 and a study found that hepatic cancer stem cells are highly involved in resistance to hypoxia and chemotherapy.20 MMP12, a member of the matrix metalloproteinase (MMP) family, plays a crucial role in extracellular matrix degradation, and its overexpression is associated with vascular invasion in HCC.38 Veronica et al39 demonstrated that levels of tryptase stored in mast cell granules can predict patients’ response to TACE, whose mechanism may involve the activation of MMPs by tryptase, leading to the degradation of the extracellular matrix, promoting the release of angiogenic factors from the matrix, and providing space for neovascular growth. In addition, the study illustrated that mast cells can promote tumor angiogenesis, thereby reducing the efficacy of TACE, which is consistent with our immune infiltration analysis.39
Ischemia and hypoxia caused by hepatic artery embolization are important factors contributing to the efficacy of TACE. Studies have shown that TACE can increase the expression of HIF-1α pathway components.40,41 In our analysis, we found that patients in the LE group already exhibited high expression of hypoxia signaling pathway components before the procedure. Considering this and the significant enrichment of the glycolysis pathway (which is known to increase under hypoxic conditions).42 In the LE group, we reasonably speculate that the hypoxic microenvironment may influence the efficacy of TACE, and numerous studies have indicated that hypoxia can induce resistance to stress and apoptosis in HCC.43,44 Additionally, MMPs and glucose metabolism-related enzymes are both involved in hypoxia-induced effects on HCC.43 Considering the impact of GNMT on glucose metabolism mentioned earlier, we propose that the loss of GNMT and the overexpression of MMP12 may create a hypoxic tumor microenvironment, ultimately diminishing the effectiveness of TACE. This is a hypothesis we are currently dedicated to investigating and validating.
Our signature demonstrates superior accuracy in predicting the effectiveness of TACE, with AUC values exceeding 0.80, in contrast to other signatures. Additionally, the 2-gene signature incurs lower detection costs compared to multi-gene signatures. Most notably, our study includes biopsy pathology samples exclusively from patients treated solely with TACE as external validation, and the results are validated at the protein level, enhancing the overall reliability of the model. However, this study has several limitations. Firstly, the data in the external validation set were retrospectively collected, introducing potential confounding factors due to the non-randomized design. Nevertheless, in the comparison of OS and PFS, we employed the median of the effectiveness score as the grouping threshold to ensure better comparability of other variables between the two groups (Table 2). Additionally, to minimize the impact of other treatment modalities on study results, we exclusively selected patients who solely underwent TACE treatment as an external validation set. Nonetheless, because the diagnosis of HCC is not solely dependent on pathology, resulting in the limited samples of puncture biopsy pathology, we were constrained to analyze using a restricted number of samples. Moreover, in the section on immune infiltration analysis, insufficient tissue samples hindered further validation. Despite these constraints, the study incorporated three independent datasets and underwent multiple queues for mutual validation, thereby enhancing result reliability. Finally, cellular experiments were not included in this study, but this is an area we are actively exploring.
Conclusion
In summary, we have developed a 2-gene signature consisting of GNMT and MMP12 that can accurately predict the effectiveness of TACE. Additionally, we proposed that the hypoxic microenvironment may be a critical factor influencing TACE efficacy. Our study has identified novel targets and provided new insights for future research, advancing TACE treatment toward the era of precision medicine.
Abbreviations
TACE, Transarterial chemoembolization; BCLC, Barcelona Clinic Liver Cancer; HCC, Hepatocellular carcinoma; GNMT, Glycine N-methyltransferase; MMP12, Matrix metalloproteinase-12; HE, High effectiveness; LE, Low effectiveness; OS, Overall survival; DFS, Disease-free survival; PFS, Progression-free survival; mRECIST, Modified Response Evaluation Criteria in Solid Tumors; JSH, Japan Society of Hepatology; FFPE, Formalin-fixed paraffin-embedded; ROC, Receiver operating characteristic; PCA, Principal component analysis; IHC, Immunohistochemical; OD, Optical density; TIDE, Tumor Immune Dysfunction and Exclusion; CTL, Cytotoxic T lymphocyte; GSEA, Gene set enrichment analysis; KEGG, Kyoto Encyclopedia of Genes and Genomes; FDR, False discovery rate; KM, Kaplan‒Meier; AGR2, Anterior gradient 2; AUC, Area under the curve; MSI, Microsatellite instability; MDSCs, Myeloid-derived suppressor cells; mTORC1, Mechanistic target of rapamycin complex 1; HIF-1, Hypoxia-inducible factor-1; G6PDH, Glucose-6-phosphate dehydrogenase; G6P, Glucose-6-phosphate; R5P, Ribulose 5-phosphate; KO, Knockout; GSH, Glutathione; MMP, Matrix metalloproteinase.
Data Sharing Statement
Data used for bioinformatic analysis in this manuscript was acquired from the Gene Expression Omnibus (GEO) database (https://www.ncbi.nlm.nih.gov/geo).
Ethics Approval and Informed Consent
Ethics committee of National cancer center/Cancer hospital, Chinese academy of medical sciences and Peking union medical college approved this retrospective study conducted in accordance with the ethical guidelines of the 1975 Declaration of Helsinki (Ethical review number: 2023083117125102). This is a retrospective study, the ethics committee waived the requirement for informed consent.
Consent to Participate
This is a retrospective study, the ethics committee waived the requirement for informed consent.
Author Contributions
Each author made substantial contributions to the work presented, whether it was through conception, study design, execution, data collection, analysis, and interpretation, or in all of these areas; took part in drafting, revising or critically reviewing the article; gave final approval of the version to be published; have agreed on the journal to which the article has been submitted; and agree to be accountable for all aspects of the work.
Funding
This study was supported by the Special Research Fund for Central Universities, Peking Union Medical College (3332023135).
Disclosure
All authors report no conflicts of interest in this work.
References
1. Sung H, Ferlay J, Siegel RL, et al. Global Cancer Statistics 2020: GLOBOCAN Estimates of Incidence and Mortality Worldwide for 36 Cancers in 185 Countries. CA Cancer J Clin. 2021;71(3):209–249. doi:10.3322/caac.21660
2. Villanueva A. Hepatocellular Carcinoma. N Engl J Med. 2019;380(15):1450–1462. doi:10.1056/NEJMra1713263
3. Llovet JM, Zucman-Rossi J, Pikarsky E, et al. Hepatocellular carcinoma. Nat Rev Dis Primers. 2016;2:16018. doi:10.1038/nrdp.2016.18
4. Lee TK, Guan XY, Ma S. Cancer stem cells in hepatocellular carcinoma - from origin to clinical implications. Nat Rev Gastroenterol Hepatol. 2022;19(1):26–44. doi:10.1038/s41575-021-00508-3
5. Chang Y, Jeong SW, Young Jang J, Jae Kim Y. Recent Updates of Transarterial Chemoembolilzation in Hepatocellular Carcinoma. Int J Mol Sci. 2020;21(21). doi:10.3390/ijms21218165
6. Forner A, Gilabert M, Bruix J, Raoul JL. Treatment of intermediate-stage hepatocellular carcinoma. Nat Rev Clin Oncol. 2014;11(9):525–535. doi:10.1038/nrclinonc.2014.122
7. Habib A, Desai K, Hickey R, Thornburg B, Lewandowski R, Salem R. Transarterial approaches to primary and secondary hepatic malignancies. Nat Rev Clin Oncol. 2015;12(8):481–489. doi:10.1038/nrclinonc.2015.78
8. Lencioni R, de Baere T, Soulen MC, Rilling WS, Geschwind JF. Lipiodol transarterial chemoembolization for hepatocellular carcinoma: a systematic review of efficacy and safety data. Hepatology. 2016;64(1):106–116. doi:10.1002/hep.28453
9. Bruix J, Sala M, Llovet JM. Chemoembolization for hepatocellular carcinoma. Gastroenterology. 2004;127(5 Suppl 1):S179–188. doi:10.1053/j.gastro.2004.09.032
10. Llovet JM, Lencioni R. mRECIST for HCC: performance and novel refinements. J Hepatol. 2020;72(2):288–306. doi:10.1016/j.jhep.2019.09.026
11. Kudo M, Izumi N, Kokudo N, et al. Management of hepatocellular carcinoma in Japan: consensus-Based Clinical Practice Guidelines proposed by the Japan Society of Hepatology (JSH) 2010 updated version. Dig Dis. 2011;29(3):339–364. doi:10.1159/000327577
12. Yang C, Luo YG, Yang HC, Yao ZH, Li X. Effects of Early TACE Refractoriness on Survival in Patients with Hepatocellular Carcinoma: a Real-World Study. J Hepatocell Carcinoma. 2022;9:621–631. doi:10.2147/JHC.S373112
13. Niu XK, He XF. Development of a computed tomography-based radiomics nomogram for prediction of transarterial chemoembolization refractoriness in hepatocellular carcinoma. World J Gastroenterol. 2021;27(2):189–207. doi:10.3748/wjg.v27.i2.189
14. Maesaka K, Sakamori R, Yamada R, et al. Hypovascular hepatic nodules as a predictive factor for transcatheter arterial chemoembolization refractoriness in hepatocellular carcinoma. Hepatol Res. 2020;50(3):365–373. doi:10.1111/hepr.13446
15. Fako V, Martin SP, Pomyen Y, et al. Gene signature predictive of hepatocellular carcinoma patient response to transarterial chemoembolization. Int J Biol Sci. 2019;15(12):2654–2663. doi:10.7150/ijbs.39534
16. He Q, Yang J, Jin Y. Development and Validation of TACE Refractoriness-Related Diagnostic and Prognostic Scores and Characterization of Tumor Microenvironment Infiltration in Hepatocellular Carcinoma. Front Immunol. 2022;13:869993. doi:10.3389/fimmu.2022.869993
17. Shi M, Lu LG, Fang WQ, et al. Roles played by chemolipiodolization and embolization in chemoembolization for hepatocellular carcinoma: single-blind, randomized trial. J Natl Cancer Inst. 2013;105(1):59–68. doi:10.1093/jnci/djs464
18. Villanueva A, Hernandez-Gea V, Llovet JM. Medical therapies for hepatocellular carcinoma: a critical view of the evidence. Nat Rev Gastroenterol Hepatol. 2013;10(1):34–42. doi:10.1038/nrgastro.2012.199
19. Roessler S, Jia HL, Budhu A, et al. A unique metastasis gene signature enables prediction of tumor relapse in early-stage hepatocellular carcinoma patients. Cancer Res. 2010;70(24):10202–10212. doi:10.1158/0008-5472.CAN-10-2607
20. Wei X, Zhao L, Ren R, et al. MiR‐125b Loss Activated HIF1α/pAKT Loop, Leading to Transarterial Chemoembolization Resistance in Hepatocellular Carcinoma. Hepatology. 2021;73(4).
21. Sun HC, Tang ZY. Preventive treatments for recurrence after curative resection of hepatocellular carcinoma--A literature review of randomized control trials. World J Gastroenterol. 2003;9(4):635–640. doi:10.3748/wjg.v9.i4.635
22. Newman AM, Steen CB, Liu CL, et al. Determining cell type abundance and expression from bulk tissues with digital cytometry. Nat Biotechnol. 2019;37(7):773–782. doi:10.1038/s41587-019-0114-2
23. Jiang P, Gu S, Pan D, et al. Signatures of T cell dysfunction and exclusion predict cancer immunotherapy response. Nat Med. 2018;24(10):1550–1558. doi:10.1038/s41591-018-0136-1
24. Martinez-Chantar ML, Vazquez-Chantada M, Ariz U, et al. Loss of the glycine N-methyltransferase gene leads to steatosis and hepatocellular carcinoma in mice. Hepatology. 2008;47(4):1191–1199. doi:10.1002/hep.22159
25. Frau M, Feo F, Pascale RM. Pleiotropic effects of methionine adenosyltransferases deregulation as determinants of liver cancer progression and prognosis. J Hepatol. 2013;59(4):830–841. doi:10.1016/j.jhep.2013.04.031
26. Li CH, Yen CH, Chen YF, et al. Characterization of the GNMT-HectH9-PREX2 tripartite relationship in the pathogenesis of hepatocellular carcinoma. Int J Cancer. 2017;140(10):2284–2297. doi:10.1002/ijc.30652
27. Martínez–López N, García–Rodríguez JL, Varela–Rey M, et al. Hepatoma Cells From Mice Deficient in Glycine N-Methyltransferase Have Increased RAS Signaling and Activation of Liver Kinase B1. Gastroenterology. 2012;143(3):787–798.e713. doi:10.1053/j.gastro.2012.05.050
28. Hughey CC, James FD, Wang Z, Goelzer M, Wasserman DH. Dysregulated transmethylation leading to hepatocellular carcinoma compromises redox homeostasis and glucose formation. Mol Metab. 2019;23:1–13. doi:10.1016/j.molmet.2019.02.006
29. Ma R, Zhang W, Tang K, et al. Switch of glycolysis to gluconeogenesis by dexamethasone for treatment of hepatocarcinoma. Nat Commun. 2013;4:2508. doi:10.1038/ncomms3508
30. Hughey CC, Trefts E, Bracy DP, James FD, Donahue EP, Wasserman DH. Glycine N-methyltransferase deletion in mice diverts carbon flux from gluconeogenesis to pathways that utilize excess methionine cycle intermediates. J Biol Chem. 2018;293(30):11944–11954. doi:10.1074/jbc.RA118.002568
31. Chen M, Zhang J, Li N, et al. Promoter hypermethylation mediated downregulation of FBP1 in human hepatocellular carcinoma and colon cancer. PLoS One. 2011;6.
32. Hirata H, Sugimachi K, Komatsu H, et al. Decreased Expression of Fructose-1,6-bisphosphatase Associates with Glucose Metabolism and Tumor Progression in Hepatocellular Carcinoma. Cancer Res. 2016;76(11):3265–3276. doi:10.1158/0008-5472.CAN-15-2601
33. Kowalik MA, Columbano A, Perra A. Emerging Role of the Pentose Phosphate Pathway in Hepatocellular Carcinoma. Front Oncol. 2017;7:87. doi:10.3389/fonc.2017.00087
34. Sato E, Mori T, Mishima E, et al. Metabolic alterations by indoxyl sulfate in skeletal muscle induce uremic sarcopenia in chronic kidney disease. Sci Rep. 2016;6:36618. doi:10.1038/srep36618
35. Stincone A, Prigione A, Cramer T, et al. The return of metabolism: biochemistry and physiology of the pentose phosphate pathway. Biol Rev Camb Philos Soc. 2015;90(3):927–963. doi:10.1111/brv.12140
36. Cong T, Luo Y, Fu Y, Liu Y, Li Y, Li X. New perspectives on ferroptosis and its role in hepatocellular carcinoma. Chin Med J (Engl). 2022;135(18):2157–2166. doi:10.1097/CM9.0000000000002327
37. Martinez-Chantar ML, Lu SC, Mato JM, et al. The role of stem cells/progenitor cells in liver carcinogenesis in glycine N-methyltransferase deficient mice. Exp Mol Pathol. 2010;88(2):234–237. doi:10.1016/j.yexmp.2010.01.004
38. Guo ZY, Jiang LP. Matrix metalloproteinase 12 (MMP12) as an adverse prognostic biomarker of vascular invasion in hepatic cell carcinoma. Eur Rev Med Pharmacol Sci. 2022;26(7):2238–2249. doi:10.26355/eurrev_202204_28454
39. Goffredo V, Gadaleta CD, Laterza A, Vacca A, Ranieri G. Tryptase serum levels in patients suffering from hepatocellular carcinoma undergoing intra-arterial chemoembolization: possible predictive role of response to treatment. Mol Clin Oncol. 2013;1(2):385–389. doi:10.3892/mco.2013.59
40. Jia ZZ, Jiang GM, Feng YL. Serum HIF-1alpha and VEGF levels pre- and post-TACE in patients with primary liver cancer. Chin Med Sci J. 2011;26(3):158–162. doi:10.1016/s1001-9294(11)60041-2
41. Yang L, Min X-L, Peng J, Yang K, Yang L, Zhang X-M. The Changes of HIF-1alpha and VEGF Expression After TACE in Patients With Hepatocellular Carcinoma. Int J Med. 2016.
42. Hsu PP, Sabatini DM. Cancer cell metabolism: Warburg and beyond. Cell. 2008;134(5):703–707. doi:10.1016/j.cell.2008.08.021
43. Xiong XX, Qiu XY, Chen XQ. Advances in Hypoxia-Mediated Mechanisms in Hepatocellular Carcinoma. Mol Pharmacol. 2017;92(3):246–255. doi:10.1124/mol.116.107706
44. Tak E, Lee S, Lee J, et al. Human carbonyl reductase 1 upregulated by hypoxia renders resistance to apoptosis in hepatocellular carcinoma cells. J Hepatol. 2011;54(2):328–339. doi:10.1016/j.jhep.2010.06.045
 © 2024 The Author(s). This work is published and licensed by Dove Medical Press Limited. The full terms of this license are available at https://www.dovepress.com/terms.php and incorporate the Creative Commons Attribution - Non Commercial (unported, v3.0) License.
By accessing the work you hereby accept the Terms. Non-commercial uses of the work are permitted without any further permission from Dove Medical Press Limited, provided the work is properly attributed. For permission for commercial use of this work, please see paragraphs 4.2 and 5 of our Terms.
© 2024 The Author(s). This work is published and licensed by Dove Medical Press Limited. The full terms of this license are available at https://www.dovepress.com/terms.php and incorporate the Creative Commons Attribution - Non Commercial (unported, v3.0) License.
By accessing the work you hereby accept the Terms. Non-commercial uses of the work are permitted without any further permission from Dove Medical Press Limited, provided the work is properly attributed. For permission for commercial use of this work, please see paragraphs 4.2 and 5 of our Terms.