Back to Journals » Diabetes, Metabolic Syndrome and Obesity » Volume 17
The Relationship Between UA/HDL and Diabetic Peripheral Neuropathy: A Cross-Sectional Analysis
Authors Zhen R ![]() , Wang S, Chen S
, Wang S, Chen S
Received 2 November 2023
Accepted for publication 10 February 2024
Published 27 February 2024 Volume 2024:17 Pages 969—980
DOI https://doi.org/10.2147/DMSO.S447809
Checked for plagiarism Yes
Review by Single anonymous peer review
Peer reviewer comments 2
Editor who approved publication: Dr Konstantinos Tziomalos
Ruoxi Zhen,1,2 Shuqi Wang,1,2 Shuchun Chen1– 3
1Graduate School of Hebei Medical University, Shijiazhuang, Hebei, People’s Republic of China; 2Department of Endocrinology, Hebei General Hospital, Shijiazhuang, Hebei, People’s Republic of China; 3Hebei Key Laboratory of Metabolic Diseases, Shijiazhuang, Hebei, People’s Republic of China
Correspondence: Shuchun Chen, Department of Endocrinology, Hebei General Hospital, 348 Heping West Road, Shijiazhuang, Hebei, 050051, People’s Republic of China, Tel/Fax +86 31185988406, Email [email protected]
Purpose: This study was designed to analyze correlations between the uric acid to high-density lipoprotein cholesterol ratio (UHR) and peripheral nerve conduction velocity (NCV) among type 2 diabetes mellitus (T2DM) patients.
Patients and Methods: This was a single-center cross-sectional analysis of 324 T2DM patients. All patients were separated into a group with normal NCV (NCVN) and a group with abnormal NCV (NCVA). Patients were also classified into groups with low and high UHR values based on the median UHR in this study cohort. Neurophysiological data including motor and sensory conduction velocity (MCV and SCV, respectively) were measured for all patients.
Results: Relative to patients with low UHR values, those in the high UHR group presented with greater NCVA prevalence (P = 0.002). UHR remained negatively correlated with bilateral superficial peroneal nerve SCV, bilateral common peroneal nerve MCV, bilateral ulnar nerve SCV, and bilateral right median nerve MCV even after adjustment for confounding factors. UHR was identified as an NCVA-related risk factor, with a 1.370-fold increase in NCVA prevalence for every unit rise in UHR (P < 0.001).
Conclusion: These results identify UHR as a risk factor associated with NCVA that was independently negatively associated with NCV among T2DM patients.
Keywords: type 2 diabetes mellitus, diabetic peripheral neuropathy, peripheral nerve conduction velocity, uric acid to high-density lipoprotein cholesterol ratio
Introduction
Type 2 diabetes mellitus (T2DM) is an increasingly common metabolic disease such that it represents one of the most important global public health challenges in the 21st century.1 The International Diabetes Federation (IDF) predicts that T2DM prevalence will rise to 10.9% by the year 2045, with the highest number of T2DM patients residing in China with approximately 116.4 affected individuals2–4 Diabetic peripheral neuropathy (DPN) is a complex yet common complication of T2DM that causes chronic issues in affected patients such that it represents a pressing health issue throughout the world. DPN patients can experience pain, numbness, nociceptive hypersensitivity, and other forms of discomfort,5,6 and the late diagnosis of this condition can lead to higher rates of diabetic foot ulcers, gangrene, and amputation procedures that can have serious negative effects on patient quality of life while also imposing a significant economic burden.1 As DPN is generally characterized by a nonspecific insidious onset, diagnosing it at an early stage is challenging such that missed diagnoses can occur.7 Early screening for DPN can entail analyses of nerve conduction velocity (NCV), which primarily reflects myelin sheath function,8 and entails analyses of both motor NCV (MCV) and sensory NCV (SCV).9–11
Serum uric acid (SUA) is the primary end product of the purine metabolism pathway. Elevated levels of SUA are associated with vascular dysfunction and irreversible damage with the potential to result in tissue ischemia and the impairment of peripheral nerve function.12 SUA has been demonstrated to be related to the pathogenesis of DPN in several studies, albeit with some inconsistent findings.13–15 One meta-analysis found that there is a significant association between hyperuricemia and a greater risk of DPN incidence and that DPN patients exhibit significant increases in their SUA concentrations.14 Consistently, Zhang et al16 observed similar results in a Mendelian randomization study. A separate cross-sectional analysis, however, revealed that low SUA levels can also serve as a risk factor for DPN development among T2DM patients, potentially influencing tibial nerve motor fiber function in a manner independent of the effects of HbA1c.15,17 The plasma lipoprotein high-density lipoprotein cholesterol (HDL-C) exhibits beneficial antioxidant and anti-inflammatory activity. The SUA to HDL-C ratio (UHR) has recently been reported to offer utility as a novel metabolic and inflammatory biomarker,18 with several studies documenting an association between this ratio and diabetic nephropathy (DKD), and an increase in diabetic retinopathy (DR) risk,19,20 and diabetic control.18 UHR values can also strongly predict visceral fat area, metabolic syndrome, and the incidence of nonalcoholic fatty liver disease.
To date, there has been little research focused on the relationship between the UHR and DPN, and controversy persists with respect to the association between SUA and DPN in T2DM patients. This study was thus designed to probe the association between UHR and NCV in T2DM patients to better enable the early-stage identification of NCV-associated risk factors in order to facilitate screening for and prevention of NCV abnormalities.
Materials and Methods
Research Subjects
This was a retrospective analysis conducted in the Department of Endocrinology of Hebei Provincial People’s Hospital. Analyzed subjects consisted of 324 T2DM patients who attended this hospital between December 2020 and December 2021. Enrolled patients were those individuals who met the 1999 World Health Organization diagnostic standards for diabetes mellitus and underwent NCV testing. Patients were excluded if they had type 1 diabetes or any other type of diabetes; were pregnant or lactating; had experienced acute diabetic complications; exhibited severe lesions in vital organs including the brain, heart, kidneys, or liver; had any malignant tumors; were experiencing acute flare-ups of gout; had used diuretics, lipid-lowering drugs, or drugs with the potential to affect the absorption or excretion of uric acid within the last 3 months; or were diagnosed with any diseases with the potential to impact nerve conduction speeds, including demyelinating, hereditary, or multifocal neuropathies. This study was approved by the Medical Ethics Committee at Hebei General Hospital (NO.2023110), and all participants completed informed consent forms before recruitment. This study was performed as per the Helsinki Declaration.
Demographic, Clinical, and Biochemical Data
All participants completed questionnaires that provided basic information including age, gender, and duration of disease. A trained professional measured the weight, height, body mass index (BMI), and systolic/diastolic blood pressure (SBP/DBP) of each participant two times, recording the mean values. Samples of blood were collected from subjects after fasting for 8 h and processed with a fully automated biochemical analyzer in the laboratory to analyze parameters including total cholesterol, triglyceride (TG) levels, HDL-C, low-density lipoprotein cholesterol (LDL-C), blood urea nitrogen (BUN), UA levels, fasting blood glucose (FBG), albumin (ALB), alanine aminotransferase (ALT), azelaic aminotransferase (AST), and creatinine (SCr). A nuclear medicine laboratory physician measured patient glycated hemoglobin (HbA1c) and vitamin D levels via an electrochemiluminescence approach. The UHR (%) was calculated as follows: UA (μmol/L)/HDL-C (mmol/L) × 100%.
All neurophysiological analyses were performed by a specialized neurologist who conducted NCV studies that included measurements of MCV for the bilateral median, ulnar, and common peroneal nerves as well as measurements of SCV for the bilateral median, ulnar, and superficial peroneal nerves.
Patient Grouping
All participants in this study were classified into two groups based on whether or not they exhibited normal NCV values (See Table 1), including a normal peripheral nerve conduction (NCVN) group and an abnormal peripheral nerve conduction (NCVA) group.7 Participants were additionally classified into two groups based on the median UHR into those with a high UHR (UHR ≥ 0.22) and those with a low UHR (UHR < 0.22).
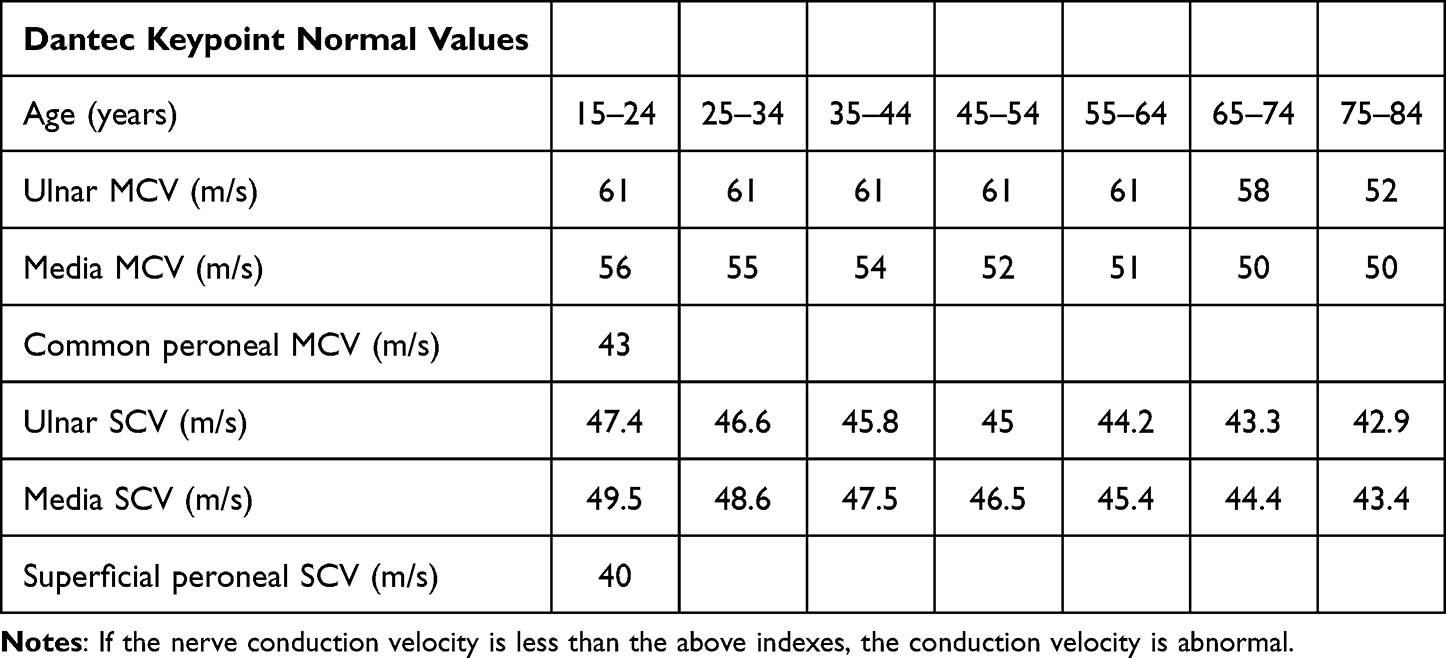 |
Table 1 The Specific Normal Value of the Nerve Conduction Velocity |
Statistical Analysis
Data were analyzed using SPSS 26.0. Distribution normality testing was performed with the Kolmogorov–Smirnov test, and continuous variables were presented as means ± SD or medians (interquartile range). Categorical variables were instead presented as numbers (%). Biochemical parameters were compared using Student’s t-tests or Mann–Whitney U-tests, whereas chi-square tests were used when comparing categorical variables. Spearman or Pearson correlation analyses were used to probe the relationship between UHR and NCV, while the status of UHR as a risk factor for abnormal peripheral nerve conduction was assessed through logistic regression analyses. Independent correlations between UHR and NCV measures were also assessed through multiple linear regression analyses. P < 0.05 was regarded as being statistically significant.
Results
Participant Characteristics
This study enrolled 324 T2DM participants (215 male, 109 female), with a mean age of 56.00 years, a mean T2DM duration of 7 years, and a mean BMI of 26.19 kg/m2. These participants also exhibited a mean UA of 307.50 µmol/L, a mean HDL-C of 1.13 mmol/L, a mean FBG of 8.00 mmol/L, a mean HbA1c of 8.50%, and a mean vitamin D level of 16.16 ng/mL. Of these patients, 146 (45.06%) were classified into the NCVA group whereas 178 (54.94%) were in the NCVN group. In addition, 162 patients (50.00%) exhibited high UHR values, and the overall mean UHR was 0.22 (Table 2).
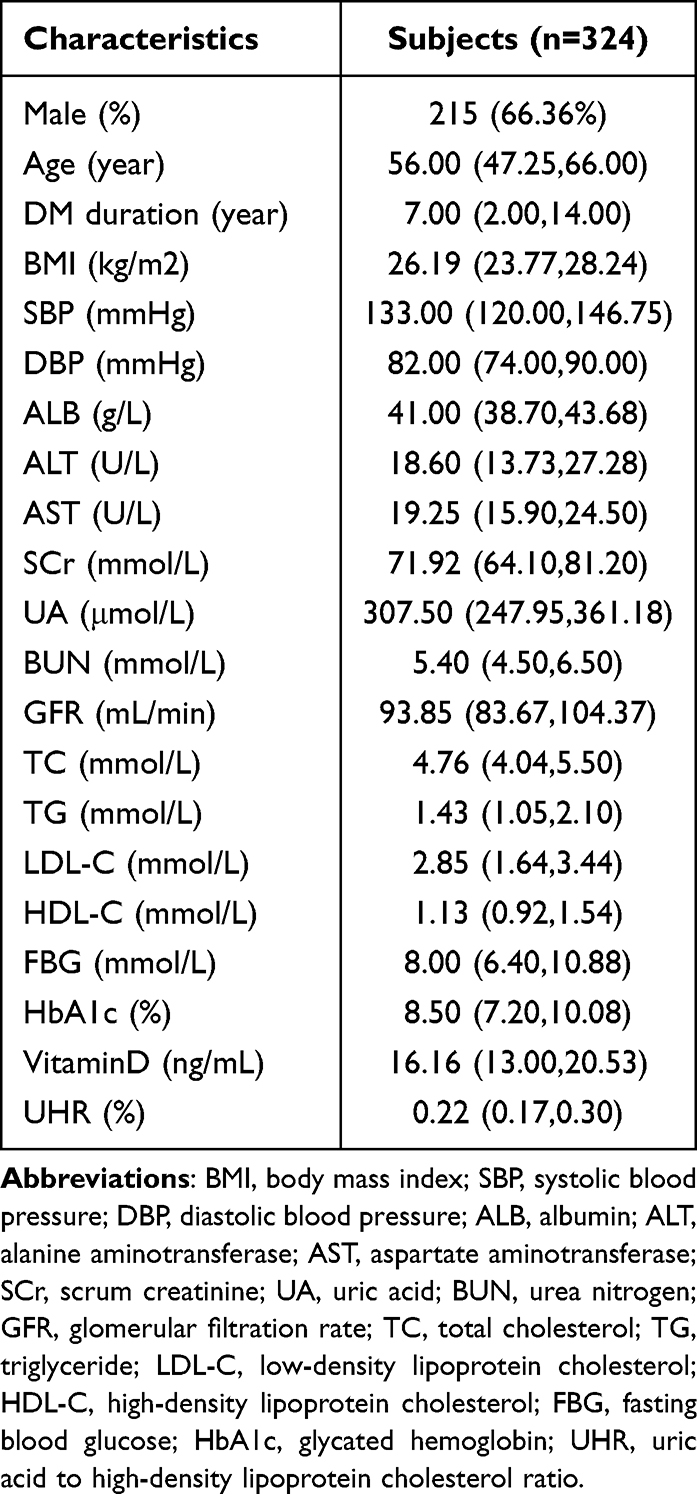 |
Table 2 Comparison of General Information and Clinical Indicators of All Participants |
Comparisons of NCVN and NCVA Patient Characteristics
A higher proportion of males was evident in the NCVA group relative to the NCVN group (P=0.002). Patients exhibited significantly higher mean age, DM duration, UA, and HbA1c levels in the NCVA group relative to the NCVN group (P<0.05), whereas the opposite was true for ALB, ALT, AST, and HDL-C levels (P < 0.05). The UHR levels of NCVA group patients were significantly higher than those of NCVN group patients (P<0.001) (Table 3). Variations in UHR levels between these two groups of patients are presented in Figure 1.
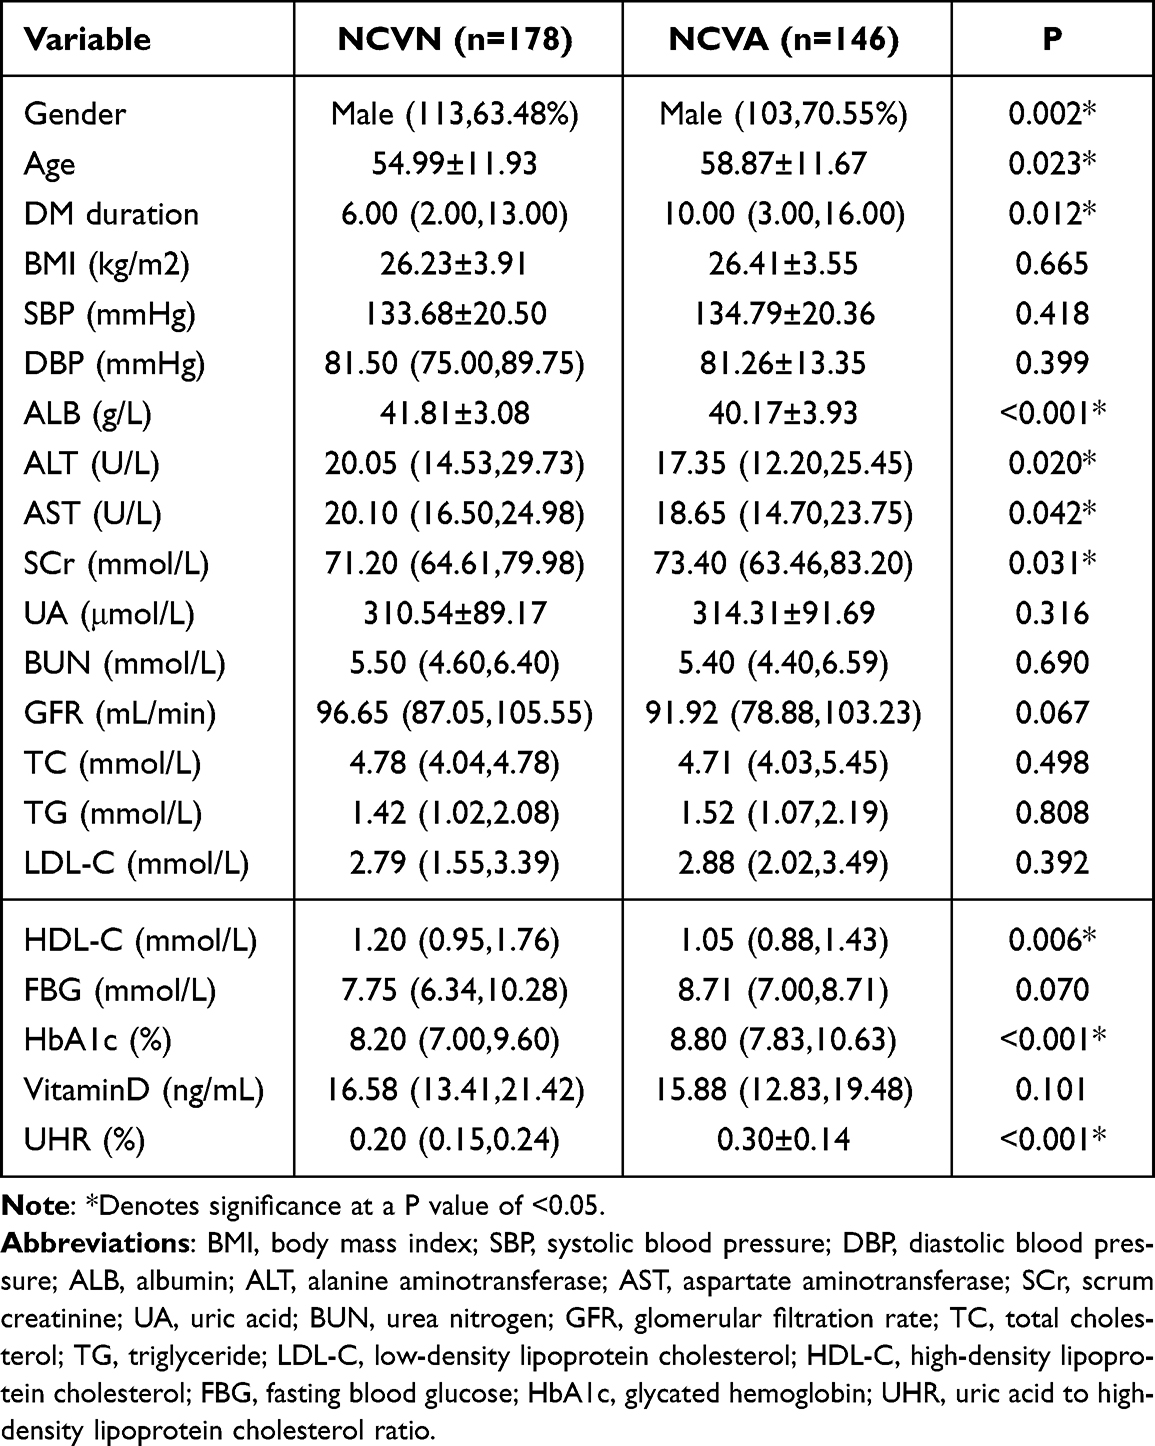 |
Table 3 Comparison of Indicators Between the NCVN and NCVA Groups |
 |
Figure 1 Comparisons of UHR levels in normal peripheral nerve conduction group and abnormal peripheral nerve conduction group in patients with T2DM.*Denotes significance at a P value of <0.05. |
Comparisons of the Characteristics of Patients with High and Low UHR Values
There were significantly more males in the high UHR patient group compared to the low UHR group (P<0.001). High UHR patients also presented with significantly lower age, TC, and HbA1c levels relative to the low UHR group, whereas the opposite was true for BMI, ALB, ALT, SCr, UA, BUN, TG, LDL-C, and HDL-C levels (P<0.05). As expected, significantly higher UHR values were evident in the high UHR group (P<0.001). NCVA prevalence was also significantly greater in the high UHR group (P=0.002) (Table 4). Differences in the prevalence of NCVA between the high and low UHR groups are presented in Figure 2.
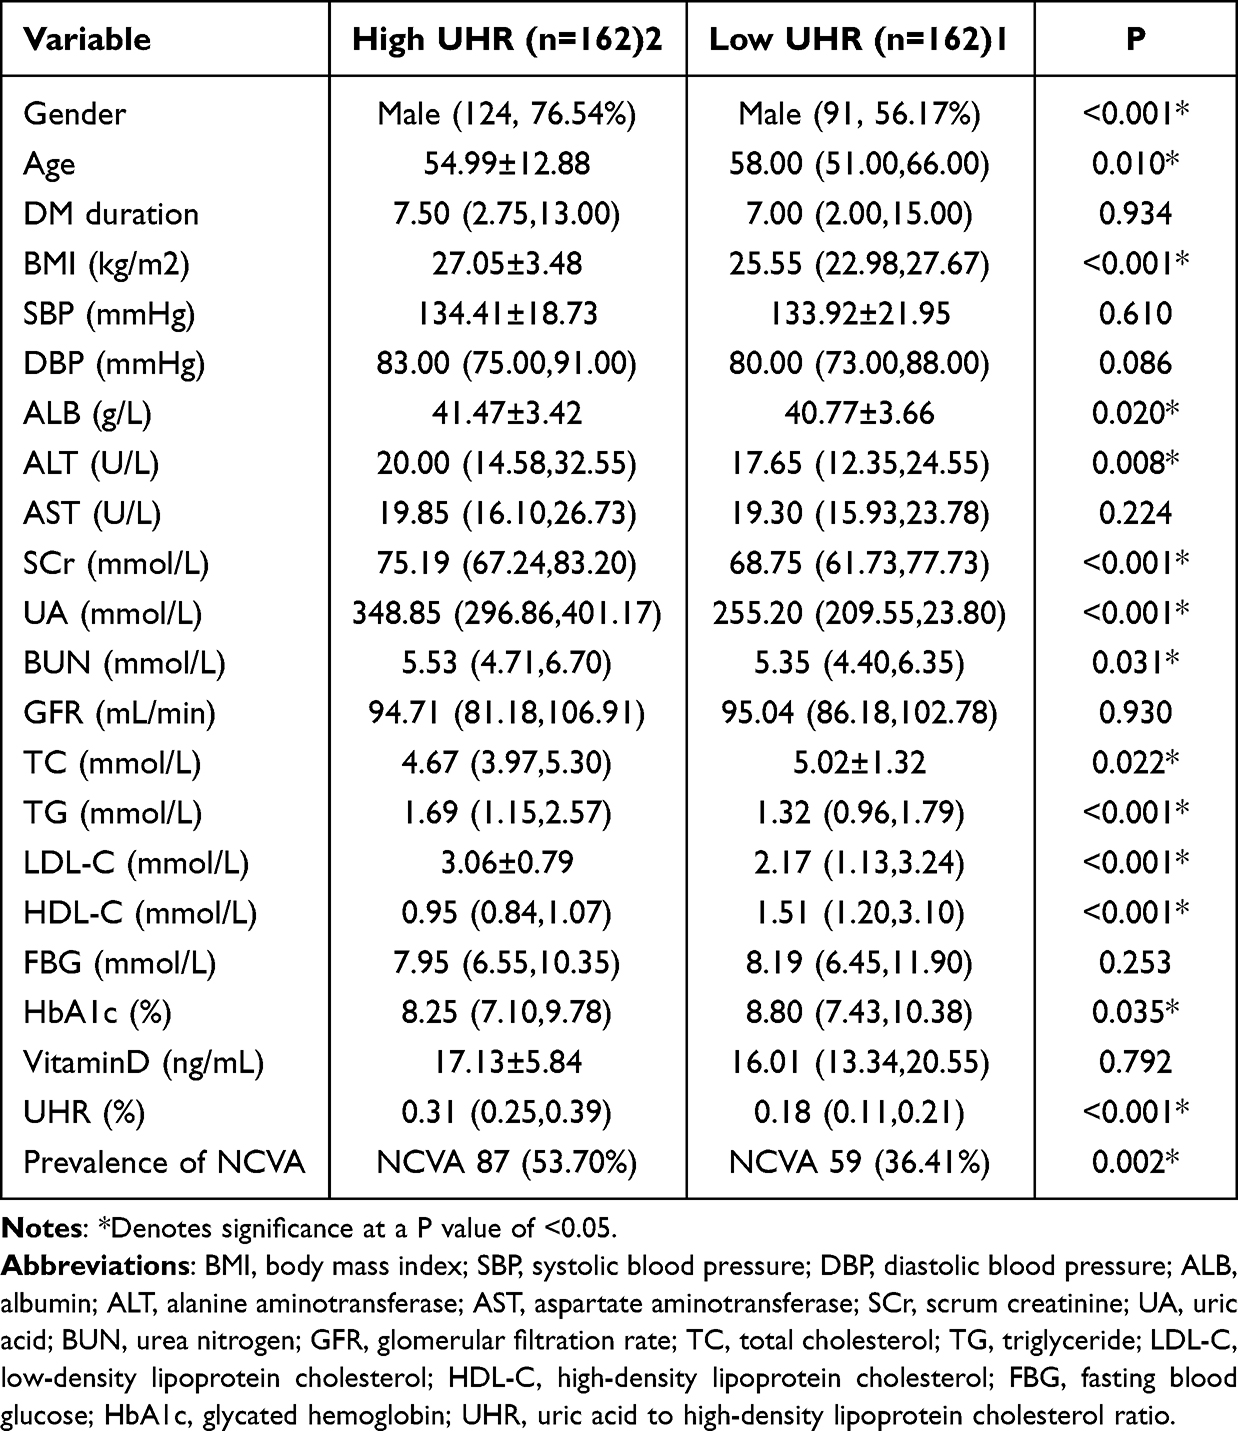 |
Table 4 Comparison of Indicators Between the Low UHR and High UHR Groups |
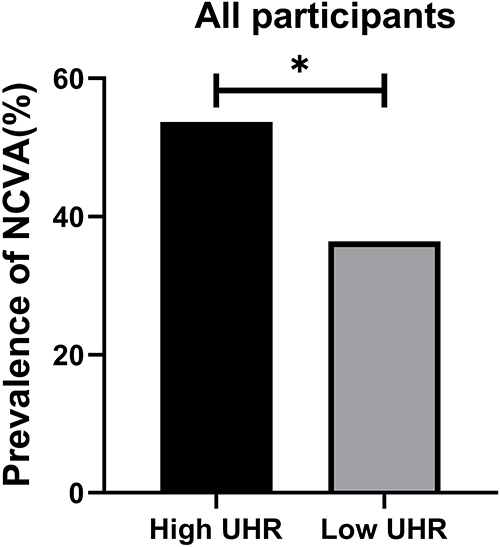 |
Figure 2 Comparisons of prevalence of abnormal peripheral nerve conduction in the High UHR group and Low UHR group for all participants. *Denotes significance at a P value of <0.05. |
Correlations Between UHR and NCV in T2DM Patients
A negative correlation between UHR and bilateral ulnar nerve MCV, right median nerve MCV, bilateral common peroneal nerve MCV, right ulnar nerve SCV, and bilateral superficial peroneal nerve SCV was detected in all participants (P < 0.05). In contrast, UHR values were not correlated with left median nerve MCV, left ulnar nerve SCV, or bilateral median nerve SCV (Table 5).
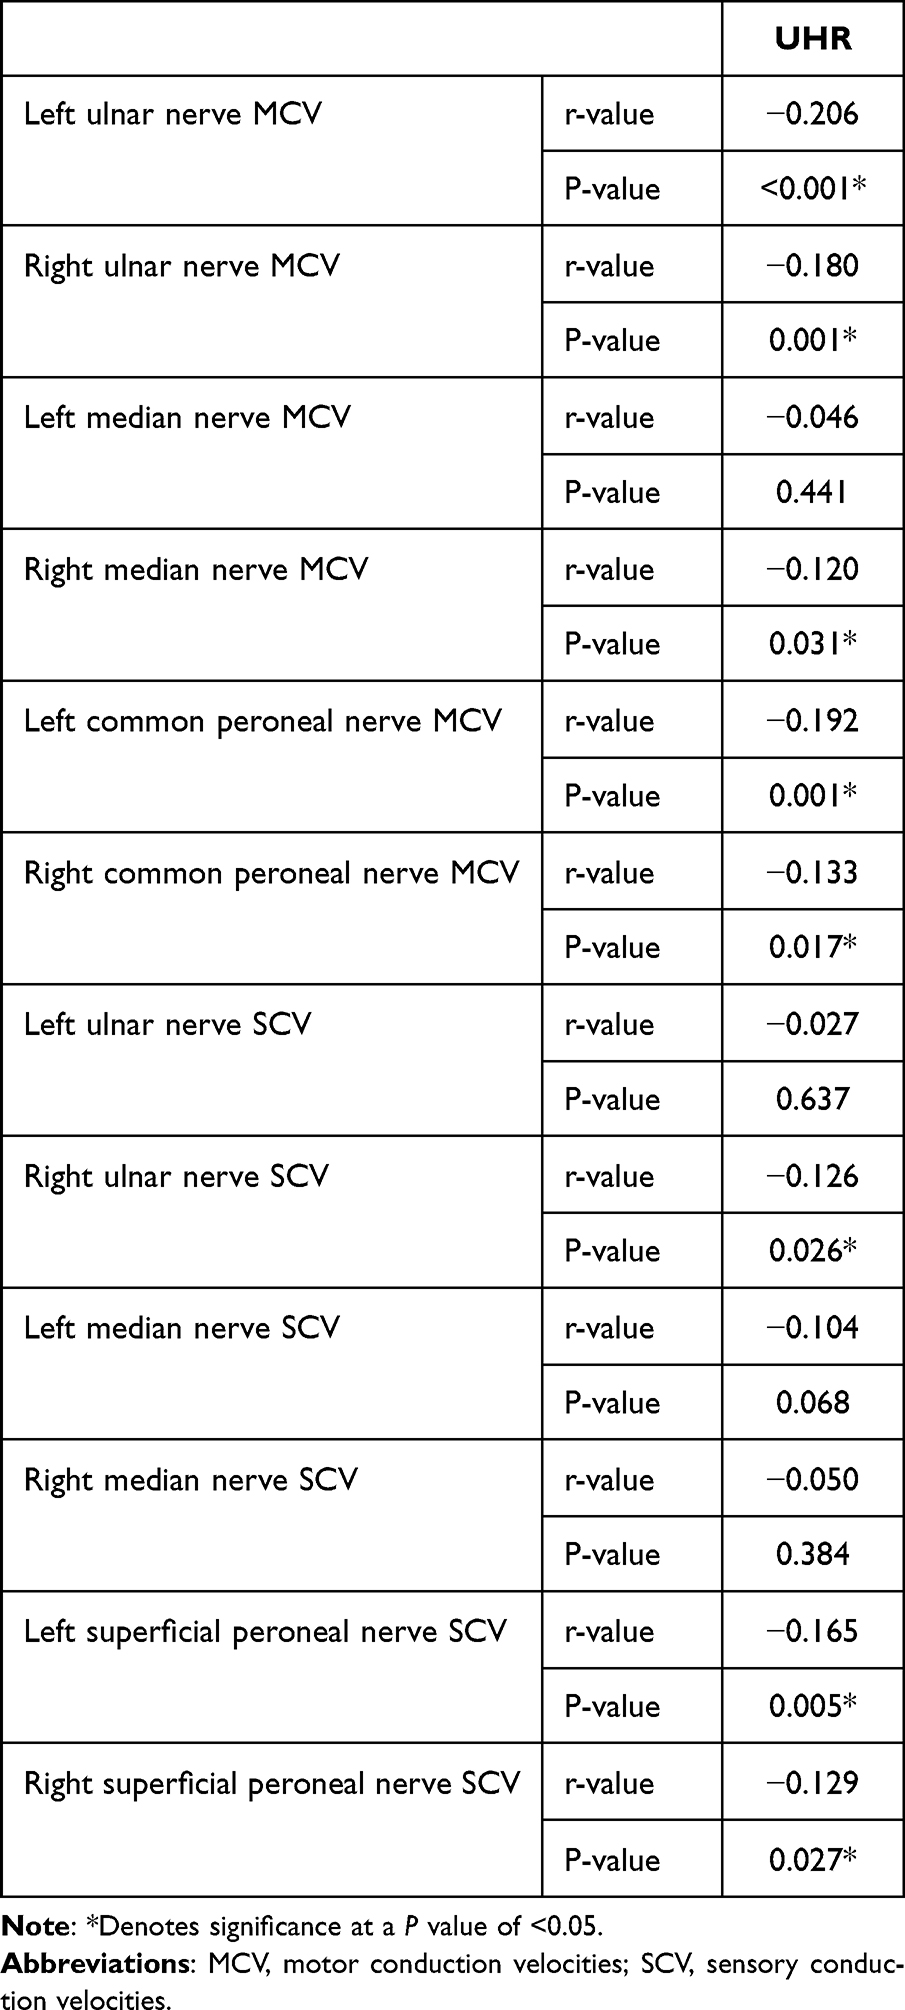 |
Table 5 The Correlation of UHR and NCV in Patients with T2DM |
Multiple Linear Correlation Analyses of the Relationship Between NCV and UHR
In the overall patient population included in this study, when using the unadjusted model 1 (Table 6), model 2 (adjusted for age, BMI, DM duration, SBP, Alb) (Table 7), and model 3 (additionally adjusted for SCr, BUN, TG, TC, LDL-C, HbA1c) (Table 8), UHR values were negatively correlated with bilateral ulnar nerve MCV, right median nerve MCV, bilateral common peroneal nerve MCV, right ulnar nerve SCV, and bilateral superficial peroneal nerve SCV. UHR remained unrelated to left median nerve MCV, left ulnar nerve SCV, or bilateral median nerve SCV under any of these models.
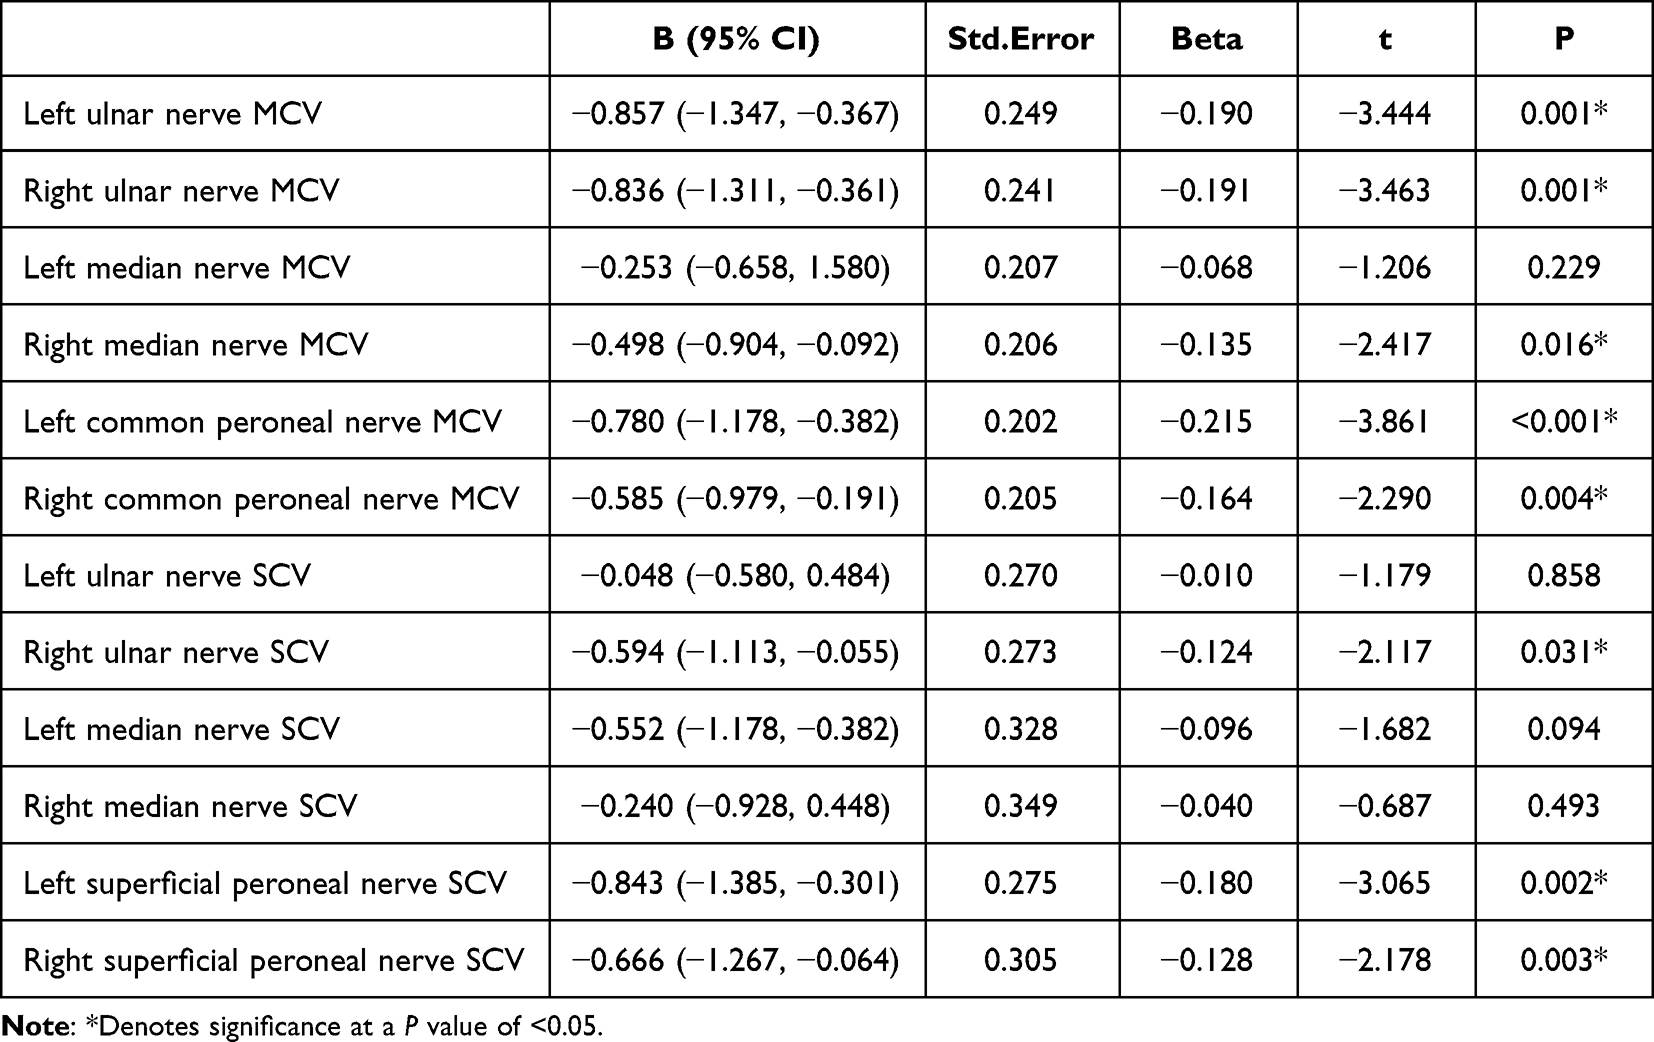 |
Table 6 Correlation of UHR with Different Nerve Conduction Velocities in Patients with T2DM in Model 1 |
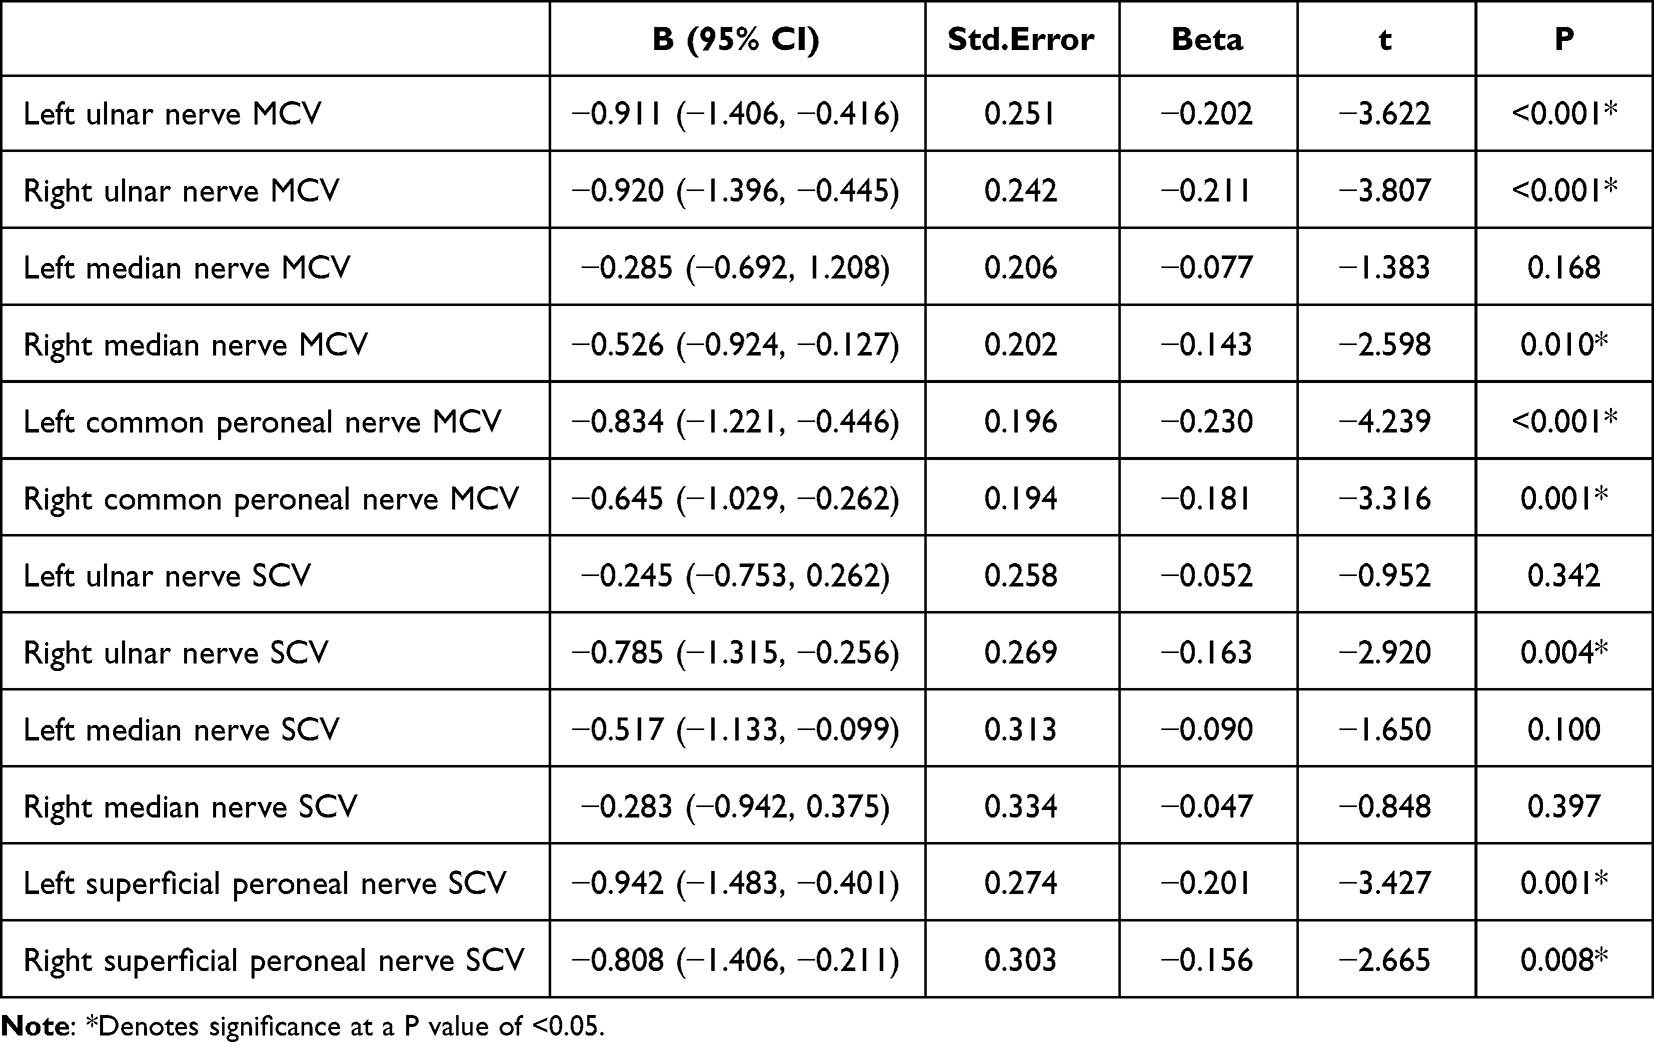 |
Table 7 Correlation of UHR with Different Nerve Conduction Velocities in Patients with T2DM in Model 2 |
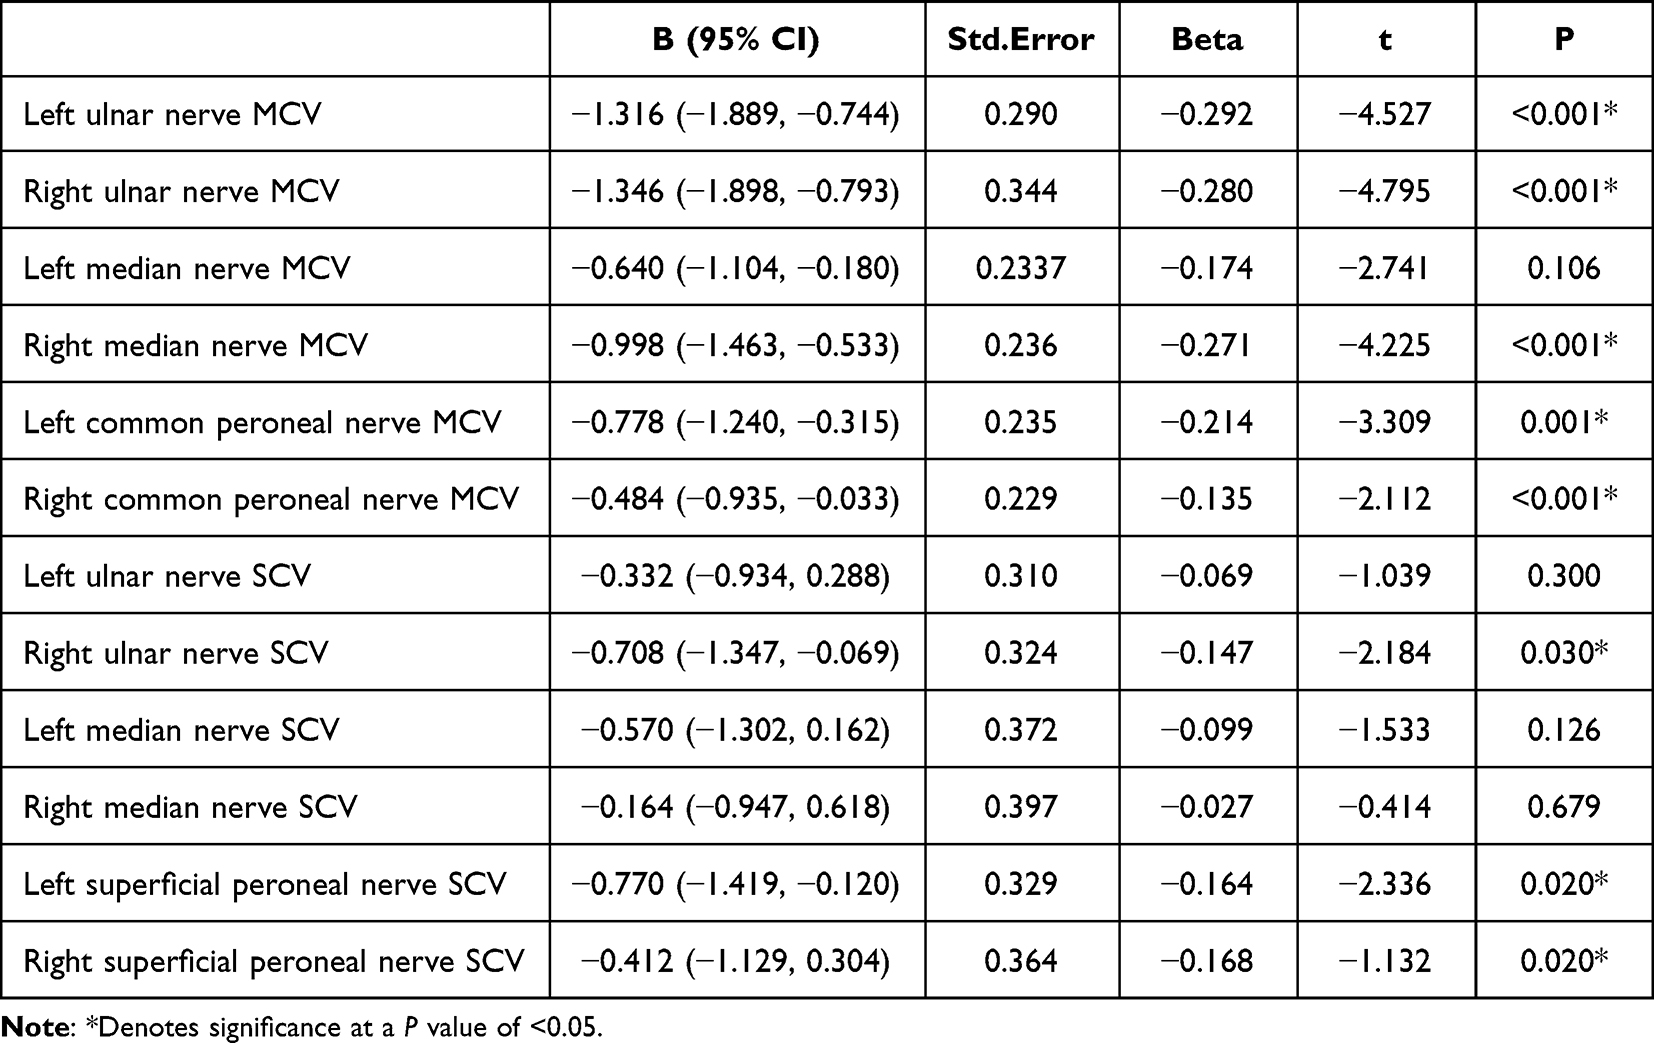 |
Table 8 Correlation of UHR with Different Nerve Conduction Velocities in Patients with T2DM in Model 3 |
Binary Logistic Regression Analyses of the Association Between NCV and UHR
Here, binary logistic regression analyses were used to probe the associations between UHR and NCV. This model incorporated age, T2DM duration, Alb, HbA1c, and UHR, and it revealed that UHR was a risk factor for NCVA, with a 1.370-fold rise in NCVA risk for each unit increase in UHR (P < 0.001) (Table 9).
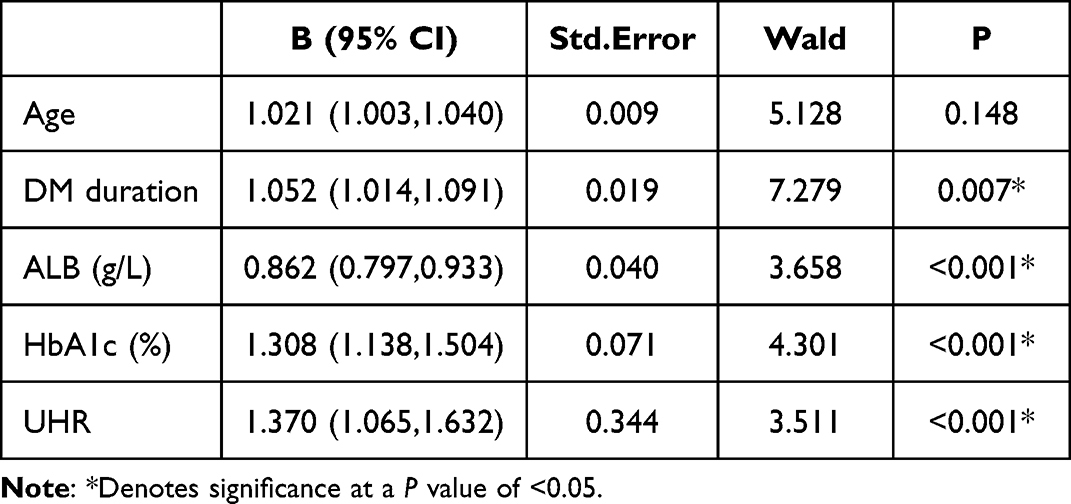 |
Table 9 Dichotomous Logistic Regression of Risk Factors for Abnormal Peripheral Nerve Conduction Velocity in T2DM Patients |
Discussion
T2DM is emerging as an increasingly serious threat to global health, and DPN is among the most common, difficult-to-manage, and serious complications affecting T2DM patients.21 DPN is associated with a greater risk of ulcer formation, food infections, and noninvasive amputations resulting in long term disability, greater treatment costs, and a loss of normal function that impose a large societal burden.22 The pathogenesis entails chronic neurological damage as a result of a range of injuries to endothelial cells, glia, and axons.3 While further work is necessary to fully clarify the mechanisms underlying DPN development and progression, prior reports have demonstrated that a range of inflammatory and metabolic insults stemming from dysregulated polyol and inositol metabolism, abnormal glucolipid metabolism, insulin resistance, oxidative stress, and inflammatory factor activation contribute to neurological dysfunction in affected patients.5
The UHR has previously been validated as a stable inflammation-related biomarker that is closely associated with the control of DR,18 in addition to predicting MS onset.23 Here, T2DM patients exhibiting high UHR values were found to be at a greater risk of NCVA development, with UHR levels being independently and negatively associated with NCV. In line with results reported previously by Lin et al24 the present study confirmed the utility of high UHR values as an independent risk factor for NCVA incidence. There are several potential mechanisms underlying this relationship that are discussed below.
High UA levels may increase the production of reactive oxygen species (ROS),25 with ROS-mediated oxidative stress potentially resulting in DNA damage and membrane lipid peroxidation in neuronal cells, in line with evidence that Schwann cells can undergo apoptotic death when exposed to oxidative stress.26 This mechanism may culminate in the death of neurons and the consequent incidence of neurological dysfunction. In one report, SUA levels were shown to promote inflammatory pathway activation, with elevated levels of SUA being positively correlated with the levels of inflammatory mediators including interleukin-1β (IL-1β), IL-6, and C-responsive protein.27,28 SUA is also capable of crossing the blood-brain barrier and triggering NFκB pathway-mediated inflammation,29 leading to inflammatory neuronal injury that may underlie the incidence of DPN. Khosla et al found that neuroendothelial cell nitric oxide (NO) production was influenced by levels of UA in the blood,30 resulting in the dilation of blood vessels and the enhancement of local tissue perfusion, with insufficient NO potentially resulting in nerve ischemia and hypoxia, thereby contributing to the dysfunction of endothelial cells and the incidence or progression of DPN.31
HDL-C is generally regarded as a protective factor associated with a reduction in the risk of cardiovascular disease, exhibiting anti-thrombotic, anti-inflammatory, anti-atherosclerotic, antioxidant, and cholesterol transport reversing activities.32,33 Several recent reports have noted that lower HDL-C levels are related to greater T2DM prevalence such that they can be used to predict T2DM risk. Smith et al also noted that neuropathy occurrence was correlated to the levels of both LDL-C and HDL-C.34 Higher cholesterol levels may offer particular value for the stimulation of injuries to the peripheral nervous system, particularly for myelinated large fibers. HDL-C, as a cholesterol carrier, can protect against neuroglial apoptosis as a result of cholesterol accumulation through its ability to transport cholesterol within these cells.24 One experiment demonstrated that impaired lipid metabolism can drive localized mitochondrial dysfunction together with the induction of local and systemic oxidative stress responses, contributing to neurological damage and DPN.35
Aktas et al additionally noted a strong positive relationship between UHR values and HbA1c levels, concluding that HR can be used to predict glycemic control in male T2DM patients. Effective glycemic control can lead to improvements in NCV and vibrational sensitivity, whereas individuals with levels of blood glucose that are poorly controlled may exhibit advanced glycation end product (AGE) formation and receptor activity, in turn driving the production of high nicotinamide adenine dinucleotide (NAD) levels.36 This can subsequently activate the poly(ADP ribose) polymerase, hexosamine, and protein kinase C(PKC) pathways,37 worsening oxidative stress and associated inflammation and neuronal dysregulation, thus impacting endothelial cell function and contributing to NCV deterioration.18,38
This study is also subject to multiple limitations. For one, as a single-center retrospective cross-sectional analysis, these results were subject to hospitalization bias and do not offer insight into the causal link between UHR and NCV. Second, this study did not take the glucose-lowering regimens of individual patients into account despite the possible effects of these regimens on SUA levels, despite the potential impact of metformin on these levels and neuropathy risk. Similarly, other T2DM complications were not evaluated. Moreover, the treatment regimens for hyperuricemia and DPN were insufficiently evaluated, potentially confounding the results of these analyses as one prior study of T2DM patients that did not receive UA-lowering treatment found that lower SUA levels were associated with greater DPN risk, with reduced SUA concentrations potentially impacting tibial neuromotor fiber function. This latter point contradicts the findings of the present study. Additional large-scale multicenter prospective cohort studies will thus be essential to gather detailed information regarding T2DM patient treatment regimens so that the potential mechanistic link between UHR values and NCV can be probed with greater detail, thereby aiding diagnostic and treatment efforts.
Conclusion
In summary, the present results revealed that the UHR levels of T2DM patients with DPN were significantly increased as compared to patients without this diabetic complication. UHR values and NCV remained negatively correlated even with adjustment for relevant confounding factors, with greater NCVA prevalence among individuals with a high UHR. NCVA incidence rose by 1.370-fold for each unit increase in UHR, emphasizing the status of this ratio as a risk factor for abnormal nerve conduction. Additional prospective research, however, will be vital to validate and characterize the relationship linking UHR and DPN.
Disclosure
The authors report no conflicts of interest in this work.
References
1. Li Y, Teng D, Shi X, et al. Prevalence of diabetes recorded in mainland China using 2018 diagnostic criteria from the American Diabetes Association: national cross sectional study. BMJ. 2020;369:m997. doi:10.1136/bmj.m997
2. Reed J, Bain S, Kanamarlapudi V. A review of current trends with type 2 diabetes epidemiology, aetiology, pathogenesis, treatments and future perspectives. Diabetes Metab Syndr Obes. 2021;14:3567–3602. doi:10.2147/DMSO.S319895
3. Sher EK, Prnjavorac B, Farhat EK, Palić B, Ansar S, Sher F. Effect of diabetic neuropathy on reparative ability and immune response system. Mol Biotechnol. 2023. doi:10.1007/s12033-023-00813-z
4. Li C, Wang W, Ji Q, et al. Prevalence of painful diabetic peripheral neuropathy in type 2 diabetes mellitus and diabetic peripheral neuropathy: a nationwide cross-sectional study in mainland China. Diabet Res Clin Pract. 2023;198:110602. doi:10.1016/j.diabres.2023.110602
5. Sloan G, Selvarajah D, Tesfaye S. Pathogenesis, diagnosis and clinical management of diabetic sensorimotor peripheral neuropathy. Nat Rev Endocrinol. 2021;17(7):400–420. doi:10.1038/s41574-021-00496-z
6. Zilliox LA. Diabetes and peripheral nerve disease. Clin Geriatr Med. 2021;37(2):253–267. doi:10.1016/j.cger.2020.12.001
7. Li Z, Gao Y, Jia Y, Chen S. Correlation between hemoglobin glycosylation index and nerve conduction velocity in patients with type 2 diabetes mellitus. Diabetes Metab Syndr Obes. 2021;14:4757–4765. doi:10.2147/DMSO.S334767
8. Chen X-J, Wang X-F, Pan Z-C. Nerve conduction velocity is independently associated with bone mineral density in type 2 diabetes mellitus. Front Endocrinol. 2023;14:1109322. doi:10.3389/fendo.2023.1109322
9. Castelli G, Desai KM, Cantone RE. Peripheral neuropathy: evaluation and differential diagnosis. Am Fam Physician. 2020;102(12):732–739.
10. Won JC, Park TS. Recent advances in diagnostic strategies for diabetic peripheral neuropathy. Endocrinol Metab. 2016;31(2):230. doi:10.3803/EnM.2016.31.2.230
11. Sharma S, Rayman G. Frontiers in diagnostic and therapeutic approaches in diabetic sensorimotor neuropathy (DSPN). Front Endocrinol. 2023;14:1165505. doi:10.3389/fendo.2023.1165505
12. Kırça M, Oğuz N, Çetin A, Uzuner F, Yeşilkaya A. Uric acid stimulates proliferative pathways in vascular smooth muscle cells through the activation of p38 MAPK, p44/42 MAPK and PDGFRβ. J Recept Signal Transduction Res. 2017;37(2):167–173. doi:10.1080/10799893.2016.1203941
13. Zhuang Y, Huang H, Hu X, Zhang J, Cai Q. Serum uric acid and diabetic peripheral neuropathy: a double-edged sword. Acta Neurol Belg. 2023;123(3):857–863. doi:10.1007/s13760-022-01978-1
14. Yu S, Chen Y, Hou X, et al. Serum uric acid levels and diabetic peripheral neuropathy in type 2 diabetes: a systematic review and meta-analysis. Mol Neurobiol. 2016;53(2):1045–1051. doi:10.1007/s12035-014-9075-0
15. Zhang H, Vladmir C, Zhang Z, et al. Serum uric acid levels are related to diabetic peripheral neuropathy, especially for motor conduction velocity of tibial nerve in type 2 diabetes mellitus patients. J Diabetes Res. 2023;2023:3060013. doi:10.1155/2023/3060013
16. Zhang Y, Tang Z, Tong L, Wang Y, Li L. Serum uric acid and risk of diabetic neuropathy: a genetic correlation and Mendelian randomization study. Front Endocrinol. 2023;14:1277984. doi:10.3389/fendo.2023.1277984
17. Piko P, Jenei T, Kosa Z, et al. Association of HDL subfraction profile with the progression of insulin resistance. Int J Mol Sci. 2023;24(17):13563. doi:10.3390/ijms241713563
18. Aktas G, Kocak MZ, Bilgin S, Atak BM, Duman TT, Kurtkulagi O. Uric acid to HDL cholesterol ratio is a strong predictor of diabetic control in men with type 2 diabetes mellitus. Aging Male. 2020;23(5):1098–1102. doi:10.1080/13685538.2019.1678126
19. Cheng Y, Zhang H, Zheng H, et al. Association between serum uric acid/HDL-cholesterol ratio and chronic kidney disease: a cross-sectional study based on a health check-up population. BMJ Open. 2022;12(12):e066243. doi:10.1136/bmjopen-2022-066243
20. Xuan Y, Zhang W, Wang Y, et al. Association between uric acid to HDL cholesterol ratio and diabetic complications in men and postmenopausal women. DMSO. 2023;16:167–177. doi:10.2147/DMSO.S387726
21. Ban J, Pan X, Yang L, et al. Correlation between fibrinogen/albumin and diabetic peripheral neuropathy. Diabetes Metab Syndr Obes. 2023;16:2991–3005. doi:10.2147/DMSO.S427510
22. Javed S, Hayat T, Menon L, Alam U, Malik RA. Diabetic peripheral neuropathy in people with type 2 diabetes: too little too late. Diabet Med. 2020;37(4):573–579. doi:10.1111/dme.14194
23. Kocak MZ, Aktas G, Erkus E, Sincer I, Atak B, Duman T. Serum uric acid to HDL-cholesterol ratio is a strong predictor of metabolic syndrome in type 2 diabetes mellitus. Rev Assoc Med Bras. 2019;65(1):9–15. doi:10.1590/1806-9282.65.1.9
24. Lin X, Xu L, Zhao D, Luo Z, Pan S. Correlation between serum uric acid and diabetic peripheral neuropathy in T2DM patients. J Neurol Sci. 2018;385:78–82. doi:10.1016/j.jns.2017.11.034
25. Gherghina ME, Peride I, Tiglis M, Neagu TP, Niculae A, Checherita IA. Uric acid and oxidative stress—relationship with cardiovascular, metabolic, and renal impairment. Int J Mol Sci. 2022;23(6):3188. doi:10.3390/ijms23063188
26. Liu Y-P, Shao S-J, Guo H-D. Schwann cells apoptosis is induced by high glucose in diabetic peripheral neuropathy. Life Sci. 2020;248:117459. doi:10.1016/j.lfs.2020.117459
27. Xiong Q, Liu J, Xu Y. Effects of uric acid on diabetes mellitus and its chronic complications. Int J Endocrinol. 2019;2019:1–8. doi:10.1155/2019/9691345
28. Chen L, Li B, Chen B, et al. Thymoquinone alleviates the experimental diabetic peripheral neuropathy by modulation of inflammation. Sci Rep. 2016;6(1):31656. doi:10.1038/srep31656
29. Lu W, Xu Y, Shao X, et al. Uric acid produces an inflammatory response through activation of NF-κB in the hypothalamus: implications for the pathogenesis of metabolic disorders. Sci Rep. 2015;5(1):12144. doi:10.1038/srep12144
30. Khosla U M, Zharikov S, Finch J L, Nakagawa T, Roncal C, Mu W, Krotova K, Block E R, Prabhakar S and Johnson R J. (2005). Hyperuricemia induces endothelial dysfunction. Kidney International, 67(5), 1739–1742. 10.1111/j.1523-1755.2005.00273.x
31. Choi Y, Yoon Y, Lee K, et al. Uric acid induces endothelial dysfunction by vascular insulin resistance associated with the impairment of nitric oxide synthesis. FASEB j. 2014;28(7):3197–3204. doi:10.1096/fj.13-247148
32. Kjeldsen EW, Nordestgaard LT, Frikke-Schmidt R. HDL cholesterol and non-cardiovascular disease: a narrative review. Int J Mol Sci. 2021;22(9):4547. doi:10.3390/ijms22094547
33. Endo Y, Fujita M, Ikewaki K. HDL functions-current status and future perspectives. Biomolecules. 2023;13(1):105. doi:10.3390/biom13010105
34. Smith AG, Singleton JR. Obesity and hyperlipidemia are risk factors for early diabetic neuropathy. J diabet complicat. 2013;27(5):436–442. doi:10.1016/j.jdiacomp.2013.04.003
35. Hur J, Dauch JR, Hinder LM, et al. The metabolic syndrome and microvascular complications in a murine model of type 2 diabetes. Diabetes. 2015;64(9):3294–3304. doi:10.2337/db15-0133
36. Luo L, Zhou WH, Cai JJ, et al. Gene expression profiling identifies downregulation of the neurotrophin-MAPK signaling pathway in female diabetic peripheral neuropathy patients. J Diabetes Res. 2017;2017:1–11. doi:10.1155/2017/8103904
37. Kandimalla R, Dash S, Kalita S, et al. Bioactive Fraction Of Annona Reticulata Bark (or) Ziziphus jujuba Root Bark along with insulin attenuates painful diabetic neuropathy through inhibiting NF-κB inflammatory cascade. Front Cell Neurosci. 2017;11. doi:10.3389/fncel.2017.00073
38. Pai YW, Lin CH, Lee IT, Chang MH. Variability of fasting plasma glucose and the risk of painful diabetic peripheral neuropathy in patients with type 2 diabetes. Diabetes Metabolism. 2018;44(2):129–134. doi:10.1016/j.diabet.2018.01.015
 © 2024 The Author(s). This work is published and licensed by Dove Medical Press Limited. The
full terms of this license are available at https://www.dovepress.com/terms
and incorporate the Creative Commons Attribution
- Non Commercial (unported, 3.0) License.
By accessing the work you hereby accept the Terms. Non-commercial uses of the work are permitted
without any further permission from Dove Medical Press Limited, provided the work is properly
attributed. For permission for commercial use of this work, please see paragraphs 4.2 and 5 of our Terms.
© 2024 The Author(s). This work is published and licensed by Dove Medical Press Limited. The
full terms of this license are available at https://www.dovepress.com/terms
and incorporate the Creative Commons Attribution
- Non Commercial (unported, 3.0) License.
By accessing the work you hereby accept the Terms. Non-commercial uses of the work are permitted
without any further permission from Dove Medical Press Limited, provided the work is properly
attributed. For permission for commercial use of this work, please see paragraphs 4.2 and 5 of our Terms.
Recommended articles
Association of Cumulative Average Uric Acid to HDL Cholesterol Ratio with the Risk of Rapidly Declining Renal Function: A Retrospective Community-Based Cohort Study in Shanghai Undertaken on Elderly Subjects with Hypertension and Type 2 Diabetes Mellitus Patients
Wang SF, Wang F, Wang Y, Zhang HY, Ling JW, Shi JJ, Qiao SY, Liu Y, Wei YH
Risk Management and Healthcare Policy 2026, 19:580807
Published Date: 12 March 2026