Back to Journals » Nature and Science of Sleep » Volume 12
The Psychomotor Vigilance Test Compared to a Divided Attention Steering Simulation in Patients with Moderate or Severe Obstructive Sleep Apnea
Authors Huang Y, Hennig S, Fietze I, Penzel T ![]() , Veauthier C
, Veauthier C ![]()
Received 8 April 2020
Accepted for publication 27 May 2020
Published 23 July 2020 Volume 2020:12 Pages 509—524
DOI https://doi.org/10.2147/NSS.S256987
Checked for plagiarism Yes
Review by Single anonymous peer review
Peer reviewer comments 2
Editor who approved publication: Dr Steven Shea
Ying Huang,1 Steve Hennig,1 Ingo Fietze,1 Thomas Penzel,1,2 Christian Veauthier1
1Interdisciplinary Center of Sleep Medicine, Charité University Medicine Berlin, Berlin 10117, Germany; 2Department of Biology, Saratov State University, Saratow, Russia
Correspondence: Christian Veauthier
Interdisziplinäres Schlafmedizinisches Zentrum, Charité Universitätsmedizin Berlin, Luisenstraße 13, Berlin 10117 Tel +49 30 513 232
Fax +49 30 513 959
Email [email protected]
Background: Sleepiness at the wheel affects 10% to 15% of drivers and is one major cause of death on highways with one-third of fatal accidents. Obstructive sleep apnea (OSA) is one of the most common sleep disorders leading to sleepiness at the wheel. The aim of this study was to compare the psychomotor vigilance test reaction time (PVT RT) in OSA patients and controls (morning and afternoon) with the results of a divided attention steering simulator (DASS). A second purpose was to compare these results with the mean sleep latencies in the multiple sleep latency test (MSLT), the Epworth Sleepiness Scale (ESS) values and a neurocognitive test (test of attentional performance, TAP).
Patients and Methods: Thirty eight OSA patients and 16 age and sex matched healthy controls were investigated by ESS, PVT, TAP, MSLT, and DASS (response time, failed responses, lane deviation, and off-road-events).
Results: With increasing age, the performance in the DASS decreased. There was no correlation between the DASS and the results of the MSLT and ESS. The controls showed a significantly faster DASS response time in the morning compared to OSA patients (median 2.1 versus 3.0; p=0.044) and fewer off-road events (9 versus 37; p=0.042). We found a moderate correlation between the PVT RT and all parameters of the DASS, as well as the TAP “alertness” subtest.
Conclusion: The increase of PVT RT as well as the decreased tonic alertness in the TAP in untreated OSA patients correlated with an impairment of simulated driving performance. The PVT and the TAP are both suitable diagnostic tools for measuring impaired driving ability in OSA patients. The MSLT did not correlate with the simulated driving performance. We recommend investigation of a longer version of the PVT in order to increase its sensitivity.
Keywords: polysomnography, sustained attention, tonic alertness, vigilance, MSLT, simulated driving performance
Introduction
According to the International Classification of Sleep Disorders, third edition (ICSD-3) sleepiness is
the inability to stay awake and alert during the major waking episodes of the day, resulting in periods of irrepressible need for sleep or unintended lapses into drowsiness or sleep.1
Moreover, the ICSD-3 notes that sleepiness is more likely to occur in monotonous situations.
Sleepiness at the wheel affects 10% to 15% of drivers and is one major cause of death on highways with one-third of fatal accidents.2,3 The World Health Organization (WHO) global status report on road safety (2018) states that 1.35 million persons die each year worldwide due to road accidents and road accidents are the first cause of death among children and young adults aged 5–29 years.4 The WHO has set the target of halving the number of injuries and deaths from road accidents by 2030. Professional driving and driving for more than four hours without rest are risk factors for extremely serious road accidents with more than 50 serious injuries or more than 10 deaths per accident.5
Sleepiness is most frequently caused by either a sleep deficit, irregular work schedules, sleep disorders, or side effects of various drugs.2,6 Obstructive sleep apnea (OSA) is the most common sleep disorder leading to sleepiness at the wheel.7,8 About 6–21% of the population suffer from moderate or severe OSA defined by an apnea-hypopnea index (AHI) of equal or greater than 15 apnea or hypopnea per hour sleep.9–11 The prevalence increases with age, and OSA is more common in men than women.9 There is a strong association between OSA and the risk of traffic accidents.7 Untreated OSA patients have up to a threefold higher risk of road accidents and continuous positive airway pressure (CPAP) therapy reduces road accidents across all studies.12 Moreover, sleep-related accidents tend to have a high collision impact because the drivers often fail to brake.13 Therefore, sleep experts have a special responsibility in preventing these types of accidents.
A central condition for the evaluation of driving ability in OSA patients is that the OSA is well treated with CPAP, that the sleepiness is improved and that there are no more sleepiness-related accidents and near-miss accidents. The Epworth Sleepiness Scale (ESS) measures the subjectively felt sleepiness, but the correlation with objective tests is poor.14–16 Subsequently, the assessment of driving ability is also based on objective measurements of sleepiness.
Several objective measurements are available. First of all, the multiple wakefulness test (MWT) is measuring the (in)ability to stay awake (as one definition of sleepiness described in the ICSD-3).1,17–19 The multiple sleep latency test (MSLT) is more likely to measure the sleep propensity when the patient is asked to fall asleep.20,21 Therefore, the term “sleepiness” might be misleading in this context, since sleepiness may be interpreted on the one hand as the propensity to fall asleep in a very short time in a monotonous situation (eg in the MSLT) - and then again it can be interpreted as the inability to stay awake (in the MWT). These are two completely different concepts of sleepiness and, therefore, it is not surprising that the correlation between these two tests is rather low.14,16 The MWT is the more suitable test in order to evaluate driving ability; however, we should know how to interpret a decreased sleep latency in the MSLT in the context of driving ability.
A further examination method is the driving simulation test and there is a strong correlation between simulated driving performance and the ability to stay awake in the MWT.22 The driving simulation test is also a good validated diagnostic tool in the assessment of driving ability. Banks et al investigated the mean MWT sleep latency and the simulated driving performance with two conditions (partial sleep deprivation or a combination of partial sleep deprivation and alcohol consumption) and they found that sleep latency on the MWT was a reasonable predictor of driving performance.23 Pizza et al found in OSA patients a good correlation of simulated driving performance and the sleep latency on the MSLT and more significantly on the MWT.22 Philip et al investigated untreated OSA patients and healthy controls by MWT and 90-minute real-life driving.24 They classified OSA patients in three subgroups (very sleepy with a mean sleep latency < 20 minutes, sleepy 20–33 minutes, alert > 33 minutes). Very sleepy and sleepy OSA patients performed significantly worse in the real-life driving and had more inappropriate line crossings than the control drivers.
These mainly used objective tests (MWT or driving simulation or real-life driving), however, are time and resource-intensive and the question arises whether other less time-consuming tests might be suitable as well. The psychomotor vigilance test (PVT) represents one such test, which is less time intensive, and is used in this context as well.25 In several studies OSA patients showed impaired performance on the PVT compared with controls.26–28 With regards to the improvement of PVT reaction time (PVT RT) with subsequent CPAP therapy, there are divergent findings in different studies.27,29–31
However, the question arises whether the PVT is suitable to assess the fitness to drive in OSA patients. The current data concerning this matter are poor. Cori et al investigated 36 OSA patients, 39 healthy controls and 37 shift workers using the PVT, the Oxford Sleep Resistance test, a driving simulator and a cognitive assessment.32 These investigations were performed the afternoon prior to a polysomnography (PSG). They found that the OSA subgroup had poorer performance on most of the vigilance and neurocognitive assessments relative to the other subgroups. For driving performance, there were no significant differences between the subgroups with respect to lane deviations and braking reaction time, but OSA patients showed significantly more speed deviations and an increased number of crashes (crashes in 46.9% of OSA patients, 18.9% of shift workers, and 21.1% of controls). The median PVT reaction time (PVT RT) did not differ between the subgroups but the total number of PVT lapses was significantly increased in the OSA subgroup compared to the shift workers and controls. However, this study was designed to investigate the driving ability in shift workers (with the OSA subgroup as a sleepy control group) and did not compare the PVT data with the results from simulated driving performance. The authors compared the PVT results in the three subgroups. Moreover, the tests were performed in the afternoon and clinically it is of particular interest to investigate the driving ability in OSA patients in the morning when most of them are going to work (in particular against the background of the well-known OSA-related dizziness and exhaustion in the morning).
Sunwoo et al investigated “holders of commercial drivers licenses” one night in the sleep laboratory by a PSG.33 The mean AHI in the subjects was 5.3 per hour. The following day they measured sleepiness using the ESS, MSLT, PVT, and a divided attention driving task (DADT).34 When comparing the testing methods, the authors found a strong correlation between the ESS and MSLT on the one hand, and between the divided attention driving and PVT on the other. This could be mainly due to the fact that the MSLT and the ESS are both tests measuring the propensity to fall asleep, while the DADT and PVT are more likely to measure the ability to stay awake.
In regard to the comparison of the PVT and the MSLT, several studies showed divergent findings. Whereas some studies found a correlation between the PVT and the MSLT, others did not.22,33,35,36 Hence, the aim of the study presented here was to compare the PVT reaction time (PVT RT) in OSA patients and controls in the morning and afternoon with the simulated driving performance. A second purpose was to compare these results more widely with the mean MSLT sleep latency and the ESS and neurocognitive tests.
Patients and Methods
Participants
OSA patients as well as age and sex matched controls were consecutively recruited between August 2014 and June 2015 from our outpatient sleep center and healthy volunteers through personal contact. All consecutive adult patients with moderate or severe OSA and subjective feelings of sleepiness who were admitted to the sleep laboratory of the Interdisciplinary Sleep Medicine Center of the Charité University Medicine Berlin were asked to participate. We used the intranet of our institution for recruitment of healthy control persons. The control persons were employees of the university. Additional exclusion criteria for the controls were the history of tiredness and sleepiness during the day and sleep disturbances at night. Controls were matched by frequency matching meaning that the matching frequency and proportion of cases and controls for sex and age were the same. The study was approved by the local ethics committee of the Charité University Medicine Berlin (ethical vote EA1/301/14), and all participants gave written informed consent prior to the assessment. The study was conducted in accordance with the Declaration of Helsinki.
All OSA patients were newly diagnosed and untreated. They underwent home sleep testing prior to enrollment. All OSA patients with an apnea hypopnea index per hour of sleep (AHI) of equal or greater than 15/h were invited to participate in this study (Embletta measuring the abdominal and thoracic effort, nasal flow, snoring, oxymetry, pulse rate, electrocardiogram, and position; RemLogic software; Natus Embla Enterprise, Pleasanton, USA). Exclusion criteria were chronic insomnia (defined as Insomnia Severity Index values greater than 13), narcolepsy, a periodic limb movement index in the PSG of equal or greater than 15 per hour, an increased value in the Restless Legs Syndrome-Diagnostic Index (RLS-DI) of 10 points, severe neurological comorbidities (eg medical history of stroke or Parkinson’s disease), the intake of stimulants, alcohol abuse, impaired driving ability due to other medical conditions (eg due to visual or motor impairment), and lack of capacity to consent.37,38
Procedures
Polysomnography
We used Alice 5 (software Alice Sleepware, Respironics, Murrysville, USA) or Embla (software: Somnologica, Natus Enterprises, Middleton, USA) as the PSG system. We performed the polysomnography (PSG) in OSA patients according to the American Academy of Sleep Medicine (AASM) criteria (EEG electrodes: F3-M2, C3-M2, O1-M2, F4-M1, C4-M1, O2-M1, left and right electrooculogram, chin electromyogram, electrocardiogram, bilateral tibialis EMG, snoring signal, airflow, thoracic breathing and abdominal breathing, pulse oximetry, position sensor, audio and video recording).39 Controls were investigated by home sleep testing (Embletta). We analyzed the AHI, the hypopnea index per hour of sleep (HI), the oxygen desaturation index per hour of sleep (ODI), the number of obstructive and central apneas, and the number of hypopneas.
The following tests were performed the day after the PSG/ home sleep testing:
Epworth Sleepiness Scale
All participants received an ESS the morning after the PSG with the request to fill it out (without any assistance). The ESS asks how likely the patient is to doze off or to fall asleep in eight different situations and the patients have to answer if they would never doze or if there is a slight or moderate or high chance of dozing.34 Therefore, the ESS subjectively measures the propensity to fall asleep in these eight situations. The questions ask about the propensity to fall asleep during activities (talking or driving), as well as about sleepiness in monotonous situations such as sitting quietly after lunch. The eight answers are each converted to point scores ranging from 0 to 3 (the higher the point score, the higher the subject’s degree of sleepiness). The maximum possible number of points is 24. Sleepiness is defined as an ESS value equal to or greater than 10. The ESS shows good test–retest reliability in healthy volunteers and a good internal consistency.40 ESS values are not significantly increased in healthy volunteers and in insomnia patients.16,34
Divided Attention Steering Simulator
The divided attention steering simulator (DASS) measures lane-keeping along a curved and pseudo-randomly winding road during a simulated night trip over 30 minutes with a simultaneous visual search. The patients have to use a steering wheel while performing in addition a visual task and to respond to digits that appear on a computer screen (dual-task condition). We used a three-dimensional road test from the enterprise ˋStowood Scientific Instrumentsˊ (Oxford, United Kingdom) with a 17-inch monitor and the “fog” configuration what means that the patients were not able to see the end of the road.41 This test takes 30 minutes. Main DASS parameters were response time (RT) in seconds, number of failed responses (FR), lane deviation (LD) (average deviation from the middle of the road in meters), and off-road-events per hour (ORE/h) (middle of the vehicle outside the lane). We performed the DASS in the morning at 10 am and in the afternoon at 2 pm.
Psychomotor Vigilance Test
The PVT measures sustained-attention assessing the reaction-time (RT).25 Patients and controls have to press a button as soon as a dim light flashes. The light flashes randomly. The test takes 10 minutes. The main PVT parameter is the RT in milli seconds (ms). We did not analyze the number of lapses in attention. We performed the PVT in the morning and in the afternoon immediately before the DASS.
Multiple Sleep Latency Test (MSLT)
We performed the MSLT according to the recommendations by the AASM in a dark and quiet room at 9 am, 11 am, 1 pm, and 3 pm, but in contrast to the MSLT protocol by the AASM a total sleep time (TST) of at least six hours of sleep in the PSG was not a prerequisite for the MSLT.42 The AASM recommendations state that the test consists of five naps. According to the AASM recommendations, a shorter four-nap MSLT can be performed, but only in that case when two sleep onset REM periods (SOREMPS) occurred in the first four naps. Otherwise, four naps are not reliable for the diagnosis of narcolepsy. As in our study the occurrence of SOREMPS does not play a role, we recorded only four naps.
We performed a polysomnography the night before MSLT according to the AASM recommendations. One and a half to three hours later we started the MSLT. The result of the MSLT was the mean sleep latency of the four tests in minutes (mean MSLT sleep latency).
Test of Attentional Performance
The test of attentional performance (TAP) (version 2.3, Psytest, Herzogenrath, Germany) is a computerized test battery to measure various attentional and executive functions. We used the subtests “alertness” and “divided alertness”. The alertness test measures reaction time under two conditions. The first condition consists of a simple reaction time measurement, in which a cross appears on the monitor at random intervals and to which the subject has to respond as quickly as possible by pressing a key. This condition measures intrinsic alertness (tonic alertness). In a second condition, reaction time is measured in response to a critical stimulus preceded by a warning tone. This condition measures phasic alertness. The test is constructed in four blocks according to an ABBA design (A = without warning tone; B = with warning tone) – in order to compensate for effects of fatigue. It takes approximately 4.5 minutes depending on reaction time.
The “divided attention” subtest comprises visual and auditory tasks which must be processed in parallel. The divided attention subtest takes between 2.5 and 6 minutes (depending on reaction time). The TAP was only performed in the afternoon after the last MSLT testing at 4 pm.
Participants
Sixty persons aged 38 to 81 years were included between August 2014 and June 2015 and met the inclusion and exclusion criteria (45 men and 15 women). In the first stage, all 60 enrolled patients completed the ESS and were investigated for one night with PSG, MSLT (four naps), DASS (morning and afternoon), PVT (morning and afternoon), and TAP (afternoon). Of the gross sample of these 60 subjects, six were lost due to missing data (artefacts of the EEG electrodes with subsequent limited informative value of the PSG and MSLT).
Table 1 shows the demographic characteristics (age, height, body mass index (BMI), ESS) of the remaining 54 participants (41 men and 13 women; 38 OSA patients and 16 controls) and Table 2 the respiration data. The mean age of the OSA patients was 57.4 (standard deviation, SD: ±11.2 years). The mean age of the age matched controls was 57.3 (SD: ±10.0 years). The proportion of men was 76% in the OSA patients and 75% in the controls. The BMI was 31.8 (SD: ±5.5) in OSA patients and 24.3 (SD: ±2.5) in controls. (The OSA patients were matched for age and sex, but not for obesity.)
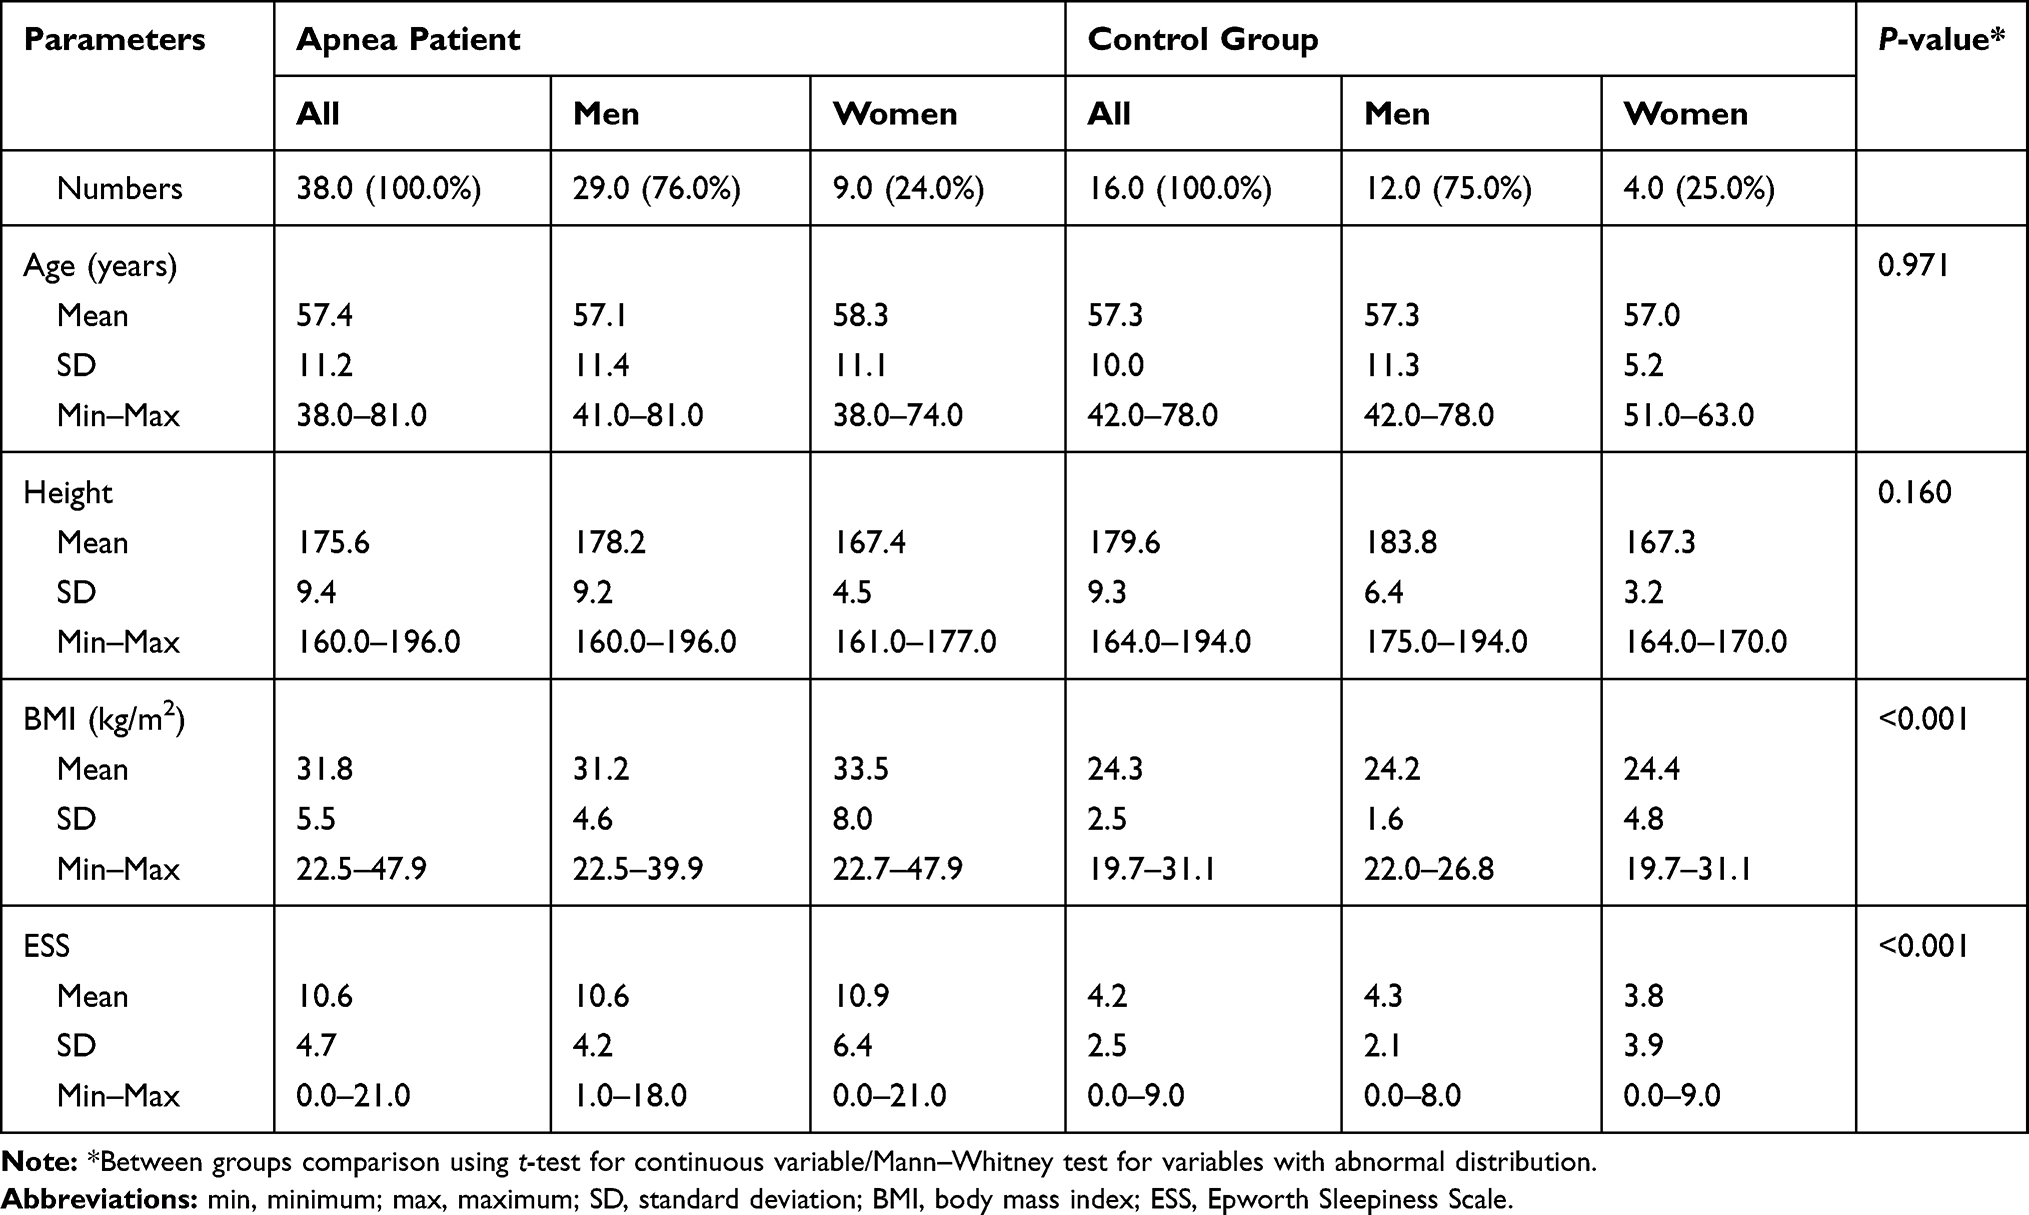 |
Table 1 Basic Demographic Characteristics of Included Participants |
 |
Table 2 Respiration Data of Included Participants |
The mean AHI was 36.6 per hour in OSA patients with a wide range from 15.0 to 80.0 per hour. (Nineteen OSA patients suffered from severe OSA). As expected, the mean AHI was low in controls (3.0 per hour; SD: ±3.4). The ODI was 32.8 in OSA patients (SD: ±24.2) and 3.4 in controls. The total sleep time (TST) in OSA patients was 349.5 minutes (SD: ±65.3 minutes) with 14.8% of sleep stage N3 and 14.0% of REM sleep. The ESS mean value in OSA was 10.6 (SD: ±4.7; min.) and 4.2 in controls (SD: ±2.5).
Statistical Analysis
Following an exploratory analysis of the data, statistical parameters such as mean value, median, minimum and maximum, standard deviation, confidence intervals, and interquartile ranges were calculated. For testing the distribution we used the Kolmogorov–Smirnov test as a nonparametric test of the equality of distribution.43 We analyzed differences between two subgroups (morning vs afternoon and female versus male sex) with the Mann–Whitney U-test. With respect to the ESS, PSG, DASS, PVT, MSLT and TAP we used the Spearman’s rank correlation coefficient (Spearman rho) and Pearson’s correlation coefficient (Pearson’s r) for numerical data to investigate differences between these two subgroups. Scatter plots were performed to demonstrate these relationships. We defined Spearman’s rank correlations (Spearman’s rho) as follows: very strong correlation over 0.9; strong correlation between 0.71 and 0.9; moderate correlation between 0.51 and 0.7; low correlation (clinical not important) for values between 0.21 and 0.5; and no correlation less then 0.2.44 For all calculations, statistical significance was established at p < 0.05. All tests should be understood as constituting exploratory data analysis, such that neither previous power calculations have been made. Analysis was performed with SPSS software (IBM SPSS Statistics for MacOS, Version 23.0, IBM Corp., Amrok, NY).
Results
Results of the Driving Simulation
Table 3 shows the results. We analyzed the correlation between age and the four outcome measures in the DASS (see Figures 1–4). With increasing age, the performance decreased. There was a moderate correlation between off-road events and age and a low correlation between age and response time, failed responses and lane deviation. There was no significant correlation between the DASS outcome measures and the AHI (see Table 4), ODI (see Table 5), BMI, total sleep time in the PSG, percentage deep sleep (N3) and REM sleep in OSA patients (in controls we did not analyze further PSG data of the hypnogram).
 |
Table 3 Results of the Multiple Sleep Latency Test, Divided Attention Steering Simulator and Psychomotor Vigilance Test |
 |
Table 4 Spearman Correlations Between AHI and DASS, PVT and TAP |
 |
Table 5 Spearman Correlations Between ODI and DASS, PVT and TAP |
 |
Figure 1 Correlation between age and DASS response time in all subjects. Notes: *Nearly identical value in some patients; The Spearman’s rank correlation shows a significant low correlation between age and response time of the DASS in OSA patients (red color: correlation coefficient = 0.409, p-value = 0.011) and a moderate correlation in controls (blue color: correlation coefficient = 0.600, p-value = 0.014). Abbreviations: DASS, divided attention steering simulator; OSA, obstructive sleep apnea. |
 |
Figure 2 Correlation between age and DASS lane deviation in all subjects. Note: The Spearman’s rank correlation shows a significant low correlation between age and lane deviation of the DASS in OSA patients (red color: correlation coefficient = 0.363, p-value = 0.025) and a moderate correlation in controls (blue color: correlation coefficient = 0.560, p-value = 0.024). Abbreviations: DASS, divided attention steering simulator; OSA, obstructive sleep apnea. |
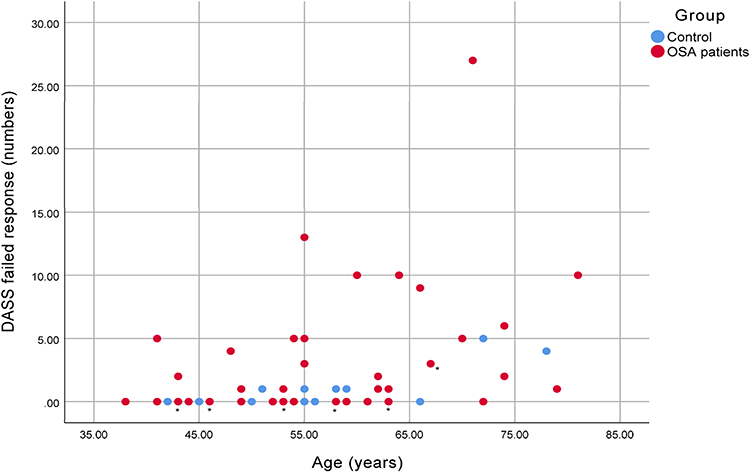 |
Figure 3 Correlation between age and DASS failed response in all subjects. Notes: *Nearly identical value in some patients; The Spearman’s rank correlation shows a significant low correlation between age and failed response of the DASS in OSA patients (red color: correlation coefficient = 0.381, p-value = 0.018) and a moderate correlation in controls (blue color: correlation coefficient = 0.720, p-value = 0.002). Abbreviations: DASS, divided attention steering simulator; OSA, obstructive sleep apnea. |
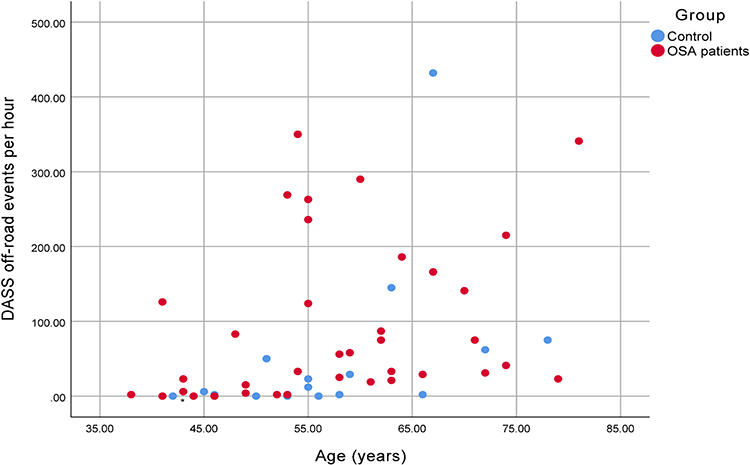 |
Figure 4 Correlation between age and DASS off-road events in all subjects. Notes: *Nearly identical value in some patients; The Spearman’s rank correlation shows a highly significant low correlation between age and off-road events of the DASS in OSA patients (red color: correlation coefficient = 0.469, p-value = 0.003) and a moderate correlation in controls (blue color: correlation coefficient = 0.632, p-value = 0.009). Abbreviations: DASS, divided attention steering simulator; OSA, obstructive sleep apnea. |
The controls provided a faster response time in the morning compared to OSA patients (median 2.1 versus 3.0; p=0.044; Whitney–Mann U-Test). In the afternoon, the controls also showed a faster response time which was not significant (2.2 versus 3.0). Furthermore, the controls failed less often to respond (morning and afternoon), which was also not significant (morning 0.0 versus 1.0; afternoon 0.5 versus 1.0). OSA patients showed significantly more lane deviations in the afternoon compared to controls (0.370 versus 0.278; p=0.048). In the morning there was no significant difference. OSA patients also showed more off-road events compared to controls in the afternoon (37 versus 9; p=0.042). In the morning there was no significant difference.
Correlation Between MSLT and DASS
There was no correlation between the two tests, neither in the morning DASS, nor in the afternoon DASS. Table 3 shows the results of the tests and Table 6 the correlations between the mean MSLT latency and the DASS data.
 |
Table 6 Correlation Between Mean MSLT Sleep Latency and DASS Data |
Psychomotor Vigilance Test and DASS
The Spearman correlation showed a significant moderate correlation between the PVT RT and all four parameters of the DASS (the higher the reaction time in the PVT, the higher the DASS response time, the more failed responses and off-road events, the greater the lane deviation). Table 3 shows the results of the tests and Table 7 the correlations.
 |
Table 7 Correlation Between Psychomotor Vigilance Test and DASS |
Correlation Between ESS Values and DASS
The Spearman correlation did not show a significant correlation between ESS values and DASS parameters. Table 1 shows the ESS values, Table 3 the results of the DASS and Table 8 the correlations between them.
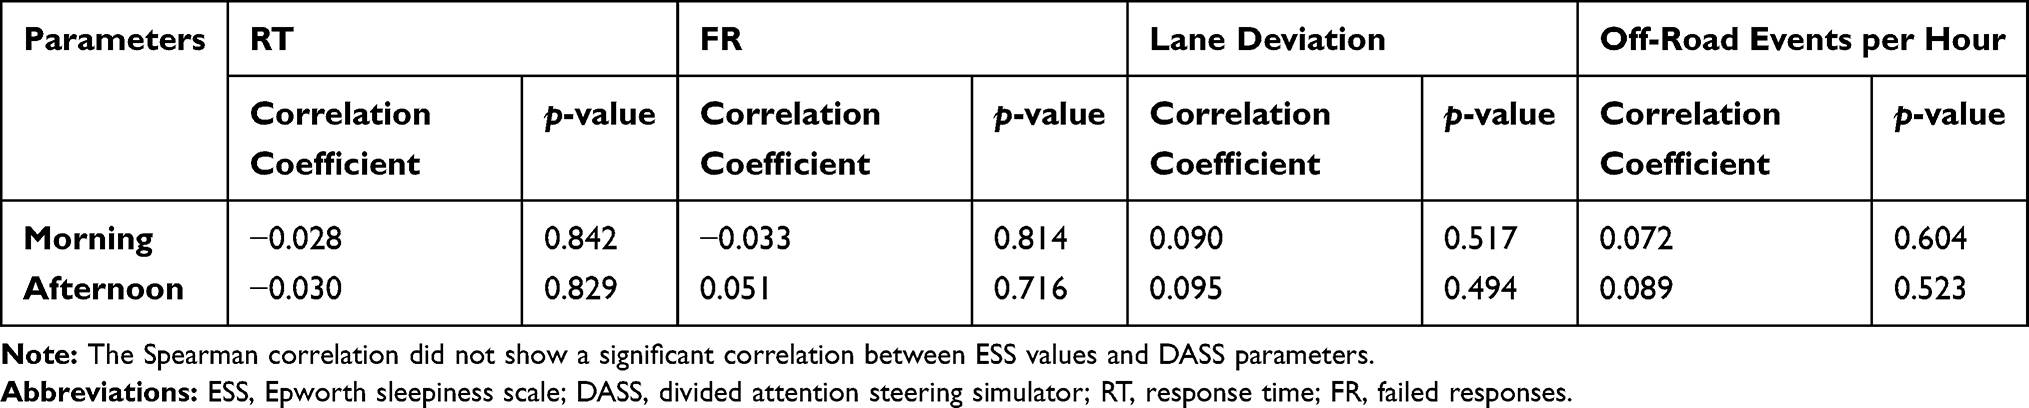 |
Table 8 Correlation Between ESS and DASS |
Correlation Between TAP and DASS
The Spearman correlation showed highly significant low and moderate correlations between the DASS parameters (response time, lane deviations, and off-road events) and the TAP “alertness“ reaction time (with and without acoustic signal) and the TAP ”divided alertness” visual reaction time (see Table 9).
 |
Table 9 Correlation Between TAP and DASS |
Correlation Between TAP and PVT
The Spearman correlation showed a highly significant moderate to strong correlation between the PVT RT and the TAP “alertness” (with and without auditive signal). In the TAP “divided attention” patients had to react on visual and acoustic signals in parallel. Whereas there was a significant but low correlation between the visual subtest and the PVT RT, the auditory tasks of the TAP did not show any significant correlation. All in all, the TAP divided attention subtest did not show a significant correlation with the PVT RT (see Table 10). There was a significant low correlation between the afternoon PVT RT and ODI as well AHI, but no correlation between the AHI or ODI and the TAP.
 |
Table 10 Correlation Between TAP and PVT |
Discussion
This study shows a significant correlation between the PVT RT and simulated driving performance and the alertness subtest of the TAP, but no correlation with the mean MSLT sleep latency and the ESS values. Moreover, there is a significant correlation between the alertness subtest of the TAP and simulated driving performance. Therefore, it can be said that the increased PVT RT seems to reflect the decrease of sustained attention due to OSA-related sleepiness.
However, we are faced with the crucial question: Even if the MWT and the simulated driving are actually seen as the gold standard of driving ability tests, which are the behavioral or neurophysiological tests that enable us to predict the accident risk in untreated OSA patients? In this context, it should be made clear that we cannot perform prospective predictive studies for ethical reasons – because it is obviously not possible to conduct scientific studies analyzing the accident risk in untreated OSA patients and to let them drive. Nor can we usually analyze retrospectively the accident risk in accident participants because most of them have not previously been investigated with vigilance tests and PSG. We could retrospectively analyze the risk accidents in our OSA patients (from our Sleep Center). But in that case, we needed age and sex matched healthy controls and we should know if the patient has used CPAP therapy the night before (an information which is often not available).
Whereas scientific studies suggest that sleepiness is an important factor in up to 30% of traffic accidents, the official accident statistics describe sleepiness as a probable cause in only 1% to 1.5% of identified causes (and in these cases sleepiness is not only due to sleep disorders but also due to sleep deprivation in otherwise healthy subjects).45–49 Independent of what are the real risks, drivers with OSA have an increased risk of being involved in accidents.22
All these methodological issues pose major problems in the predictability of road accidents and, therefore, we need other predictive methods, such as behavioral or neurophysiological tests based on a measurement of specific ‘abilities’. Before testing such ‘abilities’ we should know what we are measuring. The prerequisite, however, is that we have a deeper understanding about what is vigilance.
According to functional imaging studies, different brain networks are required to enable cognitive performances.50 An important attentional network is the cingulo-opercular (CO) network composed of anterior insula/operculum, dorsal anterior cingulate cortex, and thalamus. This CO network seems to be of particular importance for intrinsically maintained tonic alertness.50 Due to the fact that these networks are routinely activated by any cognitive task (independent of the specific task), hence this CO network has also been named a “task-positive” network.51 The hypothesis is that any cognitive performance requires an activation of this CO network in order to enable and control attention.52
This cognitive function to maintain attention over a longer period is called either “sustained attention“ or ‘vigilance’ or ”tonic alertness”.50,53 The so-called ‘vigilance’ is the counterpart of ‘sleepiness’ - at least if we define sleepiness as the decreased ability to stay awake. The propensity to fall asleep measured by the MSLT is another aspect of sleepiness when the person did not even try to stay awake (what explains the lack of any correlation in our study between PVT RT on the one hand and simulated driving performance as well as mean MSLT sleep latency and ESS values on the other).
This “vigilance“ or “sustained attention” or ‘tonic alertness’ can be understood as the intrinsic ability of a network to be ready to receive and absorb information, to process this information and to react accordingly. In addition to the sustained attention (or vigilance or tonic alertness) there are also phasic components of attentional control including ‘selective attention’ - an example of impaired selective attention would be not paying attention to what has been said and to the person who is talking.54 Usually, ‘phasic alertness’ on the road is induced by an external stimulus (eg when a car abruptly enters into the right of way).50,55 The underlying brain networks for this bottom-up stimulus-driven phasic alertness are still not well known. Besides the intrinsic sustained attention and the stimulus-driven phasic attention some researchers also describe a goal-driven attention (for example induced by the expectations of the observer).56 The extent to which the expectation of the observer (and the view of the patient to ”pass the examination”) can affect the results of the MWT, DASS or PVT is not well investigated either.56,57
To a certain degree, the selection of relevant information among all incoming stimuli can be automatic (eg watching the traffic light) or voluntary (eg finding the nearest petrol station). One researcher described an increased “attentional effort” as a motivated activation of the attentional systems in response to a decrease of attentional performance as a compensation mechanism. This is largely due to an increased activity of cortical cholinergic inputs which is itself the result of an activation of projections of mesolimbic structures to the basal forebrain. An example could be to driving home from work after a stressful day, sleep-deprived from the night before and making an effort not to miss a red light and to monitor speed precisely.
However, the driver’s performance depends not only on sustained attention and tonic and phasic alertness, but also on divided attention and several executive functions (planning ability, working memory, decision making, and cognitive flexibility).58 Moreover, people with chronic underlying medical conditions (visual disorders, medical history of stroke) must be examined with an even broader neuropsychological assessment. Furthermore, many disorders, such as cardiac disease and drug abuse, as well as others can also affect driving ability.
OSA patients normally do not need a broad neuropsychological assessment because we are normally assuming that they are “only” suffering from OSA and not from other comorbid diseases which additionally limit driving ability. This is a major point. For the purposes of the decision whether to let OSA patients drive or not, an assessment has to be made of any effect of the CPAP therapy on sleepiness and driving ability. If other comorbid disorders have been diagnosed, then the diagnostic approach should be correspondingly expanded. If this is not the case and OSA patients are “only” suffering from OSA, the next question is, whether the OSA is sufficiently treated with CPAP therapy. If that is the case, then the next diagnostic step should involve objective measurements assessing sustained attention or vigilance before CPAP and under treatment which ideally proves an improvement of sustained attention after therapy.
Against this background, it is important to point out, that the regulations on how to proceed with OSA-related sleepiness differ from country to country.59 The European Union recommends a sleep expert assessment before participating in road traffic and regular checks which are depending on the driving license class. (professional driver every year, and all other drivers every three years).59 The large number of necessary examinations is a clear argument for less time-consuming approaches as for example, the PVT.
Furthermore, studies comparing sleepiness ratings of long-haul airline pilots with those of long-haul truck drivers showed that heavy vehicle drivers self-estimate their sleepiness during night and non-night duties unexpectedly low.60 Professional truck drivers rated lower levels of sleepiness than pilots indicating that they are sleepier than they report. Some researchers explained this by a lack of education and training on sleepiness among truck drivers.60
The PVT normally takes 10 minutes (as described in the original article in 1985 by Dinges and Powel), but due to time constraints, a 2-minute, 3-minute, and 5-minute version has been validated, which are less sensitive compared to the 10-minute version.25,27,31,33,61–64
In this situation we recommend, on the contrary, to investigate OSA patients compared to sex and age matched controls longitudinally (untreated OSA patients versus healthy controls and with CPAP therapy versus healthy controls) using a longer version of the PVT up to 40 minutes (as in the MWT). As professional drivers have to drive for very long periods of time (with frequent monotonous night trips) we recommend investigating longitudinally untreated and treated OSA patients with a longer version of the PVT in order to increase the sensitivity of the PVT. This could potentially increase the sensitivity of the PVT and even better assess impaired sustained attention in professional drivers.
Methodical Limitations
We did not investigate minor lapses as a PVT parameter. Moreover, in regards to the DASS the participants were not asked about their driving practice and participants who slept less than six hours TST in the PSG were not excluded from MSLT.
Conclusion
PVT RT was increased in untreated OSA patients compared to healthy controls reflecting a decreased sustained attention in OSA patients. This increase of PVT RT correlated with an impairment of simulated driving performance and increased reaction time in the “alertness” subtest of the TAP. Therefore, the PVT is a suitable test for measuring (decreased) sustained attention and vigilance in OSA patients.
Acknowledgments
The authors thank Dr. Gosia Sullivan for reviewing the paper and acknowledge support from the German Research Foundation (DFG) and the Open Access Publication Fund of Charité – Universitätsmedizin Berlin.
Disclosure
Prof. Dr. Thomas Penzel reports grants from the German-Israeli Foundation (GIF), no: I-1372-303.7/2016 and support from Russian Federation Government, grant No: 075-15-2019-1885; holds shares of The Siestagroup GmbH, Advanced Sleep Research GmbH, and Somnico GmbH; is a consultant to Bayer, Heel, Jazz, and Vidimetrics; and received unrestricted grants from Itamar, Löwenstein Medical, Resmed, and Philips. Dr Christian Veauthier reports grants from German Federal Ministry of Education and Research (BMBF) and personal fees from Bioprojet, outside the submitted work. The authors report no other possible conflicts of interest in this work.
References
1. American Academy of Sleep Medicine. International Classification of Sleep Disorders.
2. Léger D, Ement P. Somnolence et risque accidentel. La Presse Médicale. 2015;44(10):1022–1028. doi:10.1016/j.lpm.2015.04.002
3. Zwahlen D, Jackowski C, Pfäffli M. Sleepiness, driving, and motor vehicle accidents: a questionnaire-based survey. J Forensic Leg Med. 2016;44:183–187. doi:10.1016/j.jflm.2016.10.014
4. World Health Organization, issuing body, ProQuest (Firm). Global status report on road safety 2018. 2018. Available from: https://ebookcentral.proquest.com/lib/qut/detail.action?docID=5910092.
5. Liu G, Chen S, Zeng Z, et al. Risk factors for extremely serious road accidents: results from national road accident statistical annual report of China. PLoS One. 2018;13(8):e0201587. doi:10.1371/journal.pone.0201587
6. Hershner S, Chervin R. Causes and consequences of sleepiness among college students. NSS. 2014;6:73. doi:10.2147/NSS.S62907
7. Terán-Santos J, Jimenez-Gomez A, Cordero-Guevara J. The association between sleep apnea and the risk of traffic accidents. N Engl J Med. 1999;340(11):847–851. doi:10.1056/NEJM199903183401104
8. Garbarino S. Excessive daytime sleepiness in obstructive sleep apnea: implications for driving licenses. Sleep Breath. 2019;1–11. doi:10.1007/s11325-019-01903-6
9. Senaratna CV, Perret JL, Lodge CJ, et al. Prevalence of obstructive sleep apnea in the general population: a systematic review. Sleep Med Rev. 2017;34:70–81. doi:10.1016/j.smrv.2016.07.002
10. Benjafield AV, Ayas NT, Eastwood PR, et al. Estimation of the global prevalence and burden of obstructive sleep apnoea: a literature-based analysis. Lancet Respir Med. 2019;7(8):687–698. doi:10.1016/S2213-2600(19)30198-5
11. Fietze I, Laharnar N, Obst A, et al. Prevalence and association analysis of obstructive sleep apnea with gender and age differences - Results of SHIP-Trend. J Sleep Res. 2019;28(5):e12770. doi:10.1111/jsr.12770
12. Ellen RLB, Marshall SC, Palayew M, Molnar FJ, Wilson KG, Man-Son-Hing M. Systematic review of motor vehicle crash risk in persons with sleep apnea. J Clin Sleep Med. 2006;2(2):193–200.
13. Miyata S, Noda A, Ozaki N, et al. Insufficient sleep impairs driving performance and cognitive function. Neurosci Lett. 2010;469(2):229–233. doi:10.1016/j.neulet.2009.12.001
14. Benbadis SR, Mascha E, Perry MC, Wolgamuth BR, Smolley LA, Dinner DS. Association between the Epworth sleepiness scale and the multiple sleep latency test in a clinical population. Ann Intern Med. 1999;130(4 Pt 1):289–292. doi:10.7326/0003-4819-130-4-199902160-00014
15. Chervin RD. The multiple sleep latency test and Epworth sleepiness scale in the assessment of daytime sleepiness. J Sleep Res. 2000;9(4):399–401. doi:10.1046/j.1365-2869.2000.0227a.x
16. Fong SYY, Ho CKW, Wing YK. Comparing MSLT and ESS in the measurement of excessive daytime sleepiness in obstructive sleep apnoea syndrome. J Psychosom Res. 2005;58(1):55–60. doi:10.1016/j.jpsychores.2004.05.004
17. Mitler MM, Gujavarty KS, Browman CP. Maintenance of wakefulness test: a polysomnographic technique for evaluation treatment efficacy in patients with excessive somnolence. Electroencephalogr Clin Neurophysiol. 1982;53(6):658–661. doi:10.1016/0013-4694(82)90142-0
18. Arand D, Bonnet M, Hurwitz T, Mitler M, Rosa R, Sangal RB. The clinical use of the MSLT and MWT. Sleep. 2005;28(1):123–144. doi:10.1093/sleep/28.1.123
19. Doghramji K, Mitler MM, Sangal RB, et al. A normative study of the maintenance of wakefulness test (MWT). Electroencephalogr Clin Neurophysiol. 1997;103(5):554–562. doi:10.1016/s0013-4694(97)00010-2
20. Carskadon MA, Dement WC, Mitler MM, Roth T, Westbrook PR, Keenan S. Guidelines for the multiple sleep latency test (MSLT): a standard measure of sleepiness. Sleep. 1986;9(4):519–524. doi:10.1093/sleep/9.4.519
21. Carskadon MA, Dement WC. The multiple sleep latency test: what does it measure? Sleep. 1982;5(Suppl 2):S67–72. doi:10.1093/sleep/5.s2.s67
22. Pizza F, Contardi S, Mondini S, Trentin L, Cirignotta F. Daytime sleepiness and driving performance in patients with obstructive sleep apnea: comparison of the MSLT, the MWT, and a simulated driving task. Sleep. 2009;32(3):382–391. doi:10.1093/sleep/32.3.382
23. Banks S, Catcheside P, Lack LC, Grunstein RR, McEvoy RD. The Maintenance of Wakefulness Test and driving simulator performance. Sleep. 2005;28(11):1381–1385. doi:10.1093/sleep/28.11.1381
24. Philip P, Sagaspe P, Taillard J, et al. Maintenance of Wakefulness Test, obstructive sleep apnea syndrome, and driving risk. Ann Neurol. 2008;64(4):410–416. doi:10.1002/ana.21448
25. Dinges DF, Pack F, Williams K, et al. Cumulative sleepiness, mood disturbance, and psychomotor vigilance performance decrements during a week of sleep restricted to 4–5 hours per night. Sleep. 1997;20(4):267–277.
26. D’Rozario AL, Field CJ, Hoyos CM, et al. Impaired neurobehavioural performance in untreated obstructive sleep apnea patients using a novel standardised test battery. Front Surg. 2018;5:35. doi:10.3389/fsurg.2018.00035
27. Batool-Anwar S, Kales S, Varvarigou V, DeYoung P, Malhotra A, Patel S. Obstructive sleep apnea and psychomotor vigilance task performance. NSS. 2014;6:65. doi:10.2147/NSS.S53721
28. Sforza E, Haba-Rubio J, De Bilbao F, Rochat T, Ibanez V. Performance vigilance task and sleepiness in patients with sleep-disordered breathing. Eur Respir J. 2004;24(2):279–285. doi:10.1183/09031936.04.00091903
29. Deering S, Liu L, Zamora T, Hamilton J, Stepnowsky C. CPAP adherence is associated with attentional improvements in a group of primarily male patients with moderate to severe OSA. J Clin Sleep Med. 2017;13(12):1423–1428. doi:10.5664/jcsm.6838
30. Lei F, Li TM, Tan L, Ren R, Tang XD, Yang LH. Associations between objective sleepiness and cognition function before and after CPAP in obstructive sleep apnea patients. Zhonghua Yi Xue Za Zhi. 2019;99(28):2182–2186. doi:10.3760/cma.j.issn.0376-2491.2019.28.006
31. Djonlagic I, Guo M, Matteis P, Carusona A, Stickgold R, Malhotra A. First night of CPAP: impact on memory consolidation attention and subjective experience. Sleep Med. 2015;16(6):697–702. doi:10.1016/j.sleep.2015.01.017
32. Cori JM, Jackson ML, Barnes M, et al. The differential effects of regular shift work and obstructive sleep apnea on sleepiness, mood and neurocognitive function. J Clin Sleep Med. 2018;14(06):941–951. doi:10.5664/jcsm.7156
33. Sunwoo BY, Jackson N, Maislin G, Gurubhagavatula I, George CF, Pack AI. Reliability of a single objective measure in assessing sleepiness. Sleep. 2012;35(1):149–158. doi:10.5665/sleep.1606
34. Johns MW. A new method for measuring daytime sleepiness: the Epworth sleepiness scale. Sleep. 1991;14(6):540–545. doi:10.1093/sleep/14.6.540
35. Li Y, Vgontzas A, Kritikou I, et al. Psychomotor vigilance test and its association with daytime sleepiness and inflammation in sleep apnea: clinical implications. J Clin Sleep Med. 2017;13(09):1049–1056. doi:10.5664/jcsm.6720
36. George CFP, Boudreau AC, Smiley A. Comparison of simulated driving performance in narcolepsy and sleep apnea patients. Sleep. 1996;19(9):711–717. doi:10.1093/sleep/19.9.711
37. Walters AS, Frauscher B, Allen R, et al. Review of diagnostic instruments for the restless legs syndrome/Willis-Ekbom Disease (RLS/WED): critique and recommendations. J Clin Sleep Med. 2014;10:1343–1349. doi:10.5664/jcsm.4298
38. Bastien C. Validation of the insomnia severity index as an outcome measure for insomnia research. Sleep Med. 2001;2(4):297–307. doi:10.1016/S1389-9457(00)00065-4
39. Berry RB, Brooks R, Gamaldo CE, Harding SM, Marcus CL, Vaughn BV. The AASM Manual for the Scoring of Sleep and Associated Events: Rules, Terminology and Technical Specifications, Version 2 0. Www Aasmnet Org. American Academy of Sleep Medicine; 2012.
40. Olson L, Cole M, Ambrogetti A. Correlations among Epworth Sleepiness Scale scores, multiple sleep latency tests and psychological symptoms. J Sleep Res. 1998;7(4):248–253. doi:10.1046/j.1365-2869.1998.00123.x
41. Hack M. Randomised prospective parallel trial of therapeutic versus subtherapeutic nasal continuous positive airway pressure on simulated steering performance in patients with obstructive sleep apnoea. Thorax. 2000;55(3):224–231. doi:10.1136/thorax.55.3.224
42. Littner MR, Kushida C, Wise M, et al. Practice parameters for clinical use of the multiple sleep latency test and the maintenance of wakefulness test. Sleep. 2005;28(1):113–121. doi:10.1093/sleep/28.1.113
43. Bärlocher F. Biostatistik. 2., unveränderte Auflage. Stuttgart New York: Georg Thieme Verlag; 2008.
44. Bortz J, Weber R. Statistik: Für Human- und Sozialwissenschaftler. Berlin, Heidelberg: Springer Medizin Verlag Heidelberg; 2005. doi:10.1007/b137571
45. Laube I, Seeger R, Russi EW, Bloch KE. Accidents related to sleepiness: review of medical causes and prevention with special reference to Switzerland. Schweiz Med Wochenschr. 1998;128(40):1487–1499.
46. Horne JA, Reyner LA. Sleep related vehicle accidents. BMJ. 1995;310(6979):565–567. doi:10.1136/bmj.310.6979.565
47. Mathis J, Schreier D. Tagesschläfrigkeit und Fahrverhalten. Ther Umsch. 2014;71(11):679–686. doi:10.1024/0040-5930/a000610
48. Pack AI, Pack AM, Rodgman E, Cucchiara A, Dinges DF, Schwab CW. Characteristics of crashes attributed to the driver having fallen asleep. Accid Anal Prev. 1995;27(6):769–775. doi:10.1016/0001-4575(95)00034-8
49. Parsons M. Fits and other causes of loss of consciousness while driving. Q J Med. 1986;58(227):295–303.
50. Sadaghiani S, D’Esposito M. Functional characterization of the cingulo-opercular network in the maintenance of tonic alertness. Cereb Cortex. 2015;25(9):2763–2773. doi:10.1093/cercor/bhu072
51. Fox MD, Snyder AZ, Vincent JL, Corbetta M, Van Essen DC, Raichle ME. From the cover: the human brain is intrinsically organized into dynamic, anticorrelated functional networks. Proc Natl Acad Sci. 2005;102(27):9673–9678. doi:10.1073/pnas.0504136102
52. Duncan J, Owen AM. Common regions of the human frontal lobe recruited by diverse cognitive demands. Trends Neurosci. 2000;23(10):475–483. doi:10.1016/S0166-2236(00)01633-7
53. Mackworth NH. The breakdown of vigilance during prolonged visual search. Q J Exp Psychol. 1948;1(1):6–21. doi:10.1080/17470214808416738
54. Posner MI, Boies SJ. Components of attention. Psychol Rev. 1971;78(5):391–408. doi:10.1037/h0031333
55. Posner MI. Measuring alertness. Ann N Y Acad Sci. 2008;1129(1):193–199. doi:10.1196/annals.1417.011
56. Egeth HE, Yantis S. Visual attention: control, representation, and time course. Annu Rev Psychol. 1997;48(1):269–297. doi:10.1146/annurev.psych.48.1.269
57. Ptak R. The frontoparietal attention network of the human brain: action, saliency, and a priority map of the environment. Neuroscientist. 2012;18(5):502–515. doi:10.1177/1073858411409051
58. Racheva R, Totkova Z. Reliability and validity of a method for assessment of executive functions in drivers. Behav Sci. 2020;10(1):37. doi:10.3390/bs10010037
59. Penzel T, Fietze I, Schöbel C, Veauthier C. Technology to detect driver sleepiness. Sleep Med Clin. 2019;14(4):463–468. doi:10.1016/j.jsmc.2019.08.004
60. Sallinen M, Pylkkönen M, Puttonen S, Sihvola M, Åkerstedt T. Are long-haul truck drivers unusually alert? A comparison with long-haul airline pilots. Accid Anal Prev. 2020;137:105442. doi:10.1016/j.aap.2020.105442
61. Loh S, Lamond N, Dorrian J, Roach G, Dawson D. The validity of psychomotor vigilance tasks of less than 10-minute duration. Behav Res Methods Instrum Comput. 2004;36(2):339–346. doi:10.3758/BF03195580
62. Thorne DR, Johnson DE, Redmond DP, Sing HC, Belenky G, Shapiro JM. The Walter Reed palm-held psychomotor vigilance test. Behav Res Methods. 2005;37(1):111–118. doi:10.3758/BF03206404
63. Basner M, Mollicone D, Dinges DF. Validity and sensitivity of a brief psychomotor vigilance test (PVT-B) to total and partial sleep deprivation. Acta Astronaut. 2011;69(11–12):949–959. doi:10.1016/j.actaastro.2011.07.015
64. Matsangas P, Shattuck NL, Brown S. Preliminary validation study of the 3-min wrist-worn psychomotor vigilance test. Behav Res. 2017;49(5):1792–1801. doi:10.3758/s13428-016-0821-2
 © 2020 The Author(s). This work is published and licensed by Dove Medical Press Limited. The
full terms of this license are available at https://www.dovepress.com/terms
and incorporate the Creative Commons Attribution
- Non Commercial (unported, 3.0) License.
By accessing the work you hereby accept the Terms. Non-commercial uses of the work are permitted
without any further permission from Dove Medical Press Limited, provided the work is properly
attributed. For permission for commercial use of this work, please see paragraphs 4.2 and 5 of our Terms.
© 2020 The Author(s). This work is published and licensed by Dove Medical Press Limited. The
full terms of this license are available at https://www.dovepress.com/terms
and incorporate the Creative Commons Attribution
- Non Commercial (unported, 3.0) License.
By accessing the work you hereby accept the Terms. Non-commercial uses of the work are permitted
without any further permission from Dove Medical Press Limited, provided the work is properly
attributed. For permission for commercial use of this work, please see paragraphs 4.2 and 5 of our Terms.