")
Back to Journals » Diabetes, Metabolic Syndrome and Obesity » Volume 16
The Obesity Paradox: Effect of Body Mass Index and Waist Circumference on Post-Stroke Cognitive Impairment
Authors Liu Q , Liao X, Pan Y, Xiang X, Zhang Y
Received 20 June 2023
Accepted for publication 2 August 2023
Published 16 August 2023 Volume 2023:16 Pages 2457—2467
DOI https://doi.org/10.2147/DMSO.S420824
Checked for plagiarism Yes
Review by Single anonymous peer review
Peer reviewer comments 3
Editor who approved publication: Dr Konstantinos Tziomalos
Qi Liu,1 Xiaoling Liao,1,2 Yuesong Pan,2 Xianglong Xiang,2 Yumei Zhang2,3
1Department of Neurology, Beijing Tiantan Hospital, Capital Medical University, Beijing, People’s Republic of China; 2China National Clinical Research Center for Neurological Diseases, Beijing, People’s Republic of China; 3Department of Rehabilitation Medicine, Beijing Tiantan Hospital, Capital Medical University, Beijing, People’s Republic of China
Correspondence: Yumei Zhang, Department of Rehabilitation Medicine, Beijing Tiantan Hospital, Capital Medical University, No. 119 South 4th Ring West Road, Fengtai District, Beijing, 100070, People’s Republic of China, Tel +86-10-59975531, Email [email protected]
Background: Obesity is a risk factor for dementia within the old population however not within the middle-aged population, that is referred to the “obesity paradox”. This study explored the association of body mass index (BMI) and waist circumference (WC) with post-stroke cognitive impairment (PSCI) in middle-aged (40– 65 years) versus old population (≥ 65 years).
Methods: The current study enrolled 1735 individuals over the age of 40 who had their first ischemic stroke from the Impairment of Cognition and Sleep (ICONS) subgroup of the China National Stroke Registry-3 (CNSR-3). BMI and WC were used for the diagnosis of obesity and central obesity, respectively. PSCI was diagnosed according to the Montreal Cognitive Assessment (MoCA). The main clinical outcome was the incidence of PSCI assessed at three months after stroke. Multivariable regression analysis was performed to evaluate the association between obesity and three-month PSCI. Stratified analysis was also performed to explore the effect of age on the relationship between obesity and PSCI.
Results: In the general population, multivariable logistic regression found that the adjusted odds ratio (OR) with 95% confidence interval (CI) of general obesity was 1.45 (1.06– 1.98) and that of central obesity was 1.54 (1.24– 1.91) for the three-month incidence of PSCI. Stratified analysis by age showed that the adjusted OR with a 95% CI of general obesity was 1.84 (1.24– 2.72) in middle-aged patients and 0.89 (0.52– 1.54) in elderly patients (p-value for interaction = 0.05). Central obesity was associated with PSCI in all age groups: 1.57 (1.18– 2.09) in middle-aged patients and 1.52 (1.08– 2.15) in elderly patients (p-value for interaction= 0.93).
Conclusion: General obesity was related to an increased risk of PSCI in middle-aged but not elderly patients, whereas central obesity was associated with an increased risk of PSCI in all age groups, suggesting that the obesity paradox arises only obesity is outlined by BMI.
Keywords: post-stroke cognitive impairment, obesity paradox, ischemic stroke, middle-aged and elderly population, follow-up study
Introduction
Post-stroke cognitive impairment (PSCI) is a serious disability experienced by stroke survivors, and approximately one-third of stroke survivors develop cognitive impairment.1,2 Identifying and controlling risk factors for PSCI would play a pivotal role in prevention and intervention. The prevalence of obesity has risen rapidly in the past four decades and has been demonstrated to increase the risk of cognitive decline.3–5 However, some studies indicated that the impact of obesity on cognition varies by age6 In the middle-aged population, but not in the elderly population, overweight or obesity has been found to have a significant correlation with the heightened risk of experiencing cognitive decline.7,8 Contrary to common knowledge, some studies even found a positive effect of a higher body mass index (BMI) on cognition among elderly individuals.9–12 The unexpected phenomenon of improved cognitive function in individuals with obesity has been referred to as the “obesity paradox”, creating uncertainty regarding the impact of obesity on cognitive abilities.
Recently, several studies have explored whether stroke patients with obesity have impaired cognitive performance than normal weight patients.13,14 However, there is a lack of research on whether this relationship varies depending on age and whether the obesity paradox persists in patients with stroke. Additionally, previous studies have not explored the effects of central obesity on cognitive function. To investigate the impact of aging on fat distribution, previous studies have suggested that waist circumference (WC) is a more effective marker of adiposity than BMI in the elderly population.15 Thus, this study evaluated general obesity and central obesity using BMI and WC as adiposity markers, respectively. We hypothesized that the effect of obesity on PSCI may differ based on age. This study aimed to investigate the association between high BMI and large WC with PSCI in middle-aged (40–65) versus elderly patients (≥ 65 years) with minor stroke or transient ischemic attack (TIA). The meaning of this study lies in its provision of evidence for obesity management in stroke patients of different ages to prevent the occurrence of PSCI.
Method
Study Design
Patients were recruited from the Impairment of Cognition and Sleep (ICONS) study of CNSR-3.16,17 Briefly, ICONS was launched in 2015 and is a multicenter prospective cohort study aimed at investigating the occurrence, variation trend and factors influencing cognitive impairment and sleep disorder in Chinese patients with acute ischemic stroke and transient ischemic attack (TIA). Inclusion criteria for the study were as follows: patients aged 18 years or older; diagnosed within 7 days of minor ischemic stroke (National Institute of Health stroke scale (NIHSS) ≤5) and TIA; with no history of a severe cognitive disorder before stroke; and without any concomitant disorders that could interfere with the cognitive evaluation. The study was approved by the Ethics Committees of Beijing Tiantan Hospital (No. KY2015-001-01) and all other participating hospitals, following the guidelines of the Helsinki Declaration. All participants gave written informed consent to the procedure, which had been approved by the ethics committee of Beijing Tiantan Hospital.
Clinical Assessment of Participants
Baseline information on patient demographics, risk factors for PSCI, and medical comorbidities was collected. The medical histories of diabetes mellitus, dyslipidemia, hypertension, coronary artery disease and the habit of smoking and drinking were considered as risk factors. The definition of hypertension included a new diagnosis at discharge, self-reported history, or any antihypertensive drug usage. The definition of diabetes mellitus included fasting blood glucose ≥7.0 mmol/L, non-fasting blood glucose ≥11.1 mmol/L, self-reported history, and any glucose-lowering drug usage. The definition of dyslipidemia included low high-density lipoprotein levels (≤0.9 mmol/L), elevated levels of serum triglyceride (≥1.7 mmol/L) or total cholesterol (≥5.72 mmol/L), self-reported history and any lipid-lowering drug usage. Ischemic heart disease and myocardial infarction were included in the definition of coronary artery heart disease.
Obesity Diagnosis
BMI and WC were used to evaluate general obesity and central obesity at baseline, respectively. Participants measured their height and weight by an automatic height-weight scale, and then BMI was estimated by dividing weight (kg) by the square of height (m). WC was evaluated at the level of the omphalos by a tapeline. According to their BMI values, patients were divided into normal weight group (<23.9 kg/m2), overweight group (24.0–27.9 kg/m2), and obese group (≥ 28.0 kg/m2).15 Central obesity was outlined as WC > 85 cm for males and > 80 cm for females.18
Outcome Measure
The primary clinical goal of this study was to identify the incidence of PSCI at three months follow-up. The Chinese version of the Montreal Cognitive Assessment (MoCA), a widely recognized cognitive screening instrument, was utilized to evaluate global cognitive state. This scale assessed the cognitive domains of attention and concentration, executive functions, memory, language, visuospatial skills, conceptual thinking, calculations, and orientation. It has been proven to have great sensitivity and specificity in identifying vascular dementia.19,20 The AUC of MoCA was 0.85 (95% CI (0.80 to 0.95)) with good sensitivity (0.85) and specificity in detecting PSCI (0.88).20 The MoCA scores range from 0 to 30, with higher values indicating normal cognitive functioning. Based on previous research from this database, cognitive impairment was defined as a MoCA score of less than 25 for the purposes of this study.
Statistical Analysis
All analyses were performed with SAS version 9.4 (SAS Institute, Cary, North Carolina, USA). Continuous variables are represented as the mean and standard deviation, or as medians with interquartile ranges. Proportions are used to represent categorical data. To compare the baseline clinical characteristics of patients stratified by age and obesity status, we utilized independent sample t-tests and Mann–Whitney U-tests for continuous variables and chi-squared tests for categorical variables. Continuous variables were presented as mean and standard deviation or medians with interquartile ranges, while categorical data were expressed as proportions. We applied independent sample t-tests and Mann–Whitney U-tests to analyze continuous variables, and chi-squared tests for categorical variables to compare the baseline clinical characteristics of patients stratified by age and obesity status. Obesity was categorized into two types: general obesity, which was defined by BMI, and central obesity, which was defined by WC. The association of obesity status with the three-month incidence of PSCI was assessed using multivariable logistic analysis. The association between obesity-related indices (BMI and WC) and the risk of PSCI was assessed through a regression analysis utilizing restricted cubic splines. We controlled for the following risk factors known to be associated with PSCI and obesity: age, sex, history of hypertension, diabetes mellitus, dyslipidemia, the habit of smoking and alcohol, and the baseline NIHSS. A stratification study was undertaken to investigate whether the effect of obesity on the incidence of PSCI differed by age. Statistical significance was determined for two-tailed p-values <0.05.
Results
Baseline Characteristics
From August 2015 to January 2018, a total of 2560 patients over the age of 40 were recruited in the current study. All patients completed BMI and WC measurements. A total of 498 patients were excluded because of a history of stroke, and 327 patients were excluded because they were lost to follow-up. Finally, the analysis included 1735 patients (Figure 1 and Supplementary Figure 1).
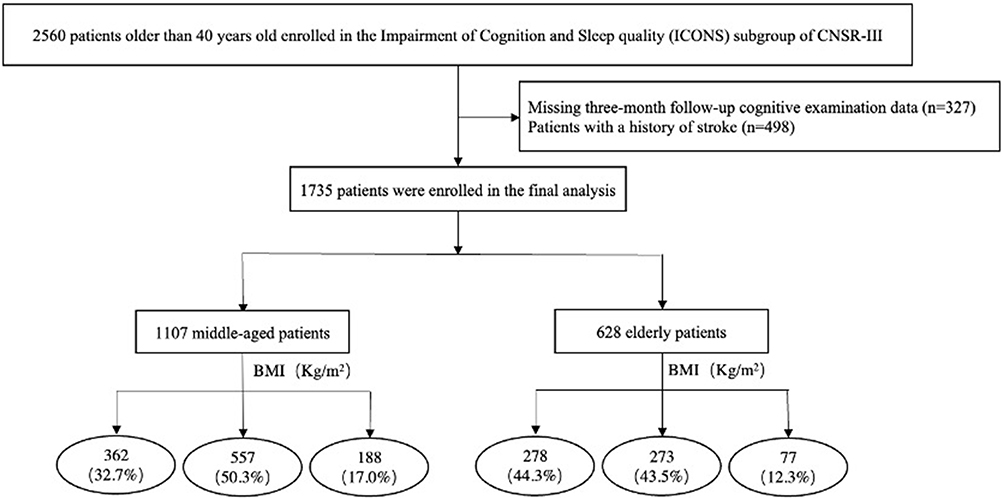 |
Figure 1 Flow chart showing patient selection from the impairment of Cognition and Sleep study of the China National Stroke Registry-3. Abbreviation: BMI, body mass index. |
In the final analysis, the median age of the 1735 stroke patients included was 61.0 years, and 1241 (71.5%) were male. Of 1107 patients in the middle-aged group (40–65 years), 557 (50.3%) were overweight, and 188 (17.0%) were obese. Among elderly patients (≥65 years), 273 of 628 (43.5%) were overweight, and 77 (12.3%) were obese. A total of 760 (68.7%) middle-aged patients and 388 (61.8%) elderly patients had central obesity. Overall, regardless of obesity type and age status, patients with obesity exhibited greater cardiovascular risk factors, including diabetes mellitus, and dyslipidemia than normal weight patients (Table 1 and Supplementary Table 1). The obesity indices distribution using kernel density estimation showed that middle-aged patients seem to account for a higher proportion of patients with increased BMI and WC than elderly patients (Supplementary Figure 2).
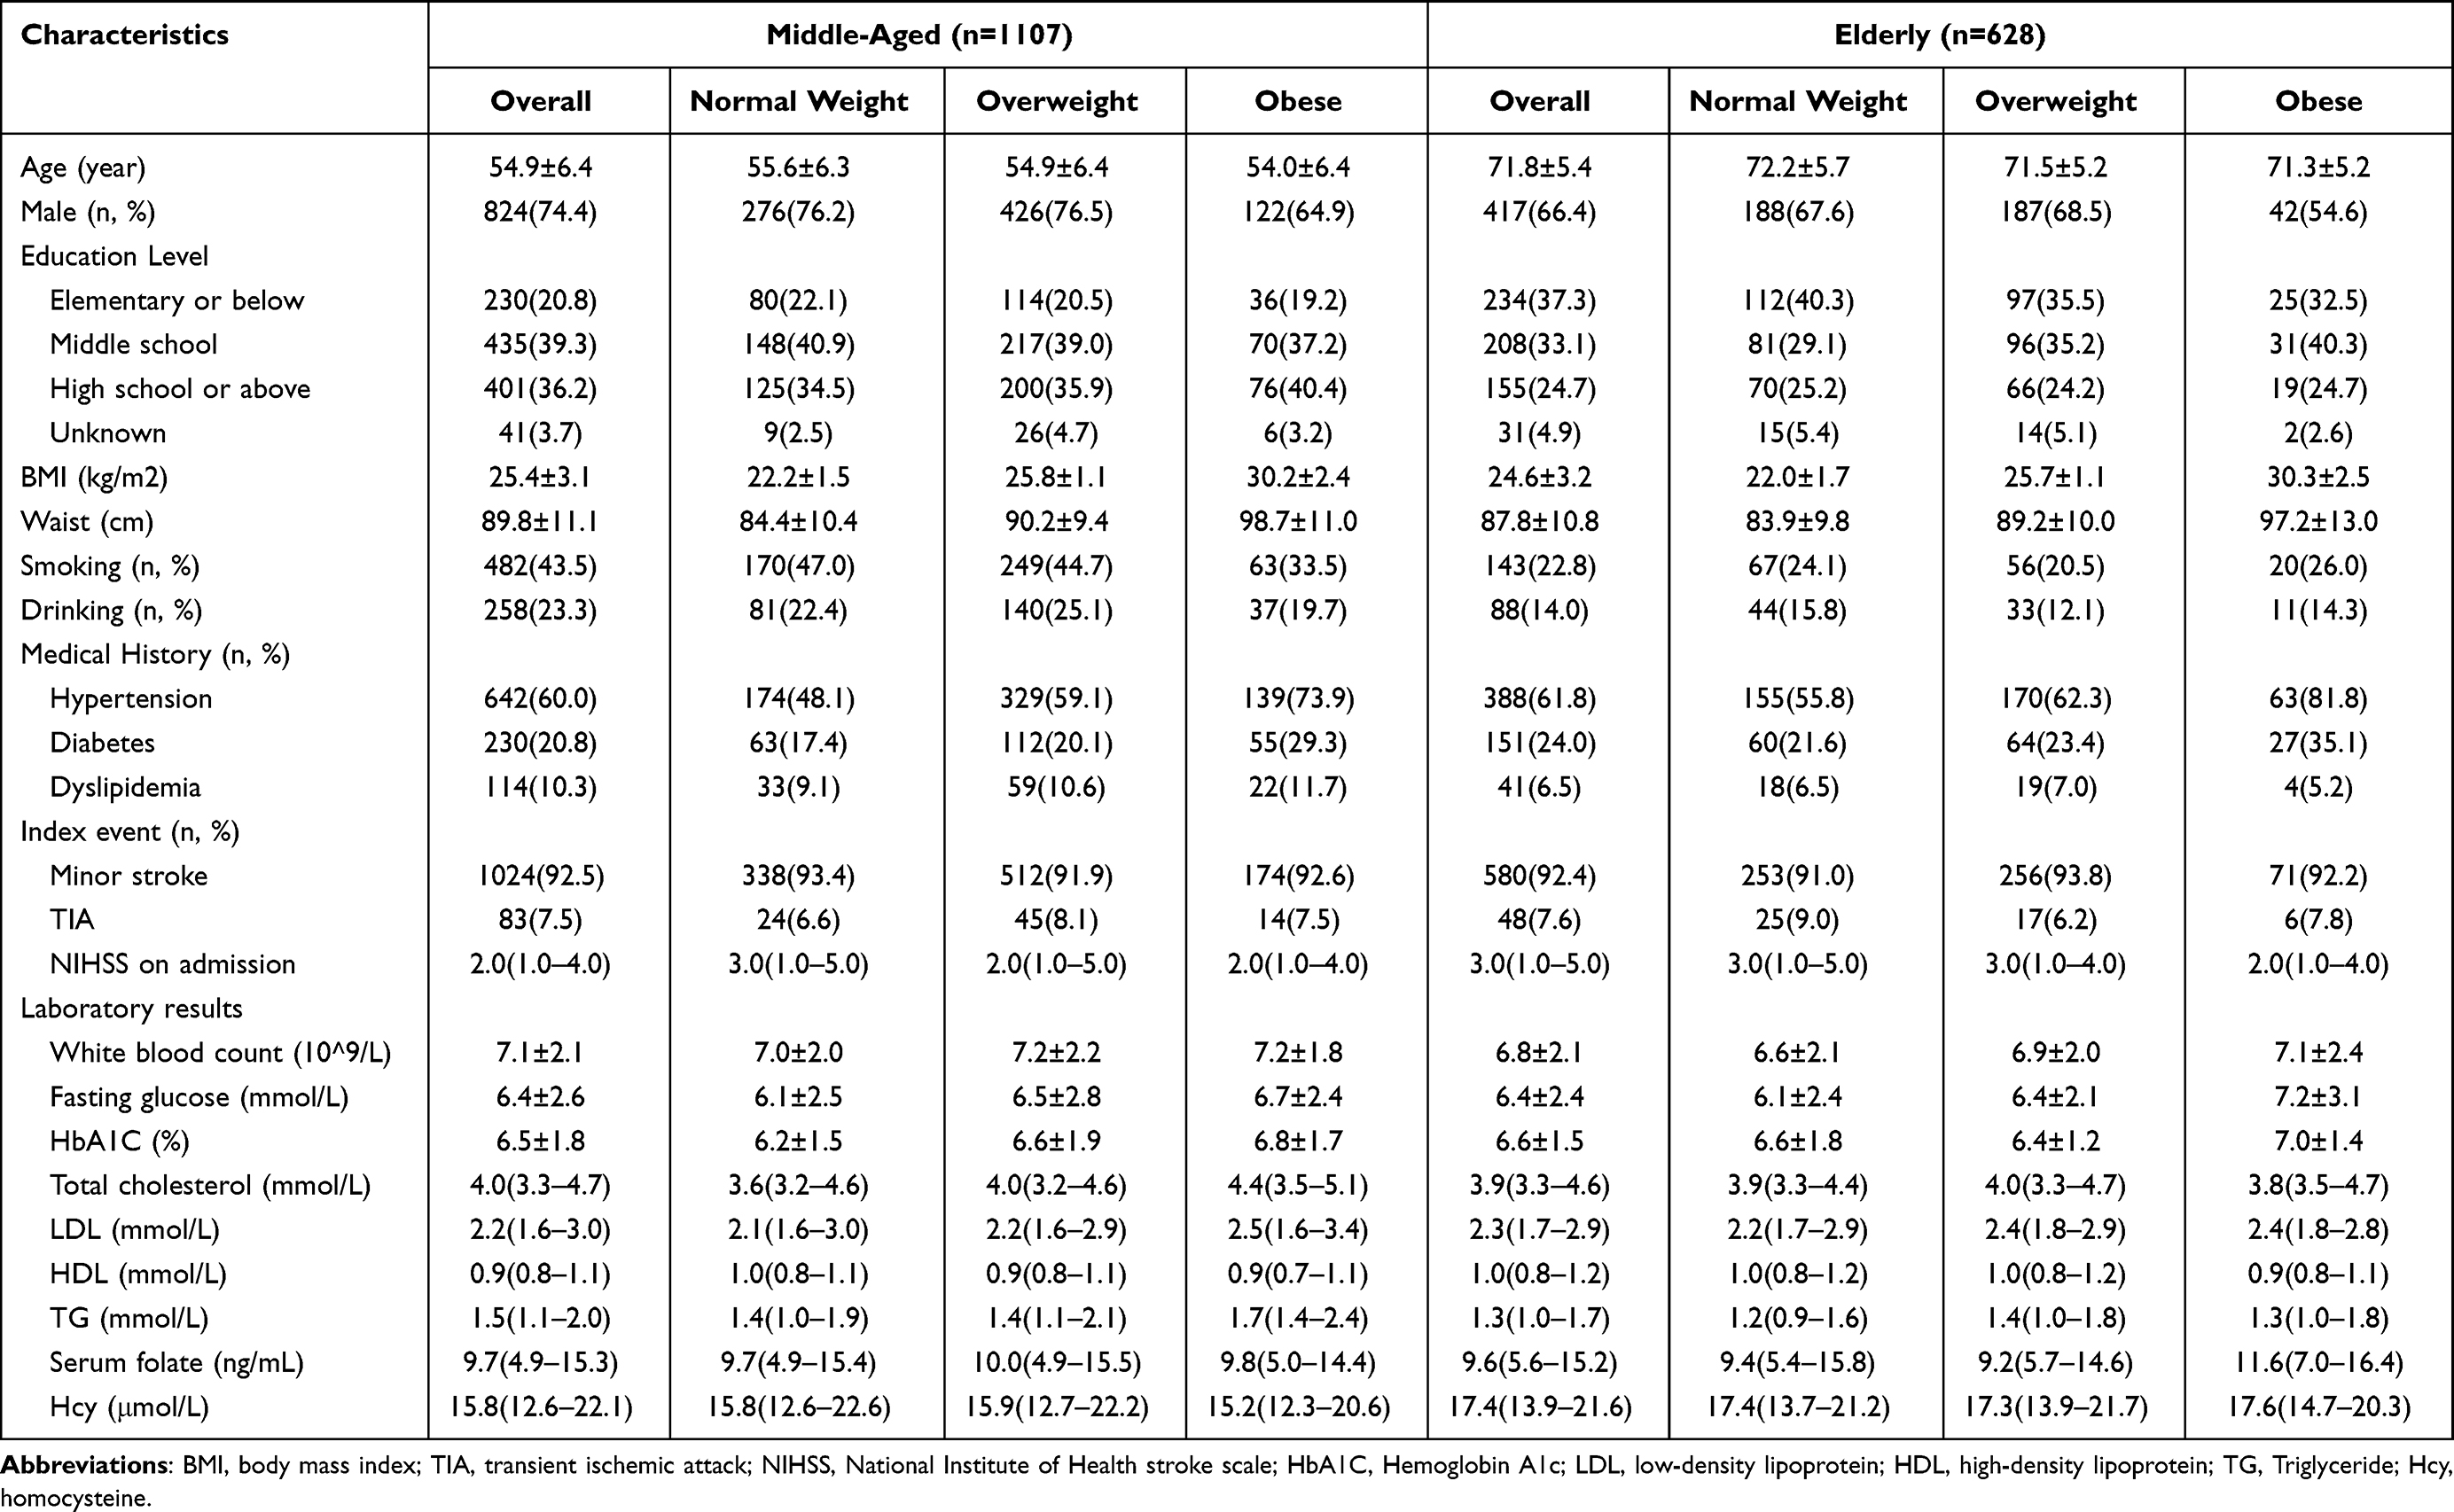 |
Table 1 Baseline Characteristics of Middle-Aged and Elderly Patients with Stroke According to Body Mass Index (BMI) Categories |
Three-Month Incidence of PSCI Among Patients Stratified by Obesity-Related Indices and Age
Figure 2 shows the three-month incidence of PSCI stratified by obesity and age status. Regardless of obesity status, patients in the middle-aged group had a greater incidence of PSCI compared to their elderly counterparts (42.2 versus 56.4%, p < 0.01). According to obesity status defined by BMI, the PSCI incidence showed a significant contrast among patients with normal weight, overweight and obesity in the middle-aged group (41.7 vs 31.9 vs 52.1%, p=0.01), while the relationship was not significant in the elderly group (57.2 vs 57.1 vs 50.7%, p=0.56). According to obesity status defined by WC, central obesity patients had a higher incidence of PSCI in both the middle-aged group (37.6 vs 44.2%, p=0.04) and elderly group (50.8 vs 59.8%, p=0.03).
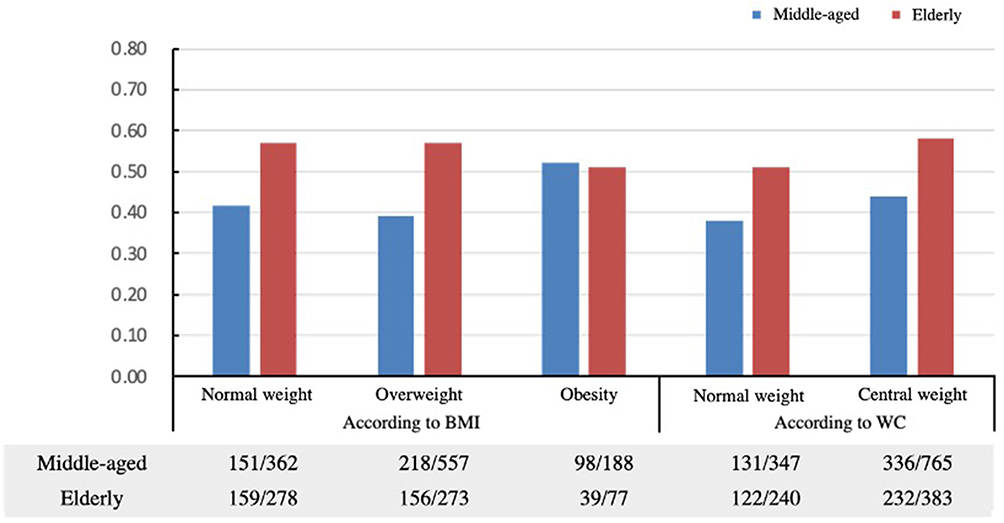 |
Figure 2 Rates of three-month incidence of post-stroke cognitive impairment (PSCI) among middle-aged and elderly patients according to waist and BMI categories. Abbreviations: BMI, body mass index; WC, waist circumference. |
Association of Obesity with Three-Month Incidence of PSCI
Obesity, whether in the form of general or central obesity, was found to be an independent risk factor for the incidence of PSCI. According to BMI, compared with normal weight, the adjusted odds ratios (OR) with 95% confidence interval (CI) were 1.00 (0.80–1.25) in overweight patients and 1.45 (1.06–1.98) in obese patients. According to WC, the adjusted OR with 95% CI of central obesity was 1.54 (1.24–1.91) for cognitive impairment after stroke (Table 2).
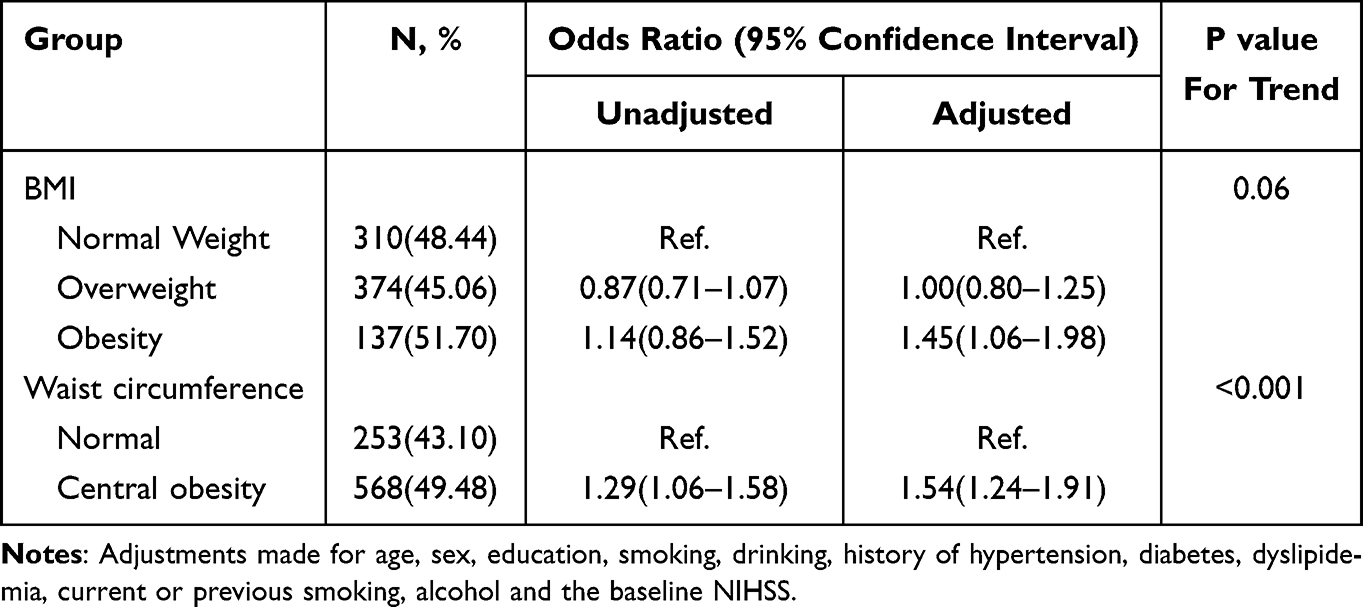 |
Table 2 Association of PSCI with Three-Month Onset by Body Mass Index (BMI) and Waist Circumference (WC) Categories in the Whole Population |
Tables 3 and 4 show the adjusted OR with 95% CI of obesity for PSCI incidence stratified by age. In middle-aged patients, the incidence of PSCI was independently linked with general obesity as measured by BMI: 1.84 (1.24–2.72), whereas this relationship was not significant in elderly patients: 0.89 (0.52–1.54). The incidence of PSCI, however, was not associated with overweight status in either the middle-aged (0.94 (0.71–1.26)) or elderly (1.11 (0.78–1.59)) population. Additionally, the association between central obesity defined by WC and the incidence of PSCI was significant regardless of age. Compared with normal WC patients, the adjusted OR with 95% CI of central obesity with PSCI were 1.57 (1.18–2.09) in middle-aged patients and 1.52 (1.08–2.15) in elderly patients (Table 4).
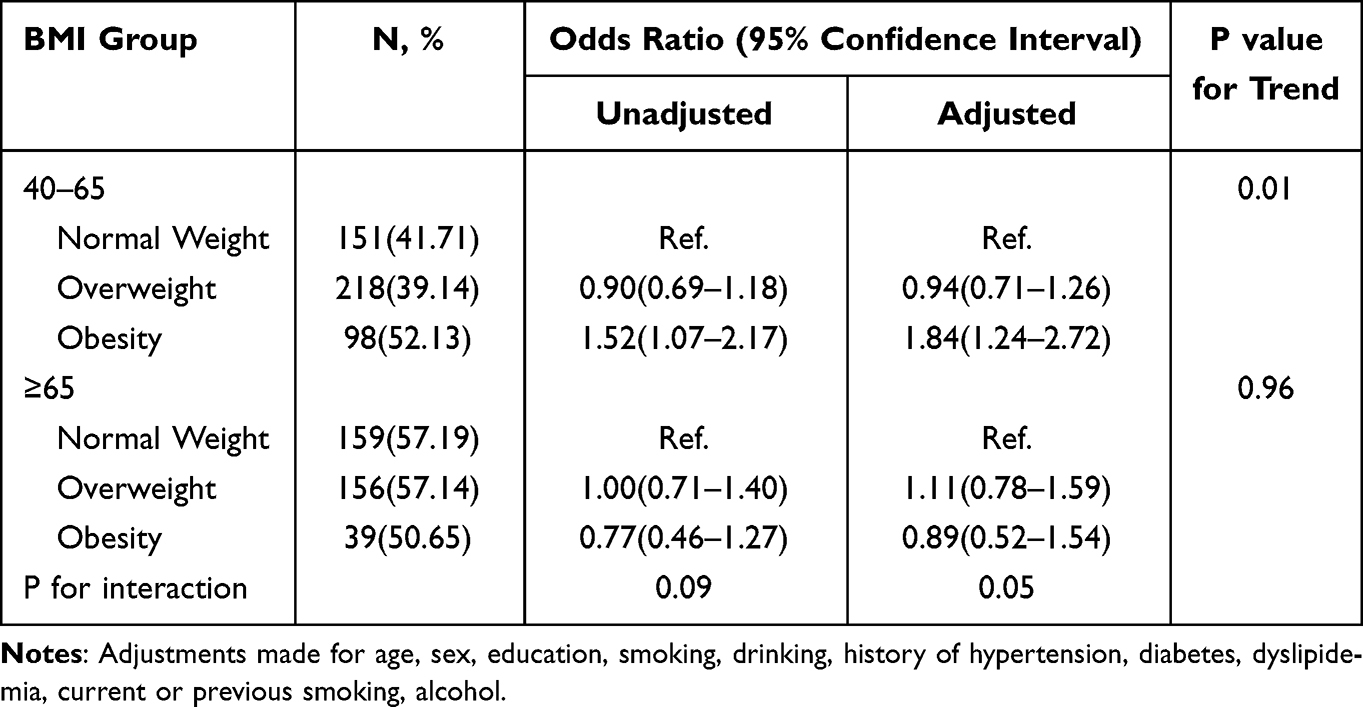 |
Table 3 Stratification Analysis by Age According to Body Mass Index (BMI) |
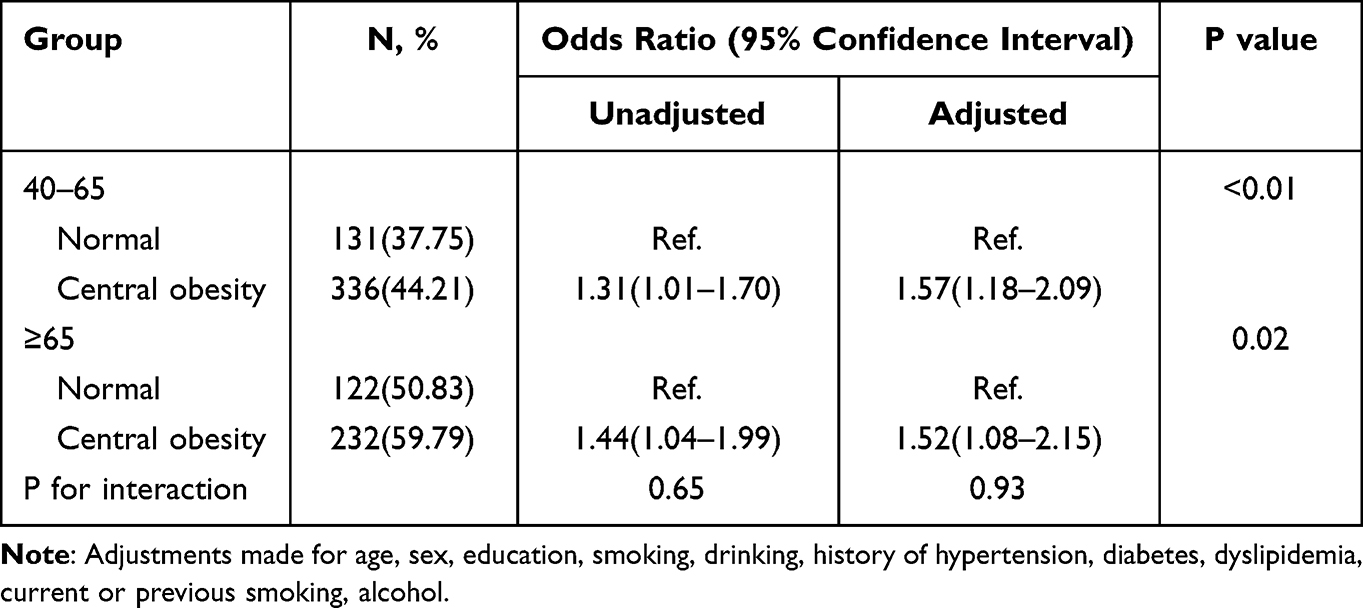 |
Table 4 Stratification Analysis by Age According to Waist Circumference (WC) |
We conducted a logistic regression analysis with restricted cubic spline stratified by age and observed that in middle-aged patients, higher BMI was positively correlated with the incidence of PSCI. However, in elderly patients, this relationship was not statistically significant. Furthermore, a higher WC was linked to a higher incidence of PSCI in both middle-aged and elderly individuals (Figures 3 and 4).
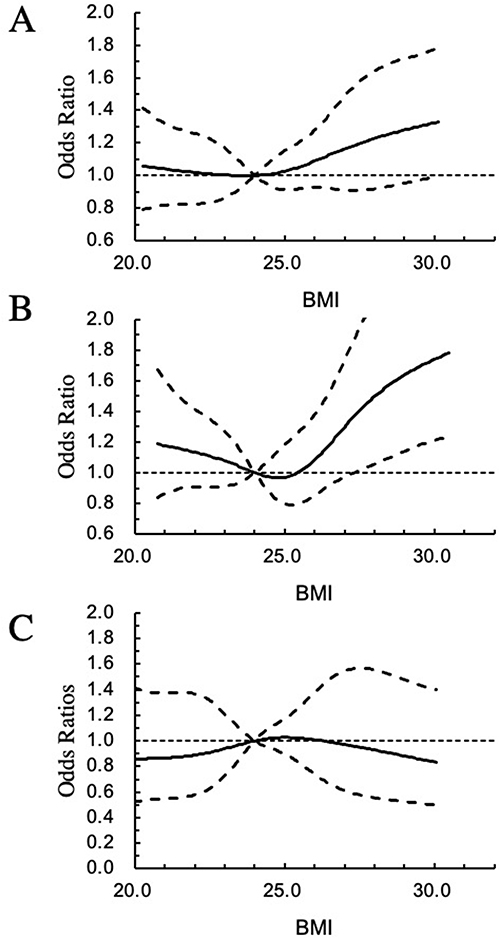 |
Figure 3 Adjusted odds ratio for the incidence of post-stroke cognitive impairment according to body mass index. Abbreviation: BMI: body mass index. Notes: (A) In the whole population. (B) In middle-aged patients. (C) In elderly patients. The solid line indicates the adjusted odds ratio, and the dashed lines indicate the 95% confidence interval bands. Data were fitted using a restricted cubic spline logistic model with 5 knots for BMI. The reference BMI was 24 kg/m2. |
 |
Figure 4 Adjusted odds ratio for the incidence of post-stroke cognitive impairment according to waist circumference. Abbreviation: WC, waist circumference. Notes: (A) In the whole male population. (B). In middle-aged male patients. (C) In elderly male patients. (D) In the whole female population. (E) In middle-aged female patients (F) In elderly female patients. The solid line indicates the adjusted odds ratio, and the dashed lines indicate the 95% confidence interval bands. Data were fitted using a restricted cubic spline logistic model with 5 knots for WC. The reference WC for males was 85 cm, and that for females was 80 cm. |
Discussion
Obesity was linked to an elevated incidence of three-month PSCI in this nationwide cohort analysis of stroke patients. Stratification analysis by age showed that the effect of obesity defined by BMI on PSCI was only significant in middle-aged but not in elderly patients, indicating the obesity paradox on PSCI. However, central obesity as defined by WC was related with an elevated incidence of PSCI among middle-aged and elderly patients. As far as we know, this is the first national-level study to investigate the impact of obesity on PSCI incidence stratified by age.
In the multivariable analysis of our study, regardless of obesity type, patients with obesity showed a 1.5-fold greater incidence of three-month PSCI compared to those without obesity in the general population. Furthermore, we did not observe a significant difference in PSCI incidence between the overweight and normal weight groups, suggesting a possible dose-effect relationship between the severity of obesity and PSCI. Our findings are consistent with previous studies.13,14 Insulin resistance was hypothesized to be one possible mechanism.21,22 Obesity-induced hyperinsulinemia and insulin resistance in the periphery downregulate insulin receptor-mediated transport in the blood brain barrier (BBB), leading in hypoinsulinemia in the central nervous system and disruption of neurophysiological processes.23 Dysfunction in insulin metabolism impairs vasodilation via nitric oxide production in endothelial cells, reduces microvascular perfusion and induces cognitive disorders.24 In addition, a preclinical study investigated that larger amounts of white adipose tissue may aggravate systemic inflammation, harm the integrity of the BBB, and modify β-amyloid metabolism, which promote cognitive decline.25
In stratification analysis by age, patients with obesity defined by BMI showed a greater incidence of PSCI in the middle-aged group but a lower incidence in the elderly group compared to normal weight patients. The multivariable analysis illustrated that only middle-aged patients had an independent relationship between obesity and a higher risk of PSCI, which verified the existence of the obesity paradox on cognitive impairment following stroke. Although obesity is a risk factor for neurocognitive disorders, adipose tissue can secrete several neuroprotective peptide hormones, such as leptin, to enhance hippocampal plasticity.26 An increased level of leptin is usually associated with ageing,27 which provides a plausible mechanism to explain this clinical phenomenon. Another explanation was that the ageing process implies a decrease in lean body mass and an increase in adipose tissue without weight gain, indicating that BMI may underestimate adiposity.28 Thus, the link between obesity and cognitive function may lessen in elderly patients who have more body fat compared to those of normal weight. Nevertheless, the limited number of elderly patients in our stratified study might be a potential reason for its reduced statistical power.
Few studies have investigated the association between central obesity and PSCI in different age groups. Our findings found that central obesity was significantly linked with a higher risk of PSCI in both middle-aged and elderly stroke patients. BMI represents the overall obesity level of an individual’s body, while WC represents visceral obesity. Consistent with previous studies,29,30 we indicated that visceral obesity was more strongly associated with cognitive dysfunction than whole-body or subcutaneous fat. The proposed explanation is that visceral obesity may induce more severe metabolic disturbance than general obesity by triggering a more vigorous inflammatory response and insulin resistance. In addition, WC measurement is less influenced by ageing, suggesting that WC might be a more salient predictor of PSCI than BMI in the elderly population.31
Our study has several limitations. First, a recent meta-analysis has shown ethnic differences in the impact of obesity on cognitive impairment.3 Because our study consisted solely of stroke patients from China, the result might have poor generalizable to other ethnicities. Second, BMI and WC were not measured at follow-up, and the fluctuations in obesity-related indicators might influence the outcome. Third, we were constrained by the available data because this was a post-hoc study of an existing database, and we were unable to control several factors connected to obesity and cognition, such as insulin levels. Furthermore, previous study found that though being underweight may negatively affect global cognition post‐stroke, obesity could induce frontal lobe dysfunctions, specifically phonemic and semantic word fluency.13 However, our study only evaluated global cognitive function, and future research should assess more specific cognitive domains to identify the effect of obesity on specific cognitive deficits after stroke.
Conclusion
This study revealed that the effect of obesity on PSCI may differ by age. General obesity was related with an increased risk of PSCI in middle-aged but not in elderly patients, while the association between central obesity and the incidence of PSCI was significant in any age group, suggesting that the obesity paradox exists only when obesity was defined by BMI. This study highlighted the importance of obesity management in preventing cognitive impairment after stroke of different ages and identified that WC might be a stronger predictor of PSCI than BMI in the elderly population. However, overinterpretation of these results should be avoided.
Acknowledgments
We express our gratitude to the participating centers and individuals in the ICONS study. Additionally, we extend our appreciation to Yongjun Wang and Jiong Shi for their scholarly advice. This research was funded by China’s National Key R&D Program (2018YFC2002302), Chinese Academy of Medical Sciences Innovation Fund for Medical Sciences (2019-I2M-5-029), Capital’s Funds for Health Improvement and Research (2020-1-2041) and the National Natural Science Foundation of China (81972144).
Disclosure
The authors report no conflicts of interest in this work.
References
1. Pan Y, Li H, Wardlaw J, Wang YJB. A new dawn of preventing dementia by preventing cerebrovascular diseases. BMJ. 2020;371:m3692. doi:10.1136/bmj.m3692
2. Wang Y, Li Z, Gu H, et al. China stroke statistics 2019: a report from the national center for healthcare quality management in neurological diseases, China national clinical research center for neurological diseases, the Chinese stroke association, national center for chronic and non-communicable disease control and prevention, Chinese center for disease control and prevention and institute for global neuroscience and stroke collaborations. Stroke Vasc Neurol. 2020;5:211–239. doi:10.1136/svn-2020-000457
3. Tang X, Zhao W, Lu M, et al. Relationship of central obesity with the incidence of cognitive impairment and dementia from cohort studies involving 5,060,687 participants. Neurosci Biobehav Rev. 2021;130:301–313. doi:10.1016/j.neubiorev.2021.08.028
4. Morys F, Dadar M. Association between mid-life obesity, its metabolic consequences, cerebrovascular disease and cognitive decline. J Clin Endocrinol Metab. 2021;106(10):e4260–74.
5. Beydoun M, Beydoun H, Wang YJ. Obesity and central obesity as risk factors for incident dementia and its subtypes: a systematic review and meta-analysis. Obes Rev. 2008;9:204–218. doi:10.1111/j.1467-789X.2008.00473.x
6. Qu Y, H-Y H, Y-N O, et al. Association of body mass index with risk of cognitive impairment and dementia: a systematic review and meta-analysis of prospective studies. Neurosci Biobehav Rev. 2020;115:189–198. doi:10.1016/j.neubiorev.2020.05.012
7. Singh-Manoux A, Dugravot A, Shipley M, et al. Obesity trajectories and risk of dementia: 28 years of follow-up in the Whitehall II study. Alzheimers Dement. 2018;14:178–186. doi:10.1016/j.jalz.2017.06.2637
8. Gustafson D, Bäckman K, Waern M, et al. Adiposity indicators and dementia over 32 years in Sweden. Neurology. 2009;73:1559–1566. doi:10.1212/WNL.0b013e3181c0d4b6
9. Fitzpatrick A, Kuller L, Lopez O, et al. Midlife and late-life obesity and the risk of dementia: cardiovascular health study. Arch Neurol. 2009;66:336–342. doi:10.1001/archneurol.2008.582
10. Suemoto C, Gilsanz P, Mayeda E, Glymour MJ. Body mass index and cognitive function: the potential for reverse causation. Int J Obes. 2015;39:1383–1389. doi:10.1038/ijo.2015.83
11. Stewart R, Masaki K, Xue Q, et al. A 32-year prospective study of change in body weight and incident dementia: the Honolulu-asia aging study. Arch Neurol. 2005;62:55–60. doi:10.1001/archneur.62.1.55
12. Elias M, Elias P, Sullivan L, Wolf P, D’Agostino R. Lower cognitive function in the presence of obesity and hypertension: the Framingham heart study. Int J Obes Relat Metab Disord. 2003;27:260–268. doi:10.1038/sj.ijo.802225
13. Lee M, Oh M, Jung S, et al. Differential effects of body mass index on domain-specific cognitive outcomes after stroke. Sci Rep. 2021;11:14168. doi:10.1038/s41598-021-93714-7
14. Zhang Y, Zhang Z, Yang B, et al. Incidence and risk factors of cognitive impairment 3 months after first-ever stroke: a cross-sectional study of 5 geographic areas of China. J Huazhong Univ Sci Technol. 2012;32:906–911.
15. Zeng Q, Li N, Pan X, Chen L, Pan A. Clinical management and treatment of obesity in China. Lancet Diabetes Endocrinol. 2021;9:393–405.
16. Wang Y, Jing J, Meng X, et al. The third China National Stroke Registry (CNSR-III) for patients with acute ischaemic stroke or transient ischaemic attack: design, rationale and baseline patient characteristics. Stroke Vasc Neurol. 2019;4:158–164. doi:10.1136/svn-2019-000242
17. Wang Y, Liao X, Wang C, et al. Impairment of cognition and sleep after acute ischaemic stroke or transient ischaemic attack in Chinese patients: design, rationale and baseline patient characteristics of a nationwide multicentre prospective registry. Stroke Vasc Neurol. 2020;6:1.
18. Bao Y, Lu J, Wang C, et al. Optimal waist circumference cutoffs for abdominal obesity in Chinese. Atherosclerosis. 2008;201:378–384. doi:10.1016/j.atherosclerosis.2008.03.001
19. Nasreddine Z, Phillips N, Bédirian V, et al. The Montreal Cognitive Assessment, MoCA: a brief screening tool for mild cognitive impairment. J Am Geriatr Soc. 2005;53:695–699. doi:10.1111/j.1532-5415.2005.53221.x
20. Liao X, Zuo L, Pan Y, et al. Screening for cognitive impairment with the Montreal cognitive assessment at six months after stroke and transient ischemic attack. Neurol Res. 2021;43:15–21.
21. Curb J, Rodriguez B, Abbott R, et al. Longitudinal association of vascular and Alzheimer’s dementias, diabetes, and glucose tolerance. Neurology. 1999;52:971–975. doi:10.1212/WNL.52.5.971
22. Tanaka H, Gourley D, Dekhtyar M, Haley A. Cognition, brain structure, and brain function in individuals with obesity and related disorders. Curr Obes Rep. 2020;9:544–549. doi:10.1007/s13679-020-00412-y
23. Craft S, Watson G. Insulin and neurodegenerative disease: shared and specific mechanisms. Lancet Neurol. 2004;3:169–178. doi:10.1016/S1474-4422(04)00681-7
24. Fu Z, Wu J, Nesil T, Li M, Aylor K, Liu Z. Long-term high-fat diet induces hippocampal microvascular insulin resistance and cognitive dysfunction. Am J Physiol Endocrinol Metab. 2017;312:E89–E97. doi:10.1152/ajpendo.00297.2016
25. Nguyen J, Killcross A, Jenkins T. Obesity and cognitive decline: role of inflammation and vascular changes. Front Neurosci. 2014;8:375. doi:10.3389/fnins.2014.00375
26. Harvey J, Solovyova N, Irving A. Leptin and its role in hippocampal synaptic plasticity. Prog Lipid Res. 2006;45:369–378. doi:10.1016/j.plipres.2006.03.001
27. Roszkowska-Gancarz M, Jonas M, Owczarz M, et al. Age-related changes of leptin and leptin receptor variants in healthy elderly and long-lived adults. Geriatr Gerontol Int. 2015;15:365–371. doi:10.1111/ggi.12267
28. Liao Q, Zheng Z, Xiu S, Chan P. Waist circumference is a better predictor of risk for frailty than BMI in the community-dwelling elderly in Beijing. Aging Clin Exp Res. 2018;30:1319–1325. doi:10.1007/s40520-018-0933-x
29. Ambikairajah A, Tabatabaei-Jafari H, Walsh E, Hornberger M, Cherbuin N. Longitudinal changes in fat mass and the hippocampus. Obesity. 2020;28:1263–1269. doi:10.1002/oby.22819
30. Kerwin D, Gaussoin S, Chlebowski R, et al. Interaction between body mass index and central adiposity and risk of incident cognitive impairment and dementia: results from the women’s health initiative memory study. J Am Geriatr Soc. 2011;59:107–112. doi:10.1111/j.1532-5415.2010.03219.x
31. Monda V, La Marra M, Perrella R, et al. Obesity and brain illness: from cognitive and psychological evidences to obesity paradox. Diabetes Metab Syndr Obes. 2017;10:473–479.
 © 2023 The Author(s). This work is published and licensed by Dove Medical Press Limited. The full terms of this license are available at https://www.dovepress.com/terms.php and incorporate the Creative Commons Attribution - Non Commercial (unported, v3.0) License.
By accessing the work you hereby accept the Terms. Non-commercial uses of the work are permitted without any further permission from Dove Medical Press Limited, provided the work is properly attributed. For permission for commercial use of this work, please see paragraphs 4.2 and 5 of our Terms.
© 2023 The Author(s). This work is published and licensed by Dove Medical Press Limited. The full terms of this license are available at https://www.dovepress.com/terms.php and incorporate the Creative Commons Attribution - Non Commercial (unported, v3.0) License.
By accessing the work you hereby accept the Terms. Non-commercial uses of the work are permitted without any further permission from Dove Medical Press Limited, provided the work is properly attributed. For permission for commercial use of this work, please see paragraphs 4.2 and 5 of our Terms.