")
Back to Journals » OncoTargets and Therapy » Volume 13
The Long Noncoding RNA ZFAS1 Potentiates the Development of Hepatocellular Carcinoma via the microRNA-624/MDK/ERK/JNK/P38 Signaling Pathway
Authors Duan R, Li C, Wang F, Han F, Zhu L
Received 16 January 2020
Accepted for publication 22 April 2020
Published 19 May 2020 Volume 2020:13 Pages 4431—4444
DOI https://doi.org/10.2147/OTT.S246278
Checked for plagiarism Yes
Review by Single anonymous peer review
Peer reviewer comments 2
Editor who approved publication: Dr Tohru Yamada
Rui Duan,1,* Caiyan Li,2,* Fan Wang,1,* Fei Han,3 Ling Zhu1
1Department of Hepatological Surgery, The First People’s Hospital of Jingmen, Jingmen, Hubei 448000, People’s Republic of China; 2Department of Clinical Laboratory, The Second People’s Hospital of Jingmen, Jingmen 448000, Hubei, People’s Republic of China; 3Department of Oncology, Affiliated Hospital of Chongqing Medical University, Chongqing 400000, People’s Republic of China
*These authors contributed equally to this work
Correspondence: Ling Zhu Email [email protected]
Background: A long noncoding RNA (lncRNA), ZNFX1 antisense RNA 1 (ZFAS1), was increased in multiple cancers, including hepatocellular carcinoma (HCC), resulting in malignancy development and progression. However, the mechanisms involving the interaction between ZFAS1 and microRNA-624 (miRNA-624) remain largely unknown. Therefore, the goal of this study was to probe the functional role of ZFAS1 in the development of HCC and its underlying mechanism.
Methods: Firstly, differentially expressed lncRNAs in HCC tissues were screened out by microarray. Subsequently, the prognostic effect of ZFAS1 patients with HCC was analyzed by the Kaplan–Meier analysis and The Cancer Genome Atlas database. ZFAS1 regulation on miRNA-624 was determined after si-ZFAS1 and/or miRNA-624 inhibitor were transfected into HepG2 and SMMC7721 cell lines. Finally, the effects of ZFAS1 on the growth and metastasis of HCC were observed by in vivo tumorigenesis and metastasis tests.
Results: ZFAS1 was overexpressed in HCC tissues and cells and indicated worse prognosis and shorter survival in patients with HCC. Silencing of ZFAS1 inhibited the malignancy of HCC cells, but miR-624 inhibitor could partially reverse the repressive role of si-ZFAS1. Moreover, ZFAS1 induced the extracellular-regulated protein kinases/c-Jun N-terminal kinase (ERK/JNK)/P38 pathway by binding to midkine (MDK) through miR-624, thus promoting the occurrence of HCC.
Conclusion: Collectively, ZFAS1 depletion inhibited the occurrence of HCC by downregulating the MDK/ERK/JNK/P38 pathway through restoring miR-624 expression. Inhibition of ZFAS1 may act as an innovative target to suppress occurrence in HCC.
Keywords: long noncoding RNA ZFAS1, hepatocellular carcinoma, microRNA-624, MDK, ERK/JNK/P38 signaling pathway
Introduction
Hepatocellular carcinoma (HCC), accounting for over 90% of all primary liver cancers, ranks the sixth most prevalent cancer in a world range.1 The high HCC rates in parts of Asia majorly reflect the enhanced prevalence of chronic hepatitis B virus infection, with more than 8% of the population in this region chronically infected with the virus.2 For all stages combined, liver cancer is among the cancer with the lowest survival rate (18%), highlighting the urgency to clarify novel mechanisms culminating in liver malignancy.3
Long noncoding RNAs (lncRNAs) represent a group of non-protein coding RNAs that were regarded as genomic “junk” and “noise” at the beginning stage.4 LncRNAs have been demonstrated to function as potent oncogenes or tumor suppressors and to play crucial regulatory roles in tumorigenesis as well as tumor progression.5 For instance, ZNFX1 antisense RNA 1 (ZFAS1), located on chromosome 20q13.13, has been implicated in glioma malignant progression.6 Furthermore, as an oncogene in HCC development, ZFAS1 interacted with microRNA (miRNA)-139.7 Interestingly, lncRNAs have the potency to act as miRNAs “sponges”, displaying as a competing endogenous RNA (ceRNA) to mediate the synthesis of functional proteins by adsorbing miRNAs in cytoplasm.8 miR-624 is a commonly reduced miRNA in recurrent prostate cancer samples versus non-recurrent prostate cancer samples.9 Besides, midkine (MDK), a heparin-binding growth factor initially revealed to be an overexpressed gene in the process of mouse embryogenesis, has been documented in multiple physiological events, including development, reproduction, as well as repair, thereby playing vital roles in the pathogenesis of malignancies and other disorders.10 Importantly, in patients newly diagnosed with HCC, MDK expresses at a remarkable higher level than that of cirrhosis or normal controls.11 While in the present study, MDK was recognized to be a putative target of miR-624 and was conversely mediated by it. Similarly, miR-9 secreted from nasopharyngeal carcinoma cells-derived exosomes targeted MDK and regulated the PDK/AKT pathway to repress endothelial tube formation and migration.12 The upregulation of MDK and the mediation of extracellular-regulated protein kinases/c-Jun N-terminal kinase (ERK/JNK)/p38 signaling pathway was indispensable in neuroprotective effect of electroacupuncture exerted against neuronal apoptosis,13 highlighting the linking between MDK and the ERK/JNK/p38 signaling pathway. However, the miR-624 regulation of MDK and the ERK/JNK/p38 signaling pathway during HCC development remains an enigma. The current study was performed to verify the expression of lncRNA ZFAS1, miR-624, and MDK in HCC cells and in the established mouse model and to observe the effects of si-ZFAS1 on miR-624 and MDK expression and HCC progression.
Materials and Methods
Ethics Statement
This study was permitted by the Institutional Ethics Review Board of the First People’s Hospital of Jingmen and was carried out in accordance with the Declaration of Helsinki (2013) of the World Medical Association. Written informed consent was attained from each patient enrolled. The protocol was also approved by the Institutional Animal Care and Use Committee of the First People’s Hospital of Jingmen and performed in strict accordance with the recommendations in the guide for the care and use of laboratory animals of the National Institutes of Health. Every effort was made to minimize animal suffering.
Tissue Specimens
Ninety-four HCC patients diagnosed and treated in the First People’s Hospital of Jingmen from July 2013 to January 2014 were selected to collect HCC tissues and adjacent normal tissues (at minimum 5 cm from HCC tissues). There were 57 men and 37 women, with an average age of 64.9 ± 7.3 years. All enrolled patients were followed-up for a period of 5 years at an interval of 3 months. No patients had received radiotherapy or chemotherapy prior to the surgery. All the cases with complete clinical data were diagnosed with HCC based on histopathological evaluation. Sufferers combined with other chronic systemic diseases or malignant tumors were excluded.
Microarray Analysis
In short, total RNA was isolated from cancer and paracancerous tissues from six patients with HCC. The total RNA (0.5 μg) was applied to synthesize cDNA using a GeneChip 3ʹInvitro Transcription Express Kit (902789, Thermo Fisher Scientific Inc., Waltham, MA, USA). The cDNA was then fragmented and hybridized with the human lncRNA expression array V3.0 (AS-LNC-H-V4.0, Arraystar Inc., Rockville, MD, USA). After hybridization, the microarray was washed and scanned with GeneChipTM Scanner 3000 7G system (000213, Thermo Fisher Scientific).
RNA Isolation and Quantification
RNAiso Plus (TAKARA, Otsu, Shiga, Japan)14 and Trizol LS Reagent (TAKARA, Otsu, Shiga, Japan) kits were used to extract total RNA from HCC tissues and cells, respectively. The reliability of the obtained RNA was verified by the formaldehyde denaturing agarose gel electrophoresis. Then, we conducted reverse transcription-quantitative polymerase chain reaction (RT-qPCR) in strict accordance with the protocols of the PrimeScript TM RT kit (TAKARA, Otsu, Shiga, Japan).15 The mRNA expression pattern was quantified using SYBR Premix ExTaq (Takara, Otsu, Shiga, Japan) by real-time quantitative PCR.16 U6 and glyceraldehyde-3-phosphate dehydrogenase (GAPDH) were used as internal controls. Primer sequences used are presented in Supplementary Table S1.
Cell Culture and Treatment
HCC cell lines SMMC-7721, Bel-7402, MHCC97, and HepG2 as well as human normal hepatocytes L02 were from the Cell Bank of Shanghai Institute of Cells, Chinese Academy of Science (Shanghai, China). Then, the cells were seeded at the density of 1 × 10⁵ cells/cm2 in petri dishes and maintained in Dulbecco’s modified Eagle’s medium or Roswell Park Memorial Institute (RPMI)-1640 medium (both from Gibco, Grand Island, NY, USA) containing 10% fetal bovine serum for 48 h at 37°C with 5% CO2. When cell lines were covered with 80–90% microscopic view, the cells were detached with 0.25% trypsin (Gibco, Carlsbad, CA, USA) and then passaged.
Western Blot Analysis
Western blot analysis was carried out with reference to the previous literature report.17 The antibodies used in this work were JNK (1:5000, ab110724), pJNK (1:5000, ab47337); ERK 1/2 (1:3000, ab176641); pERK 1/2 (1:5000, ab223570), MDK (1:2000, ab52637), E-cadherin (1:5000, ab76055), Vimentin (1:5000, ab92547), GAPDH (1:10,000, ab181602), and horseradish peroxidase-linked goat anti-rabbit secondary antibody against IgG (1:50,000, ab6721). All antibodies used for immunoblotting were purchased from Abcam (Cambridge, UK).
Plasmid Construction and Stable Transfection
Short interfering RNAs (siRNAs) targeting ZFAS1 were designed to construct ZFAS1-depleted HCC cells, or miR-624 inhibitor was designed to construct miR-624-depleted HCC cells, respectively. Delivery of corresponding scramble siRNAs or inhibitor control (Mock) to HCC cells was served as negative controls. All plasmids were from GenePharma (Shanghai, China). Transient transfections were performed in HepG2 and SMMC7721 cells with the help of Lipofectamine 2000 (Invitrogen) as per the manufacturer’s protocols for 48 h.
Transwell Assays
Matrigel (BD Biosciences, Franklin Lakes, NJ, USA) was placed at the apical chamber for a 30-min culture. RPMI-1640 medium (30 μL) was added to the apical chamber and cultured with CO2. The cells were detached, centrifuged, resuspended with serum-free medium, and diluted into cell suspension (5 × 10⁵ cells/mL). Following this, we added 500 μL RPMI-1640 medium with 10% FBS in the basolateral chamber. Subsequently, 200 μL cell suspension was seeded in the apical chamber. After a 48 h-culture, we stained the cells within the membrane with crystal violet, and the cells that failed to invade were removed by cotton swabs and counted. The ability of cell migration was detected by Transwell assay as well with the addition of Matrigel in the apical chamber. The other operations were consistent with the Transwell invasion assay, and the Transwell plate was removed for staining after incubation for 24 h.
5ʹ-Ethynyl-2ʹ-Deoxyuridine (EdU) Assay
An EdU assay kit (RiboBio, Guangzhou, Guangdong, China) was utilized to test DNA synthesis and cell proliferation.18 Under a fluorescence microscope (FSX100, Olympus Optical Co., Ltd., Tokyo, Japan), five field-of-view were taken. The blue fluorescence was representative of total cells, and red fluorescence was reflective of the proliferating cells incorporated by EdU. The proportion of EdU positive cells to total cells was calculated.
Flow Cytometric Analysis
A fluorescein isothiocyanate (FITC)-Annexin V Apoptosis Detection Kit (KeyGen, Nanjing, Jiangsu, China) was used to carry out an apoptosis assay following the instructions. The cell apoptosis was evaluated by a flow cytometer (FACScan®; BD Biosciences, San Jose, CA, USA) equipped with CellQuest software (BD Biosciences, San Jose, CA, USA) in combination with propidium iodide (PI). Cells were divided into apoptotic, necrotic, or viable cells.
Immunofluorescence
After PBS washes, the cells were fixed with 4% formaldehyde at 4°C for 15 min and treated for 20 min with 0.2% Triton X-100. The cells were then probed with specific primary antibodies against Vimentin (1:1000; ab197234; Abcam Inc., Cambridge, UK) and E-cadherin (1:100; ab48394; Abcam) at 4°C overnight. The FITC-labeled goat anti-rabbit secondary antibody (1:5000, ab150088, Abcam) and 4ʹ,6-Diamidino-2-Phenylindole (DAPI) were successively added. After the counter-staining, we observed the cells under a fluorescence microscope (DM 3000, Leica, Bannockburn, IL, USA).
Terminal Deoxynucleotidyl Transferase dUTP Nick End Labeling (TUNEL) Staining
HCC cell apoptosis was detected by TUNEL staining as previously reported.19
Subcellular Localization
Firstly, the prediction website Lncatlas was used to predict the subcellular localization of ZFAS1 in the cytoplasm. ZFAS1 was then confirmed to be in the cytoplasm by fluorescence in situ hybridization (FISH) with the help of the RiboTM lncRNA FISH Probe Mix (Green, Ribo Biotech, Guangzhou, Guangdong, China) kit in strict accordance with the instructions. Then, the distribution of ZFAS1 in cells was further verified by subcellular fractionation location by a PARISTM Kit (Life Technologies, Inc., Gaithersburg, MD, USA) strictly following the instructions.
Dual-Luciferase Assay
The binding sequences of miR-624 on ZFAS1 or MDK 3ʹuntranslated region (UTR) were projected by an online prediction software StarBase. ZFAS1 or MDK wild-type (WT) and 3ʹUTR binding sequence mutant (MT), were generated by Shanghai Sangon Biological Engineering Technology & Services Co., Ltd. (Shanghai, China) and then inserted into pMIR-REPORTTM (Thermo Fisher Scientific Inc., Waltham, MA, USA) luciferase vectors.20 The WT plasmid, MT plasmid and miR-518a mimic and miRNA negative control were co-transfected into 293T cells by a Lipofectamine 3000 transfection kit (Invitrogen Inc., Carlsbad, CA, USA). After 24 h, the cells were lysed, and the firefly luciferase activity was measured by a Dual-Luciferase Reporter Assay System (Promega Corporation, Madison, WI, USA).21 The data were normalized to Renilla luciferase activity (internal control) and presented in arbitrary units.
Tumor Formation Assay
Twenty-four BALB/c nude mice (specific-pathogen-free grade, 4–6 weeks old, 20 ± 2 g in weight; from Beijing Vital River Laboratory Animal Technology Co., Ltd., Beijing, China, SCXK (Beijing) 2015–0001) were randomized into 4 groups (6 mice in each group). All mice were subjected to a subcutaneous injection of 4 × 10⁶ HepG2 and SMMC7721 cells suspended in 0.2 mL saline. After 7 days of injection, tumor volumes were assessed as m12 × m2 × 0.5236, in which m1 signifies the shortest axis and m2 the longest axis.22 After 28 d, the mice were euthanized after the injection of pelltamarbitum natricum at 120 mg/kg, and the tumor was collected for histological examination.
Immunohistochemical Analysis
The HCC tissues were embedded in paraffin, dewaxed, and hydrated before the sections were treated with 50 μL primary antibody, rabbit anti-human antibodies against KI67 (1:500, ab15580, Abcam), MDK (1:50, ab52637), and pERK (1:50, ab192591) at 4°C overnight. Afterwards, the sections were re-probed with the secondary antibody for 15 min at 37°C, incubated with horseradish peroxidase-conjugated streptomyces ovalbumin solution (40 μL) at 37°C for 15 min, developed with 3,3-diaminobenzidine solution and stained with hematoxylin. The slides were finally observed under 5 fields of a microscope. The cells presenting brown or brownish yellow in the nucleus were deemed as KI67 positive cells.
In vivo Metastasis Assay
We injected 4 × 10⁶ HepG2 cells through the tail vein into the BALB/c nude mice, which were euthanized with excessive injection of pelltobarbitalum natricum after 45 d. The lungs and livers were collected, and the formation of metastasis was observed by hematoxylin and eosin (HE) staining described as previously reported.23
Statistics
All statistical analyses were carried out using SPSS 21.0 software (SPSS, Chicago, IL, USA). The Kolmogorov-Smirnov was used to test whether the data were normally distributed which were displayed as mean ± standard deviation (SD). Two-tailed paired t test was applied for comparisons between two independent groups. Comparisons among multiple independent groups were conducted using one-way or two-way analysis of variance (ANOVA) and a Tukey’s multiple comparisons test. Survival curves were plotted by the Kaplan–Meier analysis and compared by the Log-rank test. The enumeration data were analyzed by Fisher’s exact test. Differences with p-values less than 0.05 were statistically significant.
Results
ZFAS1 Is Upregulated in HCC Tissues and Correlates with Poor Prognosis
We first compared the differentially expressed lncRNAs from the cancer and adjacent tissues of the six patients with HCC. The differential expression of lncRNAs was analyzed by microarrays. After homogenizing the original data, we screened a total of 133 differentially expressed lncRNAs with the Limma Rstudio package under the conditions of log FoldChange > 2.0 and p value < 0.05. Of these, 61 lncRNAs were downregulated, while 72 lncRNAs were upregulated. Figure 1A is the heatmap showing some differentially expressed lncRNAs, among which the ZFAS1 was the most variable one. We then used RT-qPCR to measure the ZFAS1 expression in the cancer and adjacent tissues from 94 HCC patients and identified that ZFAS1 was highly expressed in the HCC cancer tissues (Figure 1B). The subsequent validation of overexpression of ZFAS1 in The Cancer Genome Atlas (TCGA) database was consistent with the RT-qPCR measurement (Figure 1C).
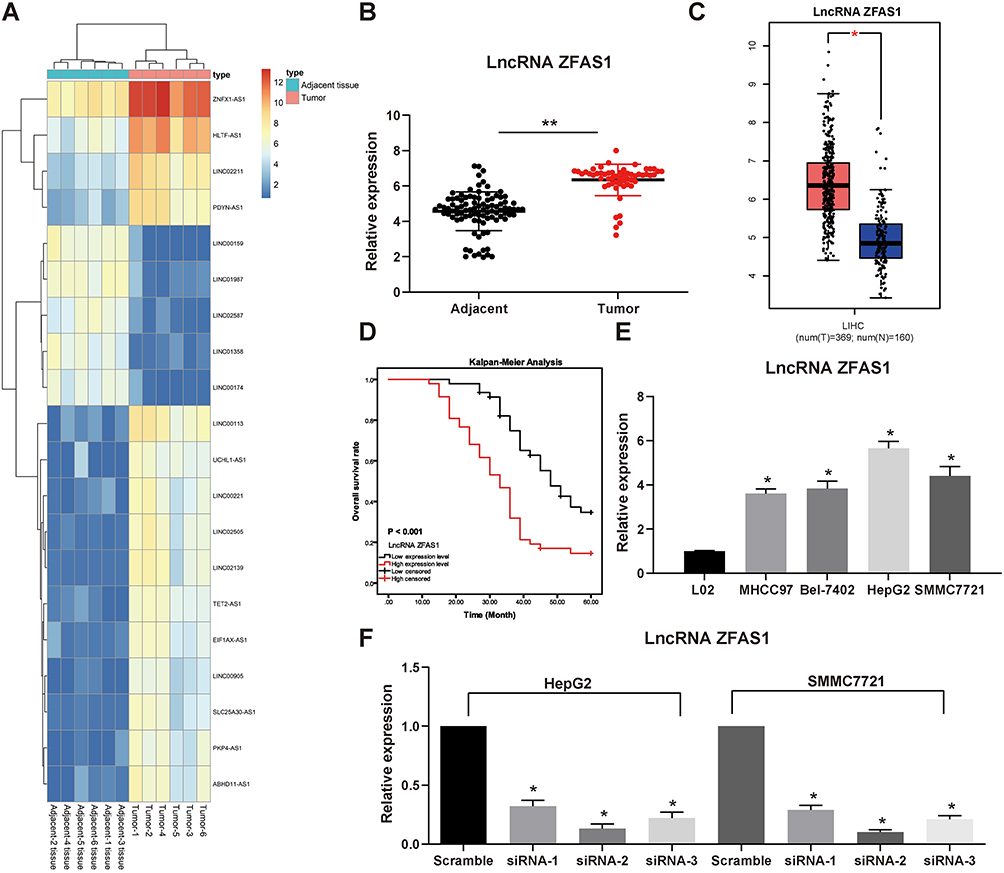 |
Figure 1 ZFAS1 is upregulated in HCC patients and associated with poor prognosis. (A) The normal tissues and tumor tissues were analyzed by Arraystar Human LncRNA microarray V2.0 (Agilent_033010 Probe Name version). Heatmap represents for 30 ectopic expressed lncRNAs. (B) The ZFAS1 expression between normal tissues and tumor tissues measured by RT-qPCR. (C) ZFAS1 expression in normal tissues (n = 160) and tumor tissues (n = 369) validated with TCGA database by GEPIA (http://gepia.cancer-pku.cn/index.html). (D) Kaplan–Meier survival analysis of HCC patients with high or low ZFAS1 expression. (E) The ZFAS1 expression between human normal hepatocytes L02 and HCC cell lines assessed by RT-qPCR. (F) siRNAs targeting ZFAS1 sequences were transfected into HepG2 and SMMC7721 cells while scramble siRNA served as negative control. The data are expressed as the mean ± SD. In panel (E and F), one-way ANOVA and Tukey’s multiple comparison test were used to determine statistical significance, while in panel A, paired t test was used. In panel C, E, and F, *p < 0.05 vs tumor tissues, L02 cells or Scramble treatment; In panel B, **p < 0.01 vs adjacent tissues. Abbreviations: HCC, hepatocellular carcinoma; TCGA, The Cancer Genome Atlas; GEPIA, gene expression profiling interactive analysis; lncRNA; long noncoding RNA; LIHC, liver hepatocellular carcinoma; ZFAS1, ZNFX1 antisense RNA 1; RT-qPCR, reverse transcription-quantitative polymerase chain reaction; siRNA, small interfering RNA; SD, standard deviation; ANOVA, analysis of variance. |
In order to further study the correlation between ZFAS1 expression and clinical phenotypes and prognosis of HCC sufferers, the median expression of ZFAS1 was applied as a cut point according to the ZFAS1 expression in 94 patients with HCC. The patients with ZFAS1 expression higher than 6.40 was categorized as the high expression group, while those lower than 6.40 was the low expression group. Additionally, we plotted an overall survival (OS) curve with the Kaplan–Meier analysis and gained the survival information for the patients. Patients with high levels of ZFAS1 had remarkably shorter OS (Figure 1D). Furthermore, ZFAS1 was correlated to the clinical stage, lymph node metastasis, as well as the differentiation degree of the HCC patients, but not related to the tumor size, gender, and age (Table 1). Then, we detected the expression of ZFAS1 in SMMC-7721, Bel-7402, MHCC97, and HepG2 cell lines and human normal hepatocytes L02. It was found that the ZFAS1 expression in HCC cell lines was markedly elevated relative to the L02 cell line (Figure 1E). Therefore, with the intention of verifying the correlation between ZFAS1 and the growth and biological behaviors of HCC cells, HepG2 and SMMC-7221 cells were transfected with three siRNAs targeting ZFAS1. RT-qPCR confirmed that the transfection was successful, and siRNA-2 had the highest transfection efficiency (Figure 1F).
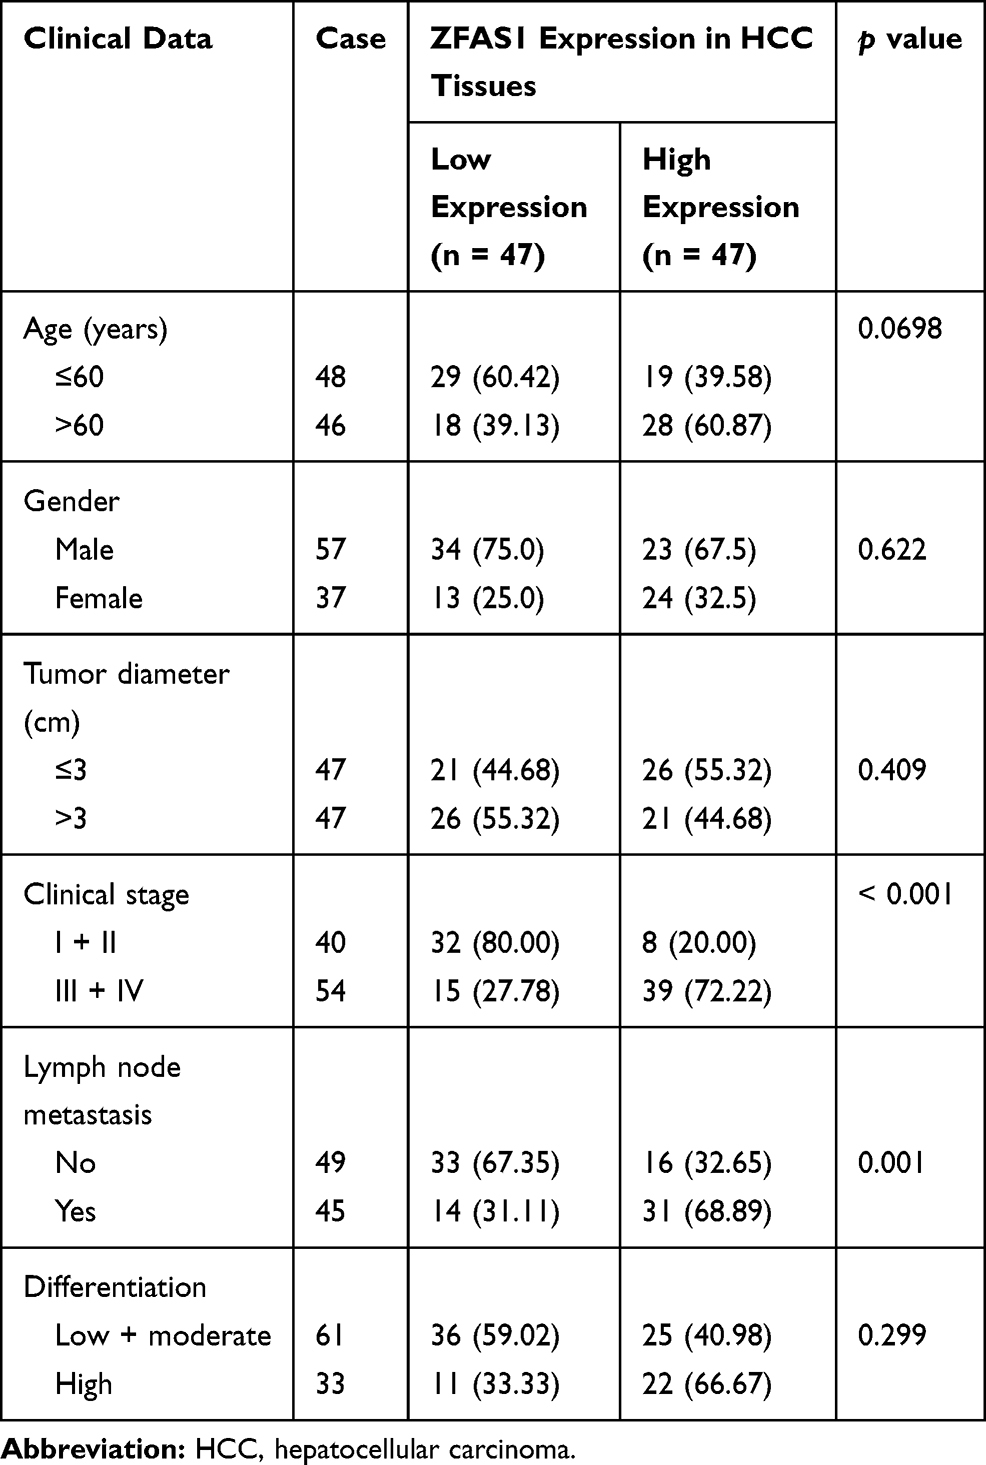 |
Table 1 Association Between ZFAS1 Expression with Clinical Characteristics of HCC Patients |
ZFAS1 Promotes Malignant Phenotype of HCC Cells
Subsequently, EdU staining was carried out on HCC cells. After the knockdown of ZFAS1, the cell viability was profoundly inhibited (Figure 2A). PI/Annexin V was then used to label the cells, which were subjected to flow cytometry. It was found that si-ZFAS1 contributed to the apoptosis of HCC cells (Figure 2B).
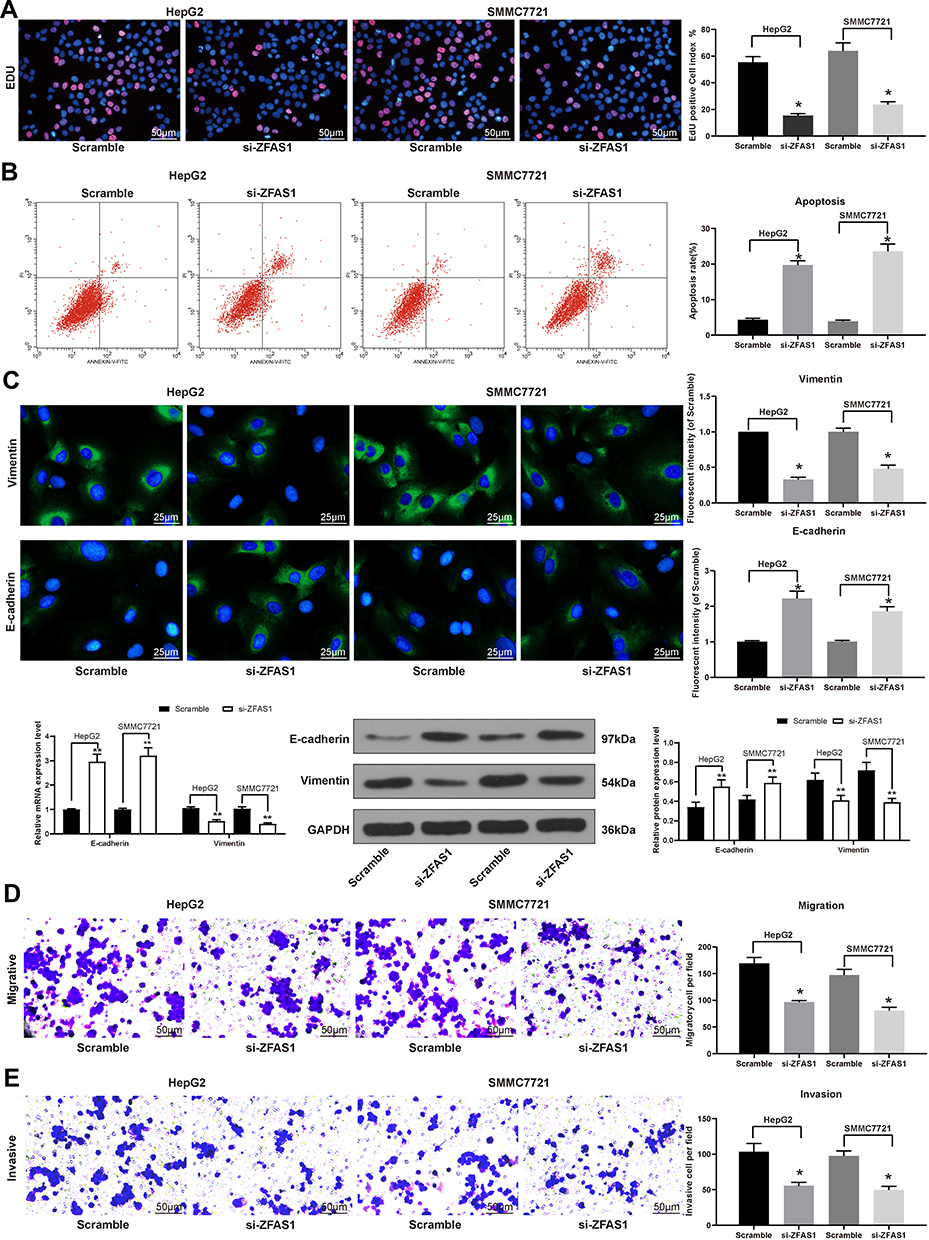 |
Figure 2 ZFAS1 downregulation in HCC cell inhibited its malignant behaviors. (A) The living and dead cells were visualized by EdU staining where green indicated living cells stained by Calcein-AM while red signified dead cells stained by EthD III. (B) PI/Annexin V-labeled cells analyzed by flow cytometry to determine apoptosis index. (C) E-cadherin and Vimentin expression determined by immunofluorescence staining, RT-qPCR, and Western blot. (D) Migration ability of HCC cells determined by Transwell assay. (E) Invasion ability of HCC cells determined by Transwell assay. The data are expressed as the mean ± SD. One-way ANOVA and Tukey’s multiple comparison test were used to determine statistical significance. *p < 0.05 vs Scramble treatment; **p < 0.01 vs Scramble treatment. Abbreviations: HCC, hepatocellular carcinoma; siRNA, small interfering RNA; ZFAS1, ZNFX1 antisense RNA 1; EdU, 5ʹ-ethynyl-2ʹ-deoxyuridine; PI, propidium iodide; RT-qPCR, reverse transcription-quantitative polymerase chain reaction; FITC, fluorescein isothiocyanate; SD, standard deviation; ANOVA, analysis of variance. |
To substantiate the role of ZFAS1 in EMT, the effect of si-ZFAS1 on the expression of E-cadherin and Vimentin, two epithelial–mesenchymal transition (EMT) markers, was investigated. We monitored that E-cadherin expression in the HCC cells was increased significantly after silencing of ZFAS1, and the expression of Vimentin was decreased (Figure 2C). At the same time, we proved that ZFAS1 inhibition also diminished migration and invasion by Transwell assay (Figure 2D and E). Taken together, ZFAS1 silencing promoted cell apoptosis in the HCC cells, while reduced viability, migration, invasion, and EMT.
ZFAS1 Is Located in the Cytoplasm
We predicted that ZFAS1 was located in cytoplasm through lncatlas, a biological prediction website (Figure 3A). In addition, we substantiated that ZFAS1 was largely located in the cytoplasm of HepG2 and SMMC7721 cells by subcellular fractionation location and FISH assays (Figure 3B and C), which may indicate that ZFAS1 performed its function in HCC through a ceRNA mechanism.
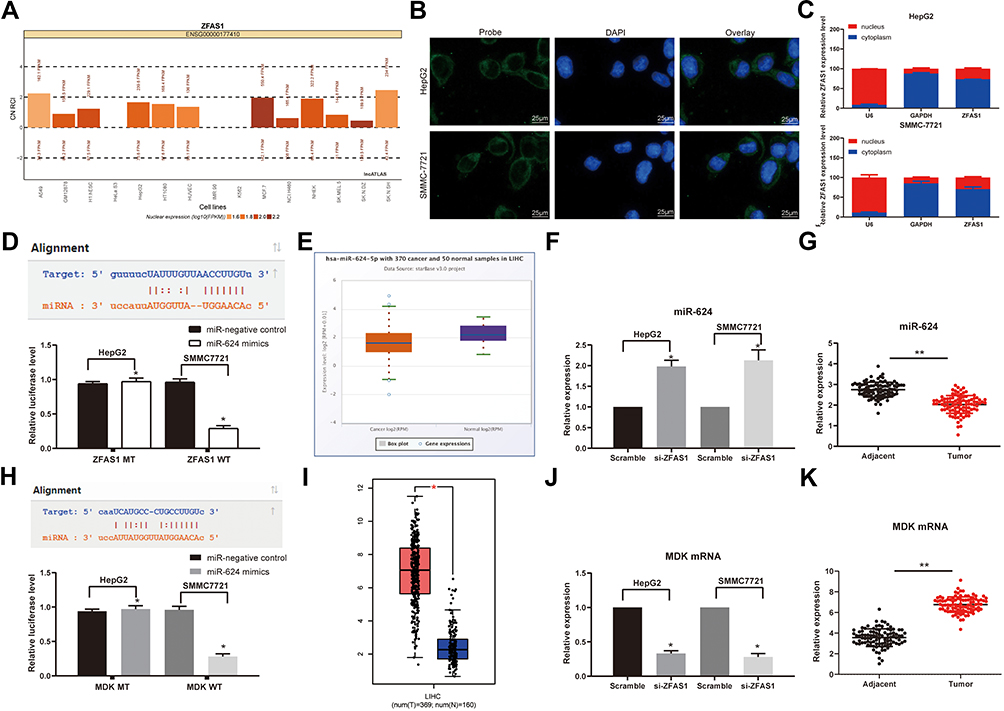 |
Figure 3 ZFAS1 serves as a ceRNA by sponging miR-624 with MDK. (A) Subcellular localization of ZFAS1 in the LncATLAS database. (B) The subcellular localization of ZFAS1 in HepG2 and SMMC7721 cells were stained with probes targeting ZFAS1 (green), and the nuclei were stained with DAPI (blue) by FISH. (C) Nuclear and cytoplasmic expression of ZFAS1 in HepG2 and SMMC7721 cells determined by RT-qPCR. (D) Luciferase reporter plasmids containing ZFAS1-WT or ZFAS1-MT were transfected into H293T cells together with miR-624 in parallel with an miR-NC plasmid vector. (E) miR-624 expression in healthy tissues and HCC tumor tissues in TCGA database by GEPIA. (F) Relative expression of miR-624 in HCC cells treated with si-ZFAS1 determined by RT-qPCR. (G) miR-624 expression in normal tissues and tumor tissues determined by RT-qPCR. (H) Luciferase reporter plasmids containing MDK-WT or MDK-MT were transfected into H293T cells together with miR-624 in parallel with an miR-NC plasmid vector. (I) MDK expression of normal tissues (n = 160) and tumor tissues (n = 369) in TCGA database by GEPIA (http://gepia.cancer-pku.cn/index.html). (J) Relative expression of MDK determined in HCC cells treated with si-ZFAS1 determined by RT-qPCR. (K) MDK expression in collected normal tissues and tumor tissues. One-way ANOVA and Tukey’s multiple comparison test were used or paired t test was used to determine statistical significance. *p < 0.05 vs miR-negative control or Scramble treatment; **p < 0.01 vs adjacent tissues. Abbreviations: siRNA, small interfering RNA; ZFAS1, ZNFX1 antisense RNA 1; ceRNA, competing endogenous RNA; WT, wild type; MT, mutant; LIHC, liver hepatocellular carcinoma; RPM, reads per kilobase of exon model per million mapped reads; MDK, midkine; DAPI, 4ʹ,6-diamidino-2-phenylindole; FISH, fluorescence in situ hybridization; HCC, hepatocellular carcinoma; TCGA, The Cancer Genome Atlas; GEPIA, gene expression profiling interactive analysis; NC, negative control; miR, microRNA; RT-qPCR, reverse transcription-quantitative polymerase chain reaction; SD, standard deviation; ANOVA, analysis of variance. |
We then predicted and screened out miR-624 by StarBase. With the purpose of verifying the binding relation of miR-624 to ZFAS1, we conducted a dual-luciferase reporter gene assay, which showed that miR-624 had a targeted binding relationship with ZFAS1 (Figure 3D), and the TCGA database shows a decrease in the miR-624 expression in patients with HCC (Figure 3E). We further tested the miR-624 expression in HCC cells in the presence of si-ZFAS1 by the means of RT-qPCR. After the downregulation of ZFAS1, the expression of miR-624 was upregulated. Moreover, the miR-624 expression in the cancer tissues was also reduced versus the adjacent tissues (Figure 3F and G). After that, we further screened the mRNAs with the targeting relationship with miR-624 by StarBase, and we put our focus on the MDK. Besides, the TCGA database showed a remark overexpression of MDK in patients with HCC (Figure 3H). Thus, we demonstrated that the binding relationship between miR-624 and the MDK 3ʹ-UTR through a dual-luciferase reporter gene assay (Figure 3I). The measurement of MDK expression at an mRNA level in HCC cells by RT-qPCR showed that MDK was profoundly inhibited by si-ZFAS1, and MDK expression in cancer tissues was remarkable enhanced relative to paracancerous tissues (Figure 3J and K). Moreover, after overexpression of miR-624 in HepG2 cells, we examined the mRNA and protein expression of MDK in the cells. Overexpression of miR-624 significantly inhibited MDK expression, while silencing of miR-624 in SMMC7721 cells significantly promoted MDK expression (Supplementary Figure S1 A–C). The aforementioned data suggested that ZFAS1 was primarily localized in the cytoplasm and may play a major controlling part on MDK through sponging miR-624.
Silencing of miR-624 Reverses the Inhibitory Role of si-ZFAS1 on Malignant Biological Behaviors of HCC Cells
With the aim of clarifying the role of miR-624 on the malignant biological behaviors of HCC cells, miR-624 inhibitor (In) and the corresponding negative control (Mock) were transfected into HepG2 and SMMC7721 cells in the presence of si-ZFAS1, RT-qPCR confirmed the successful delivery (Supplementary Figure S2). The inhibition of malignant biological behaviors of HepG2 and SMMC7721 cells caused by silencing of ZFAS1 was partially alleviated after the miR-624 inhibition (Figure 4A–E).
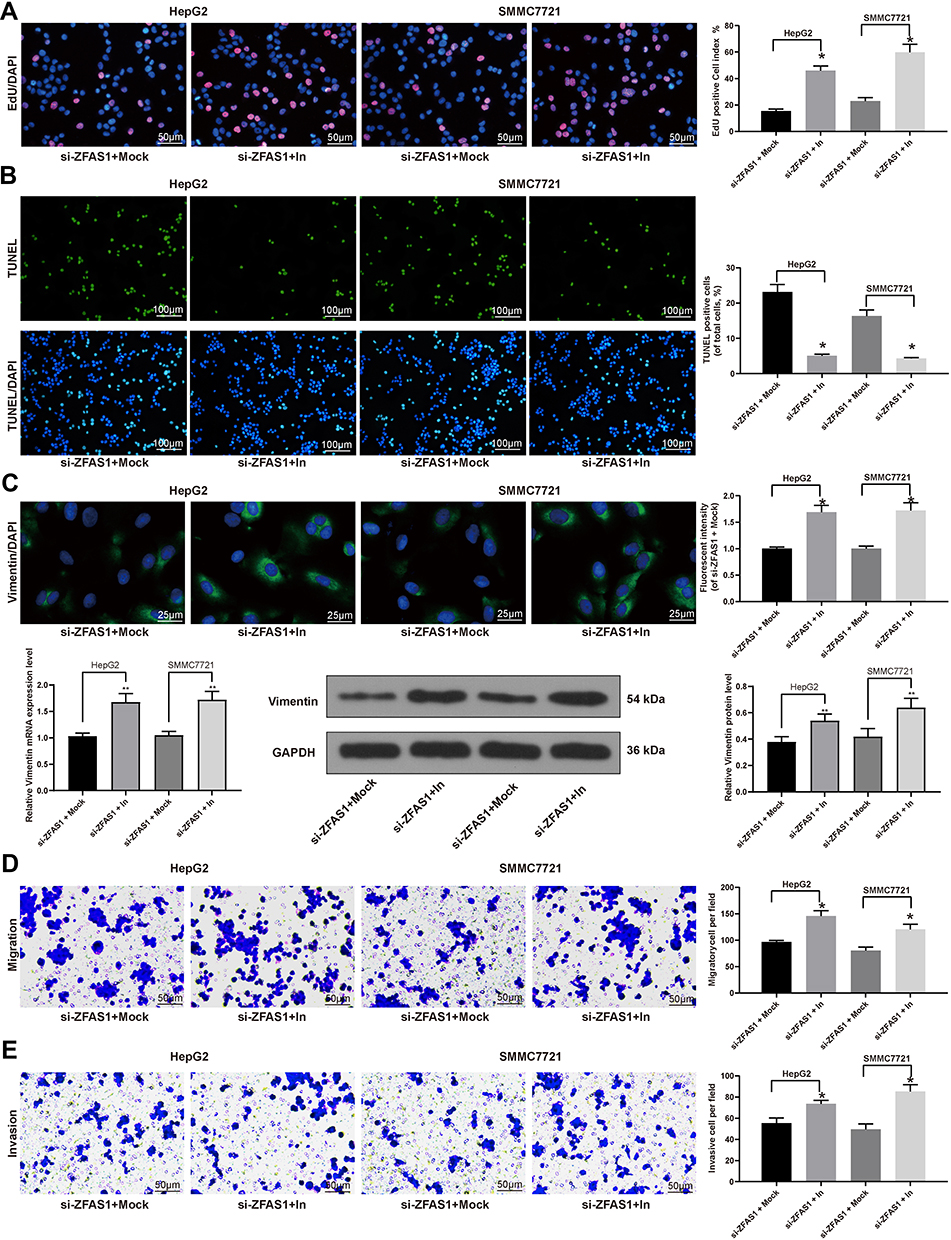 |
Figure 4 Inhibition of miR-624 restores HCC cell malignant behaviors induced by ZFAS1 silencing. (A) EdU staining of proliferating cells. (B) TUNEL staining of apoptotic cells. (C) Vimentin expression determined by immunofluorescence staining, RT-qPCR, and Western blot. (D) Migration ability determined by Transwell assays. (E) Invasion ability measured by Transwell assays. The data are expressed as the mean ± SD. One-way ANOVA and Tukey’s multiple comparison test were used to determine statistical significance. *p < 0.05 vs si-ZFAS1 + Mock treatment; **p < 0.01 vs si-ZFAS1 + Mock treatment. Abbreviations: ZFAS1, ZNFX1 antisense RNA 1; EdU, 5ʹ-ethynyl-2ʹ-deoxyuridine; DAPI, 4ʹ,6-diamidino-2-phenylindole; TUNEL, terminal deoxynucleotidyl transferase dUTP nick end labeling; In, inhibitor; GAPDH, glyceraldehyde-3-phosphate dehydrogenase; siRNA, small interfering RNA; HCC, hepatocellular carcinoma; miR, microRNA; RT-qPCR, reverse transcription-quantitative polymerase chain reaction; SD, standard deviation; ANOVA, analysis of variance. |
The ERK/JNK/P38 Signaling Pathway Is Induced by ZFAS1 to Promote the Occurrence of HCC
Then, we detected the ERK/JNK/P38 pathway phosphorylation in each group by Western blot assays. The extent of ERK/JNK/P38 pathway phosphorylation was found to be decreased significantly after silencing of ZFAS1, while was partially restored after inhibition of miR-624 (Figure 5A). The effect of ERK/JNK/P38 signaling pathway on the HCC cells was then determined by adding an ERK specific agonist to HepG2 and SMMC7721 cells with downregulated ZFAS1. The results showed that induction of the ERK/JNK/P38 signaling pathway potentiated the malignant biological behaviors of HCC cells (Figure 5B–E).
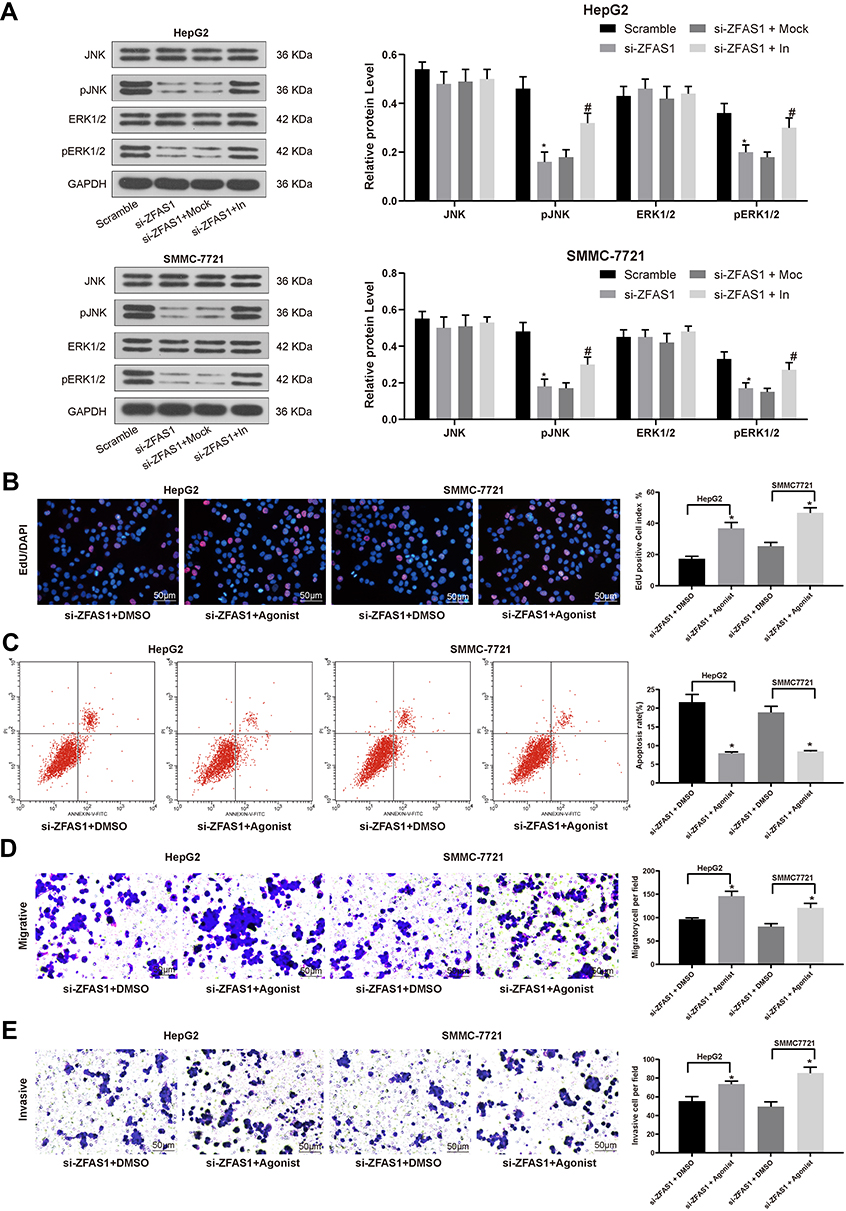 |
Figure 5 ZFAS1 silencing inhibits the induction of the ERK/JNK/P38 signaling pathway in HCC cells. (A) ERK/JNK/P38 protein level determined by Western blot assays. Then, an ERK specific agonist tert-butylhydroquinone (1.25 mM) was added in si-ZFAS1-transfected HepG2 and SMMC7721 cells. (B) EdU staining of proliferating cells. (C) PI/Annexin V-labeled cells were then analyzed by flow cytometry to determine apoptosis index. (D) Migration ability of HCC cells determined by Transwell assays. (E) Invasion ability of HCC cells determined by Transwell assays. The data are expressed as the mean ± SD. One-way ANOVA and Tukey’s multiple comparison test were used to determine statistical significance. *p < 0.05 vs Scramble or si-ZFAS1 + DMSO treatment; #p < 0.05 vs si-ZFAS1 + Mock treatment. Abbreviations: ZFAS1, ZNFX1 antisense RNA 1; JNK, Jun n-terminal kinase; p, phosphorylated; HCC, hepatocellular carcinoma; ERK, extracellular signal-regulated kinase; EdU, 5ʹ-ethynyl-2ʹ-deoxyuridine; GAPDH, glyceraldehyde-3-phosphate dehydrogenase; In, inhibitor; siRNA, small interfering RNA; DMSO, dimethylsulfoxide; PI, propidium iodide; FITC, fluorescein isothiocyanate; SD, standard deviation; ANOVA, analysis of variance. |
Silencing ZFAS1 Impairs the Growth and Metastasis of HCC in vivo
In order to verify the effect of ZFAS1 on the development of HCC in vivo, the in vivo tumorigenesis model was established in nude mice. In line with our in vitro findings, downregulation of ZFAS1 lowered the growth rate of HCC in vivo and decreased the rate of pERK, MDK, and KI67 positive cells in tumors (Figure 6A–C). To understand the roles of ZFAS1 on the metastasis of HCC, HepG2 cells delivered with si-ZFAS1 were inoculated into nude mice. Forty-five days later, the metastases in the lungs and livers were examined by HE staining. The knockdown of ZFAS1 led to a decline in the number of metastases versus the scramble group (Figure 6D).
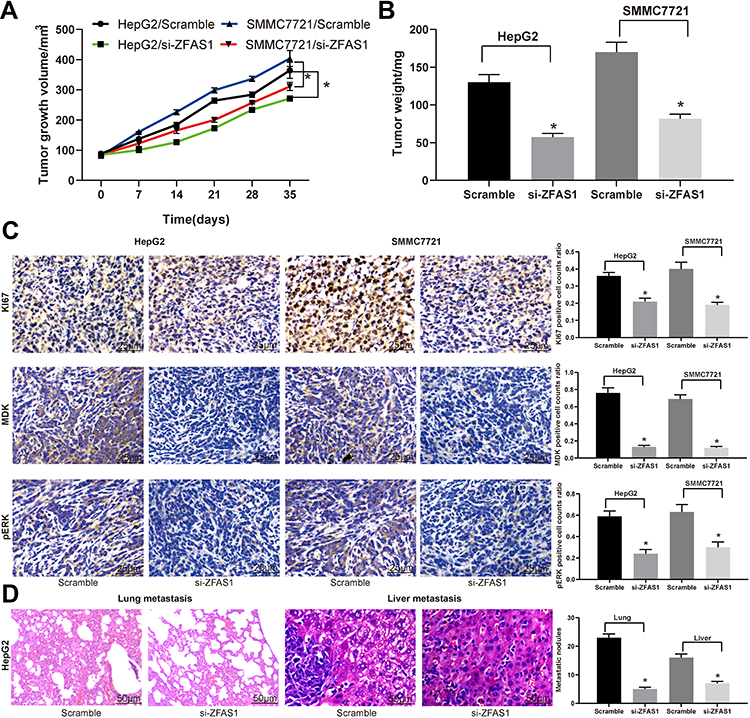 |
Figure 6 ZFAS1 downregulation in HCC cells inhibits its malignant behavior in vivo. HepG2 and SMMC7721 cells stably transfected with ZFAS1-siRNA or scramble siRNA were inoculated subcutaneously into BALB/c nude mice at a dose of 5 × 10⁶ (n = 6 in each group). Tumor growth was measured continuously at an interval of 7 days. At 35 days post-implantation, the mice were euthanized by overdosed pelltobarbitalum natricum. (A) Tumor size. (B) Tumor weight. (C) Immunostaining of Ki67-, MDK-, and pERK-positive tumor cells and quantification. (D) HE staining of lung and liver metastases in nude mice injected with HepG2 cells by tail-vein. The numbers of metastasis were determined at 45 days after HepG2 cells injection. One-way or two-way ANOVA and Tukey’s multiple comparison test were used to determine statistical significance, *p < 0.05 vs Scramble treatment. Abbreviations: ZFAS1, ZNFX1 antisense RNA 1; HCC, hepatocellular carcinoma; p, phosphorylated; ERK, extracellular signal-regulated kinase; siRNA, small interfering RNA; MDK, midkine; HE, hematoxylin and eosin; ANOVA, analysis of variance. |
Discussion
East Asia, particularly China, is home to the highest incidence of HCC, accounting for 50% of all cases globally, calling for better strategies to monitor and diagnose HCC at early stage to achieve higher disease-free survival for HCC patients.24 Mammalian genomes could encode great numbers of lncRNAs which accomplish imperative functions in the modulation of gene expression, and lncRNA dysregulation might participate in cancer growth and metastasis.23 In this work, we predicted ZFAS1 to be overexpressed in HCC tissues and cells, and downregulation of ZFAS1 hindered HCC progression and metastasis in vitro and in vivo through sponging miR-624. The putative binding relation between miR-624 and MDK was established by a dual reporter gene assay. Additionally, ZFAS1 was proved to positively regulate the ERK/JNK/P38 signaling pathway by binding to MDK in HCC cells, and inhibition of miR-624 or augmentation of the ERK/JNK/P38 signaling pathway partially blocked the repressive role of si-ZFAS1 on HCC progression and metastasis.
Here, we reported the overexpression of ZFAS1 in HCC tissues and cells, which was tightly correlated with poor prognosis of HCC patients. Under glioma conditions, ZFAS1 expression was elevated and closely related to clinical stage, and patients with higher ZFAS1 expression had shorter survival time.25 Using both gain- and loss-of-function approaches, we obtained critical insights into the biological functions of ZFAS1 at the cellular level. More specifically, downregulation of ZFAS1 drastically slowed down migration, invasion, and EMT in HCC cells. In line with our data, silencing of ZFAS1 has been shown to suppress the growth and tumorigenesis of gastric cancer cells in vivo.26 In colonic cancer, downregulation of ZFAS1 promoted the E-cadherin expression, while decreased the mesenchymal marker N-cadherin, thus impeding EMT process.27 Furthermore, ZFAS1 sponged miR-590-3p expression and affected cell growth in colorectal cancer and papillary thyroid carcinoma through mediating CDK1 and HMGA2, respectively.28,29 In vivo, ZFAS1 silencing resulted in the declines in the expression of KI67 and metastases to lung. The proliferation marker Ki67 was also decreased following silencing ZFAS1 in hepatoblastoma as revealed by immunohistochemical staining conducted by Cui et al.30 Of note, we found that ZFAS1 could bind to miR-624 via the StarBase database, which was further verified by a dual reporter gene assay. Besides, our experimental data presented that miR-624 was reduced in HCC tissues and cells, which was rescued by si-ZFAS1. Further investigations determined that the oncogene MDK was a novel miR-624 target in HCC cells.
Mounting evidence underscored the vital role of MDK played in carcinogenesis-linked activities, such as proliferation, migration, as well as angiogenesis in different types of solid tumors, including HCC.31 MDK suppression promoted DNA damage responses, cell cycle arrest in addition to apoptotic cell death and inhibited cell proliferation in prostate cancer stem cells.32 In addition, miR-623 attenuated the progression of HCC by modulating the ERK/JNK pathway in HCC.33 The association between the ERK/JNK signaling pathway and MDK has been exemplified in ischemic stroke.13 Moreover, it has been recognized that the ERK/JNK/AKT pathway was significantly blocked by downregulation of LINC00707, yet induced by overexpression of LINC00707 in HCC cells.34 Actually, we corroborated that si-ZFAS1 led to blocked ERK/JNK/AKT pathway as evidenced by reduced extents of JUNK and ERK1/2 phosphorylation. Furthermore, the ERK specific activating agonist was demonstrated to restore the inhibited cell migration, invasion, and EMT by si-ZFAS1.
In conclusion, our study showed that ZFAS1 is remarkably enhanced in HCC tissues and cells, and its enhancement may be an undesirable prognostic factor for sufferers with HCC. Silencing of ZFAS1 acted as a tumor inhibitor by diminished cell proliferation, migration, invasion and EMT and potentiating cell apoptosis. Furthermore, the oncogenic effects of ZFAS1 were achieved partially through its regulation of the MDK-mediated ERK/JNK/AKT signaling pathway by interacting with miR-624. Our findings might provide some insights for the advance of diagnostics and therapeutics against HCC regarding lncRNAs. However, the role of miR-624 in HCC and the underlying mechanism were not examined in this report, which requires further inspections.
Data Sharing Statement
All the data generated or analyzed during this study are included in this published article.
Disclosure
The authors declare no conflicts of interest in this work.
References
1. Guo ZW, Meng Y, Zhai XM, et al. Translated long non-coding ribonucleic acid ZFAS1 promotes cancer cell migration by elevating reactive oxygen species production in hepatocellular carcinoma. Front Genet. 2019;10:1111. doi:10.3389/fgene.2019.01111
2. Jemal A, Bray F, Center MM, Ferlay J, Ward E, Forman D. Global cancer statistics. CA Cancer J Clin. 2011;61(2):69–90. doi:10.3322/caac.20107
3. Siegel RL, Miller KD, Jemal A. Cancer statistics, 2019. CA Cancer J Clin. 2019;69(1):7–34. doi:10.3322/caac.21551
4. Dong D, Mu Z, Zhao C, Sun M. ZFAS1: a novel tumor-related long non-coding RNA. Cancer Cell Int. 2018;18:125. doi:10.1186/s12935-018-0623-y
5. He A, He S, Li X, Zhou L. ZFAS1: a novel vital oncogenic lncRNA in multiple human cancers. Cell Prolif. 2019;52(1):e12513. doi:10.1111/cpr.12513
6. Li X, Luo Y, Liu L, et al. The long noncoding RNA ZFAS1 promotes the progression of glioma by regulating the miR-150-5p/PLP2 axis. J Cell Physiol. 2020;235(3):2937–2946. doi:10.1002/jcp.29199
7. Li T, Xie J, Shen C, et al. Amplification of long noncoding RNA ZFAS1 promotes metastasis in hepatocellular carcinoma. Cancer Res. 2015;75(15):3181–3191. doi:10.1158/0008-5472.CAN-14-3721
8. Li N, Sun ZH, Fang M, Xin JY, Wan CY. Long non-coding RNA ZFAS1 sponges miR-486 to promote osteosarcoma cells progression and metastasis in vitro and vivo. Oncotarget. 2017;8(61):104160–104170. doi:10.18632/oncotarget.22032
9. Pashaei E, Pashaei E, Ahmady M, Ozen M, Aydin N. Meta-analysis of miRNA expression profiles for prostate cancer recurrence following radical prostatectomy. PLoS One. 2017;12(6):e0179543. doi:10.1371/journal.pone.0179543
10. Filippou PS, Karagiannis GS, Constantinidou A. Midkine (MDK) growth factor: a key player in cancer progression and a promising therapeutic target. Oncogene. 2019.
11. Tsuchiya N, Sawada Y, Endo I, Saito K, Uemura Y, Nakatsura T. Biomarkers for the early diagnosis of hepatocellular carcinoma. World J Gastroenterol. 2015;21(37):10573–10583. doi:10.3748/wjg.v21.i37.10573
12. Lu J, Liu QH, Wang F, et al. Exosomal miR-9 inhibits angiogenesis by targeting MDK and regulating PDK/AKT pathway in nasopharyngeal carcinoma. J Exp Clin Cancer Res. 2018;37(1):147. doi:10.1186/s13046-018-0814-3
13. Xing Y, Yang SD, Wang MM, Dong F, Feng YS, Zhang F. Electroacupuncture alleviated neuronal apoptosis following ischemic stroke in rats via midkine and ERK/JNK/p38 signaling pathway. J Mol Neurosci. 2018;66(1):26–36. doi:10.1007/s12031-018-1142-y
14. Feng W, Yang J, Yang L, et al. Research of Mrr1, Cap1 and MDR1 in Candida albicans resistant to azole medications. Exp Ther Med. 2018;15(2):1217–1224. doi:10.3892/etm.2017.5518
15. Zhang P, Mar TT, Liu W, Li L, Wang X. Simultaneous detection and differentiation of Rice black streaked dwarf virus (RBSDV) and Southern rice black streaked dwarf virus (SRBSDV) by duplex real time RT-PCR. Virol J. 2013;10:24. doi:10.1186/1743-422X-10-24
16. Hanaki K, Ike F, Kajita A, et al. A broadly reactive one-step SYBR Green I real-time RT-PCR assay for rapid detection of murine norovirus. PLoS One. 2014;9(5):e98108. doi:10.1371/journal.pone.0098108
17. Zhang Y, Yan T, Sun D, et al. Rutaecarpine inhibits KEAP1-NRF2 interaction to activate NRF2 and ameliorate dextran sulfate sodium-induced colitis. Free Radic Biol Med. 2019.
18. Salic A, Mitchison TJ. A chemical method for fast and sensitive detection of DNA synthesis in vivo. Proc Natl Acad Sci U S A. 2008;105(7):2415–2420. doi:10.1073/pnas.0712168105
19. Zhou X, Wang X, Zhou Y, Cheng L, Zhang Y, Zhang Y. Long noncoding RNA NEAT1 promotes cell proliferation and invasion and suppresses apoptosis in hepatocellular carcinoma by regulating miRNA-22-3p/akt2 in vitro and in vivo. Onco Targets Ther. 2019;12:8991–9004. doi:10.2147/OTT.S224521
20. Jiang C, Zhu W, Xu J, et al. MicroRNA-26a negatively regulates toll-like receptor 3 expression of rat macrophages and ameliorates pristane induced arthritis in rats. Arthritis Res Ther. 2014;16(1):R9. doi:10.1186/ar4435
21. Zhang Y, Guo L, Li Y, et al. MicroRNA-494 promotes cancer progression and targets adenomatous polyposis coli in colorectal cancer. Mol Cancer. 2018;17(1):1. doi:10.1186/s12943-017-0753-1
22. Ji Y, Han Z, Shao L, Zhao Y. Evaluation of in vivo antitumor effects of low-frequency ultrasound-mediated miRNA-133a microbubble delivery in breast cancer. Cancer Med. 2016;5(9):2534–2543. doi:10.1002/cam4.840
23. Wu Y, Liu H, Shi X, Yao Y, Yang W, Song Y. The long non-coding RNA HNF1A-AS1 regulates proliferation and metastasis in lung adenocarcinoma. Oncotarget. 2015;6(11):9160–9172. doi:10.18632/oncotarget.3247
24. Song P, Tang Q, Feng X, Tang W. Biomarkers: evaluation of clinical utility in surveillance and early diagnosis for hepatocellular carcinoma. Scand J Clin Lab Invest Suppl. 2016;245:S70–S76. doi:10.1080/00365513.2016.1210328
25. Lv QL, Chen SH, Zhang X, et al. Upregulation of long noncoding RNA zinc finger antisense 1 enhances epithelial-mesenchymal transition in vitro and predicts poor prognosis in glioma. Tumour Biol. 2017;39(3):1010428317695022. doi:10.1177/1010428317695022
26. Nie F, Yu X, Huang M, et al. Long noncoding RNA ZFAS1 promotes gastric cancer cells proliferation by epigenetically repressing KLF2 and NKD2 expression. Oncotarget. 2017;8(24):38227–38238. doi:10.18632/oncotarget.9611
27. Fang C, Zan J, Yue B, Liu C, He C, Yan D. Long non-coding ribonucleic acid zinc finger antisense 1 promotes the progression of colonic cancer by modulating ZEB1 expression. J Gastroenterol Hepatol. 2017;32(6):1204–1211. doi:10.1111/jgh.13646
28. Thorenoor N, Faltejskova-Vychytilova P, Hombach S, et al. Long non-coding RNA ZFAS1 interacts with CDK1 and is involved in p53-dependent cell cycle control and apoptosis in colorectal cancer. Oncotarget. 2016;7(1):622–637. doi:10.18632/oncotarget.5807
29. Tong H, Zhuang X, Cai J, et al. Long noncoding RNA ZFAS1 promotes progression of papillary thyroid carcinoma by sponging miR-590-3p and upregulating HMGA2 expression. Onco Targets Ther. 2019;12:7501–7512. doi:10.2147/OTT.S209138
30. Cui X, Wang Z, Liu L, et al. The long non-coding RNA ZFAS1 sponges miR-193a-3p to modulate hepatoblastoma growth by targeting RALY via HGF/c-Met pathway. Front Cell Dev Biol. 2019;7:271. doi:10.3389/fcell.2019.00271
31. Zhu WW, Guo JJ, Guo L, et al. Evaluation of midkine as a diagnostic serum biomarker in hepatocellular carcinoma. Clin Cancer Res. 2013;19(14):3944–3954. doi:10.1158/1078-0432.CCR-12-3363
32. Han S, Shin H, Lee JK, et al. Secretome analysis of patient-derived GBM tumor spheres identifies midkine as a potent therapeutic target. Exp Mol Med. 2019;51(12):147. doi:10.1038/s12276-019-0351-y
33. Ren F, Su H, Jiang H, Chen Y. Overexpression of miR-623 suppresses progression of hepatocellular carcinoma via regulating the PI3K/Akt signaling pathway by targeting XRCC5. J Cell Biochem. 2020;121(1):213–223. doi:10.1002/jcb.29117
34. Wang J, Luo Z, Yao T, Li W, Pu J. LINC00707 promotes hepatocellular carcinoma progression through activating ERK/JNK/AKT pathway signaling pathway. J Cell Physiol. 2019;234(5):6908–6916. doi:10.1002/jcp.27449
 © 2020 The Author(s). This work is published and licensed by Dove Medical Press Limited. The full terms of this license are available at https://www.dovepress.com/terms.php and incorporate the Creative Commons Attribution - Non Commercial (unported, v3.0) License.
By accessing the work you hereby accept the Terms. Non-commercial uses of the work are permitted without any further permission from Dove Medical Press Limited, provided the work is properly attributed. For permission for commercial use of this work, please see paragraphs 4.2 and 5 of our Terms.
© 2020 The Author(s). This work is published and licensed by Dove Medical Press Limited. The full terms of this license are available at https://www.dovepress.com/terms.php and incorporate the Creative Commons Attribution - Non Commercial (unported, v3.0) License.
By accessing the work you hereby accept the Terms. Non-commercial uses of the work are permitted without any further permission from Dove Medical Press Limited, provided the work is properly attributed. For permission for commercial use of this work, please see paragraphs 4.2 and 5 of our Terms.