Back to Journals » Journal of Hepatocellular Carcinoma » Volume 10
The Long Non-Coding RNA AC006329.1 Facilitates Hepatocellular Carcinoma Progression and Metastasis by Regulating miR-127-5p/SHC3/ERK Axis
Authors Kong XX, Yang X, Jiang WJ, Zhu DM, Kong LB ![]()
Received 1 April 2023
Accepted for publication 3 July 2023
Published 17 July 2023 Volume 2023:10 Pages 1085—1103
DOI https://doi.org/10.2147/JHC.S415309
Checked for plagiarism Yes
Review by Single anonymous peer review
Peer reviewer comments 2
Editor who approved publication: Dr Mohamed Shaker
Xiang Xu Kong,1,* Xiao Yang,1,* Wang Jie Jiang,1,* De Ming Zhu,1,2 Lian Bao Kong1,2
1Hepatobiliary Center, The First Affiliated Hospital of Nanjing Medical University, Nanjing, 210000, People’s Republic of China; 2Key Laboratory of Liver Transplantation, Chinese Academy of Medical Sciences, NHC Key Laboratory of Living Donor Liver Transplantation, Nanjing Medical University, Nanjing, 210000, People’s Republic of China
*These authors contributed equally to this work
Correspondence: Lian Bao Kong, Hepatobiliary Center, The First Affiliated Hospital of Nanjing Medical University, Nanjing, 210000, People’s Republic of China, Tel +86-138-0158-3199, Email [email protected]
Purpose: Hepatocellular carcinoma(HCC) is the most common type of liver cancer and the sixth largest common cancer worldwide. Although surgical resection, hepatic arterial chemoembolization, targeted drugs and immunotherapy are currently available, the mortality of advanced patients remains high. Therefore, new therapeutic targets are urgently needed. In recent years, many studies have found that The long non-coding RNA(lncRNA) has multiple functions in human tumors, including participating in epigenetic, transcriptional, post-transcriptional and translational regulation, and is closely related to the progression of HCC. The purpose of this study was to investigate the role of AC006329.1 in HCC progression and provide theoretical guidance for finding new targets.
Patients and Methods: AC006329.1 was screened out by transcriptome sequencing and quantitative real-time polymerase chain reaction (qRT-PCR). Then a series of functional tests in vivo and in vitro were conducted to investigate the effects of AC006329.1 on HCC progression and metastasis. Epithelial-mesenchymal transformation (EMT) of HCC was detected by Western blot and immunofluorescence staining. The targeted miRNA and downstream gene of AC006329.1 were predicted by databases and the pathway regulation axis eventually validated by dual luciferase reporter assays, qRT-PCR and WB.
Results: AC006329.1 was found high expressed in HCC tissues and cell lines by qRT-PCR. The prognosis of HCC patients with high expressed AC006329.1 was poor. In vitro and in vivo, overexpression of AC006329.1 can promote the progression, metastasis and EMT of HCC by acting as a sponge of miR-127-5p to increase the expression of SHC3. In addition, up-regulation of miR-127-5p or knockdown of SHC3 can both reverse the promoting effects of AC006329.1 on progression, metastasis and EMT of HCC. Finally, WB and qRT-PCR analysis was discovered that AC006329.1 can facilitate HCC progression, EMT and metastasis by competitively inhibiting miR-127-5p to activate SHC3/ERK signaling pathway.
Conclusion: These above experimental results confirmed that AC006329.1 can facilitate HCC progression, EMT and metastasis by acting as a competing endogenous RNA (ceRNA) to inhibit miR-127-5p and activate SHC3/ERK signaling pathway.
Keywords: AC006329.1, miR-127-5p, SHC3, EMT, HCC
Introduction
Hepatocellular carcinoma (HCC) is one of the most common malignancies and the third most common cause of cancer-related death in the world, especially in Africa and East Asia.1 Due to the lack of early specific symptoms, HCC patients were usually diagnosed late and have a poor prognosis. Advanced HCC Patients can only be treated conservatively, such as chemotherapy, interventional therapy, radiotherapy, and targeted immunotherapy to prolong survival. Although there are many therapeutic methods for HCC, it seems that the prognosis and curative effects are hardly satisfactory.2 To significantly improve the prognosis of HCC, further studies are needed for us to better understand the molecular mechanisms of HCC and identify other novel molecular targets for effective intervention in HCC.
Long non-coding RNAs (LncRNAs) are more than 200nt in length and were previously considered to be non-protein-coding; however, they may have shorter open reading frames (ORFs). Many studies have shown that lncRNAs have multiple functions in humans and animals, including epigenetic regulation, transcriptional, post-transcriptional and translational regulation, and post-translational modification.3 For example, the prognosis of HCC patients with high expressed LncRNA-MCM3AP-AS1 is poor. Knockout of MCM3AP-AS1 inhibits the proliferation cell cycle progression of HCC cells, and promote the apoptosis of HCC cells. In terms of mechanism, MCM3AP-AS1 binds to miR-194-5p as a carcinogenic lncRNA, thus promoting the expression of FOXA1.4
MicroRNAs (miRNAs or miRs) is a non-coding single-stranded multifunctional RNAs with a length of 19–22 nucleotides. Many studies have found that MicroRNAs can regulate the function of a variety of genes and proteins, affecting a wide range of pathway networks. MiRNAs interfere with the translation or post-transcription of their target genes and regulate their multiple biological functions. Depending on the cellular environment, these genes are either oncogenes or tumor suppressors in cancers.5 For example, the Marcks pathway regulated by miR-34c-3p can inhibit the proliferation, migration and invasion of HCC cells, while miR-34c-3p is low-expressed in HCC and negatively correlated with advanced TNM stage and vascular invasion.6
Many studies have demonstrated that lncRNAs can act as competitive endogenous RNAs (ceRNAs) to interact with miRNAs to exert their biological functions.7 For example, Mylk-AS1 promotes tumor angiogenesis and cell proliferation in HCC by targeting miR-424-5p, thereby enhancing E2F7 and activating VEGFR-2 signaling pathway.8 Therefore, lncRNAs may become a new breakthrough or therapeutic target for HCC treatment. Transcriptome sequencing showed that AC006329.1 was highly expressed in HCC, so we speculated that AC006329.1 may be involved in the progression and metastasis of HCC. A series of experiments were designed to explore the role of AC006329.1 in HCC and it was probably to provide a theoretical basis for exploring new methods for the treatment of HCC.
Materials and Methods
Patients and Samples
Fifty pairs of HCC specimens and paracancerous tissues were obtained from the hepatobiliary center of the first affiliated Hospital of Nanjing Medical University. This study has obtained the consent of all patients and their guardians and they all signed the informed consent form. All HCC patients received surgical treatment and were confirmed by pathological examination. This study was authorized by the Institutional Review Board (IRB) of the first affiliated Hospital of Nanjing Medical University.
Cell Lines and Culture
Normal liver cell line (LO2), HCC cell lines (Hep-3B, Huh7, SMMC-7721, MHCC-97H, MHCC-LM3, Focus) and HEK293T cells were acquired from Shanghai Institute of Cell Biology, Chinese Academy of Sciences (Shanghai, China). All the above cell lines were cultured in a DMEM medium ((Invitrogen, CA, USA) supplemented with 10% fetal bovine serum (FBS) (Gibco, CA, USA), high glucose, 50 U/mL penicillin (Invitrogen) and 50 U/mL streptomycin (Invitrogen). All cells were cultured in a 37 °C cell incubator containing 5% CO2.
LncRNAs Transcriptome Sequencing
Three pairs of fresh hepatocellular carcinoma tissues and adjacent normal tissues were randomly collected and stored in the tissue preservation solution. They were cleaved to construct LncRNA-seq libraries by high-throughput transcriptome sequencing (LC-Bio, Hangzhou, China) according to standard IIIUmina protocols (SUB13505892).
Nuclear-Cytoplasmic Separation Assay
The cells are washed with PBS, and pancreatic enzymes digest the cells and count them. Then, the cells were collected by centrifugation at low speed, and the medium was discarded and washed with PBS. Next, the cells are collected by centrifugation at low speed again, and the supernatant is sucked up as much as possible, leaving the cells to precipitate for later use. Then, 200ul of cytoplasmic protein extraction reagent A(Beyotime, Shanghai, China) was added to the cell precipitate every 20ul, vortex for 5 seconds, the cell precipitate was completely suspended and dispersed, and then ice bath for 10~15min. Next, add 10ul of cytoplasmic protein extraction reagent B(Beyotime, Shanghai, China), Vortex for 5 seconds, and ice bath for 1 minute.Then vortex for 5 seconds and centrifuge for 5 minutes (4°C, 12000g).The supernatant was immediately absorbed into the pre-cooled plastic tube and Trizol was added to extract cytoplasmic RNA. For precipitation, the residual supernatant was completely sucked up and Trizol was added to extract nuclear RNA. Expression levels of AC006329.1, GAPDH and U6 in nuclear and cytoplasm fractions were severally measured via RT-qPCR.
Quantitative Real-Time Polymerase Chain Reaction (qRT-PCR) and RNA Isolation
First, the total RNA is separated from the sample according to the steps in the Trizol kit (Invitrogen). Then the total RNA was reverse transcribed into cDNA according to the operation instructions of Prime Script RT Reagent Kit (Takara, Dalian, China). Quantitative detection of miR-127-5p and AC006329.1 expression by ChamQ Universal SYBR qPCR Master Mix (Vazyme, Nanjing) and 7900HT rapid real-time polymerase chain reaction system (ABI, Waltham, MA, USA). U6 was used as the negative control of miR-127-5p and GAPDH was used as the negative control of AC006329.1 and SHC3. Finally, the PCR results are calculated by 2−ΔΔCT method. The primer sequences involved in this study were placed in the supporting information (Table S1).
Plasmid Construction and Transfection
Plasmid overexpressing AC006329.1 (ov-AC006329.1), small interference RNA for SHC3 (si-SHC3), small interference RNA for AC006329.1 (si-AC006329.1) were purchased from CoreusBiotech (Nanjing, China). Inhibitor of miR-127-5p (in-miR-127-5p), mimics of miR-127-5p (mi-miR-127-5p) and control were all purchased from RiboBio (Guangzhou, China). Following the manufacturer’s instructions, plasmids and si-RNAs were transfected into HCC cells and incubated for two days at 37°C. The sequences of si-AC006329.1 and ov-AC006329.1 were placed in the Supplementary Material (Table S1).
Cell Plate Colony Formation Assay
The HCC cells were inoculated in 6-well plate holes (500 cells/well) and cultured in cell incubator for one to two weeks. The growth of cells was observed regularly. When there were about 60 cells in the clone group under microscope, the culture medium was abandoned. Paraformaldehyde was fixed for 20 minutes, washed twice with PBS and stained with crystal violet staining solution for 35 minutes. The crystal violet was discarded, and then washed 3 times with PBS washing solution. When the background became clean and clear, photographs were collected with photographic equipment. As a final step, the clones were counted using an inverted light microscope (Olympus, Tokyo, Japan).
Cell Counting Kit-8 (CCK-8) Assay
The HCC cells were inoculated into 96-well plates (2000 cells /well) and incubated in an incubator for 1 day. In the first row of cells containing cells, 10ul CCK-8 reagent (Vazyme, Nanjing, China) was added to avoid light, and 96-well plates were wrapped in tin foil and incubated for 1 hour. The culture plate was taken out and the detection wavelength of 450nm was set up to determine the initial absorbance. According to the above steps, the absorbance of cells at 12h, 24h, 48h and 72h was recorded, and the CCK-8 proliferation curve was drawn.
5-Ethynyl-2’-Deoxyuridine (EdU) Cell Proliferation Assay
The HCC cells were plated in 96-well culture plates with an appropriate number of cells (104/well), then they were labeled with EDU and incubated at 37 °C for 2 hours. Then the cells were fixed in 4% paraformaldehyde at room temperature for 15 minutes. Staining was performed following the instructions of the BeyoClickweed medu-488 Cell Proliferation Kit (Beyotime, Shanghai, China). These cells were further stained with DAPI for 30 minutes and supplemented with fresh phosphate-buffered saline (PBS) (GibcoBRL, Gaithersburg, MD, USA). The number of EDU-stained HCC cells was observed under a fluorescent microscope, and the number of cells was calculated using Image J software.
Wound Healing Assay
The HCC cells were inoculated into 6-well plates. When the cell fusion degree is more than 95%, use a 200ul pipette tip to draw crosshairs along the ruler in the center of each well. The waste medium was absorbed, the cells were washed with PBS twice, and the serum-free medium or 1–2% serum reduction medium was added. HCC cells were cultured in an incubator. The healing was observed by Olympus microscope at 0h, 24h, 48h and 72h. Finally, the cell mobility was analyzed by ImageJ software, and the specific calculation method was as follows: first, the difference of scratch area between 0h and 72h was calculated, and then the ratio of this value to 0h scratch area was calculated.
Migration Assay
The HCC cells (2×10⁴) and 250uL serum reducing medium were added to the upper chamber of each Transwell chamber (aperture 8um), and 600uL medium containing 20% fetal bovine serum was added to the lower chamber. After 24 hours, the transwell chamber was fixed in 5% paraformaldehyde for about 30 minutes, then washed twice with PBS and stained with crystal violet for 30 minutes. Then the chamber was cleaned by PBS and the upper cavity was gently wiped with a medical cotton ball. Finally, the positive microscope was used to take pictures, and the number of migrated cells was calculated by ImageJ software.
3D Spheroid Invasion Assay
The HCC cells were centrifuged and fully mixed with DMEM medium, and the pH value of type I collagen (Corning) was adjusted to 7–7.5. Then, the HCC cell suspension was mixed with type I collagen solution in equal proportion and added to the 96-well culture plate (Corning, USA). The mixture was incubated in a 37 °C incubator for 40 minutes and 160 μL DMEM medium was added to each well. Three days later, the invasion of HCC cell spheres was observed by inverted microscope (ZEISS). Finally, the proportion of tumor sphere invasion area was calculated by ImageJ software.
Western Blotting
A RIPA lysis buffer (Beyotime, Shanghai, China) was used to extract total protein from cells. Following the instructions of the bicinchoninic acid protein assay kit (Beyotime, Nantong, China), the protein concentration was determined. Sodium dodecyl sulfate-polyacrylamide gel electrophoresis was used to separate proteins, which were then transferred to polyvinylidene fluoride membranes (Merck Millipore, Burlington, MA, USA). These were incubated overnight with primary antibodies after being blocked with fast blocking solution (Beyotime, Shanghai, China) for 30 minutes. These were incubated with secondary antibody for 2 hours at 37°C. Finally, the target protein bands were exposed using SuperECL detection reagent (Yeasen, Shanghai, China) and ImageLab software (Bio-Rad, Hercules, CA, USA). Antibody information involved in this experiment was placed in the supplementary material (Table S2).
Dual-Luciferase Reporter Assay
The plasmid containing wild type or mutant fragments of AC006329.1 and SHC3 3’-UTR and miR-127-5p mimics or NC duplex (labeled with firefly luciferase) was co-transfected into HEK293T cells for 2 days. Then, under the guidance of Bio-Lite Luciferase Assay System (Vazyme, Nanjing, China), the luciferase activity of HEK293T cells was detected with a fluorometer.
Xenograft in Nude Mice
In this experiment, BABL/cNude male nude mice (6 weeks old) were purchased from the Model Animal Research Center of Nanjing Medical University (Nanjing, China). In the subcutaneous tumor formation experiment, all mice were randomly divided into 4 groups(1–4) with 3 mice in each group. The four groups of nude mice were subcutaneously inoculated with Hep-3B cells (ov-AC006329.1, ov-NC, ov-AC006329.1+mi-miR-127-5p and ov-AC006329.1+sh-SHC3) (1×10⁷/mL). The tumor size was observed regularly and the subcutaneous tumor volume was measured every 5 days. In the lung metastasis experiment, all mice were randomly divided into 4 groups(5–8) with 5 mice in each group. The four groups of nude mice were injected into the tail vein with Hep-3B cells (1×10⁷/mL) of ov-AC006329.1, ov-NC, ov-AC006329.1+mi-miR-127-5p and ov-AC006329.1+sh-SHC3 respectively, and the daily growth of mice was observed regularly. After 30 days, the nude mice in group 1–4 were sacrificed, the subcutaneous tumor was removed and the tumor volume was measured. After 8 weeks, the mice in group 5–8 were sacrificed, the lung tissue was stripped and fixed with tissue fixation solution. Paraffin samples of lung tissue were prepared and sectioned for HE staining. This experiment was approved and authorized by the Ethics Committee of the first affiliated Hospital of Nanjing Medical University.
Immunohistochemical Staining
Subcutaneous tumors were fixed with 4% paraformaldehyde, embedded in paraffin and made into sections. The expression levels of Ki-67 and SHC3 were detected by immunohistochemical staining using specific antibodies against Ki-67 and SHC3 (Proteintech, Wuhan, China).
Immunofluorescence
The Slide were placed on the bottom of a 96-well plate and treated HCC cells were added. After the cells were attached, they were fixed with paraformaldehyde, lysed with Triton lysate, and blocked with goat serum for 30 minutes. HCC cells were incubated overnight with primary antibodies. After incubation with fluorescent secondary antibody (Proteintech) for 1 hour, nuclei were labeled with DAPI (Proteintech). Images were taken with a confocal microscope.
Statistical Analysis
The experimental data were analyzed by chi-square test or Student’s t-test in GraphPadPrismv8.0.2 (GraphPadSoftware, SanDiego, California, USA). Pearson correlation test was used to analyze the correlation of gene or non-coding RNA expression levels. All the experiments in this study were repeated at least three times, and the average and standard deviation were shown in averages and charts (*P < 0.05, **P < 0.01, ***P < 0.001, ****P<0.001).
Results
AC006329.1 is High Expressed in HCC and Correlated with Poor Prognosis
First of all, we screened the sequencing results of three pairs of liver cancer tissues and normal tissues adjacent to cancer and the heatmap of sequencing results was displayed as follows(threshold, |logFC|>1 and P<0.05) (Figure 1A). We found that the expression of AC006329.1 in HCC was significantly higher than that in normal liver tissue by sequencing(SUB13505892). QRT-PCR analysis showed that the expression levels of AC006329.1 in HCC tissues and cell lines were significantly higher than those in normal tissues and hepatocytes (Figure 1B and C). The results of pan-cancer analysis of AC006329.1 through LncCAR (https://lncar.renlab.org/) showed that AC006329.1 was highly expressed in many cancer tissues, including HCC, in TCGA database (Figure 1D). Kaplan-Meier survival curve of AC006329.1 based on the GEPIA2 database (http://gepia2.cancer-pku.cn/#index) showed that patients with high expression of AC006329.1 had significantly less disease-free survival (DFS) than those with low expression (Figure 1E). HCC tissues were divided into two groups according to the median of AC006329.1 expression level. Although there was no significant statistical difference between clinical data of high and low expressed groups(P>0.05), we found that the number of HCC patients with liver cirrhosis or multiple tumors in high expressed group was more than that in low expressed group (Table 1). Next, the cox proportional hazards model of HCC patients showed that AC006329.1, microvascular invasion, clinical TNM stage and Edmondson pathological stage could be used as independent risk factors for judging the prognosis of HCC patients (Table 2). In addition, Kaplan-Meier survival curve showed that patients with low expression of AC006329.1 had longer overall survival (OS) than those with high expressed AC006329.1 (Figure 1F). Next, AC006329.1 was predicted mainly expressed in the cytoplasm of cells by LncLocator database (http://www.csbio.sjtu.edu.cn/bioinf/lncLocator/) (Figure 1G). Then we confirmed that the expression level of AC006329.1 in the cytoplasm of HCC cells was higher than that in the nucleus by qRT-PCR analysis (Figure 1H). The results showed that AC006329.1 was mainly expressed in the cytoplasm, which indicated that AC006329.1 may be a ceRNA. According to the expression level of AC006329.1 the highest in MHCC-LM3 cells and the lowest in Hep-3B cells (Figure 1D), we constructed AC006329.1 overexpression model in Hep-3B cells and AC006329.1 knockdown model in MHCC-LM3 cells. At the same time, the transfection efficiency of ov-AC006329.1 plasmids and si-AC006329.1 in Hep-3B and MHCC-LM3 cells was also shown in the chart (Figure 1I and J).
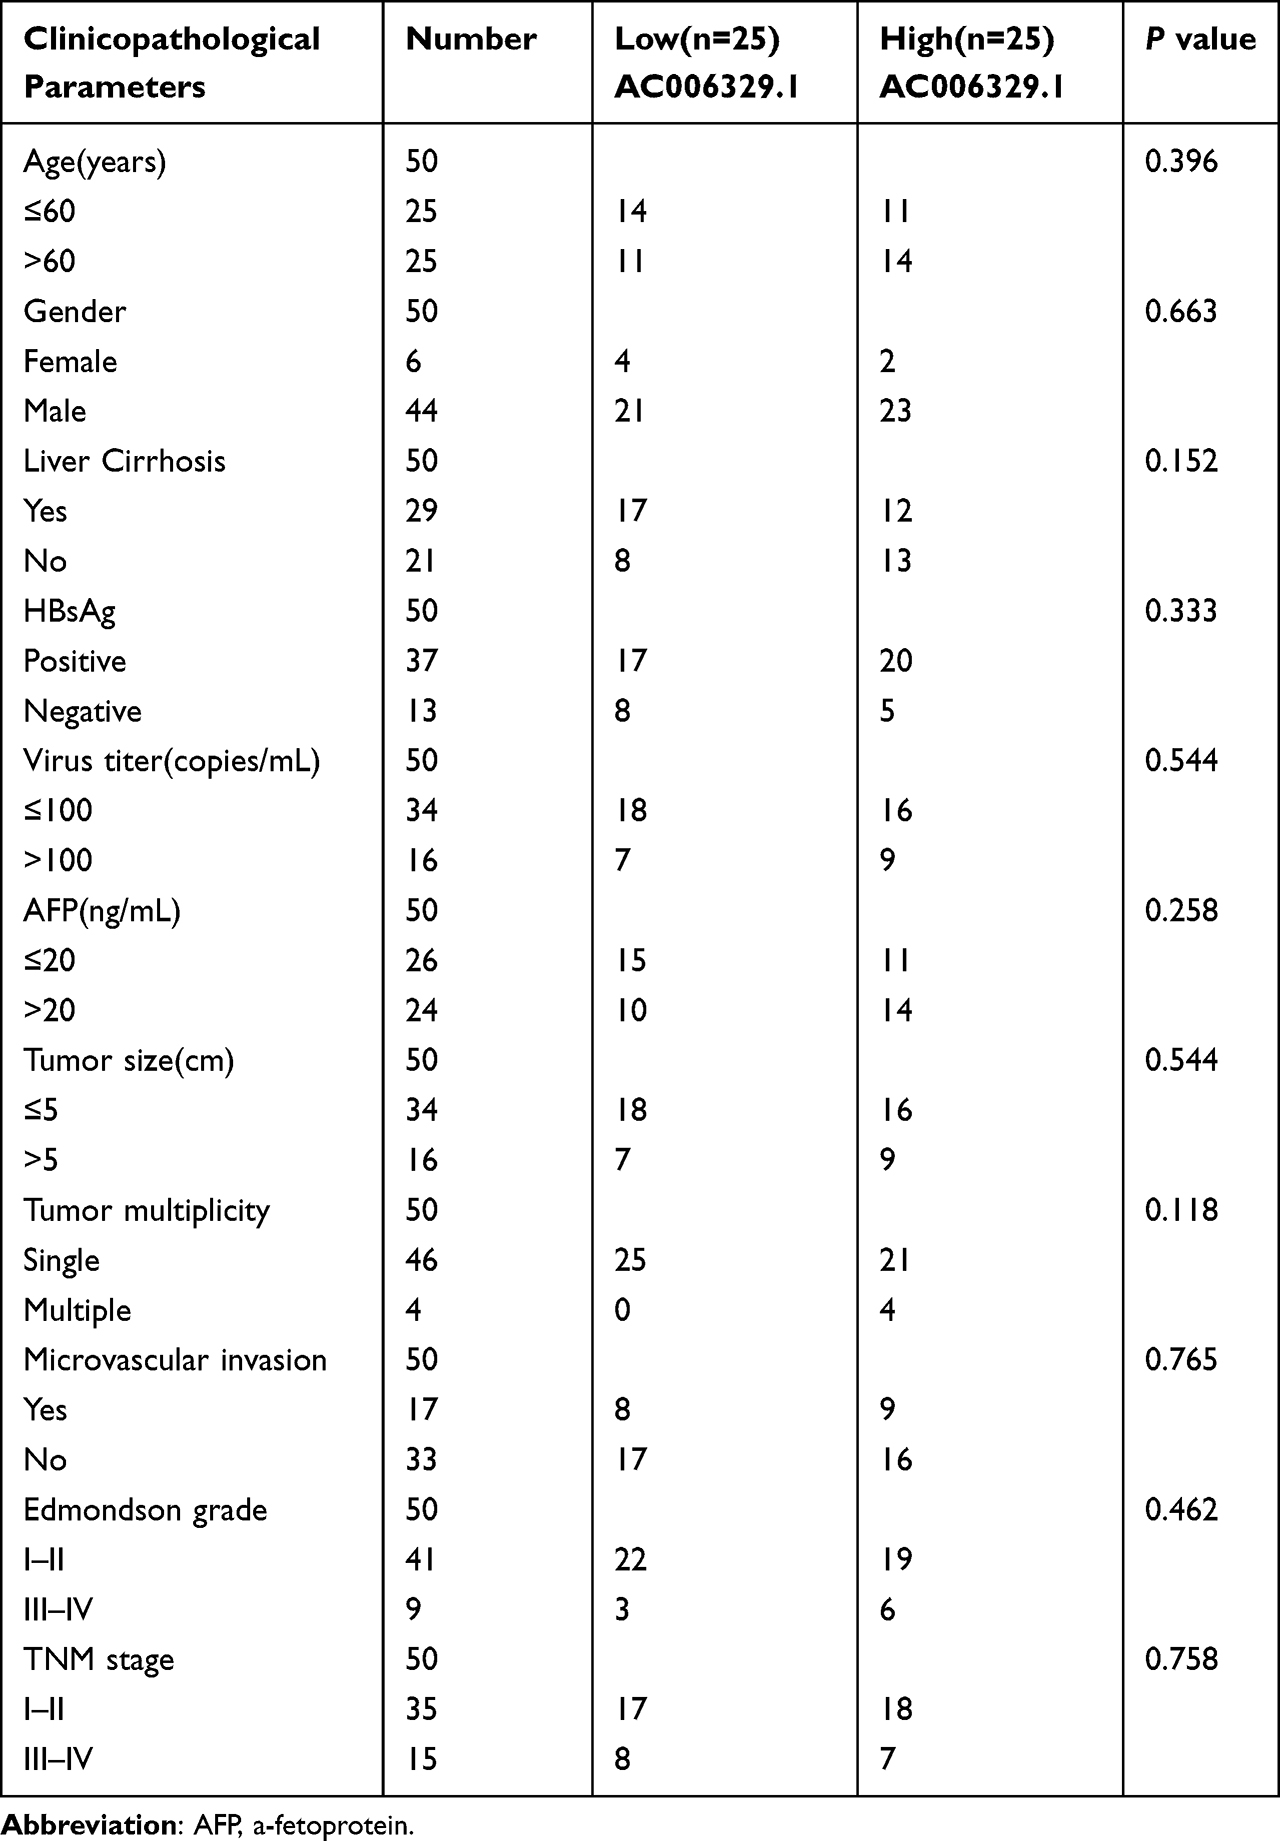 |
Table 1 Association Between AC006329.1 Expression and the Clinicopathological Features of Patients with Hepatocellular Carcinoma.(n = 50) |
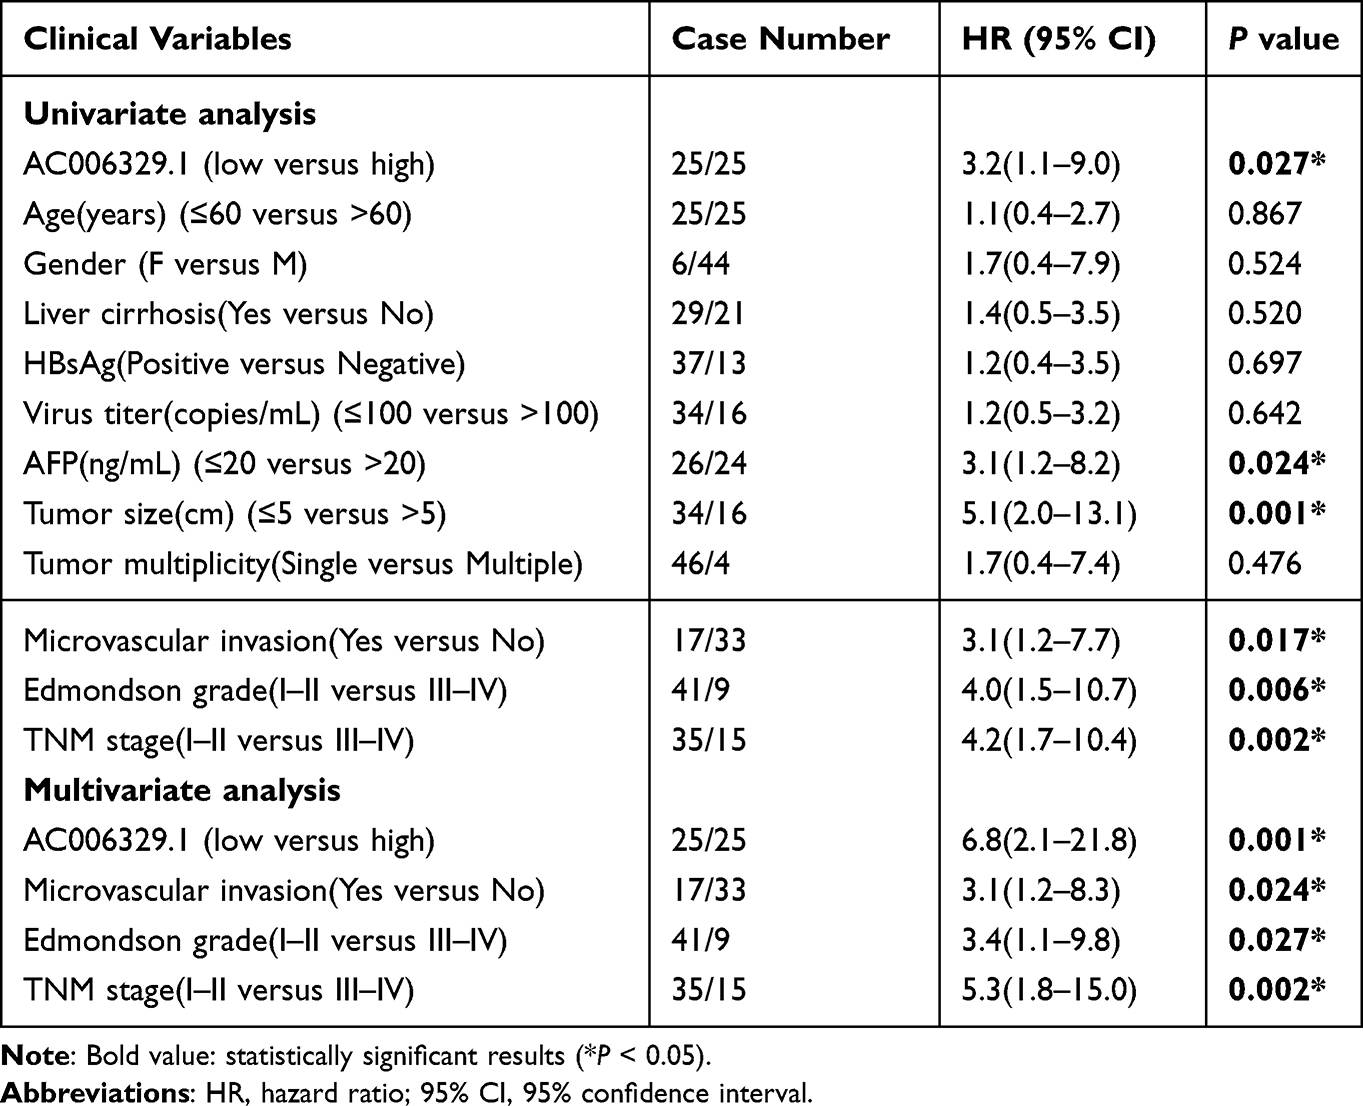 |
Table 2 The Cox Proportional Hazards Model of the Relationship Between AC006329.1 Expression and Clinicopathological Features of Hepatocellular Carcinoma |
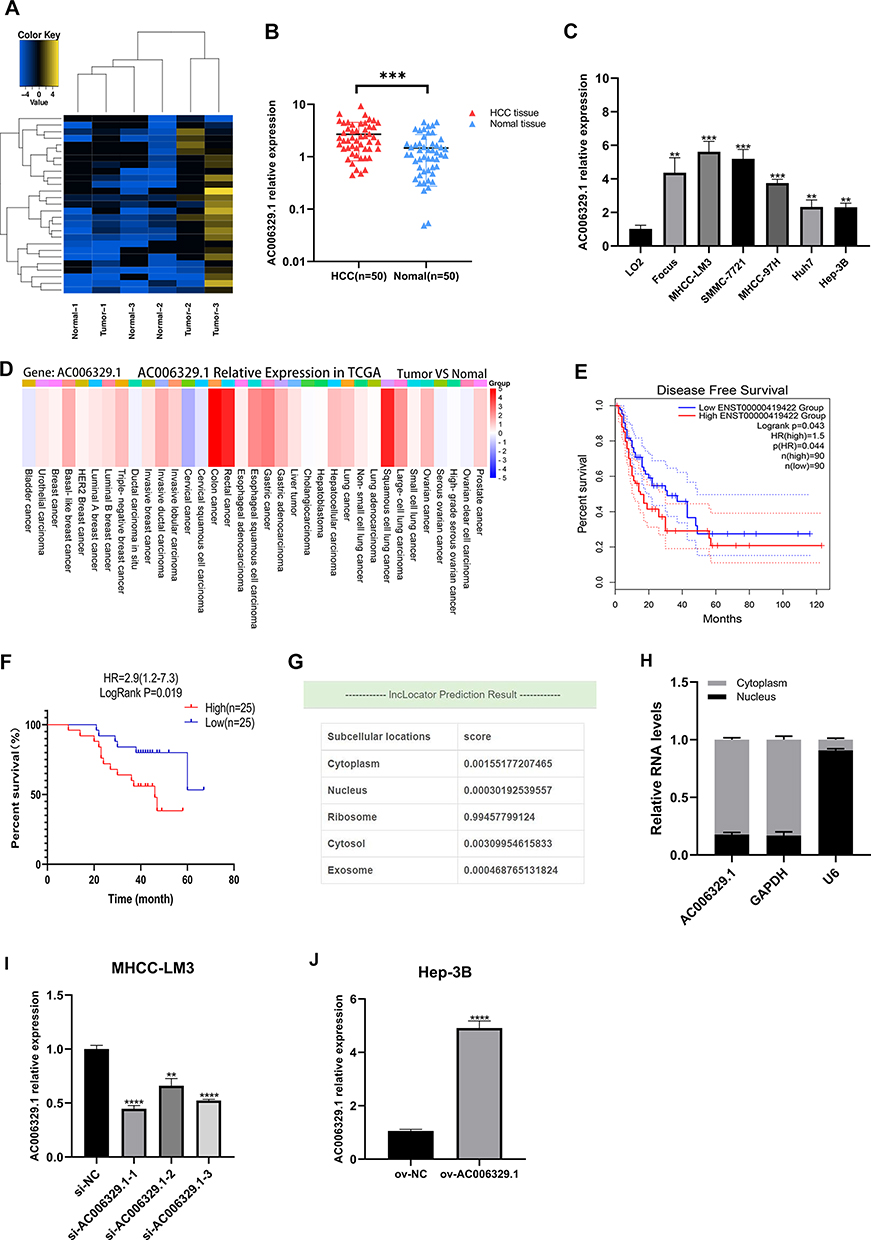 |
Figure 1 AC006329.1 is high expressed in HCC and correlated with poor prognosis. (A) The heatmap of sequencing results; (B) qRT-PCR results of AC006329.1 expression in 50 pairs of HCC and matched paracancerous normal tissues; (C) The expression of AC006329.1 in HCC cell lines and LO2 normal human hepatocytes; (D) Pan-cancerous analysis of the expression level of AC006329.1 in multiple cancerous tissues in TCGA database by LncCAR; (E) Kaplan-Meier survival curve of the relationship between the expression of AC006329.1 and DFS in HCC patients in TCGA database by GEPIA2; (F) Kaplan-Meier survival curve of the relationship between the expression of AC006329.1 and OS in HCC patients; (G) Subcellular localization map of AC006329.1 in LncLocator database; (H) Detection of subcellular localization of AC006329.1 by qRT-PCR; (I and J) The transfection efficiency of ov-AC006329.1 plasmids and si-AC006329.1 in Hep-3B and MHCC-LM3 cells. (**P < 0.01, ***P < 0.001, ****P<0.0001). |
AC006329.1 Promoted the Proliferation, Migration, Invasion and Epithelial-Mesenchymal Transformation (EMT) of HCC Cells in vitro
The results of colony formation assay, 5-Ethynyl-2’-deoxyuridine (EdU) assay and CCK-8 assay showed that the proliferation ability of Hep-3B/ov-AC006329.1 cells was stronger than that of Hep-3B/ov-NC cells, while that of MHCC-LM3/si-AC006329.1 cells was weaker than that of MHCC-LM3/si-NC cells (Figure 2A–H). Similarly, the results of wound healing assay, migration assay and 3D Spheroid Invasion assay showed that the MHCC-LM3/si-AC006329.1 cells exhibited slower migration and invasion rates than MHCC-LM3/si-NC cells and the Hep-3B/ov-AC006329.1 cells exhibited higher migration and invasion abilities than Hep-3B/ov-NC cells (Figure 2I–Q). Finally, the immunofluorescence staining and WB anaylsis of EMT markers (E-cadherin, N-cadherin and vimentin) showed that N-cadherin and vimentin were higher expressed in the Hep-3B/ov-AC006329.1 cells than those in the control group, and the expression of E-cadherin was lower than that in the control group. However, the results in MHCC-LM3/si-AC006329.1 cells and MHCC-LM3/si-NC cells were opposite (Figure 2R and S). These results suggested that AC006329.1 can promote the proliferation, migration, invasion and EMT of HCC cells.
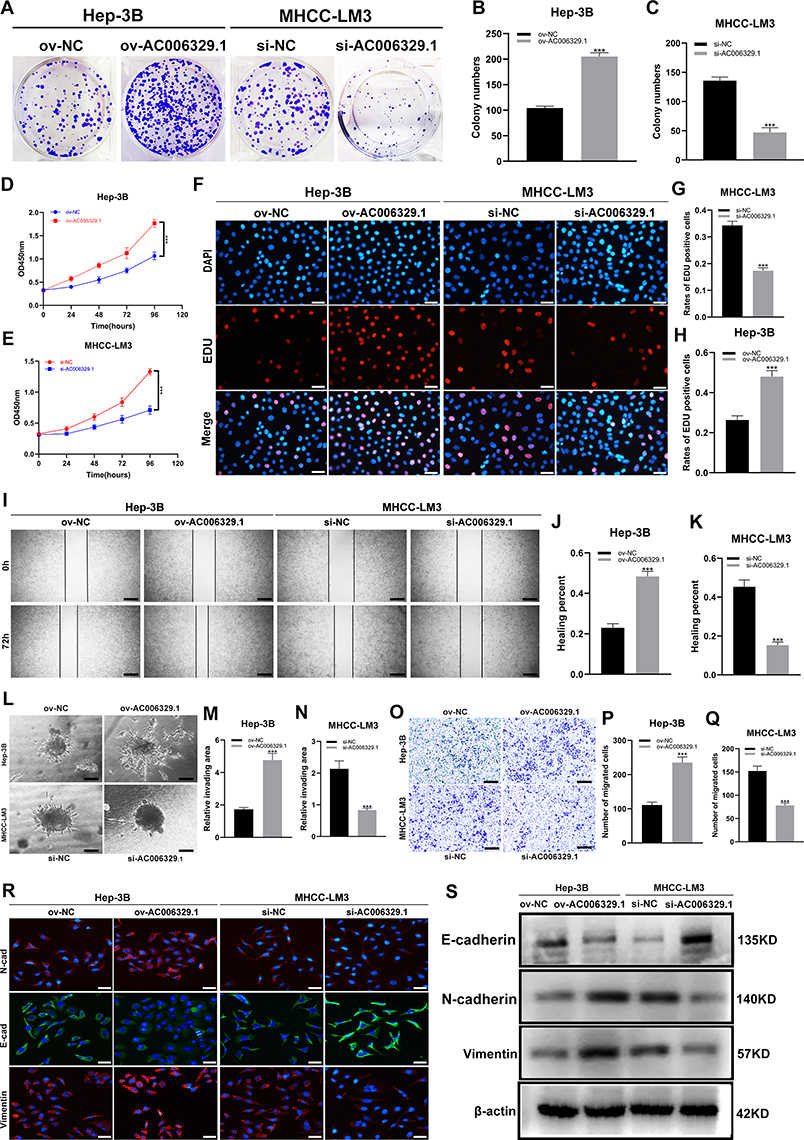 |
Figure 2 AC006329.1 promoted the proliferation, migration, invasion and epithelial-mesenchymal transformation (EMT) of HCC cells in vitro. (A–C) Colony formation assay to evaluate the proliferative ability of MHCC-LM3 cells(si-AC006329.1, si-NC) and Hep-3B cells(ov-AC006329.1, ov-NC); (D and E) CCK-8 assay to evaluate the proliferative ability of MHCC-LM3 cells(si-AC006329.1, si-NC) and Hep-3B cells(ov-AC006329.1, ov-NC); (F–H) EDU assay to evaluate the proliferative ability of MHCC-LM3 cells(si-AC006329.1, si-NC) and Hep-3B cells(ov-AC006329.1, ov-NC); Scale bar represents 25 µm. (I–K) Wound healing assay to evaluate the migration ability of MHCC-LM3 cells(si-AC006329.1, si-NC) and Hep-3B cells(ov-AC006329.1, ov-NC); Scale bar represents 100 µm. (L–N) 3D Spheroid Invasion assay to evaluate the invasive ability of MHCC-LM3 cells(si-AC006329.1, si-NC) and Hep-3B cells(ov-AC006329.1, ov-NC); Scale bar represents 50 µm. (O–Q) Transwell assay to evaluate the migration ability of MHCC-LM3 cells(si-AC006329.1, si-NC) and Hep-3B cells(ov-AC006329.1, ov-NC); Scale bar represents 100 µm. (R and S) The expressions of E-cadherin, N-cadherin and vimentin in MHCC-LM3 cells(si-AC006329.1, si-NC) and Hep-3B cells(ov-AC006329.1, ov-NC) were detected by EMT experiment (Scale bar represents 25 µm) and Western blot experiment. (***P < 0.001). |
AC006329.1 Adsorbsed miR-127-5p by Sponge Through ceRNA Action in HCC
We selected 14 miRNAs by taking the intersection of two database named LncBase (https://diana.e-ce.uth.gr/lncbasev3/home) and miRDB (https://mirdb.org/) (Figure 3A). The differentially expressed miRNAs between HCC samples (n=307) and normal liver tissues (n=50) in TCGA-LIHC database were selected by OncomiRDB (http://lifeome.net/database/oncomirdb/) according to the threshold (p < 0.05 and | Log2 (FoldChange) | > 1) (Figure 3B). By drawing Venn map, we found that hsa-miR-23a-5p, hsa-miR-23b-5p, hsa-miR-502-5p and hsa-miR-127-5p were low expressed in HCC tissues in TCGA-LIHC database (Figure 3C). Next, we verified the expression of four miRNAs in MHCC-LM3/si-AC006329.1 and Hep-3B/ov-AC006329.1 cells, among which miR-127-5p was most significantly downregulated in Hep-3B/ov-AC006329.1 cells and most significantly upregulated in MHCC-LM3/si-AC006329.1 cells (Figure 3D and E). Therefore, we think that miR-127-5p might be downstream of AC006329.1. Next, qRT-PCR showed that the expression of miR-127-5p in HCC tissues was lower than that in adjacent normal tissues (Figure 3F), and its expression in HCC cell lines was also lower than that in normal heptaocytes (Figure 3H). Next, Pearson correlation analysis showed that there was a significant negative correlation between AC006329.1 and miR-127-5p in HCC tissues (Figure 3G). In addition, we obtained predicted binding sites between AC006329.1 and miR-127-5p from miRDB (Figure 3I). Double luciferase report assay further confirmed that the luciferase activity of HEK293T cells co-transfected with miR-127-5p mimic and AC006329.1-wt was lower than that in other groups (Figure 3J). This result proves that AC006329.1 can combine with miR-127-5p, and further proves that miR-127-5p is downstream of AC006329.1. The results of pan-cancer analysis of miR-127-5p through CancerMIRNome database (http://bioinfo.jialab-ucr.org/CancerMIRNome/) showed that miR-127-5p was underexpressed in many cancer tissues, including HCC, in TCGA database (Figure 3K and L). Next, We analyzed the expression level of miR-127-5p in patients with HCC in TCGA-LIHC database by CancerMIRNome, and provided the receiver operating characteristic (ROC) curve, the area under the curve (AUC) was 0.78 (Figure 3M). Taken together, the evidence indicated that AC006329.1 can downregulate miR-127-5p as a ceRNA, so we finally selected miR-127-5p as the candidate target miRNA. Finally, we constructed miR-127-5p overexpression model in MHCC-LM3 cells and miR-127-5p knockdown model in Hep-3B cells. At the same time, the transfection efficiency of mi-miR-127-5p plasmids and in-miR-127-5p in MHCC-LM3 and Hep-3B cells was also shown in the chart (Figure 3N and O).
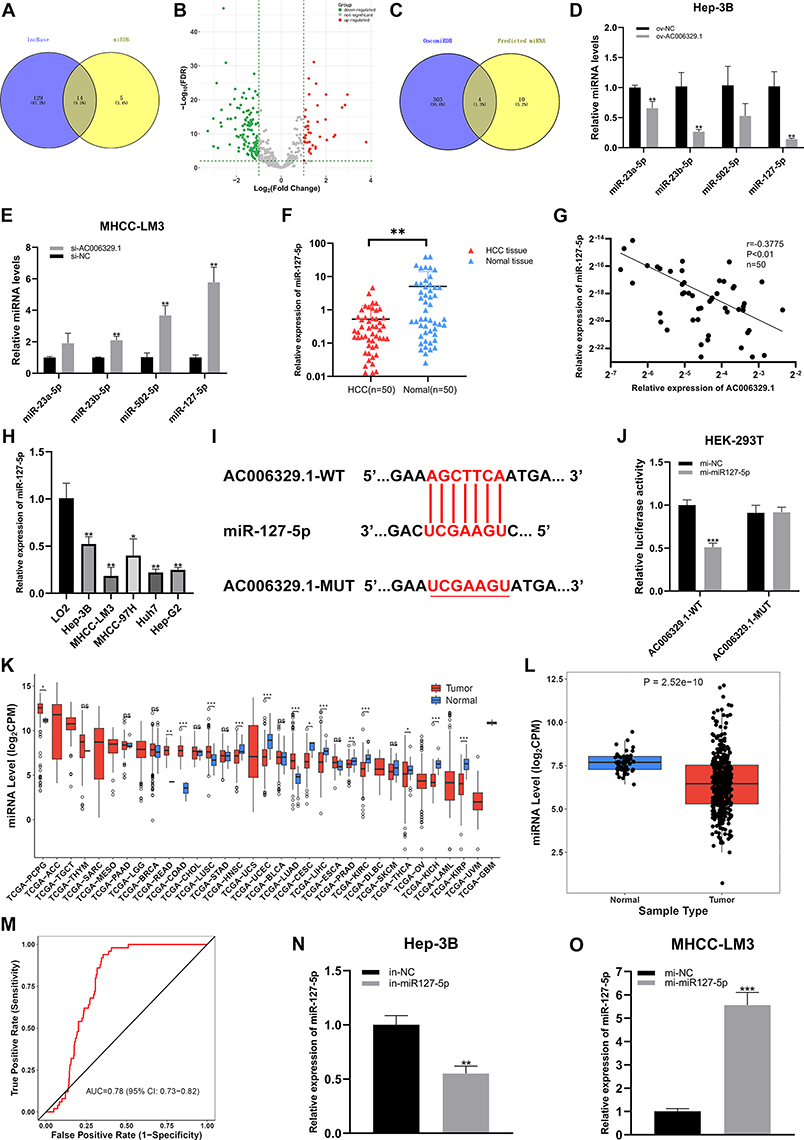 |
Figure 3 AC006329.1 adsorbsed miR-127-5p by sponge through ceRNA action in HCC. (A) Venn diagram drawn by taking the intersection of two databases of LncBase and miRDB; (B) The volcano map of differentially expressed miRNA between HCC samples (n = 307) and normal liver tissues (n = 50) in TCGA-LIHC database was selected by OncomiRDB and according to the threshold value (p < 0.05 and | Log2 (FoldChange) | > 1); (C) Venn diagram of low expression of miRNA in liver cancer tissues in TCGA-LIHC database; (D and E) The target miRNA was screened by qRT-PCR; (F) Expression of miR-127-5p in 50 pairs of HCC tissues and normal paracancerous tissues via qRT-PCR; (G) Pearson correlation analysis of the expression levels of AC006329.1 and miR-127-5p in 50 pairs of HCC tissues; (H) Expression levels of miR-127-5p in HCC cell lines and LO2 normal human liver cell lines; (I) The binding sites between AC006329.1 and miR-127-5p were predicted by miRDB; (J) Luciferase activity was measured in HEK-293T cells cotransfected with AC006329.1-wt or AC006329.1-Mut luciferase plasmid and miR-127-5p mimic or mi-NC; (K) Pan-cancerous analysis of miR-127-5p expression in cancer tissues in TCGA database by CancerMIRNome; (L) The boxplot for analyzing the expression level of miR-127-5p in HCC tissues from TCGA database by CancerMIRNome; (M) The receiver operating characteristic (ROC) curve was obtained by analyzing the expression level of miR-127-5p in patients with HCC in TCGA-LIHC database by CancerMIRNome. The area under the curve (AUC) was 0.78; (N and O) The transfection efficiency of mi-miR-127-5p plasmids and in-miR-127-5p in MHCC-LM3 and Hep-3B cells. (ns: P >0.05, *P < 0.05, **P < 0.01, ***P < 0.001). |
miR-127-5p Inhibited the Proliferation, Migration and Invasion of HCC Cells in vitro
The results of colony formation assay, 5-Ethynyl-2’-deoxyuridine (EdU) assay and CCK-8 assay showed that the MHCC-LM3/mi-miR-127-5p cells exhibited slower proliferation than MHCC-LM3/mi-NC and the Hep-3B/in-miR-127-5p cells grew much faster than Hep-3B/in-NC (Figure 4A–H). Similarly, the results of wound healing assay, migration assay and 3D Spheroid Invasion assay showed that the MHCC-LM3/mi-miR-127-5p cells exhibited slower migration and invasion rates than mi-NC cells and the Hep-3B/in-miR-127-5p cell exhibited higher migration and invasion abilities than Hep-3B/in-NC cells (Figure 4I–Q). Finally, the immunofluorescence staining and WB anaylsis of EMT markers (E-cadherin, N-cadherin and vimentin) showed that N-cadherin and vimentin were higher expressed in the Hep-3B/in-miR-127-5p cells than those in the control group, and the expression of E-cadherin was lower than that in the control group. However, the results in MHCC-LM3/mi-miR-127-5p and MHCC-LM3/mi-NC cells were opposite. These results suggest that miR-127-5p can inhibit the proliferation, migration, invasion and EMT of HCC cells (Figure 4R and S).
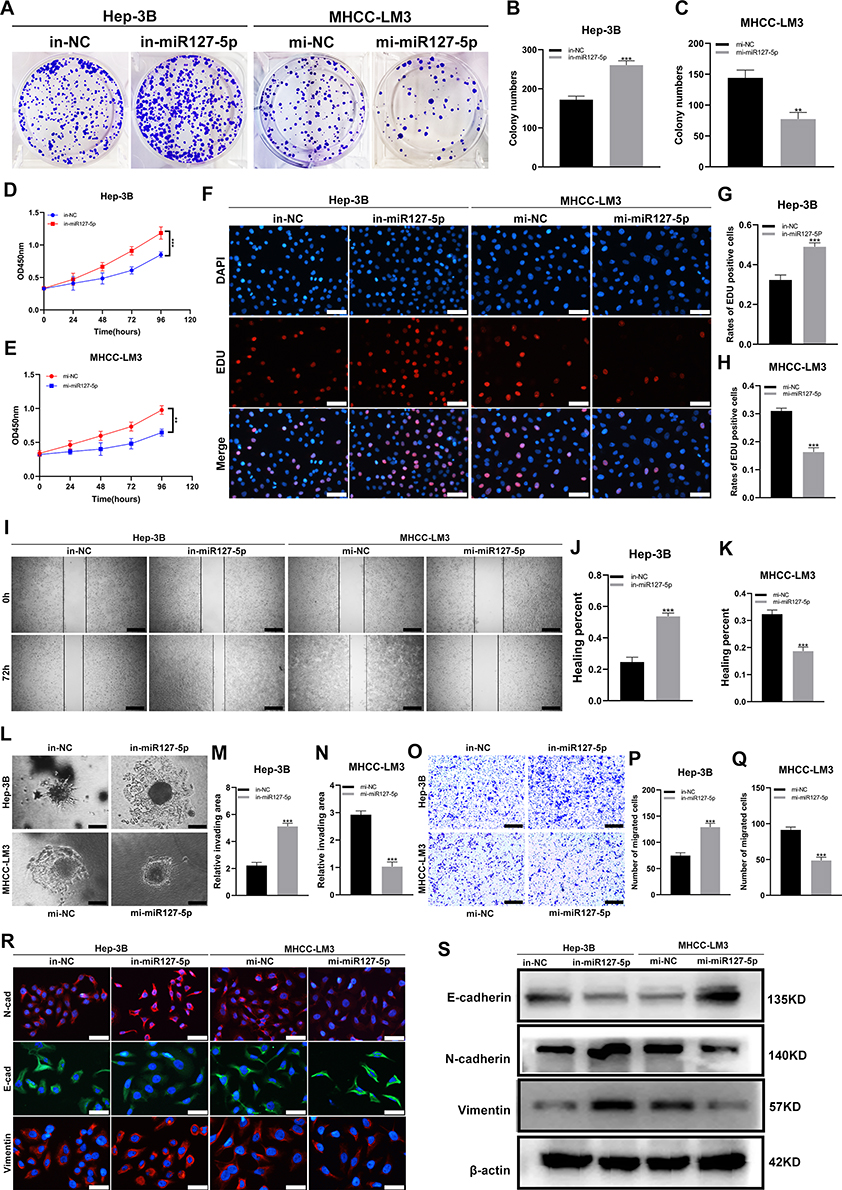 |
Figure 4 miR-127-5p inhibits the proliferation, migration and invasion of HCC cells in vitro. (A–C) Colony formation assay was used to detect the proliferation ability of Hep-3B cells (in-NC, in-miR-127-5p) and MHCC-LM3 cells (mi-NC, mi-miR-127-5p); (D and E) CCK-8 assay was used to detect the proliferation of Hep-3B cells (in-NC, in-miR-127-5p) and MHCC-LM3 cells (mi-NC, mi-miR-127-5p); (F–H) EDU assay was used to detect the proliferation ability of Hep-3B cells (in-NC, in-miR-127-5p) and MHCC-LM3 cells (mi-NC, mi-miR-127-5p); Scale bar represents 25 µm. (I-K) Wound healing assay was used to detect the migration of Hep-3B cells (in-NC, in-miR-127-5p) and MHCC-LM3 cells (mi-NC, mi-miR-127-5p); Scale bar represents 100 µm. (L–N) 3D Spheroid Invasion assay was used to detect the invasiveness of Hep-3B cells (in-NC, in-miR-127-5p) and MHCC-LM3 cells (mi-NC, mi-miR-127-5p); Scale bar represents 50 µm. (O–Q) Transwell assay was used to detect the migration of Hep-3B cells (in-NC, in-miR-127-5p) and MHCC-LM3 cells (mi-NC, mi-miR-127-5p); Scale bar represents 100 µm. (R and S) EMT(Scale bar represents 25 µm) and Western blotting were used to detect the protein expression of E-cadherin, N-cadherin and vimentin in Hep-3B cells (in-NC, in-miR-127-5p) and MHCC-LM3 cells (mi-NC, mi-miR-127-5p). (**P < 0.01, ***P < 0.001). |
SHC3 is a Target Gene of miR-127-5p
To probe the downstream mechanism of miR-127-5p, we used four miRNA target prediction databases: TargetScan (https://www.targetscan.org/vert_72/), miRDB, miRWalk (http://mirwalk.umm.uni-heidelberg.de/) and starBase(https://starbase.sysu.edu.cn/). A Venn diagram showed 111 potential target genes (Figure 5A). The differentially expressed genes between HCC samples and normal liver tissues in the TCGA-LIHC database were selected depending on the threshold (p-value<0.05 and |Log2 (FoldChange)| > 1) (Figure 5B). By drawing a Venn diagram, we discovered 8 target genes was highly expressed in HCC tissues in the TCGA-LIHC database (Figure 5C). After screening, SHC3 may be the downstream target gene of miR-127-5p. The results of pan-cancer analysis of SHC3 through Timer1.0 (http://cistrome.org/TIMER/) showed that SHC3 was highly expressed in many cancer tissues, including HCC, in TCGA database (Figure 5D). The K-M survival curve of HCC patients in TCGA database by HPA (https://www.proteinatlas.org/) showed that the lower expression of SHC3 corresponds to the longer OS time (Figure 5E). Next, qRT-PCR and WB also showed that SHC3 was up-regulated in HCC tissue (Figure 5F and G). According to the correlation curve, there was a negative correlation between the expression of SHC3 and miR-127-5p (Figure 5H). In addition, considering that AC006329.1 is upstream of miR-127-5p, and analysis results from GEPIA2 database indicate that there is a positive correlation between the expression levels of SHC3 and AC006329.1 in HCC tissues of TCGA database (Figure 5I). Therefore, we speculate that SHC3 is the target gene of miR-127-5p. Next, we obtained the binding sequence of the two from TargetScan and constructed the mutation sequence (Figure 5J). Next, double luciferase report assay further confirmed that the luciferase activity of HEK293T cells co-transfected with miR-127-5p mimic and SHC3-wt was lower than that in other groups (Figure 5K). This result proves that SHC3 can combine with miR-127-5p, and further proves that SHC3 is downstream of miR-127-5p. Next, by analyzing the TCGA-LIHC database, we further found that the expression level of SHC3 was positively correlated with the phenotypes of EMT and extracellular matrix degradation in HCC (Figure 5L). BIOCARTA pathway enrichment analysis of AC006329.1 by Starbase showed that AC006329.1 may regulate multiple signal pathways, including ERK pathway (Figure 5M). We conducted a correlation analysis on the expression levels of SHC3, ERK1 and ERK2 in the TCGA database through GEPIA2, and found that SHC3 was correlated with ERK1 and ERK2 (Figure 5N). Therefore, we predicted that the ERK pathway was the downstream of AC006329.1/miR-127-5p/SHC3 axis in HCC cells.
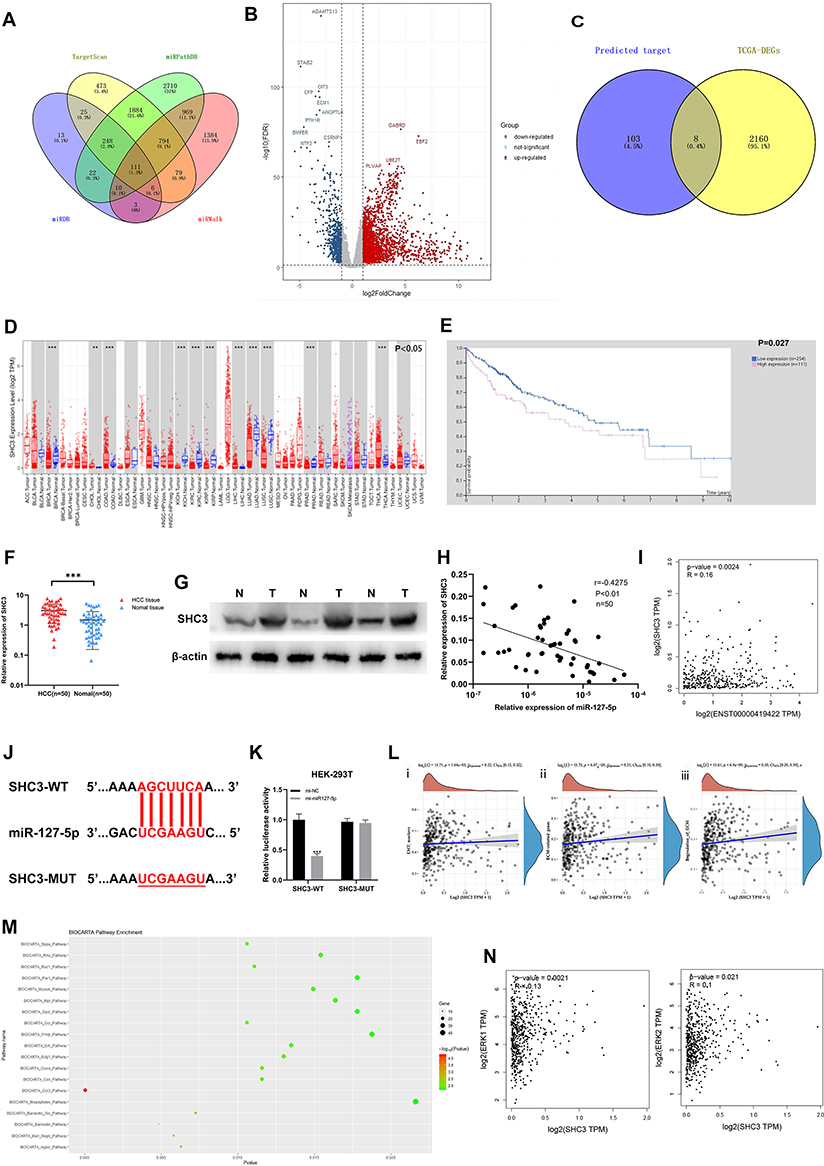 |
Figure 5 SHC3 is a target gene of miR-127-5p. (A) Venn diagram analysis showed that SHC3 can be a target gene of miR-127-5p by four databases; (B) Volcano plot of differentially expressed mRNA in the TCGA-LIHC database. Red dots represent up-regulated mRNAs and blue dots represent down-regulated mRNAs in HCC tissues (threshold, p-value < 0.05 and |log2FoldChange| > 1); (C) Venn diagram was drawn to screen out mRNA with high expression in HCC tissues from TCGA database; (D) Pan-cancer analysis of the expression level of SHC3 in cancer tissues in TCGA database by Timer1.0; (E) Kaplan-Meier survival curve of the relationship between the expression of SHC3 and OS in HCC patients; (F) The expression of SHC3 in 50 pairs of HCC tissues and matched normal adjacent tissues via qRT-PCR; (G) The expression of SHC3 in 3 pairs of HCC and paracancer tissues was detected by WB assay; (H) Pearson correlation analysis was used to analyze the correlation between miR-127-5p and SHC3 in 50 pairs of HCC tissues; (I) Correlation analysis of the expression level of SHC3 and AC006329.1 in liver cancer tissues in TCGA database by GEPIA2; (J) The binding sites between miR-127-5p and SHC3 were predicted by starBase; (K) Luciferase activity was measured in HEK-293T cells cotransfected with SHC3-wt or SHC3-Mut luciferase plasmid and miR-127-5p mimic or mi-NC; (L) Spearman correlation analysis of SHC3 expression level and EMT marker expression (i), extracellular matrix related gene expression (ii) and extracellular matrix degradation level (iii) based on TCGA database; (M) Biocarta pathway enrichment analysis of AC006329.1 through starbase database; (N) Correlation analysis of expression levels of SHC3, ERK1 and ERK2 in TCGA database by GEPIA2. (**P < 0.01, ***P < 0.001,). |
AC006329.1 Promoted HCC by Regulating the miR-127-5p/SHC3/ERK Axis
To further explore the effect of the AC006329.1/miR-127-5p/SHC3/ERK axis in HCC, we treated Hep-3B cells with ov-NC, ov-AC006329.1, ov-AC006329.1+mi-miR-127-5p and ov-AC006329.1+si-SHC3. The results of colony formation assay, 5-Ethynyl-2’-deoxyuridine (EdU) assay and CCK-8 assay showed that the Hep-3B/ov-AC006329.1+si-SHC3 and Hep-3B/ov-AC006329.1+mi-miR-127-5p cells effectively reversed the proliferation ability of Hep-3B/ov-AC006329.1 cells (Figure 6A–E). Similarly, the results of wound healing assay, migration assay and 3D Spheroid Invasion assay showed that the Hep-3B/ov-AC006329.1+si-SHC3 and Hep-3B/ov-AC006329.1+mi-miR-127-5p cells effectively reversed the migration and invasion abilities of Hep-3B/ov-AC006329.1 cells (Figure 6F–J). Moreover, the upregulation of EMT-related proteins (N-cadherin and vimentin), p-ERK and SHC3 and downregulation of E-cadherin by Hep-3B/ov-AC006329.1 could also be reversed by Hep-3B/ov-AC006329.1+mi-miR-127-5p and Hep-3B/ov-AC006329.1+si-SHC3 cells (Figure 6K and L). These results suggested that AC006329.1 could promote HCC cell proliferation, migration, invasion and EMT by miR-127-5p/SHC3/ERK axis.
 |
Figure 6 AC006329.1 promoted HCC by regulating the miR-127-5p/SHC3/ERK axis. (A and B) Colony formation assay showed that both mi-miR-127-5p and si-SHC3 reversed the enhancement of ov-AC006329.1 in HCC cell proliferation; (C) CCK-8 assay showed that both mi-miR-127-5p and si-SHC3 reversed the enhancement of ov-AC006329.1 in HCC cell proliferation; (D and E) EDU assay showed that both mi-miR-127-5p and si-SHC3 reversed the enhancement of ov-AC006329.1 in HCC cell proliferation; Scale bar represents 25 µm. (F and G) Wound healing assay showed that both mi-miR-127-5p and si-SHC3 reversed the enhancement of ov-AC006329.1 in HCC cell proliferation; Scale bar represents 100 µm. (H–J) 3D Spheroid Invasion assay and transwell assay showed that both mi-miR-127-5p and si-SHC3 reversed the enhancement of ov-AC006329.1 in HCC cell invasion and migration; Scale bar represents 50 µm. (K) The protein expression of E-cadherin, N-cadherin and vimentin was measured by EMT assay; Scale bar represents 25 µm. (L) The protein expression of E-cadherin, N-cadherin, vimentin, SHC3 and p-ERK was measured by and Western blotting assay in Hep-3B cells. (*P<0.05, **P < 0.01, ***P < 0.001). |
AC006329.1 Promoted the Progression and Metastasis of HCC in vivo
To explore the function of AC006329.1 in vivo, we built nude mouse models with the subcutaneous injection of Hep-3B cells transfected with ov-NC, ov-AC006329.1, ov-AC006329.1+in-miR-127-5p and ov-AC006329.1+sh-SHC3. Tumor volumes and weights of nude mice were measured and calculated after 1 month, which showed that the ov-AC006329.1 group grew larger than the ov-NC group, whereas the ov-AC006329.1+in-miR-127-5p and ov-AC006329.1+sh-SHC3 groups fell in between (Figure 7A–C). In addition, immunohistochemistry of Ki67 and SHC3 levels in the four groups showed that the ov-NC, ov-AC006329.1+in-miR-127-5p and ov-AC006329.1+sh-SHC3 groups contained lower expression of Ki67 and SHC3 than the ov-AC006329.1 group (Figure 7D). In addition, the ov-AC006329.1 increased the number of metastatic nodules in lung tissue and had the strongest enhancement effect in ov-AC006329.1 (Figure 7E and F). These results suggest that AC006329.1 may promote the proliferation and growth of HCC cells in vivo through targeted regulation of miR-127-5p/SHC3/ERK axis. Finally, We draw a simple pattern to discribed that AC006329.1 promotes the occurrence and development of HCC by miR-127-5p/SHC3/ERK axis (Figure 8).
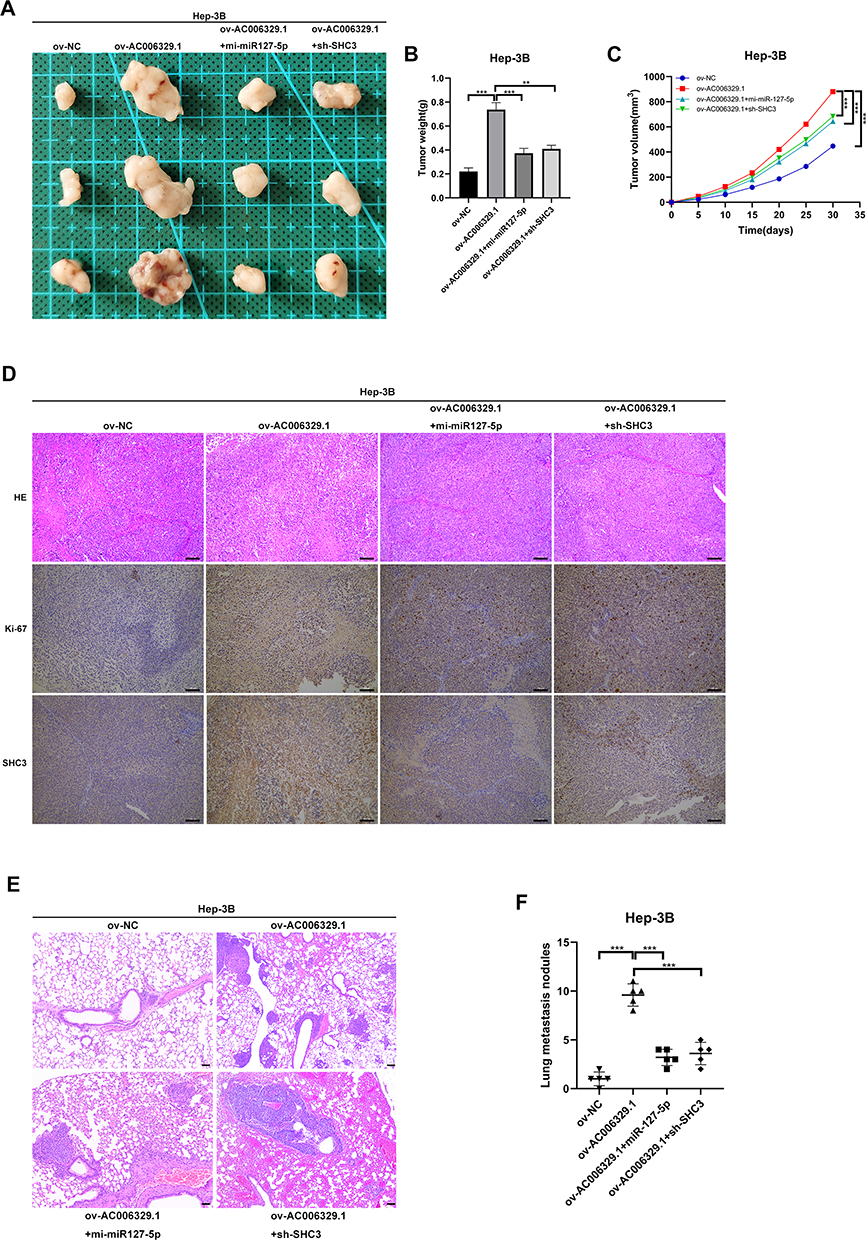 |
Figure 7 AC006329.1 promoted the progression and metastasis of HCC cells in vivo. (A) Photos of subcutaneous tumors in different groups of nude mice; Scale bar represents 100 µm. (B) Histogram of final weight of subcutaneous tumors in four groups of nude mice; (C) Volume growth curves of subcutaneous tumors in four groups of nude mice; (D)The expression levels of Ki67 and SHC3 in subcutaneous tumor tissues of four groups detected by hematoxylin and eosin staining and immunohistochemistry; (E) H&E staining images of lung metastasis of nude mice injected with Hep-3B cells in the above four groups; Scale bar represents 100 µm; (F) The number of lung metastatic nodules in the above four groups. (**P < 0.01, ***P < 0.001). |
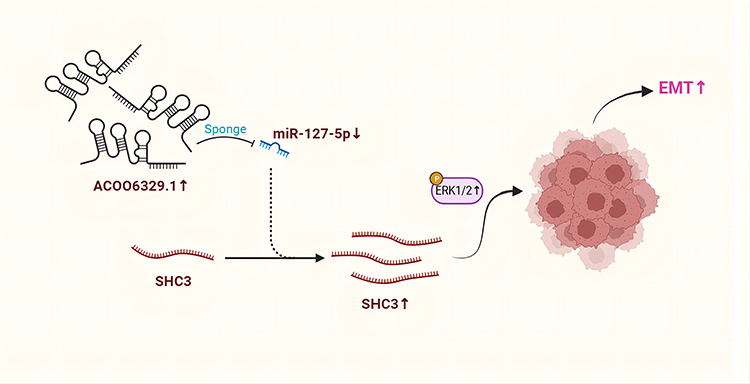 |
Figure 8 A simple pattern of targeted regulation of miR-127-5p/SHC3/ERK axis by AC006329.1 to promote the occurrence and development of HCC. |
Discussion
HCC is occult and the early symptoms are not obvious. Many HCC patients are not diagnosed until the middle and late stage, and the prognosis is very poor. The pathological mechanism of HCC is extremely complex, which is not completely clear at present. Therefore, there is an urgent need to find new molecular therapeutic targets.
Long non-coding RNA (LncRNA) plays an important role in the pathogenesis of cancer. Many lncRNA have been shown to play a key role in the proliferation, invasion and metastasis of cancer cells.9 For example, LINC-ZFPM2-AS1 can promote the occurrence and development of HCC.10 For instance, Knockdown of LINC-TP73‐AS1 inhibited breast cancer cell proliferation, migration and invasion.11 In addition, LINC-AFAP1-AS1 might be an oncogenic lncRNA that promoted GC progression by functioning as a ceRNA to regulate FGF7 expression via sponging miR-155-5p.12 Through the sequencing report, we found that AC006329.1 was highly expressed in HCC tissues, so we thought that AC006329.1 might be related to the pathogenesis of HCC. We also proved through experiments that AC006329.1 can promote the occurrence and development of HCC, and is related to the prognosis of HCC patients.
LncRNAs performs these functions through a variety of mechanisms, including acting as a molecular scaffold for “guiding” chromatin modifying enzymes, as a competitive endogenous RNAs (CeRNAs) “sponge” microRNAs or protein, promoting or inhibiting long-distance chromatin interactions, even through transcription itself.13 In terms of mechanism, the competitive endogenous RNA (ceRNA) hypothesis has been reported as a classic model for regulating gene expression. CeRNA network shows that lncRNA can play the role of microRNA (miRNA) sponge by competitively combining miRNA, thus eliminating the inhibition function of miRNA in specific target messenger RNA (mRNA). More and more studies have shown that lncRNAs localized in the cytoplasm can act as ceRNAs to play a role and affect the progression of cancer.14 For example, LINC01194 can regulate the proliferation and migration of HCC cells through the miR-655-3p/SMAD5 axis.15 For example, LINC-DANCR promotes HCC development and mediates EMT by decoying miR‐27a‐3p and regulating ROCK1/LIMK1/COFILIN pathway.16 Through nuclear separation experiments and PCR verification, we found that AC006329.1 mainly exists in the cytoplasm, so we speculate that AC006329.1 also affects the occurrence and development HCC through a competitive endogenous mechanism. Next, we screened 4 miRNAs through three databases(lncBase, miRDB and OncomiRDB), and we confirmed miR-127-5p as the research object through PCR verification. The results of the luciferase reporter assay indicated that there was a correlation between AC006329.1 and miR-127-5p. In addition, many literatures have reported that miR-127-5p plays a role in the occurrence and development of various cancer. For instance, circRNA hsa_circ_0110389 promotes gastric cancer(GC) progress through the miR-127-5p/SORT1 axis.17 In addition, miR-127-5p inhibits the growth of HCC cells by regulating the expression of TRIM25 and IGF2BP3 genes.18 We also proved through a series of experiments that upregulation of miR-127-5p can inhibited the proliferation, invasion and migration of HCC. In addition, mouse xenograft experiments proved that AC006329.1 can significantly promote the growth of subcutaneous tumors in mice.
Triggered by tumor microenvironment(TME), the activation of EMT is the basis of the transformation to malignant tumor, accompanied by a large number of cellular changes at many levels. Classic EMT events lead to the loss of tissue epithelial integrity, allowing cancer cells to invade and spread.19 More and more literatures have shown that lncRNA can regulate EMT in human cancer. For example, LINC-SNHG6 can activate TGF- β / Smad signal pathway by targeting UPF1 and induce EMT by regulating ZEB1, thus promoting the proliferation, invasion and migration of colorectal cancer cells.20 For example, LINC00355 promotes EMT and metastasis of bladder cancer cells through the miR-424-5p/HMGA2 axis.21 Our study found that the expression of adhesion-related proteins (N-cadherin and vimentin) was high and E-cadherin was low in Hep-3B/ov-AC006329.1 cells, but the opposite result was obtained in MHCC-LM3/si-AC006329.1 cells, indicating that AC006329.1 can also promote EMT in HCC cells.
Many recent studies have confirmed that the lncRNA-miRNA-mRNA interaction network plays an important role in the pathogenesis of cancer, including HCC. For example, LINC-MCM3AP‐AS1 was up‐regulated in colorectal cancer(CRC) and promoted CRC tumorigenesis and progression via MCM3AP‐AS1/miR‐193a‐5p/SENP1 axis.22 For example, LINC-RHPN1-AS1 drives the progression of HCC via regulating miR-596/IGF2BP2 axis.23 For instance, LINC-RUSC1-AS1 promotes the malignancy of cervical cancer cells in vitro and in vivo by acting as a ceRNA on miR-744 and thereby increasing Bcl-2 expression.24 Therefore, we found the target gene SHC3 of miR-127-5p through the database. ShC3 is ectopically overexpressed in various cancers, such as high-grade glioblastomas, neuroblastomas, thyroid carcinoma, and HCC.25–28 We proved that miR-127-5p can down-regulate SHC3 to inhibit the development of HCC by luciferase report experiment and functional experiment. Rescue studies have shown that both Hep-3B/ov-AC006329.1+mi-miR-127-5p and Hep-3B/ov-AC006329.1+si-SHC3 can reverse the tumor-promoting effect of Hep-3B/ov-AC006329.1, further suggesting that AC006329.1 can up-regulate SHC3 through negative regulation of miR-127-5p. In addition, we confirmed that both Hep-3B/ov-AC006329.1+mi-miR-127-5p and Hep-3B/ov-AC006329.1+si-SHC3 can reverse the tumor-promoting effect of Hep-3B/ov-AC006329.1 in xenograft tumor model. Finally, WB experiment and bioinformatics analysis confirmed that AC006329.1 finally played a role in promoting cancer by activating ERK pathway. In addition, recent studies have found that ERK pathway plays a role in tumors. For example, AREG may play a critical role in cell migration, invasion, and EMT by activating the EGFR/ERK/NF-κB signalling pathway in pancreatic cancer cells.29 In addition, downregulation of NETO2 reduced proliferation and metastasis capability via ERK and PI3K/AKT pathways by regulating Nrf2 expression.30 These results also make our conclusions more convincing. Due to time and other reasons, our research also has some deficiencies. For example, the upstream mechanism of AC006329.1 was not explored clearly, and the influence of the tumor microenvironment on HCC cells was not explored. We will further explore in follow-up experiments, hoping to reveal the mechanism of HCC occurrence and development in a more in-depth and comprehensive manner.
Conclusion
In summary, AC006329.1 can inhibit the expression of miR-127-5p and up-regulate the expression of SHC3 by acting as a sponge of miR-127-5p, thereby enhancing the ability of proliferation, invasion and metastasis of HCC cells. Therefore, we believe that the AC006329.1/miR-127-5p/SHC3/ERK signaling pathway provides a new direction for the treatment of HCC.
Institutional Review Board Statement
This study and the publication of clinical data were approved by the Ethics Committee of The First Affiliated Hospital of Nanjing Medical University(Approval Code: 2022-SRFA-221, Approval Date: 28 February November 2022). Written informed consent was also signed by patients and their guardians. Our research has been carried out in accordance with The Code of Ethics of the World Medical Association (Declaration of Helsinki). Animal experiments were also approved by the Animal Ethics Committee of Nanjing Medical University (Nanjing, China) (Approval Code: 2111041, Approval Date: 17 November 2021). Animal experiments is conducted in accordance with ARRIVE Guidelines and the US Public Health Service Policy on the Humane Care and Use of laboratory animals.
Consent for Publication
The content of this manuscript has not been published or submitted for publication elsewhere. All the authors have contributed significantly, and that all authors are in agreement with the content of the manuscript.
Author Contributions
All authors made a significant contribution to the work reported, whether that is in the conception, study design, execution, acquisition of data, analysis and interpretation, or in all these areas; took part in drafting, revising or critically reviewing the article; gave final approval of the version to be published; have agreed on the journal to which the article has been submitted; and agree to be accountable for all aspects of the work.
Funding
This study was supported by the Natural Science Foundation of China Project (81871260).
Disclosure
The authors report no conflicts of interest in this work.
References
1. Huang Z, Zhou J-K, Peng Y, et al. The role of long noncoding RNAs in hepatocellular carcinoma. Mol Cancer. 2020;19(1):77. doi:10.1186/s12943-020-01188-4
2. Lin J, Wu L, Bai X, et al. Combination treatment including targeted therapy for advanced hepatocellular carcinoma. Oncotarget. 2016;7(43):71036–71051. doi:10.18632/oncotarget.11954
3. Zhang X, Wszolek ZK, Wolters EC, et al. Mechanisms and functions of long non-coding RNAs at multiple regulatory levels. Int J Mol Sci. 2019;20(22):5573. doi:10.3390/ijms20225573
4. Wang Y, Yang L, Chen T, et al. A novel lncRNA MCM3AP-AS1 promotes the growth of hepatocellular carcinoma by targeting miR-194-5p/FOXA1 axis. Mol Cancer. 2019;18(1):28. doi:10.1186/s12943-019-0957-7
5. Pradhan AK, Emdad L, Das SK, et al. The Enigma of miRNA regulation in cancer. Adv Cancer Res. 2017;135:25–52.
6. Song J, Wang Q, Luo Y, et al. miR-34c-3p inhibits cell proliferation, migration and invasion of hepatocellular carcinoma by targeting MARCKS. Int J Clin Exp Pathol. 2015;8(10):12728–12737.
7. Khan A, Zhang X. Function of the Long Noncoding RNAs in hepatocellular carcinoma: classification, molecular mechanisms, and significant therapeutic potentials. Bioengineering. 2022;9:8.
8. Teng F, Zhang J-X, Chang Q-M, et al. LncRNA MYLK-AS1 facilitates tumor progression and angiogenesis by targeting miR-424-5p/E2F7 axis and activating VEGFR-2 signaling pathway in hepatocellular carcinoma. J Exp Clin Cancer Res. 2020;39(1):235. doi:10.1186/s13046-020-01739-z
9. Smolarz B, Zadrożna-Nowak A, Romanowicz H. The Role of lncRNA in the development of tumors, including breast cancer. Int J Mol Sci. 2021;22(16):8427. doi:10.3390/ijms22168427
10. He H, Wang Y, Ye P, et al. Long noncoding RNA ZFPM2-AS1 acts as a miRNA sponge and promotes cell invasion through regulation of miR-139/GDF10 in hepatocellular carcinoma. J Exp Clin Cancer Res. 2020;39(1):159. doi:10.1186/s13046-020-01664-1
11. Liu Y, Wei G, Ma Q, et al. Knockdown of long noncoding RNA TP73-AS1 suppresses the malignant progression of breast cancer cells in vitro through targeting miRNA-125a-3p/metadherin axis. Thorac Cancer. 2020;11(2):394–407. doi:10.1111/1759-7714.13283
12. Ma H-W, Xi D-Y, Ma J-Z, et al. Long Noncoding RNA AFAP1-AS1 promotes cell proliferation and metastasis via the miR-155-5p/FGF7 axis and predicts poor prognosis in gastric cancer. Dis Markers. 2020;2020:8140989. doi:10.1155/2020/8140989
13. Liu SJ, Dang HX, Lim DA, et al. Long noncoding RNAs in cancer metastasis. Nat Rev Cancer. 2021;21(7):446–460. doi:10.1038/s41568-021-00353-1
14. Yao X, Wu L, Gu Z, et al. LINC01535 promotes the development of osteosarcoma through modulating miR-214-3p/KCNC4 Axis. Cancer Manag Res. 2020;12:5575–5585. doi:10.2147/CMAR.S232757
15. Liu Y, Liu J, Cui J, et al. Role of lncRNA LINC01194 in hepatocellular carcinoma via the miR-655-3p/SMAD family member 5 axis. Bioengineered. 2022;13(1):1115–1125. doi:10.1080/21655979.2021.2017678
16. Guo D, Li Y, Chen Y, et al. DANCR promotes HCC progression and regulates EMT by sponging miR-27a-3p via ROCK1/LIMK1/COFILIN1 pathway. Cell Prolif. 2019;52(4):e12628. doi:10.1111/cpr.12628
17. Liang M, Yao W, Shi B, et al. Circular RNA hsa_circ_0110389 promotes gastric cancer progression through upregulating SORT1 via sponging miR-127-5p and miR-136-5p. Cell Death Dis. 2021;12(7):639. doi:10.1038/s41419-021-03903-5
18. Zhang W, Zhu L, Yang G, et al. Hsa_circ_0026134 expression promoted TRIM25- and IGF2BP3-mediated hepatocellular carcinoma cell proliferation and invasion via sponging miR-127-5p. Biosci Rep. 2020;40(7):BSR20191418.
19. Brabletz S, Schuhwerk H, Brabletz T, et al. Dynamic EMT: a multi-tool for tumor progression. EMBO j. 2021;40(18):e108647. doi:10.15252/embj.2021108647
20. Wang X, Lai Q, He J, et al. LncRNA SNHG6 promotes proliferation, invasion and migration in colorectal cancer cells by activating TGF-β/Smad signaling pathway via targeting UPF1 and inducing EMT via regulation of ZEB1. Int J Med Sci. 2019;16(1):51–59. doi:10.7150/ijms.27359
21. Li WJ, Li G, Liu Z-W, et al. LncRNA LINC00355 promotes EMT and metastasis of bladder cancer cells through the miR-424-5p/HMGA2 axis. Neoplasma. 2021;68(6):1225–1235. doi:10.4149/neo_2021_210427N574
22. Zhou M, Bian Z, Liu B, et al. Long noncoding RNA MCM3AP-AS1 enhances cell proliferation and metastasis in colorectal cancer by regulating miR-193a-5p/SENP1. Cancer Med. 2021;10(7):2470–2481. doi:10.1002/cam4.3830
23. Fen H, Hongmin Z, Wei W, et al. RHPN1-AS1 drives the progression of hepatocellular carcinoma via regulating miR-596/IGF2BP2 Axis. Curr Pharm Des. 2020;25(43):4630–4640.
24. Guo Q, Zhang Q, Lu L, et al. Long noncoding RNA RUSC1-AS1 promotes tumorigenesis in cervical cancer by acting as a competing endogenous RNA of microRNA-744 and consequently increasing Bcl-2 expression. Cell Cycle. 2020;19(10):1222–1235. doi:10.1080/15384101.2020.1749468
25. Liu Y, Zhang X, Yang B, et al. Demethylation-Induced Overexpression of Shc3 Drives c-Raf-Independent Activation of MEK/ERK in HCC. Cancer Res. 2018;78(9):2219–2232. doi:10.1158/0008-5472.CAN-17-2432
26. Miyake I, Hakomori Y, Misu Y, et al. Domain-specific function of ShcC docking protein in neuroblastoma cells. Oncogene. 2005;24(19):3206–3215. doi:10.1038/sj.onc.1208523
27. De Falco V, Guarino V, Malorni L, et al. RAI(ShcC/N-Shc)-dependent recruitment of GAB 1 to RET oncoproteins potentiates PI 3-K signalling in thyroid tumors. Oncogene. 2005;24(41):6303–6313. doi:10.1038/sj.onc.1208776
28. Magrassi L, Conti L, Lanterna A, et al. Shc3 affects human high-grade astrocytomas survival. Oncogene. 2005;24(33):5198–5206. doi:10.1038/sj.onc.1208708
29. Wang L, Wang L, Zhang H, et al. AREG mediates the epithelial‑mesenchymal transition in pancreatic cancer cells via the EGFR/ERK/NF‑κB signalling pathway. Oncol Rep. 2020;43(5):1558–1568. doi:10.3892/or.2020.7523
30. Xu JC, Chen T-Y, Liao L-T, et al. NETO2 promotes esophageal cancer progression by inducing proliferation and metastasis via PI3K/AKT and ERK pathway. Int J Biol Sci. 2021;17(1):259–270. doi:10.7150/ijbs.53795
 © 2023 The Author(s). This work is published and licensed by Dove Medical Press Limited. The
full terms of this license are available at https://www.dovepress.com/terms
and incorporate the Creative Commons Attribution
- Non Commercial (unported, 3.0) License.
By accessing the work you hereby accept the Terms. Non-commercial uses of the work are permitted
without any further permission from Dove Medical Press Limited, provided the work is properly
attributed. For permission for commercial use of this work, please see paragraphs 4.2 and 5 of our Terms.
© 2023 The Author(s). This work is published and licensed by Dove Medical Press Limited. The
full terms of this license are available at https://www.dovepress.com/terms
and incorporate the Creative Commons Attribution
- Non Commercial (unported, 3.0) License.
By accessing the work you hereby accept the Terms. Non-commercial uses of the work are permitted
without any further permission from Dove Medical Press Limited, provided the work is properly
attributed. For permission for commercial use of this work, please see paragraphs 4.2 and 5 of our Terms.