Back to Journals » Journal of Hepatocellular Carcinoma » Volume 10
The Feasibility of Using Tri-Exponential Intra-Voxel Incoherent Motion DWI for Identifying the Microvascular Invasion in Hepatocellular Carcinoma
Authors Zhang Y ![]() , Sheng R, Yang C, Dai Y, Zeng M
, Sheng R, Yang C, Dai Y, Zeng M ![]()
Received 29 August 2023
Accepted for publication 21 September 2023
Published 29 September 2023 Volume 2023:10 Pages 1659—1671
DOI https://doi.org/10.2147/JHC.S433948
Checked for plagiarism Yes
Review by Single anonymous peer review
Peer reviewer comments 2
Editor who approved publication: Dr Mohamed Shaker
Yunfei Zhang,1,2,* Ruofan Sheng,1,2,* Chun Yang,2 Yongming Dai,3 Mengsu Zeng1,2
1Shanghai Institute of Medical Imaging, Fudan University, Shanghai, 200032, People’s Republic of China; 2Department of Radiology, Zhongshan Hospital, Fudan University, Shanghai, 200032, People’s Republic of China; 3School of Biomedical Engineering, ShanghaiTech University, Shanghai, 200032, People’s Republic of China
*These authors contributed equally to this work
Correspondence: Yongming Dai, School of Biomedical Engineering, ShanghaiTech University, Shanghai, 200032, People’s Republic of China, Tel +86 13917166155, Email [email protected] Mengsu Zeng, Department of Radiology, Zhongshan Hospital, Fudan University, 180 Fenglin Road, Shanghai, 200032, People’s Republic of China, Tel +86-021-64041990, Email [email protected]
Purpose: To assess the effectiveness of tri-exponential Intra-Voxel Incoherent Motion (tri-IVIM) MRI in preoperatively identifying microvascular invasion (MVI) in hepatocellular carcinoma (HCC).
Patients and Methods: In this prospective study, 67 patients with HCC were included. Metrics from bi-exponential IVIM (bi-IVIM) and tri-IVIM were calculated. Subgroup comparisons were analyzed using the independent Student’s t-test or Mann–Whitney U-test. Logistic regression was performed to explore clinical risk factors. Diagnostic performance was assessed using receiver operating characteristic (ROC) curves, calibration curves and decision curve analysis.
Results: MVI-positive HCCs exhibited significantly lower true diffusion coefficient (Dt) from bi-IVIM, as well as fast-diffusion coefficients (Df) and slow-diffusion coefficients (Ds) from tri-IVIM, compared to MVI-negative HCCs (p < 0.05). Tumor size and alpha-fetoprotein (AFP) were identified as risk factors. The combination of tri-IVIM-derived metrics (Ds and Df) yielded higher diagnostic accuracy (AUC = 0.808) compared to bi-IVIM (AUC = 0.741). A predictive model based on a nomogram was constructed using Ds, Df, tumor size, and AFP, resulting in the highest diagnostic accuracy (AUC = 0.859). Decision curve analysis indicated that the constructed model, provided the highest net benefit by accurately stratifying the risk of MVI, followed by tri-IVIM and bi-IVIM.
Conclusion: Tri-IVIM can provide information on perfusion and diffusion for evaluating MVI in HCC. Additionally, tri-IVIM outperformed bi-IVIM in identifying MVI-positive HCC. By integrating clinical risk factors and metrics from tri-IVIM, a predictive nomogram exhibited the highest diagnostic accuracy, potentially aiding in the noninvasive and preoperative assessment of MVI.
Keywords: tri-exponential intra-voxel incoherent motion, diffusion weighted imaging, hepatocellular carcinoma, microvascular invasion
Corrigendum for this paper has been published.
Introduction
Hepatocellular carcinoma (HCC) ranks as the sixth most prevalent malignant tumor globally and is responsible for approximately 75–85% of all cases of primary liver cancer. It also stands as the second leading cause of cancer-related mortality.1,2 Numerous previous studies have provided compelling evidence for the significance of microvascular invasion (MVI) as a prognostic factor in HCC. Accurate identification of MVI can provide substantial clinical benefits by stratifying the risk of recurrence, predicting overall survival, and guiding clinical management.3–5 However, the current gold standard for evaluating MVI relies on histopathological examination, which has inherent limitations including invasiveness, time consumption, and the risk of sampling bias in liver tissue. Consequently, there is an urgent need for preoperative and noninvasive techniques to accurately identify MVI in HCC.
Diffusion-weighted imaging (DWI), which captures endogenous contrast derived from the diffusion characteristics of water molecules, has demonstrated considerable clinical utility in diagnostic imaging.6,7 Various intriguing DWI techniques have been developed and implemented in clinical imaging.8–17 Among these techniques, Intra-voxel incoherent motion (IVIM) MRI stands out as one of the most widely-used approaches. Since the introduction of IVIM theory in 1986,18 over 1300 published studies have extensively showcased its clinical potential across a wide range of clinical scenarios (Data accessed from PubMed, May 2023). The core principle underlying IVIM is the existence of two diffusion components, namely perfusion and diffusion. In recent years, several researchers have proposed tri-exponential IVIM (tri-IVIM) as a potential alternative to the conventional bi-exponential IVIM (bi-IVIM), suggesting that the perfusion component should be further separated into two diffusion components: very fast diffusion and fast diffusion.19,20 The unexpected confounding of these two components within a single perfusion component can compromise the accuracy and reliability of perfusion-related metrics derived from bi-IVIM. Evidence has shown that tri-IVIM provides better fitting accuracy than bi-IVIM for brain and liver applications.20,21 However, most previous studies focused on feasibility investigations of tri-IVIM with small cohorts of healthy volunteers. To the best of our knowledge, there are few reports evaluating the value of tri-IVIM for abdominal malignancies.
The objective of this research is to assess the feasibility of tri-IVIM in characterizing HCC, specifically by exploring its potential for preoperative and noninvasive diagnosis of MVI-positive HCC, with a comparison to bi-IVIM.
Materials and Methods
Patients Cohort
This prospective study received approval from the local institutional review board, and written informed consent was obtained from all participating patients. This study also complies with the Declaration of Helsinki. Inclusion and exclusion criteria were applied as follows:
Inclusion Criteria: 1) Patients who were suspected of having primary liver cancers based on their medical history or other imaging examinations and had not undergone preoperative treatment. Exclusion Criteria: 1) Patients who were deemed ineligible for tumor resection or did not undergo surgery at our hospital. 2) Patients histopathologically diagnosed with malignancies other than HCC. 3) Patients with a time interval of three weeks or longer between the MRI examination and surgical resection. 4) Poor DWI image quality due to respiratory motion or other artifacts. 5) Absence of a histopathological report regarding the MVI status.
MRI Examination
All MRI examination of this research was performed with a 3T scanner (770, Shanghai UIH Healthcare Co, Ltd. Shanghai, China). Daily MRI sequences included an axial T2-weighted imaging sequence (repletion time (TR) = 2000.0 ms, echo time (TE) = 106.2 ms, field of view (FOV) = 380×380 mm2, scanning matrix = 256×256, section thickness = 6.0 mm, flip angle (FA) = 100°), an axial T1-weighted in- and opposed-phase imaging sequence (TR = 4.27 ms, TE = 1.24 ms, FOV = 300×400 mm2, scanning matrix = 252×432, section thickness = 4 mm, FA = 10°), an axial contrast-enhanced T1-weighted imaging sequence (TR = 3.28 ms, TE = 1.45 ms, FOV = 255×463 mm2, scanning matrix = 237×480, FA = 10°). The tri-IVIM and bi-IVIM DWI were performed based on a single-shot echo-planar diffusion-weighted MRI sequence (TR = 3800 ms, TE = 75.0 ms, FOV = 300×380 mm2, scanning matrix = 202×256, section thickness = 6 mm, FA = 90°, b values = 01, 201, 401, 501, 1001, 2001, 5001, 8003 and 15004 s/mm2, the subscript indicates the number of averages).
Image Analysis
The post-processing of parametric maps for DWI was performed using a custom program script developed in-house and implemented on Python (Python 3.8; Python Software Foundation). Pixel-wise fitting of the tri-IVIM parametric maps was carried out with a dogleg algorithm and based on the following formula:


Where Sb and S0 represent the signal intensity of different b values and b = 0 s/mm2, fs and Ds represent the volume fraction of slow diffusion and slow diffusion coefficient. ff and fvf are the volume fractions of fast and very fast perfusion-related pseudo-diffusion. The Df and Dvf are the diffusion coefficients of perfusion-related fast and very fast pseudo-diffusion.
In addition to tri-IVIM, we also calculated the parametric maps of conventional bi-IVIM for comparison according to the following formula:

Where Sb and S0 represent the signal intensity of different b values and b = 0 s/mm2, Dt represent the true diffusion coefficient. fb is the volume fraction of perfusion-related pseudo-diffusion. The Dp is the pseudo-diffusion coefficient.
Two radiologists, RF. S and YF. Z, with 12 years and 8 years of experience in abdominal imaging, were enlisted to delineate the volumes of interest (VOIs) encompassing the entire HCC lesions on the DWI image with a b value of 500 s/mm2. The final VOIs were determined through consensus between the two radiologists. In cases where consensus could not be reached, a third radiologist, MS. Z, with over 39 years of experience in abdominal imaging, was consulted for resolution. Subsequently, the VOIs were transferred to other parametric maps to calculate the mean values within the entire VOIs.
Statistical Analysis
The p values of larger than 0.05 given by the Shapiro–Wilk test suggest the quantitative data obey normal distribution. Significant differences in different DWI-derived metrics between the subgroups were explored by the independent Student’s t-test (for normally-distributed data) or the Mann–Whitney U-test (for non-normally distributed data). Univariate and multivariate logistic regression was used for selecting the independent risk factors of MVI. The area under the receiver operative characteristics curve (AUC) was used for determining the diagnostic accuracy. Calibration curve analysis was conducted for validating the predictive accuracy. Power analysis was performed to estimate the required sample size by PASS software (version 2021, https://www.ncss.com/software/pass/). P values of less than or equal to 0.05 indicated significant differences. Except for power analysis, all other statistical analyses in this research were performed with R software (R version 4.1.0, R Foundation for Statistical Computing, Vienna, Austria).
Results
Patients Cohort
From 2020 to 2022, a total of 101 patients were initially enrolled in this prospective study. However, after applying the exclusion criteria (Figure 1), the following patients were excluded: 15 patients were not eligible for tumor resection or did not undergo surgery at our hospital, 5 patients had a time interval of three weeks or longer between the MRI examination and surgical resection, 4 patients were histopathologically diagnosed with malignancies other than HCC, 3 patients had poor DWI image quality and were not suitable for subsequent post-processing, and 7 patients lacked a histopathological diagnosis of MVI status. As a result, 67 patients were included in the final analysis (age: 57.6±10.4 years, 59 men, 8 women, 29 MVI-positive HCCs, and 38 MVI-negative HCCs). Detailed clinical characteristics can be found in Table 1. Representative MRI images of two patients, one with MVI and one without MVI, are displayed in Figure 2 and Figure 3, respectively.
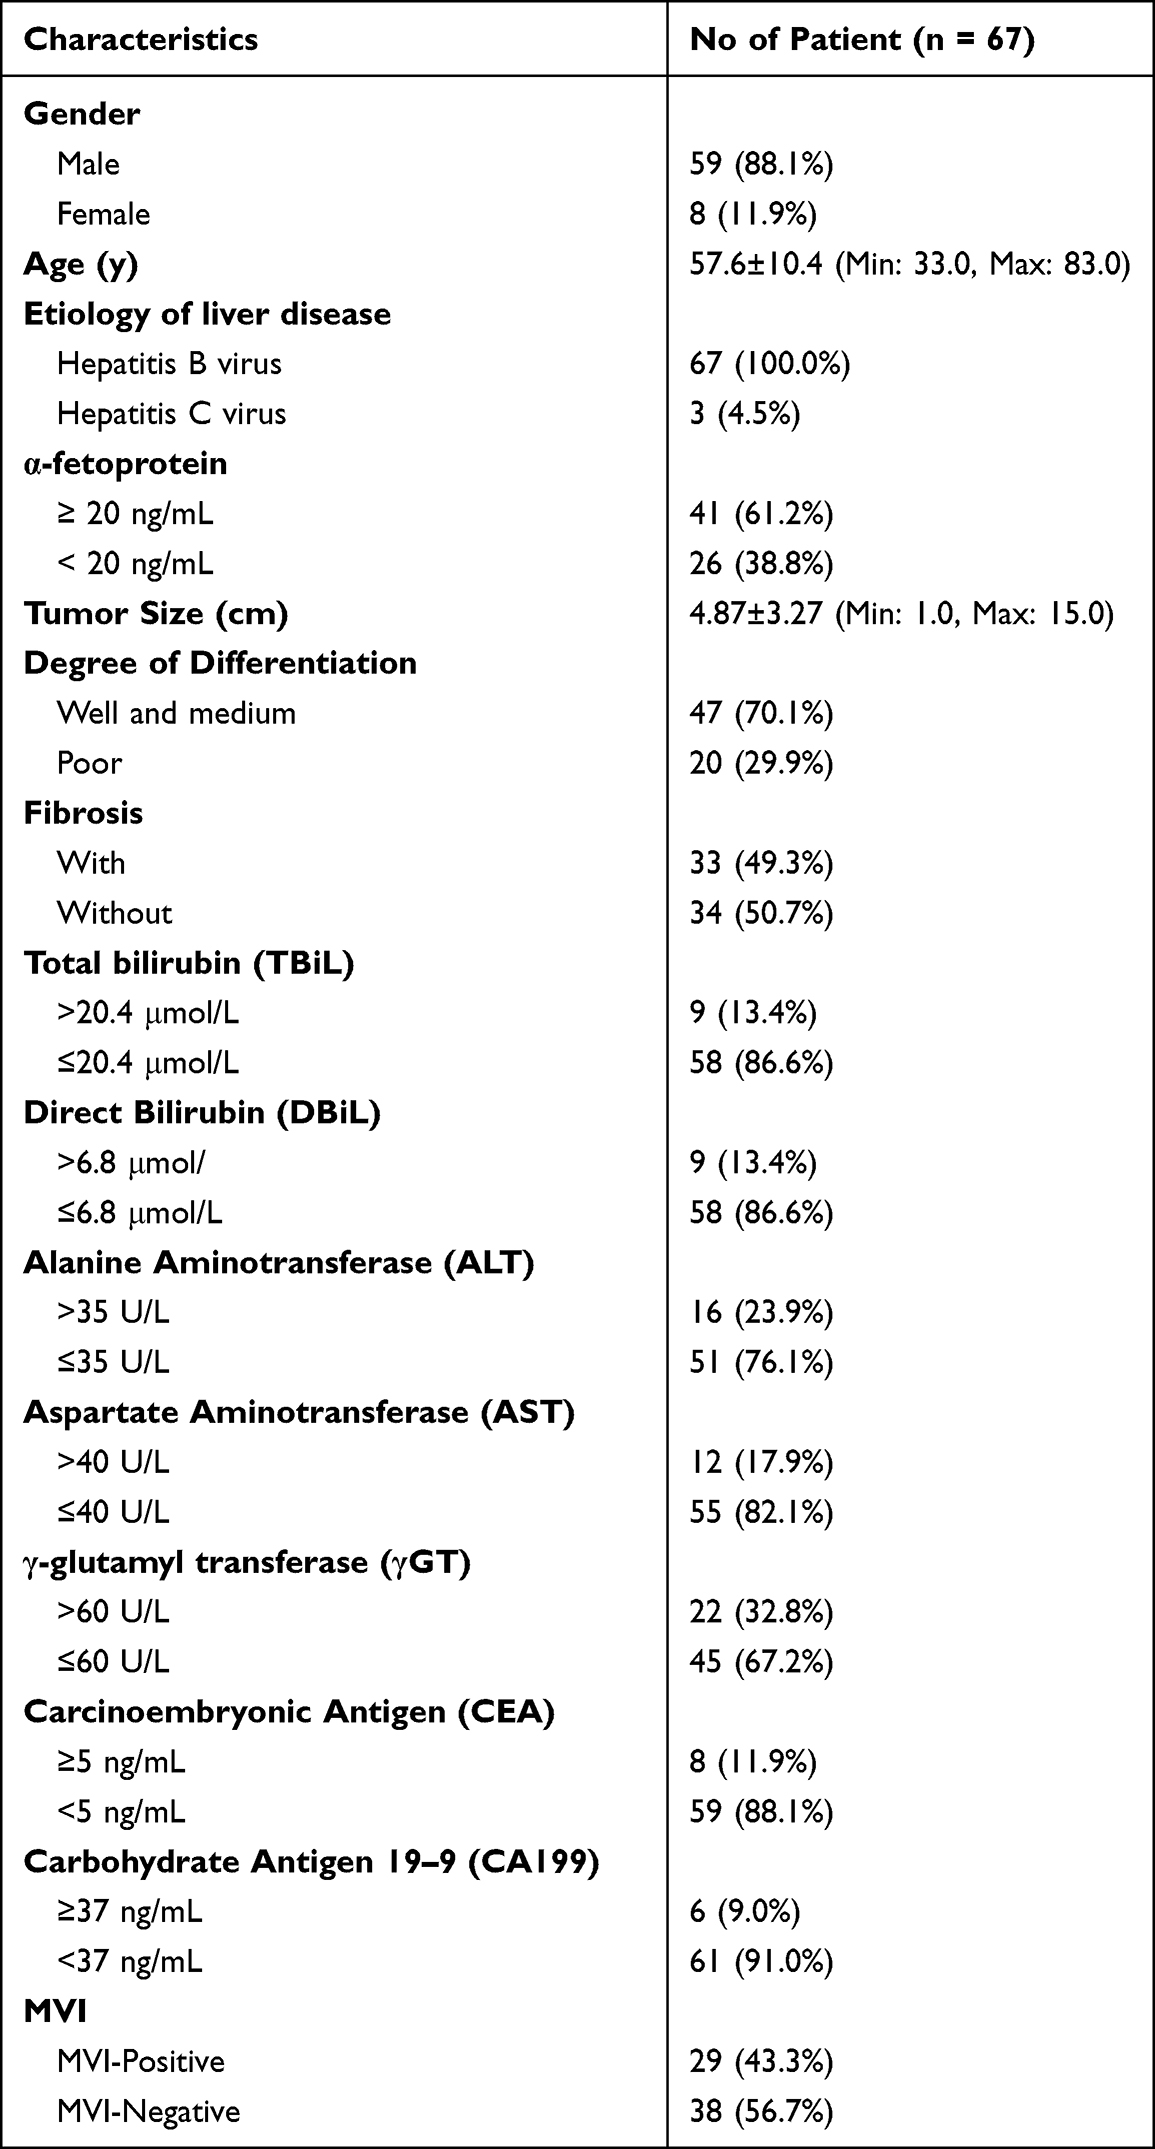 |
Table 1 Clinical Characteristics |
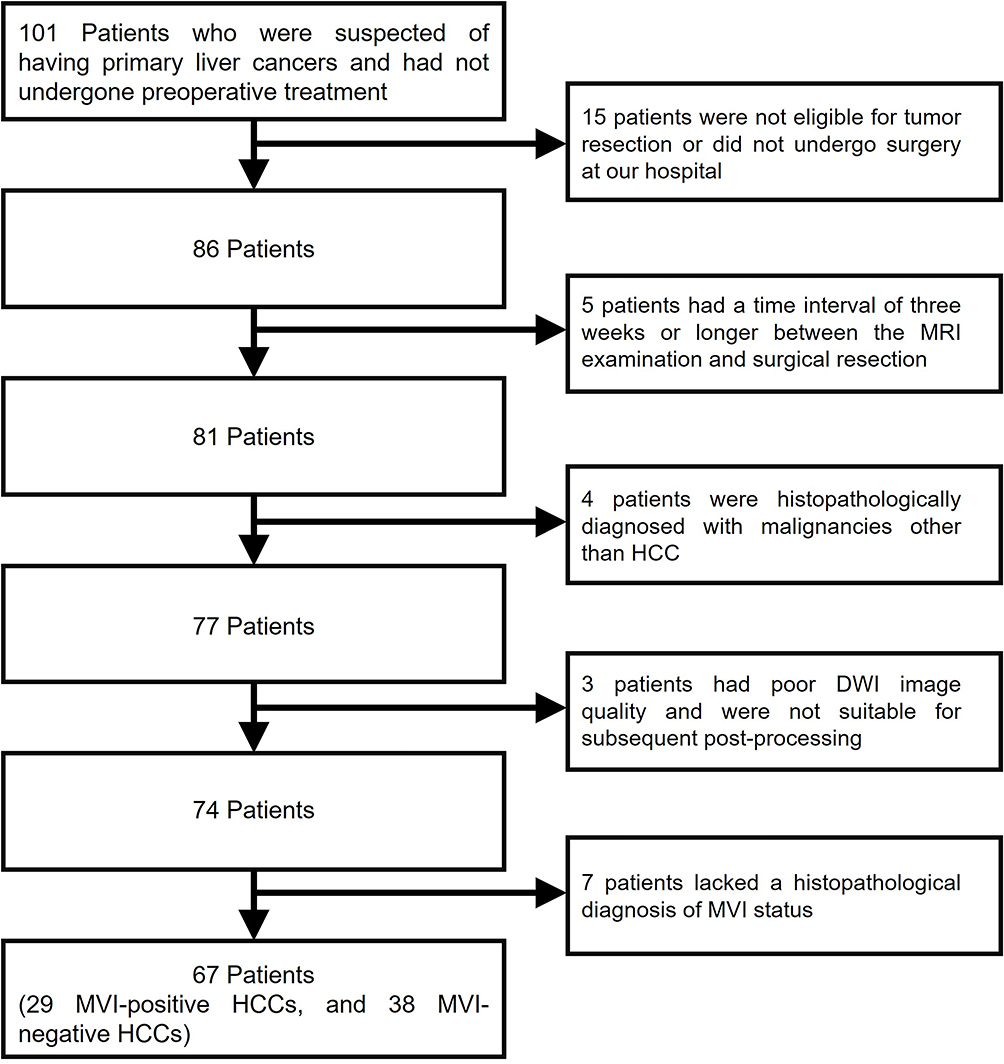 |
Figure 1 The flowchart shows the inclusion and exclusion of subjects. |
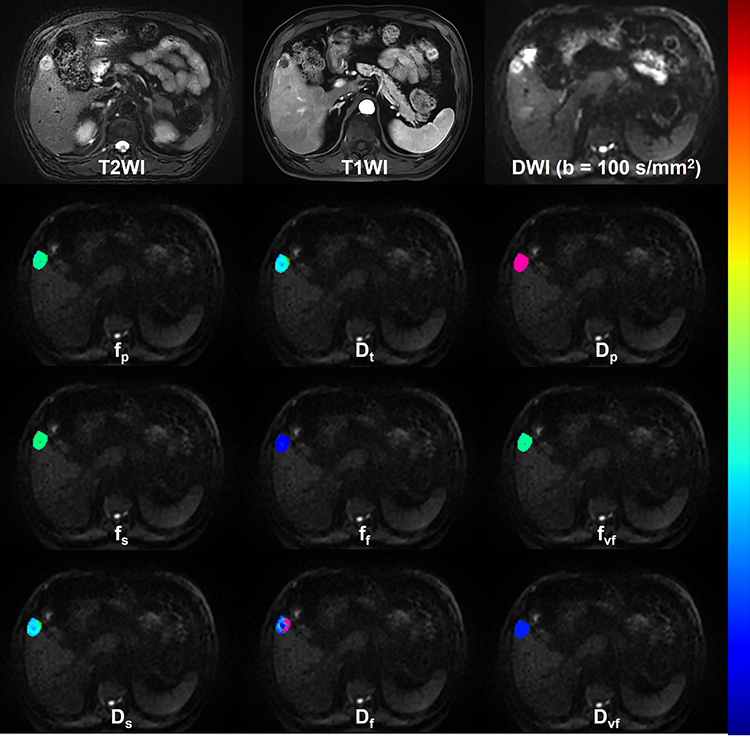 |
Figure 2 Representative MRI images including the T2WI, T1WI, DWI of b = 100 s/mm2 and bi-IVIM-derived parametric maps (fp, Dt and Dp) as well as tri-IVIM-derived parametric maps (fs, ff, fvf, Ds, Df and Dvf) of a patient with MVI-negative HCC. Notes: It is important to note that the parametric pseudo-color maps of the segmented tumors were superimposed on the DWI images with a b-value of 500 s/mm2. All pseudo-color maps utilize the same color bar, which ranges from blue to red. The following ranges apply to different parameters: fp, fs, ff, and fvf range from 0.0 to 1.0; Dt and Ds range from 0.0 to 5×10⁻³ mm2/s; Dp and Df range from 0.0 to 200×10−3 mm2/s; Dvf ranges from 0.0 to 10,000×10−3 mm2/s. |
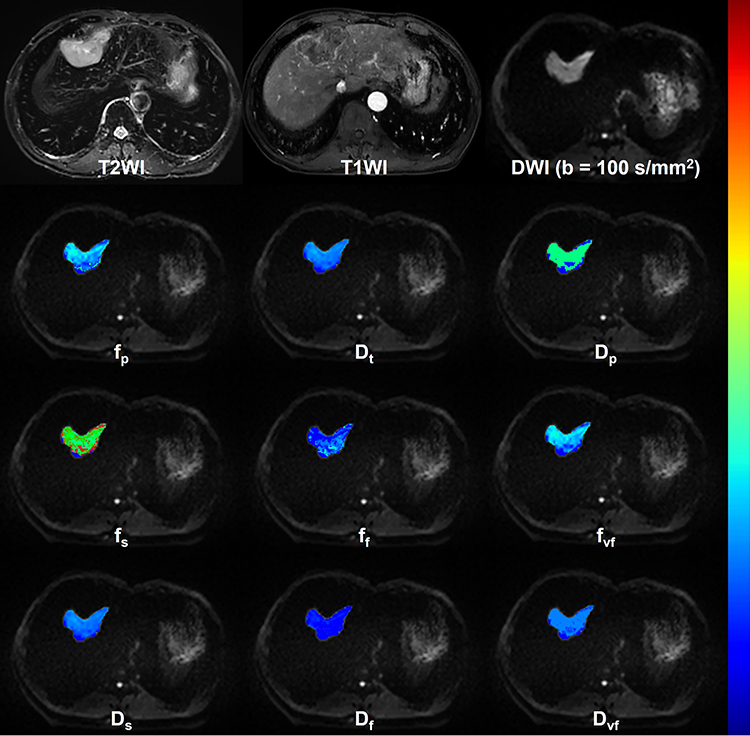 |
Figure 3 Representative MRI images including the T2WI, T1WI, DWI of b = 100 s/mm2 and bi-IVIM-derived parametric maps (fp, Dt and Dp) as well as tri-IVIM-derived parametric maps (fs, ff, fvf, Ds, Df and Dvf) of a patient with MVI-positive HCC. Note: The color bar and ranges of different metrics are same as those in Figure 2. |
Quantitative Comparison of DWI-Derived Metrics
The box-plots in Figure 4 show that significantly lower Ds, Df and Dt were associated with the MVI (MVI-negative HCCs vs MVI-positive HCCs: Ds = 1.17±0.22×10⁻³ vs 0.96±0.23×10⁻³ mm2/s, p <0.001; Df = 34.85±17.22×10⁻³ vs 20.93±7.78×10⁻³ mm2/s, p < 0.001; Dt = 1.23±0.23×10⁻³ vs 1.02±0.24×10⁻³ mm2/s, p = 0.001). Other metrics did not show the significant difference between the subgroups (MVI-negative HCCs vs MVI-positive HCCs: fp = 0.38±0.06 vs 0.35±0.06, p = 0.060; Dp = 70.51±22.59×10⁻³ vs 67.90±26.46×10⁻³ mm2/s, p = 0.909; Dvf = 1.50±0.25 vs 1.52±0.33 mm2/s, p = 0.560; fs = 0.60±0.07 vs 0.59±0.10, p = 0.879; ff = 0.11±0.08 vs 0.11±0.07, p = 0.980; fvf = 0.27±0.13 vs 0.25±0.13, p = 0.511;).
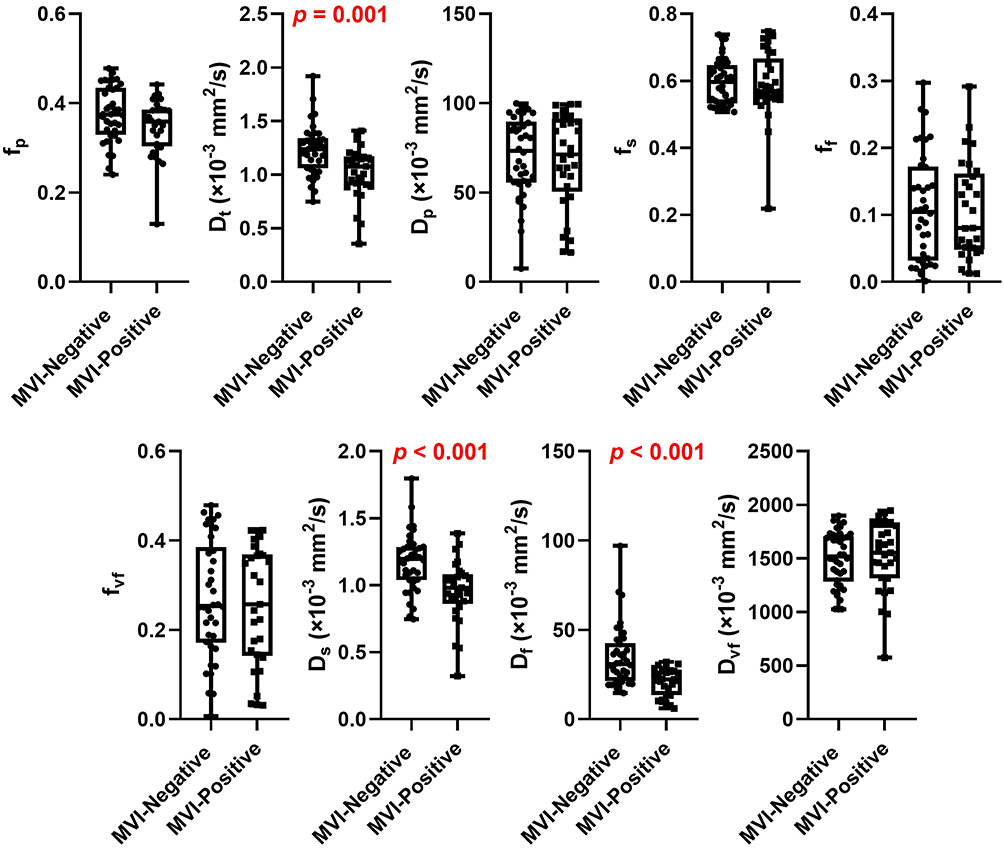 |
Figure 4 Quantitative comparison of bi-IVIM and tri-IVIM derived metrics between MVI-negative and MVI-positive HCCs. |
Evaluation of Diagnostic Accuracy
For individual metrics showing the significant differences between the subgroups, Df (AUC = 0.767, specificity = 0.579, sensitivity = 0.897) has the best diagnostic performance followed by Ds (AUC = 0.760, specificity = 0.684, sensitivity = 0.793) and Dt (AUC = 0.741, specificity = 0.684, sensitivity = 0.793) (Figure 5). Taken Df and Ds together by logistic regression, the tri-IVIM-based model resulted in improved diagnostic accuracy (AUC = 0.808, specificity = 0.658, sensitivity = 0.862) (Figure 5).
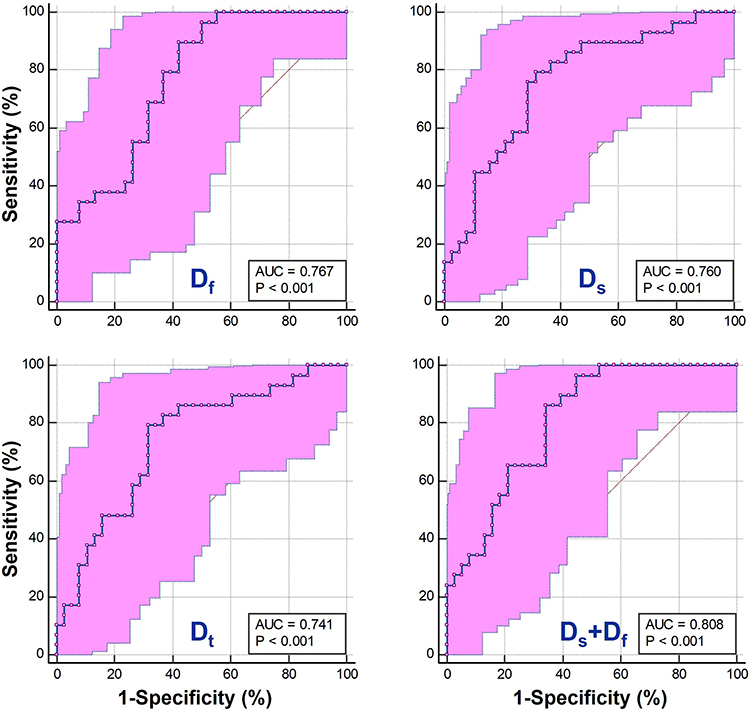 |
Figure 5 The receiver characteristics curves (ROC) of Df, Ds, Dt and the combination of Df and Ds (Df+Ds). |
According to the multivariate logistic regression (Table 2), tumor size (odds ratio (OR) = 1.248, 95% CI of OR = 1.020–1.527, p = 0.032) and alpha-fetoprotein (AFP) (OR = 3.653, 95% CI of OR = 1.174–11.371, p = 0.025) were selected as independent risk factors of MVI. A nomogram-based predictor was constructed with tumor size, AFP, Ds and Df (Figure 6A), showing the best diagnostic accuracy (AUC = 0.859, Specificity = 0.842, Sensitivity = 0.793, Figure 6B). Dt was excluded from the model construction because it provided similar information related to cellularity as Ds, and its diagnostic performance was not superior to that of Ds. The calibration curves in Figure 6C indicate a strong agreement between the predicted risk of MVI generated by the nomogram model and the actual risk of MVI. This demonstrates the reliability and accuracy of the nomogram in assessing MVI. The decision curve analysis also demonstrated that with the highest predictive accuracy, the nomogram-based model can yield the highest net benefit by accurately stratifying the risk of MVI compared to other metrics (Figure 7).
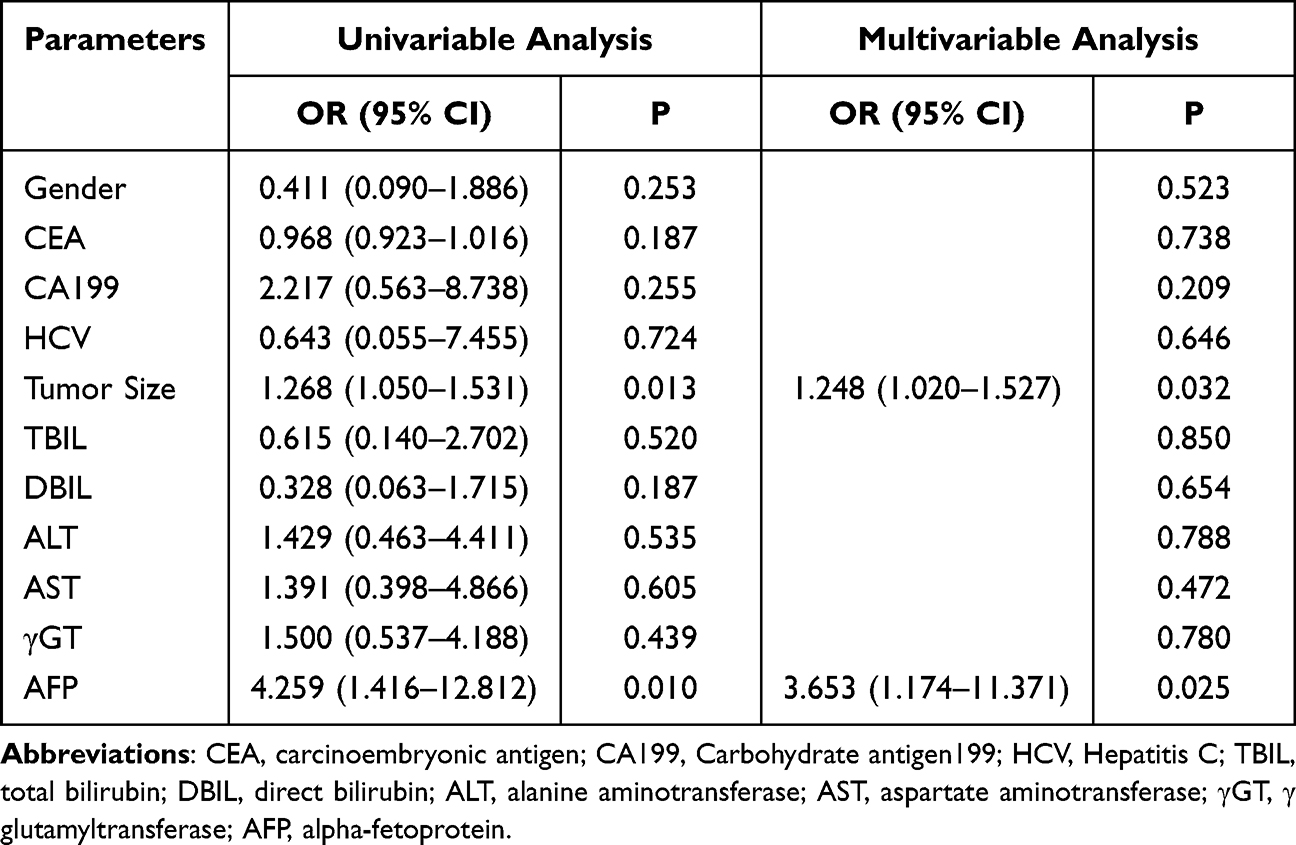 |
Table 2 Explore the Independent Risk Factors of MVI Through Univariable and Multivariable Logistic Regression Analysis |
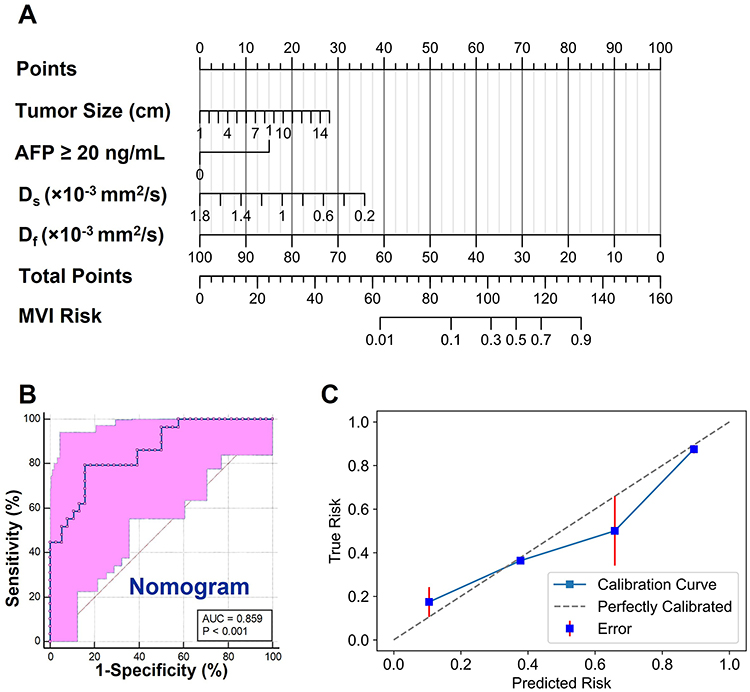 |
Figure 6 Evaluation of the nomogram-based model. Notes: (A) The nomogram plot. (B) The ROC and (C) calibration curve of the constructed nomogram model. |
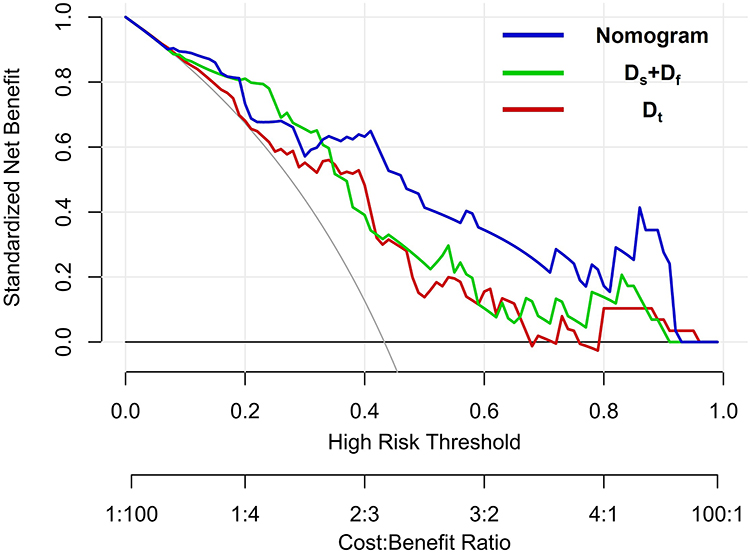 |
Figure 7 The decision curve of the nomogram-based model, tri-IVIM (Ds+Df) and bi-IVIM (Dt). |
Power Analysis and Sample Size Estimation
The required sample size for this study was estimated at the beginning using power analysis.
As this study is centered on diagnostic evaluation, and the ROC analysis is an important statistical analysis for determining the diagnostic accuracy for this research. Therefore, we conducted a power analysis specifically tailored to the ROC analysis employed in this study. Different effect values (AUCs) were considered with a significance level of 0.05 and a statistical power of 0.85. The results showed that the minimum required sample sizes for AUCs of 0.60, 0.65, 0.70, 0.75, 0.80, 0.85, and 0.90 were 296, 128, 70, 44, 30, 20, and 14, respectively. In this study, we included a total of 67 subjects, and the observed AUCs for the metrics showing significant differences between the subgroups and the constructed models ranged from 0.741 to 0.859. In accordance with the principles of power analysis, it is important to note that, when considering a specific statistical power and significance level, the required sample size exhibits a negative correlation with effect values. These findings indicate that the sample size in this study ensures a relatively high statistical power (0.85) for the evaluation of diagnostic accuracy.
Discussion
This study represents a preliminary evaluation of the value of tri-IVIM for assessing MVI in HCC. To the best of our knowledge, there have been few attempts made to explore the clinical utility of tri-IVIM in abdominal malignancies. Our findings demonstrate that tri-IVIM can serve as a noninvasive approach for preoperative identification of MVI-positive HCC. Specifically, we observed significant differences in two metrics derived from tri-IVIM (Df and Ds), whereas only one metric derived from bi-IVIM (Dt) showed a significant difference between MVI-positive and MVI-negative HCCs. Moreover, the combination of Df and Ds, which respectively reflect perfusion and diffusion, resulted in superior diagnostic performance compared to bi-IVIM. The results presented above indicate that tri-IVIM analysis offers more valuable markers for assessing MVI from diverse biological perspectives. We identified two clinical factors, tumor size, and AFP, as independent risk factors for MVI. By integrating these clinical factors with tri-IVIM-derived metrics, we constructed a predictive model that displayed the highest diagnostic accuracy for MVI. This approach may provide new insights for the preoperative, noninvasive, and accurate diagnosis of MVI-positive HCC.
Our findings revealed that the presence of MVI was associated with significantly lower Df, Ds, and Dt. However, other metrics derived from bi-IVIM or tri-IVIM did not show significant differences between the two groups. The potential biophysical explanations for these findings can be speculated as follows: 1) Ds and Dt have similar biological insights. Both metrics quantify true diffusion and reflect tissue cellularity. Previous research has demonstrated that the presence of MVI indicates a higher degree of malignancy with increased tumor cell proliferation and a higher nucleo-cytoplasmic ratio, which results in a reduction in the extracellular space. As a consequence, the diffusion of water molecules becomes more restricted, leading to significantly lower diffusion coefficients in MVI-positive HCC. Our findings are consistent with previous publications that have identified significantly lower diffusion coefficients as indicators of MVI-positive HCC.22–24
2) Df, on the other hand, reflects perfusion-related diffusion. While exuberant neovascularization is essential to meet the demands of oxygen and nutrient supply during hepatocarcinogenesis, these neovascular vessels are often characterized by vascular leakage and defective vascular remodeling.25 Therefore, the decreased Df observed in MVI-positive HCC may be associated with these vascular abnormalities.
Many investigators have utilized IVIM for diagnosing MVI-positive HCC. In these studies, it was found that only IVIM-derived Dt showed statistical significance, while Dp and f exhibited high variance and did not demonstrate statistical differences, consistent with our findings.22,23,26,27 The liver exhibits distinctive histological features, encompassing various types of vessels such as arteries/arterioles, portal veins/venules, and hepatic veins/venules. In addition, it contains sinusoid capillaries, bile ducts, and an extensive lymphatic system. Within these compartments, there are flowing or moving spins that are intricately interconnected either directly or indirectly. This intricate network of vessels and structures contributes to the presence of an extra diffusion component in the liver. Recent evidence suggests the existence of a third diffusion compartment in the liver characterized by very fast diffusion.28–31 The confounding of two diffusion components, fast diffusion and very fast pseudo-diffusion, within a single perfusion component, is likely the main factor contributing to high variance and suboptimal diagnostic performance of the bi-IVIM derived parameters Dp and f.28 According to the tri-IVIM theory, Dvf represents the component of very fast diffusion, which can arise from the complex interactions of spins within various tissue types, including arteries/arterioles, portal veins/venules, hepatic veins/venules, sinusoid capillaries, bile ducts, and the extensive lymphatic system.28,29 However, due to the intricate nature of these interactions, Dvf may exhibit high variance and limited diagnostic power. Additionally, the volume fractions of the different diffusion components were not found to have significant differences, suggesting that these volume fractions are not sensitive enough to differentiate between MVI-positive HCC and MVI-negative HCC.
Among all individual metrics from tri-IVIM and bi-IVIM, Df demonstrated the best performance for diagnosing MVI-positive HCC, followed by Ds and Dt. Combining the tri-IVIM-derived Ds and Df resulted in a significantly higher AUC, indicating that tri-IVIM is more powerful in identifying MVI compared to IVIM, which relies on a single metric of Dt as the diagnostic marker. These results highlight the superior capability of tri-IVIM in the preoperative evaluation of MVI with high accuracy. Additionally, by separating the fast diffusion component and very fast diffusion component, the perfusion-related metric can serve as a diagnostic marker and exhibit excellent diagnostic performance. Our study also found that increased tumor size and elevated AFP levels were both risk factors for MVI. Based on these findings, we constructed a nomogram-based predictive model that incorporates Ds, Df, tumor size, and AFP. The predictive model exhibited a strong diagnostic power, as indicated by an AUC of 0.859. This suggests that the model has the potential to serve as a valuable and cost-effective tool for assisting in the noninvasive and preoperative identification of MVI-positive HCC.
This study is subject to several limitations. Firstly, the sample size of this prospective study was not very large, highlighting the need for larger sample sizes and external validation to strengthen the evidence. Secondly, the exact biological origin of the component with very fast diffusion in tri-IVIM remains unclear and requires further exploration. Therefore, more research is needed to elucidate the detailed mechanisms underlying the correlation between Dvf and MVI. Thirdly, it is important to note that MVI can be graded into different grades, such as M0, M1, and M2. However, this proof-of-concept study focused solely on evaluating the feasibility of using tri-IVIM for diagnosing MVI-positive HCC, rather than grading the extent of MVI.
Conclusion
Our findings highlight the feasibility and value of tri-IVIM in identifying MVI in HCC. Specifically, both the perfusion-related Df and diffusion-related Ds obtained from tri-IVIM proved to be valuable indicators for MVI. Furthermore, tri-IVIM demonstrated superior diagnostic accuracy compared to bi-IVIM. Ultimately, the construction of a predictive nomogram that combines both clinical factors and tri-IVIM resulted in the highest accuracy for diagnosing MVI-positive HCC. These findings signified that tri-IVIM has the potential for enhancing prognostic prediction and guiding clinical management in the context of MVI-positive HCC.
Acknowledgments
We thank Home for Researchers team for language editing assistance.
Disclosure
The authors report no conflicts of interest in this work.
References
1. Llovet JM, Castet F, Heikenwalder M, et al. Immunotherapies for hepatocellular carcinoma. Nat Rev Clin Oncol. 2022;19(3):151–172. doi:10.1038/s41571-021-00573-2
2. Sung H, Ferlay J, Siegel RL, et al. Global cancer statistics 2020: GLOBOCAN estimates of incidence and mortality worldwide for 36 cancers in 185 countries. CA Cancer J Clin. 2021;71(3):209–249. doi:10.3322/caac.21660
3. Rodriguez-Peralvarez M, Luong TV, Andreana L, Meyer T, Dhillon AP, Burroughs AK. A systematic review of microvascular invasion in hepatocellular carcinoma: diagnostic and prognostic variability. Ann Surg Oncol. 2013;20(1):325–339. doi:10.1245/s10434-012-2513-1
4. Zhang E-L, Cheng Q, Huang Z-Y, Dong W. Revisiting surgical strategies for hepatocellular carcinoma with microvascular invasion. Front Oncol. 2021;11:691354. doi:10.3389/fonc.2021.691354
5. Zheng Z, Guan R, Jianxi W, et al. Microvascular invasion in hepatocellular carcinoma: a review of its definition, clinical significance, and comprehensive management. J Oncol. 2022;2022:1–10. doi:10.1155/2022/9567041
6. Mannelli L, Nougaret S, Vargas HA, Do RK. Advances in diffusion-weighted imaging. Radiologic Clinics. 2015;53(3):569–581. doi:10.1016/j.rcl.2015.01.002
7. Bammer R. Basic principles of diffusion-weighted imaging. Eur J Radiol. 2003;45(3):169–184. doi:10.1016/S0720-048X(02)00303-0
8. Qin Y, Tang C, Hu Q, et al. Quantitative assessment of restriction spectrum MR imaging for the diagnosis of breast cancer and association with prognostic factors. J Magn Reson Imaging. 2023;57(6):1832–1841. doi:10.1002/jmri.28468
9. Wang C, Wang G, Zhang Y, et al. Differentiation of benign and malignant breast lesions using diffusion-weighted imaging with a fractional-order calculus model. Eur J Radiol. 2023;159:110646. doi:10.1016/j.ejrad.2022.110646
10. Chen J, Liu D, Guo Y, et al. Preoperative identification of cytokeratin 19 status of hepatocellular carcinoma based on diffusion kurtosis imaging. Abdom Radiol. 2023;48(2):579–589. doi:10.1007/s00261-022-03736-6
11. Guo Y, Chen J, Zhang Y, et al. Differentiating cytokeratin 19 expression of hepatocellular carcinoma by using multi-b-value diffusion-weighted MR imaging with mono-exponential, stretched exponential, intravoxel incoherent motion, diffusion kurtosis imaging and fractional order calculus models. Eur J Radiol. 2022;150:110237. doi:10.1016/j.ejrad.2022.110237
12. Geng Z, Zhang Y, Yin S, et al. Preoperatively grading rectal cancer with the combination of intravoxel incoherent motions imaging and diffusion kurtosis imaging. Contrast Media Mol Imaging. 2020;2020:1–11. doi:10.1155/2020/2164509
13. Shi G, Han X, Wang Q, et al. Evaluation of multiple prognostic factors of hepatocellular carcinoma with intra-voxel incoherent motions imaging by extracting the histogram metrics. Cancer Manag Res. 2020;Volume 12:6019–6031. doi:10.2147/CMAR.S262973
14. Zhang Y, Yang C, Sheng R, Dai Y, Zeng M. Preoperatively identify the microvascular invasion of hepatocellular carcinoma with the restricted spectrum imaging. Acad Radiol. 2023;30(Suppl 1):S30–S39. doi:10.1016/j.acra.2023.06.010
15. Zhang Y, Yang C, Liang L, et al. Preliminary experience of 5.0 T higher field abdominal diffusion-weighted MRI: agreement of apparent diffusion coefficient with 3.0 T imaging. J Magn Reson Imaging. 2022;56(4):1009–1017. doi:10.1002/jmri.28097
16. Sheng R, Zhang Y, Sun W, et al. Staging chronic hepatitis B related liver fibrosis with a fractional order calculus diffusion model. Acad Radiol. 2022;29(7):951–963. doi:10.1016/j.acra.2021.07.005
17. Xiong Z, Geng Z, Lian S, et al. Discriminating rectal cancer grades using restriction spectrum imaging. Abdom Radiol. 2022;47(6):2014–2022. doi:10.1007/s00261-022-03500-w
18. Le Bihan D, Breton E, Lallemand D, Grenier P, Cabanis E, Laval-Jeantet M. MR imaging of intravoxel incoherent motions: application to diffusion and perfusion in neurologic disorders. Radiology. 1986;161(2):401–407. doi:10.1148/radiology.161.2.3763909
19. Kuai Z-X, Liu W-Y, Zhu Y-M. Effect of multiple perfusion components on pseudo-diffusion coefficient in intravoxel incoherent motion imaging. Phys Med Biol. 2017;62(21):8197. doi:10.1088/1361-6560/aa8d0c
20. Cercueil J-P, Petit J-M, Nougaret S, et al. Intravoxel incoherent motion diffusion-weighted imaging in the liver: comparison of mono-, bi-and tri-exponential modelling at 3.0-T. Eur Radiol. 2015;25(6):1541–1550. doi:10.1007/s00330-014-3554-6
21. Cao M, Wang X, Liu F, Xue K, Dai Y, Zhou Y. A three-component multi-b-value diffusion-weighted imaging might be a useful biomarker for detecting microstructural features in gliomas with differences in malignancy and IDH-1 mutation status. Eur Radiol. 2023;33(4):2871–2880. doi:10.1007/s00330-022-09212-5
22. Li H, Zhang J, Zheng Z, et al. Preoperative histogram analysis of intravoxel incoherent motion (IVIM) for predicting microvascular invasion in patients with single hepatocellular carcinoma. Eur J Radiol. 2018;105:65–71. doi:10.1016/j.ejrad.2018.05.032
23. Wang F, Yan CY, Wang CH, Yang Y, Zhang D. The roles of diffusion kurtosis imaging and intravoxel incoherent motion diffusion-weighted imaging parameters in preoperative evaluation of pathological grades and microvascular invasion in hepatocellular carcinoma. Front Oncol. 2022;12:884854. doi:10.3389/fonc.2022.884854
24. Surov A, Pech M, Omari J, et al. Diffusion-weighted imaging reflects tumor grading and microvascular invasion in hepatocellular carcinoma. Liver Cancer. 2021;10(1):10–24. doi:10.1159/000511384
25. Bradley J, Ju M, Robinson GS. Combination therapy for the treatment of ocular neovascularization. Angiogenesis. 2007;10(2):141–148. doi:10.1007/s10456-007-9069-x
26. Wei Y, Huang Z, Tang H, et al. IVIM improves preoperative assessment of microvascular invasion in HCC. Eur Radiol. 2019;29(10):5403–5414. doi:10.1007/s00330-019-06088-w
27. Zhao W, Liu W, Liu H, et al. Preoperative prediction of microvascular invasion of hepatocellular carcinoma with IVIM diffusion-weighted MR imaging and Gd-EOB-DTPA-enhanced MR imaging. PLoS One. 2018;13(5):e0197488. doi:10.1371/journal.pone.0197488
28. Chevallier O, Zhou N, Cercueil JP, He J, Loffroy R, Wáng YXJ. Comparison of tri-exponential decay versus bi-exponential decay and full fitting versus segmented fitting for modeling liver intravoxel incoherent motion diffusion MRI. NMR Biomed. 2019;32(11):e4155. doi:10.1002/nbm.4155
29. Chevallier O, Wáng YXJ, Guillen K, Pellegrinelli J, Cercueil JP, Loffroy R. Evidence of tri-exponential decay for liver intravoxel incoherent motion MRI: a review of published results and limitations. Diagnostics. 2021;11(2):379. doi:10.3390/diagnostics11020379
30. Riexinger AJ, Martin J, Rauh S, et al. On the field strength dependence of bi- and triexponential Intravoxel Incoherent Motion (IVIM) parameters in the liver. J Magn Reson Imaging. 2019;50(6):1883–1892. doi:10.1002/jmri.26730
31. Riexinger A, Martin J, Wetscherek A, et al. An optimized b-value distribution for triexponential intravoxel incoherent motion (IVIM) in the liver. Magn Reson Med. 2021;85(4):2095–2108. doi:10.1002/mrm.28582
 © 2023 The Author(s). This work is published and licensed by Dove Medical Press Limited. The
full terms of this license are available at https://www.dovepress.com/terms
and incorporate the Creative Commons Attribution
- Non Commercial (unported, 3.0) License.
By accessing the work you hereby accept the Terms. Non-commercial uses of the work are permitted
without any further permission from Dove Medical Press Limited, provided the work is properly
attributed. For permission for commercial use of this work, please see paragraphs 4.2 and 5 of our Terms.
© 2023 The Author(s). This work is published and licensed by Dove Medical Press Limited. The
full terms of this license are available at https://www.dovepress.com/terms
and incorporate the Creative Commons Attribution
- Non Commercial (unported, 3.0) License.
By accessing the work you hereby accept the Terms. Non-commercial uses of the work are permitted
without any further permission from Dove Medical Press Limited, provided the work is properly
attributed. For permission for commercial use of this work, please see paragraphs 4.2 and 5 of our Terms.
Recommended articles
MRI Features for Predicting Microvascular Invasion and Postoperative Recurrence in Hepatocellular Carcinoma Without Peritumoral Hypointensity

Chen Z, Li X, Zhang Y, Yang Y, Zhang Y, Zhou D, Yang Y, Zhang S, Liu Y
Journal of Hepatocellular Carcinoma 2023, 10:1595-1608
Published Date: 25 September 2023
A Grading System of Microvascular Invasion for Patients with Hepatocellular Carcinoma Undergoing Liver Resection with Curative Intent: A Multicenter Study

Wang H, Chen JJ, Yin SY, Sheng X, Wang HX, Lau WY, Dong H, Cong WM
Journal of Hepatocellular Carcinoma 2024, 11:191-206
Published Date: 24 January 2024
Patterns, Risk Factors, and Outcomes of Recurrence After Hepatectomy for Hepatocellular Carcinoma with and without Microvascular Invasion
Yu Y, Wang XH, Hu WJ, Chen DH, Hu ZL, Li SQ
Journal of Hepatocellular Carcinoma 2024, 11:801-812
Published Date: 8 May 2024
Decision-Tree Models Indicative of Microvascular Invasion on MRI Predict Survival in Patients with Hepatocellular Carcinoma Following Tumor Ablation
Schmidt R, Hamm CA, Rueger C, Xu H, He Y, Gottwald LA, Gebauer B, Savic LJ
Journal of Hepatocellular Carcinoma 2024, 11:1279-1293
Published Date: 3 July 2024
Combined TACE with Targeted and Immunotherapy versus TACE Alone Improves DFS in HCC with MVI: A Multicenter Propensity Score Matching Study
Chen X, Wu X, Peng W, Liu L, Liu X, Wan X, Xu H, Zheng Y, Zhao H, Mao Y, Lu X, Sang X, Chang X, Zhou K, Pan J, Guan M, Hu D, Tan H, Zhang Y, Du S
Journal of Hepatocellular Carcinoma 2025, 12:561-577
Published Date: 19 March 2025