Back to Journals » Patient Preference and Adherence » Volume 16
The Development of Schematics to Illustrate Women’s Experiences with Adjuvant Hormone Therapy in the Treatment of Breast Cancer
Authors AlOmeir O ![]() , Patel N
, Patel N ![]() , Donyai P
, Donyai P ![]()
Received 30 March 2022
Accepted for publication 2 August 2022
Published 23 September 2022 Volume 2022:16 Pages 2639—2647
DOI https://doi.org/10.2147/PPA.S368636
Checked for plagiarism Yes
Review by Single anonymous peer review
Peer reviewer comments 3
Editor who approved publication: Dr Johnny Chen
Othman AlOmeir, Nilesh Patel, Parastou Donyai
Department of Pharmacy, University of Reading, Reading, Berkshire, UK
Correspondence: Othman AlOmeir; Parastou Donyai, Email [email protected]; [email protected]
Objective: Non-adherence to adjuvant hormone therapy prescribed orally in the treatment of breast cancer is complex as the literature has shown. Many women find it hard to adhere to the hormonal medicines they are prescribed and expected to take for at least 5 years following the initial management of their breast cancer. Arguably, communicating other women’s ‘trials, tribulations, and triumphs’ with medication-taking could help newly-diagnosed patients to better prepare for the journey ahead. Our objective was to visually represent women’s experiences with these medicines using data synthesized in the literature.
Methods: Three schematics were drawn for each phase of medication-taking, namely, starting out, adherence, and cessation. The schematics were validated by interviewing a panel of healthcare professionals (n=10) and calculating a Content Validity Index (CVI). The edited drawings were discussed with a separate panel of breast cancer survivors (n=14) whose responses were elicited qualitatively in one-to-one interviews.
Results: A total of 76 individual pictograms were drawn across the three schematics. The 13 pictograms that had an item-level CVI< 0.8 were modified according to feedback resulting in three final schematics with an overall CVI of 87%, 87% and 80%, respectively.
Conclusion: Synthesised summaries of women’s experiences with oral hormone therapy for breast cancer were visualised via three validated schematics. The schematics could aid patient-professional communication to help anticipate and tackle negative experiences and support decisions to take hormone medication in breast cancer.
Keywords: adherence, medication, breast cancer, hormone therapy, qualitative research, pictogram
Plain Language Summary
Women whose breast cancer responds to oestrogen are often given hormone medicines to take for five to ten years after their cancer is first treated. However, they often end up not taking their medicines as prescribed and we were able to show the detail of these experiences in a review paper previously published. Sharing these experiences with other women could help them plan for their own treatment. Therefore, our aim in this paper was to turn published findings into a set of diagrams that would make sense to women and that women would find helpful. We drew three diagrams to relate to the beginning of treatment, when women were taking their medicines and when they decided to stop. We showed these diagrams first to a group of 10 health professionals who helped us improve the drawings. We then met with 14 women who had been treated for breast cancer and also collected their views. Our three diagrams had 76 individual drawings and although 13 of the drawings needed improving, the final diagrams made sense to both the health professionals and the women we spoke to. Our study shows that it is possible to turn scientific findings into a format that women find helpful and we believe these diagrams can help women and health professionals to talk about, and plan for, the effects of hormone medicines.
Introduction
The communication behaviour of healthcare providers toward people diagnosed with cancer impacts on patient outcomes and has been investigated for several decades.1 This research includes the provision of informational and decision-making support to women diagnosed with breast cancer.2 One effective way to communicate information to patients in general and facilitate their understanding and decision-making is with the use of pictograms.3,4 Multiple studies have examined the effectiveness of pictograms in healthcare communication, for example, to explain the use of medical devices, drug indications, dosing schedules, side effects and special instructions for the administration of medication, finding positive results.5,6 The use of pictograms allows people with different health literacy levels to better understand and later recall information. Combining the use of text and pictures has also been shown to affect health communication positively in multiple studies.7 One area in need of improvement is dialogue about medication use, specifically where the aim is to explore patients’ understanding about their medication8 This is important considering that the NICE guidelines on medicines optimisation recommend “a person-centred approach to safe and effective medicines use, to ensure people obtain the best possible outcomes from their medicines”,9 thus placing emphasis on the one-to-one interaction a health professional has with the patient to discuss their medicines.
As well as the health professional’s ability to convey complex ideas to the patient, arguably, one of the key factors in medication-related conversations is also the patient’s ability to convey their experiences so that they can receive the right support. In a previous study we used grounded theory synthesis methodology10 to appraise, summarize and synthesize data from existing qualitative studies to develop an in-depth explanatory model of women’s experiences of taking hormone therapy in breast cancer.11 Because tamoxifen and aromatase inhibitors target and diminish oestrogen activity in the body, they create a range of side-effects related directly to their pharmacological mode of action. These include vasomotor symptoms (hot flushes, night sweats), menstrual abnormalities/irregularities, vaginal discharge, and vaginal dryness.12 Research has shown a direct relationship between experiencing these side effects and women’s non-adherence and/or non-persistence with their oral adjuvant therapy.13 Thus understandably, many women find it hard to adhere to hormonal medicines they are prescribed and expected to take for at least 5 years following the initial management of their breast cancer. Prevalence of adherence ranges from 41 to 72% and discontinuation (ie, non-persistence) from 31 to 73%, measured at the end of 5 years of treatment.13
Our core theory encapsulating women’s experiences of taking hormone therapy in breast cancer had three constituent categories.11 Our core theory, labelled “Hobson”s choice or a horned dilemma’, is that women’s decision to take hormonal medicines is, to them, not seen as a choice at all, or when there is a choice, it is between two equally bad options. To explain, at the start of their treatment journey women feel they are given one choice only, which is to start hormonal therapy; category 1 “Guided by the doctors: accepting the long-term prescription” (Figure S1). Then as the treatment progresses and women experience numerous medication side-effects, they feel they must either tolerate these adverse effects or stop the treatment altogether and risk losing the protective benefit of their medication; category 2 “Balancing priorities: adhering to the long-term treatment” (Figure S2). Finally, some women feel empowered to stop their medication altogether prioritizing quality of life over longevity; category 3 “Taking a chance: stopping the treatment early” (Figure S3). These categories are detailed and were constructed within “paradigm models” which encompassed the specific context, causal conditions, actions/interactions, and consequences for women, as well as the mediating factors which influenced the different actions and interactions.11 Leaving these findings submerged within a research paper is unjust when potentially sharing them could help improve patients’ experiences. This was especially since our findings had been developed using the views and experiences of 610 women with a breast cancer diagnosis detailed in 24 individual studies, providing a more comprehensive understanding of the phenomenon of medication-taking for this condition than any other study published before.
The aim of the current paper was to visually represent these findings so that they would be accessible to patients and health professionals and facilitate communication at the different stages of treatment. Our rationale was that communicating other women’s “trials, tribulations, and triumphs” with medication-taking via a suitable means could help newly-diagnosed patients to better prepare for the journey ahead. We envisaged visual representations could also help women to communicate their own experiences to health professionals once treatment had commenced.
Materials and Methods
Schematic Development
Each category described in our literature review was accompanied by a corresponding paradigm model which portrayed experiences at one of three stages of treatment with adjuvant hormone therapy prescribed following the initial management of breast cancer, ie the beginning, treatment continuation phase, and early cessation. These models are presented in the Figures S1–S3, respectively.
Each model was developed into a corresponding schematic with reference to published guidelines on the development of visual material.4,14,15 To do so, each schematic was divided into individual pictograms that were hand drawn by the first author (OA) and modified in collaboration with a graphic designer through numerous drafts and iterations. The schematics and pictograms were designed to visually represent all information within the paradigm models while being as simple and easy to understand as possible.
Content Validation
The content validity index (CVI) was used to determine the validity of the schematics and individual pictograms against the original models and their content. The CVI can measure the extent of agreement between experts about each item (pictogram) and this helps make improvement at the level of each pictogram as needed.16 The CVI has been used previously by the authors’ research team in a number settings.17–19 A panel of 10 healthcare professionals (purposively sampled) were recruited for the content validation exercise, based on criteria developed by Lynn20 for such a panel to consist of a minimum of three and a maximum of ten people. The panel was recruited via an email and information sheet sent to UK and internationally registered pharmacists working in the university – recruitment stopped once 10 had agreed to take part.
A questionnaire was designed such that each row illustrated an individual pictogram, a description of the corresponding concept from the paradigm model and a rating scale to measure the panel member’s assessment of that pictogram. For each pictogram-description pair the panel member was asked if the pictogram in the second column represented the description in the first column, with option to (1) “strongly agree”, (2) “agree”, (3) “disagree” or (4) “strongly disagree”; see the example below Table 1. This four-point scale was used in line with the literature.20–22
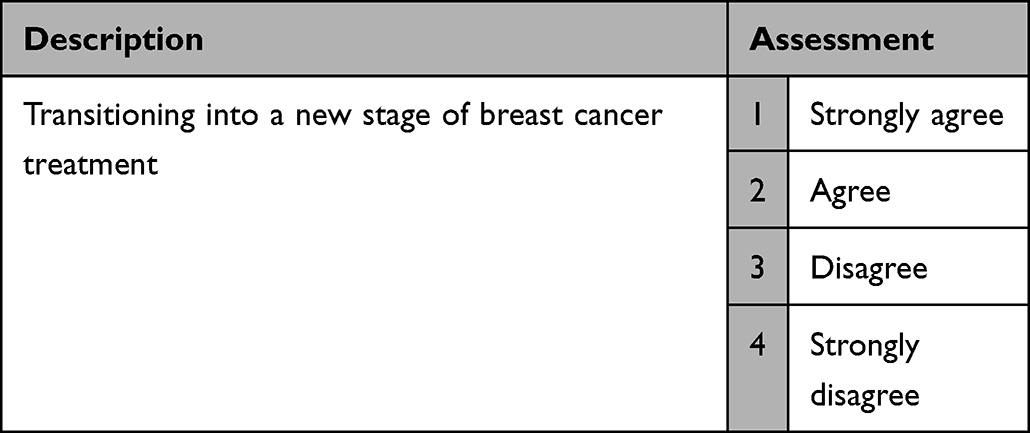 |
Table 1 Example from the Content Validity Questionnaire |
The item-level CVI (I-CVI) for each pictogram was determined by calculating the proportion of panel members who gave a rating of 1 or 2 (strongly agree or agree) to the corresponding assessment question. An I-CVI of ≥0.8 (8 ratings of 1 or 2 from 10 raters) was judged as the minimum acceptable value for responses for each pictogram. This minimum acceptable value was based on Lynn’s criteria20 and our previous publications17–19 and any pictogram not receiving the minimum acceptable value was subjected to redesign and re-evaluation. This involved the first author in holding additional meetings with the panel members to discuss the suggested changes before making modifications and gaining agreement on the next design. Finally, a “schematic level” CVI was calculated for each of the three models by averaging the I-CVIs of the associated pictograms, and an overall CVI by averaging the schematic level CVIs. This method is referred to in the literature as the “averaging calculation method” and usually would also be expected to return a CVI ≥0.8 with ten raters.16
Consultation with Breast Cancer Survivors
The final stage of the validation process involved asking a set of questions within qualitative one-to-one interviews held with a panel of breast cancer survivors (n=14) as part of a separate qualitative study. The interviews were semi-structured and the validation involved a discussion about the three models to check their clarity, simplicity and accuracy in depicting the concept each was intended to represent. The following questions were used as the basis of the discussion about each individual pictogram and the overall schematic: “Do you find yourself in the pictograms?”, “Would you like to add anything to it?” and “Do you think these pictograms are useful? How? And to whom?”
The breast cancer survivors were recruited via an invitation email and information sheet sent to staff working within the university and to coordinators of breast cancer support groups whose contact details were freely available on the internet via Macmillan cancer support. The women recruited (9 via the University and 5 externally) had all been diagnosed with breast cancer in the past and received a prescription for oral hormonal medication for the long-term management of their condition, namely tamoxifen and/or an aromatase inhibitor (anastrozole, exemestane, letrozole).
Results
There were 76 individual pictograms across the three schematics. Of these, 13 had an I-CVI <0.8 and so were deemed in need of modification (see Figure S4). The feedback for improving these individual pictograms is also shown in Figure S4. Once changes were implemented, the average CVI for each of the three schematics were 87%, 87% and 80%, respectively, and the overall average for the set of schematics was 85.1%.
The qualitative comments made by the breast cancer survivors in relation to the quality and representativeness of the pictograms are shown in Table S1. In summary, the participants could identify with most if not all the experiences depicted in the pictograms and the schematics. For example:
Yeah, but yes I can identify with many of those things. Not all but yeah, to some degree most of them, yeah. Interview 1
I think I recognize myself in quite a lot of that as well. Interview 12
They did not identify deficiencies to address. Most importantly, they expressed positive views about the usefulness of the schematics in terms of validating and normalising their experiences and giving them information about potential problems and solutions ahead of time. For example:
And you go, yeah, yeah, it is, in fact it’s normal because that’s what I felt. So it then validates the fact that I was feeling it must be OK because someone else has felt it so I wasn’t going mad, if you know what I mean. Interview 11
Yeah, no worries. I mean, I’m hoping your thesis or dissertation or whatever it calls, whatever comes of all of your studying will actually make it. I certainly think if I’d have had some of these pictures to look at before, you know, sort of, five or six years ago, it would have helped me, not, I mean, I don’t suppose for a minute it would stop me thinking I was going mad but it would help thinking, well, hang on a minute, that is normal. Interview 11
Some also felt the schematics would be useful for their GP or breast cancer nurse to improve their education and communication. For example:
I think that’s really great for the GP, yeah. Thank you. Or for anybody that’s involved in prescribing or giving out information. Interview 13
It would help me if I was say a breast care nurse or something like that I would find this very, very helpful to go through. Interview 14
The final set of schematics arising from this research are shown Figures 1–3.
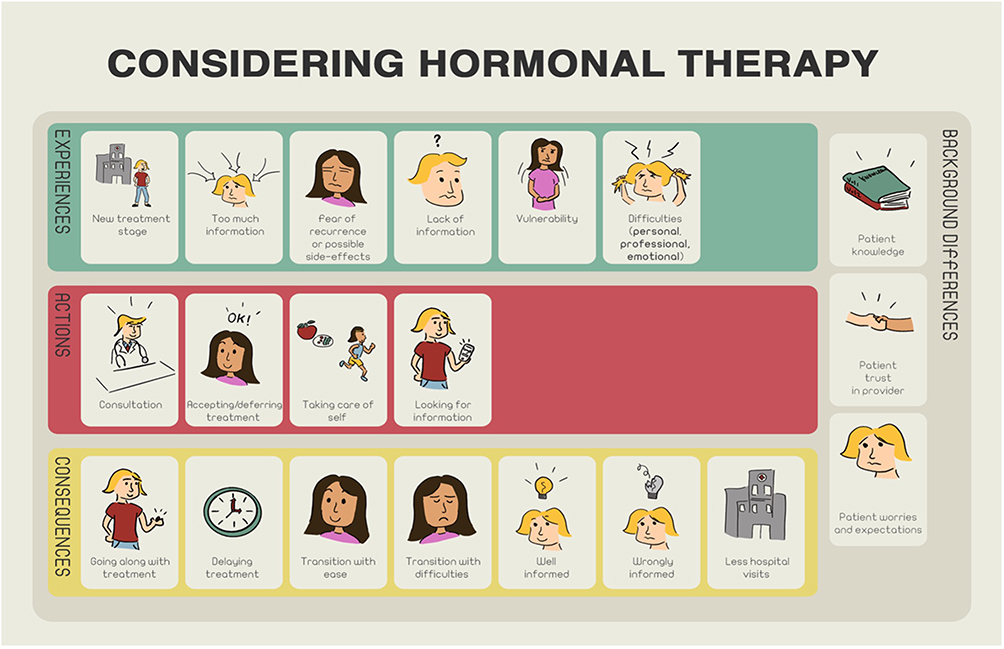 |
Figure 1 Schematic 1 developed for the first paradigm model “Guided by the doctors: accepting the long-term prescription”. |
 |
Figure 2 Schematic 2 developed for the first paradigm model “Balancing priorities: adhering to the long-term treatment”. |
 |
Figure 3 Schematic 3 developed for the first paradigm model “Taking a chance: stopping the treatment early”. |
Discussion and Conclusion
Discussion
This study employed a sequential approach whereby an existing grounded-theory synthesis of the literature informed the development of a set of picture-based schematics, the content of which was validated with a panel of health professionals, and then checked with an additional group of patients. These schematics visually convey the findings of our published meta-synthesis11 to enable both health professionals and women to benefit from existing research during medication-related discussions. We imagine these materials will be useful during discussions between health professionals and women at the start of adjuvant hormone treatment, during the continuation phase and when discontinuation is being considered. To make the pictograms more understandable, each was designed with a picture and associated text in line with Mayer’s15 cognitive theory of multimedia learning, which recommends the combined use of different media to increase understanding. Involvement of a graphic designer in the development of the pictograms7 enhanced the drawings and helped capture the emotion and facial expressions appropriate to each picture. The inclusion of health professionals at the first check was also in line with published recommendations4,7,14,15 and proved helpful in challenging our assumptions during the design process. The next step of sharing the pictograms with breast cancer survivors allowed us to receive responses on the usefulness of these first-hand and with the end users’ involvement.23
The 2018 National Institute for Health and Care Excellence (NICE) guidelines on the diagnosis and management of early and locally advanced breast cancer24 recommend the use of the PREDICT tool25 to estimate the prognosis and the absolute benefits of adjuvant hormonal therapy for women with invasive breast cancer, and making decisions based on multidisciplinary team assessments and in discussion with the person being treated. It is within this first discussion that we believe the schematics developed in this study could first be used. The NICE guidelines also recommend offering extended hormone therapy beyond an initial five years with tamoxifen or an aromatase inhibitor, depending on the circumstances, to include a discussion of the benefits and risks of doing so. Again, we believe the schematics developed could be used at this point to supplement those conversations. Specifically, we believe the schematics can support women to convey their experiences and any worries while discussing their preference in relation to continuing their medication. However, it is important to acknowledge a risk that, viewed on their own, the schematics also have the potential to impact negatively on adherence, their use within structured conversations is therefore emphasised.
In our study, patient experts were recruited to qualitative interviews to authenticate the pictograms and to give their recommendations. Their responses were positive with all the participants able to associate with the pictograms, stating these captured their own story and were easy to comprehend. It is possible however that the positive responses arose from a desire to please the interviewer, reducing the trustworthiness of the feedback. When asked about the potential benefits of the pictograms, multiple participants reported they were relieved that the pictograms normalized their own experience and allowed them to feel they were not alone in their journey. This finding is in line with other research which also acknowledges the role of visual storytelling by female breast cancer patients and survivors to narrate and normalise their healthcare experiences.26 Our participants also believed the pictograms developed in our study could be used to educate health professionals seen outside of the annual follow-up meetings with the specialists,27 for example for GPs and others to learn about women’s experiences with hormone therapy. This would make the schematics appropriate for newer models of care such as shared follow-up care for early breast cancer being explored elsewhere.28
One of the strengths of this study derives from its sequential approach, which allowed the designs to be validated by healthcare professionals. Also, by involving breast cancer survivors, the pictograms were validated by actual experts who had lived or were living the experiences the pictograms were trying to portray. However, it is worth mentioning that this study also has some limitations. The schematics were not examined in a clinical setting to assess their utility in practice thus their use should be limited to discussions within consultations, rather than as information leaflets to use at home. Also, they were developed using categories derived from the results of a meta-synthesis that used quotations from previously published articles rather than primary data. Future research could evaluate the utility of these schematics, hitherto missing from the literature, within a clinical setting to assess the practicalities and benefits of using them within actual consultations. This could include, for example the impact of using the schematics on the decision-making processes and ultimately women’s choices to start, continue or stop their adjuvant hormone therapy.
Conclusion
A visual approach was used to develop and validate a set of picture-based schematics from the findings of our systematic review of women’s experiences with adjuvant hormone therapy in breast cancer. The breast cancer survivors endorsed the schematics as valid and relevant to their experiences and recommended their use both to support other women in the future and to enable health practitioners to develop a deeper understanding of women’s experiences. Further research is needed to examine the usefulness and impact of the schematics within clinical practice.
Practice Implications
Improving understanding of medication-taking experiences during treatment with adjuvant hormone therapy in breast cancer should be a priority for health practitioners and other researchers. Arguably, using the schematics as they are, or incorporated within a wider intervention, has the potential to improve communication about treatment and assist patients in choosing the right medication pathway for them, thus improve their clinical and quality of life outcomes.
Ethics Approval
This study was performed in line with the principles of the Declaration of Helsinki. Approval was granted by the Ethics Committee of University of Reading (26th Jan 2018/UREC 17/51).
Consent to Participate
Informed consent was obtained from all individual participants included in the study.
Acknowledgments
The authors would like to thank the study participants and Shaqra University for sponsoring the PhD of Othman AlOmeir.
Author Contributions
Parastou Donyai and Othman AlOmeir had the idea for the research. Othman AlOmeir performed the interviews in consultation with Parastou Donyai. Parastou Donyai, Othman AlOmeir and Nilesh Patel were involved in the data analysis. Othman AlOmeir and Parastou Donyai drafted and Parastou Donyai, Othman AlOmeir and Nilesh Patel critically revised the work. Parastou Donyai, Othman AlOmeir and Nilesh Patel read and approved the final manuscript and agreed on which journal to submit to. Parastou Donyai, Othman AlOmeir and Nilesh Patel agreed to take responsibility and be accountable for the contents of the article.
Funding
The authors declare that no funds, grants, or other support were received during the preparation of this manuscript.
Disclosure
The authors have no relevant financial or non-financial interests to disclose in this work.
References
1. Arora NK. Interacting with cancer patients: the significance of physicians’ communication behavior. Soc Sci Med. 2003;57(5):791–806. doi:10.1016/S0277-9536(02)00449-5
2. Arora NK, Finney Rutten LJ, Gustafson DH, Moser R, Hawkins RP. Perceived helpfulness and impact of social support provided by family, friends, and health care providers to women newly diagnosed with breast cancer. Psychooncology. 2007;16(5):474–486. doi:10.1002/pon.1084
3. Clawson TH, Leafman J, Nehrenz GM, Kimmer S. Using pictograms for communication. Mil Med. 2012;177(3):291–295. doi:10.7205/MILMED-D-11-00279
4. Houts PS, Doak CC, Doak LG, Loscalzo MJ. The role of pictures in improving health communication: a review of research on attention, comprehension, recall, and adherence. Patient Educ Couns. 2006;61(2):173–190. doi:10.1016/j.pec.2005.05.004
5. Kripalani S, Robertson R, Love-Ghaffari MH, et al. Development of an illustrated medication schedule as a low-literacy patient education tool. Patient Educ Couns. 2007;66(3):368–377. doi:10.1016/j.pec.2007.01.020
6. Montagne M. Pharmaceutical pictograms: a model for development and testing for comprehension and utility. Res Soc Adm Pharm. 2013;9(5):609–620. doi:10.1016/j.sapharm.2013.04.003
7. Barros IMC, Alcântara TS, Mesquita AR, Santos ACO, Paixão FP, Lyra DP. The use of pictograms in the health care: a literature review. Res Soc Adm Pharm. 2014;10(5):704–719. doi:10.1016/j.sapharm.2013.11.002
8. Donyai P. Keep on taking the medicine? Psychologist. 2019;32(2):22–25.
9. NICE. NICE Clinical Guidance [NG5] Medicines optimisation: the safe and effective use of medicines to enable the best possible outcomes; 2015. Available from: https://www.nice.org.uk/guidance/NG5.https://www.nice.org.uk/guidance/ng5.
10. Donyai P, Alomeir O. Determining How to Complete a Grounded Theory Meta-Synthesis of Research Examining Patient Views on Adjuvant Hormonal Therapy for Breast Cancer. SAGE Publications Ltd; 2020. doi:10.4135/9781529743418
11. AlOmeir O, Patel N, Donyai P. Adherence to adjuvant endocrine therapy among breast cancer survivors: a systematic review and meta-synthesis of the qualitative literature using grounded theory. Support Care Cancer. 2020;28(11):5075–5084. doi:10.1007/s00520-020-05585-9
12. Wockhardt UK Ltd. Tamoxifen 20mg Film-Coated Tablets - Summary of Product Characteristics (SmPC). emc. Available from: https://www.medicines.org.uk/emc/product/2248/smpc#UNDESIRABLE_EFFECTS.
13. Murphy CC, Bartholomew LK, Carpentier MY, Bluethmann SM, Vernon SW. Adherence to adjuvant hormonal therapy among breast cancer survivors in clinical practice: a systematic review. Breast Cancer Res Treat. 2012;134(2):459–478. doi:10.1007/s10549-012-2114-5
14. Rohret L, Ferguson KJ. Effective use of patient education illustrations. Patient Educ Couns. 1990;15(1):73–75. doi:10.1016/0738-3991(90)90010-I
15. Dowse R, Ramela T, Browne SH. An illustrated leaflet containing antiretroviral information targeted for low-literate readers: development and evaluation. Patient Educ Couns. 2011;85(3):508–515. doi:10.1016/j.pec.2011.01.013
16. Polit DF, Beck CT. The content validity index: are you sure you know what’s being reported? Critique and recommendations. Res Nurs Heal. 2006;29(5):489–497. doi:10.1002/nur.20147
17. Ibrahim K, Randolph G, Doran O, Donyai P. The construction and validation of child, adolescent and parental decision aids for considering methylphenidate drug holidays in ADHD. Pharmacy. 2018;6(4):122. doi:10.3390/pharmacy6040122
18. Hindi A, Parkhurst C, Rashidi Y, Ho SY, Patel N, Donyai P. Development and utilization of the medicines use review patient satisfaction questionnaire. Patient Prefer Adherence. 2017;11:1797–1806. doi:10.2147/PPA.S146991
19. Alhamad H, Donyai P. Intentions to “reuse” medication in the future modelled and measured using the theory of planned behavior. Pharmacy. 2020;8(4):213. doi:10.3390/pharmacy8040213
20. Lynn MR. Determination and quantification of content validity. Nurs Res. 1986;35(6):382–386. doi:10.1097/00006199-198611000-00017
21. Waltz CF, Bausell RB. Nursing research: design, statistics, and computer analysis. Philadelphia F A Davis; 1981. Available from: https://books.google.com/books/about/Nursing_Research.html?id=cyJtAAAAMAAJ.
22. Davis LL. Instrument review: getting the most from a panel of experts. Appl Nurs Res. 1992;5(4):194–197. doi:10.1016/S0897-1897(05)80008-4
23. van Beusekom MM, Kerkhoven AH, Bos MJW, Guchelaar HJ, van den Broek JM. The extent and effects of patient involvement in pictogram design for written drug information: a short systematic review. Drug Discov Today. 2018;23(6):1312–1318. doi:10.1016/j.drudis.2018.05.013
24. NICE. Overview early and locally advanced breast cancer: diagnosis and management guidance NICE. NICE Guidel; 2018. Available from: https://www.nice.org.uk/guidance/ng101/chapter/recommendations#endocrine-therapy.
25. NHS. Predict breast cancer. Univ Cambridge; 2020. Available from: https://breast.predict.nhs.uk/index.html.
26. Gurrieri L, Drenten J. Visual storytelling and vulnerable health care consumers: normalising practices and social support through Instagram. J Serv Mark. 2019;33(6):702–720. doi:10.1108/JSM-09-2018-0262
27. NICE. Improving outcomes in breast cancer | guidance. NICE; 2002. Available from: https://www.nice.org.uk/guidance/csg1.
28. White V, Der Vartanian C, Tansley F, Ugalde A. Understanding women’s perspectives and information needs about shared follow-up care for early breast cancer: a qualitative study. Fam Pract. 2021;38(6):786–792. doi:10.1093/fampra/cmab048
 © 2022 The Author(s). This work is published and licensed by Dove Medical Press Limited. The
full terms of this license are available at https://www.dovepress.com/terms
and incorporate the Creative Commons Attribution
- Non Commercial (unported, 3.0) License.
By accessing the work you hereby accept the Terms. Non-commercial uses of the work are permitted
without any further permission from Dove Medical Press Limited, provided the work is properly
attributed. For permission for commercial use of this work, please see paragraphs 4.2 and 5 of our Terms.
© 2022 The Author(s). This work is published and licensed by Dove Medical Press Limited. The
full terms of this license are available at https://www.dovepress.com/terms
and incorporate the Creative Commons Attribution
- Non Commercial (unported, 3.0) License.
By accessing the work you hereby accept the Terms. Non-commercial uses of the work are permitted
without any further permission from Dove Medical Press Limited, provided the work is properly
attributed. For permission for commercial use of this work, please see paragraphs 4.2 and 5 of our Terms.
Recommended articles
Interventions to Improve Medication Adherence in People with Schizophrenia: A Systematic Review
Cahaya N, Kristina SA, Widayanti AW, Green J
Patient Preference and Adherence 2022, 16:2431-2449
Published Date: 1 September 2022
Perceptions with Type 2 Diabetes Mellitus of the Value of Prescribed Medications Among Malaysian Adults: A Qualitative Study
Lim MC, Hatah E, Lai KC, Buang A, Koay TJ, Sim WJY, Ng SC
Patient Preference and Adherence 2022, 16:3133-3142
Published Date: 29 November 2022
Factors Affecting Patient Adherence to Inhalation Therapy: An Application of SEIPS Model 2.0
Ma J, Sun X, Wang X, Liu B, Shi K
Patient Preference and Adherence 2023, 17:531-545
Published Date: 3 March 2023
Palbociclib Adherence and Persistence in Patients with Hormone Receptor Positive/Human Epidermal Growth Factor Receptor 2 Negative (HR+/HER2-) Metastatic Breast Cancer
Engel-Nitz NM, Johnson MG, Johnson MP, Cha-Silva AS, Kurosky SK, Liu X
Patient Preference and Adherence 2023, 17:1049-1062
Published Date: 18 April 2023
Exploring the Important Determinants Shaping Treatment Preferences: Qualitative Insights into Breast Cancer Patient Experiences and Perspectives in New Zealand
Yeo HY, Wong JHY, Chan SJ, Latu ATF, Han CH, Anwar M, Marra CA
Patient Preference and Adherence 2023, 17:3525-3537
Published Date: 22 December 2023