Back to Journals » Nature and Science of Sleep » Volume 13
The Development of a Rapid Classification Scale for Sleep Quality in Community-Dwelling Older Adults – The Yilan Study, Taiwan
Authors Chen HC ![]() , Hsu NW, Pan PJ
, Hsu NW, Pan PJ ![]() , Kuo PH
, Kuo PH ![]() , Chien MY, Chou P
, Chien MY, Chou P
Received 15 June 2021
Accepted for publication 21 October 2021
Published 5 November 2021 Volume 2021:13 Pages 1993—2006
DOI https://doi.org/10.2147/NSS.S324928
Checked for plagiarism Yes
Review by Single anonymous peer review
Peer reviewer comments 2
Editor who approved publication: Prof. Dr. Ahmed BaHammam
Hsi-Chung Chen,1,2 Nai-Wei Hsu,3– 5 Po-Jung Pan,6 Po-Hsiu Kuo,1,7 Meng-Yueh Chien,8 Pesus Chou9
1Department of Psychiatry, National Taiwan University Hospital, Taipei, Taiwan; 2Center of Sleep Disorders, National Taiwan University Hospital, Taipei, Taiwan; 3Division of Cardiology, Department of Internal Medicine, National Yang-Ming Chiao Tung University Hospital, Yilan, Taiwan; 4Department of Medicine, School of Medicine, National Yang-Ming Chiao Tung University, Taipei, Taiwan; 5Public Health Bureau of Yilan County, Yilan, Taiwan; 6Department of Physical Medicine and Rehabilitation & Community Medicine Center, National Yang-Ming Chiao Tung University Hospital, Yilan, Taiwan; 7Graduate Institute of Epidemiology and Preventive Medicine, College of Public Health, National Taiwan University, Taipei, Taiwan; 8College of Medicine, National Taiwan University and the Physical Therapy Center of National Taiwan University Hospital, Taipei, Taiwan; 9Community Medicine Research Center & Institute of Public Health, National Yang-Ming Chiao Tung University, Taipei, Taiwan
Correspondence: Hsi-Chung Chen
Department of Psychiatry, National Taiwan University Hospital, No. 7 Chung San South Road, Taipei, 10002, Taiwan
Tel +886-2-2312-3456 ext. 66787
Fax +886-2-2381-320
Email [email protected]
Objective: Poor sleep quality is prevailing, deleterious, but heterogeneous in older adults. This study aimed to develop a simplified instrument to screen and classify poor sleep quality in community-dwelling older adults, by which stepped care with needs-based interventions could be implemented.
Methods: Cohorts of adults aged 65 years and older were used to develop the Rapid Classification Scale for Sleep Quality (RCSSQ). Poor sleep quality was defined with the Pittsburgh Sleep Quality Index (PSQI). Established subgroups of poor sleep quality in the development dataset (n = 2622) were used as the criterion standard. Two independent validation datasets (n = 964 and 193, respectively) were used to examine the external validity. Questions in the PSQI were examined by the stepwise multinomial logistic regressions to determine the optimal numbers of items in the RCSSQ. On the premise of item parsimony and instrument validity, the optimal combination of reduced items was determined.
Results: In the development dataset, the 4-item RCSSQ (RCSSQ-4) was the optimal predictive model. In terms of internal validity, the accuracy rates to identify PSQI-defined poor sleep quality and its subgroups in the developmental dataset by the RCSSQ-4 were 89.0% and 79.9%, respectively. Meanwhile, the RCSSQ-4 also had good external validity in the validation datasets to detect PSQI-defined poor sleep quality (accuracy rates: 89.1– 90.7%). Furthermore, the profiles of PSQI component scores and comorbid conditions for the predicted subgroups in the validation dataset were comparable with the criterion standard.
Conclusion: The RCSSQ-4 is a valid instrument for screening and subgrouping poor sleep quality in community-dwelling older adults. The RCSSQ-4 may help guide tailored interventions under the context of stepped care in the community.
Keywords: older adults, screen, sleep quality, subgroup, scale, the Yilan study
Introduction
Sleep quality is imperative to health, but declines with age.1 In light of the stringency of definitions, the prevalence of poor sleep quality in community-dwelling older adults ranges between 23.2–66.9%.2–9 Poor sleep quality in older adults is associated with a variety of adverse health outcomes,2,10 including a higher risk for insomnia,11 depression,12 anxiety,5 falls,13 suicide,14 atherosclerosis,15 declining quality of life,16 disability,2,6 cognitive impairment,17–19 and mortality.20 Furthermore, poor sleep quality in older adults is even more deleterious than insomnia without daytime repercussions.21,22 Thus, in order to promote the well-being of older adults, early recognition and intervention for poor sleep quality is an important issue of public health.
However, sleep quality has not been well conceptualized in the literature.23 Compared with insomnia that has clearer operational definitions, the manifestations and underlying etiology for poor sleep quality are more diverse and complex, leading to ineffective and inefficient one-size-fits-all interventions. Taking the Pittsburgh Sleep Quality Index (PSQI) as an example, this most commonly used instrument was initially designated as a uni-construct with seven underlying components.24 In recent studies, pleural constructs of the PSQI have been explored in the general,16,25–30 and older populations.31 The multi-constructs of the PSQI indicate the phenotypic heterogeneity of poor sleep quality in older adults. Under these circumstances, older adults with PSQI-defined poor sleep quality may respond differently to similar interventions. Thus, various modules of interventions are needed for the specific phenotypes of poor sleep quality. However, the different modules may demand various levels of professions, time, and labor,32–35 by which the accessibility and availability are determined.36 Accordingly, the heterogeneity of poor sleep quality not only leads to inadequate diagnosis and treatment but may also incur over-treatment or inappropriate use of hypnosedatives.13,37–41 This issue is particularly relevant in the older population, in which poor sleep quality is prevailing and who are more susceptible to the adverse impact of hypnosedatives. Empirically classifying poor sleep quality is a solution to its heterogeneity and provides an opportunity to implement personalized interventions in older adults. According to feature-based subgroups, specific modules of interventions could be designated, by which stepped care of poor sleep quality in community-dwelling older adults could be achieved.42
Recently, according to the PSQI and the latent class analysis, the Yilan study in Taiwan has obtained empirically-derived subgroups of poor sleep quality in community-dwelling older adults.39 Three feature-based clusters have been identified and designated as “High insomnia (HI),” “Low insomnia (LI),” and “High hypnotics (HH).” The HI and LI groups were similar in the geometric profile of the component scores of the PSQI in the radar chart. They differed in the severity level of the component scores of the PSQI and comorbidity patterns. In contrast, HH and HI differed in the distribution of the component scores of the PSQI, in which HH had lower severity of insomnia symptoms, comparable with the LI group. In contrast, HH and HI shared a comparable severity of comorbidities conditions. Although these feature-based subgroups may enable the application of personalized community-based stepped care, the generalizability of the traditional clustering methods is limited due to the sample representativeness. In addition, the lengthy content of the PSQI and the cognitive demand that is needed to respond to these questions also compromises the usefulness of the PSQI for screening community-dwelling older adults.39 Thus, a simplified and valid instrument that could efficiently screen and cluster sleep quality is necessary before we can implement stepped care for poor sleep quality in community-dwelling older adults.
In summary, although poor sleep quality is prevalent and deleterious in older adults, one-size-fits-all interventions are insufficient due to the heterogeneous pattern and complex etiology of poor sleep quality. In terms of community medicine, detecting and clustering poor sleep quality with a simplified classifier could prompt need-based, stepped care of mental health. Using established subgroups in the previous Yilan study as the criterion standard, the present study aims to develop a simplified instrument to screen and subgroup the PSQI-defined poor sleep quality in community-dwelling older adults. In addition to internal validity, the generalizability of this novel instrument will be verified.
Materials and Methods
Participants
This study is a branch study of the umbrella project of the Yilan study in Taiwan. The Yilan study is an integrated, community-based cohort study that aims to comprehensively evaluate the mental and physical well-being of community-dwelling older adults. Older adults aged 65 years and more were randomly recruited from the Yilan city in Taiwan since 2013. The study design has been detailed elsewhere.43 The present study used two parts of the Yilan study cohort. One part (ie, the development dataset) was established in a previous study from 2013 to 2016 (n = 2622), where empirically derived subgroups for the PSQI-defined poor sleep quality were identified.39 Another part of participants of the Yilan study, who had been newly recruited from 2016 to 2019 (n = 964), were used as the validation dataset. An additional cohort (n = 193), which was established to investigate the PSQI-defined poor sleep quality among older adults in Taipei City (Taiwan) in 2013,2 was used as an additional validation dataset to verify the external validity of the newly developed instrument. All participants in the cohort of the Yilan study were interviewed on a common set of variables, including sociodemographic characteristics, anthropometric data, education status, marital status, living status, lifestyles (ie, frequency of exercise per week, smoking, alcohol drinking), history of chronic medical diseases, falls, depression and anxiety, and physical disability. In contrast, only a few variables of the Yilan study were available in the Taipei City cohort because of different study designs. All interviews were conducted face-to-face by well-trained research assistants. Individuals who could not complete the interview, or were unable to cooperate because of severe physical disability or compromised cognitive function, were excluded from this study. All participants provided written informed consent, and the Institutional Review Board of the National Yang-Ming Chiao Tung University and the National Taiwan University Hospital approved this study. This study was conducted in accordance with the Helsinki Declaration of 1975, as revised in 2008.
Study Design and Procedure
Subgroups Established Using the PSQI-Defined Poor Sleep Quality
This study defined poor sleep quality using the PSQI, which evaluates individuals’ subjective sleep quality in the past month. The PSQI comprises 19 items and provides seven component scores, including subjective sleep quality, sleep onset latency, total sleep duration, sleep efficiency, sleep disturbances, use of sleep medication, and daytime dysfunction.24 Those who scored six points and more in the PSQI were defined as older adults with poor sleep quality. The Chinese version of the PSQI has been validated.44 In the development dataset of the Yilan study, we have used latent class analysis with seven components of the PSQI as the indicator variables to cluster those with PSQI-defined poor sleep quality (PSQI ≥ 6, 38.6%). As a result, three feature-based clusters were identified and designated as LI (21.9%), HI (7.3%), and HH (9.4%), respectively.39 The HI group is characterized by pervasive insomnia symptoms and daytime repercussion but with a low frequency of hypnosedative use. In parallel, the LI group had a similar profile of sleep-wake-related psychopathology with the HI but presented with a lower severity over each dimension of the PSQI component scores. In contrast, the HH group showed a comparable, lower severity across five component scores of the PSQI with LI, except for a significantly higher frequency of hypnosedative use and more prominent daytime dysfunction, similar to the HI group (Figure 1A). On the contrary, the HI and HH groups had a similar profile of comorbidity severity, while the LI group had better mental and physical well-being (Figure 2A). In the present study, a total of four subgroups, including the three subgroups of poor sleep quality and those with a PSQI < 6, were defined as the criterion standard to develop and to verify the simplified screen and cluster instrument in the development dataset.
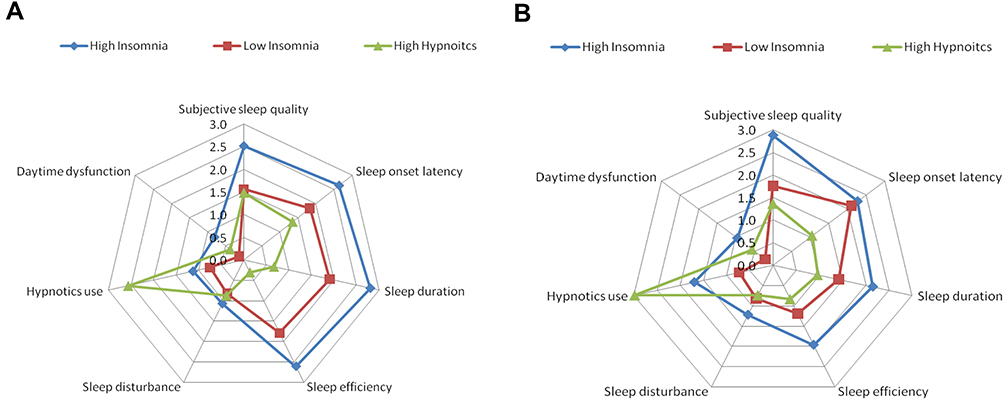 |
Figure 1 Radar charts comparing the distributions of the seven component scores of the Pittsburgh Sleep Quality Index (PSQI) between subgroups across datasets. (A) shows the original empirically-derived subgroups in the development dataset. (B) shows the three subgroups specified by the Four-item Rapid Classification Scale for Sleep Quality (RCSSQ-4) in the validation dataset. (A) is adapted from Chen HC, Hsu NW, Chou P. Subgrouping Poor Sleep Quality in Community-Dwelling Older Adults with Latent Class Analysis - The Yilan Study, Taiwan. Sci Rep. 2020;10(1):5432.39 |
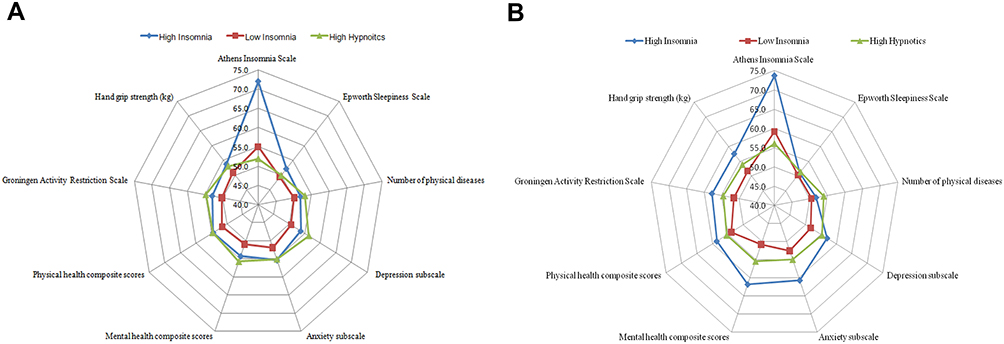 |
Figure 2 Radar charts comparing the clinical features between subgroups across datasets. (A) shows the original empirically-derived subgroups in the development dataset. (B) shows the three subgroups specified by the Four-item Rapid Classification Scale for Sleep Quality (RCSSQ-4) in the validation dataset. (A) is adapted from Chen HC, Hsu NW, Chou P. Subgrouping Poor Sleep Quality in Community-Dwelling Older Adults with Latent Class Analysis - The Yilan Study, Taiwan. Sci Rep. 2020;10(1):5432.39 |
Conceptualization of the Rapid Classification Scale for Sleep Quality
On the premise of an easy application in community-dwelling older adults, by means of either paper-pencil format or the online approach, this study conceptualized and designated the screening and classifying instrument to-be as the “Rapid Classification Scale for Sleep Quality (RCSSQ)” in accordance with the following two principles:
- Good criterion validity for PSQI-defined poor sleep quality and respective subgroups
The RCSSQ is expected to have good internal validity in the development dataset, taking the established subgroups as the criterion standard. Regarding the external validity (ie, generalizability), the RCSSQ must be able to effectively screen older adults with PSQI-defined poor sleep quality (PSQI ≥ 6) and successfully classify them with a comparable feature-based difference in the validation datasets. In order to optimize the generalizability of the RCSSQ,45 in addition to the cohort in Yilan City, the present study used another cohort in Taipei City in Taiwan to examine the external validity of the RCSSQ. Compared with the agricultural, suburban Yilan City, Taipei City is a metropolitan city located in northern Taiwan, which has different sociodemographic characteristics. In the validation dataset of Yilan City, the comorbidity profile in the predictive subgroups of RCSSQ could be compared with the participants in the development dataset of Yilan City. However, because only PSQI data was available in the cohort of Taipei City, except for the examination of external validity for predicting the PSQI-defined poor sleep quality, no comorbidities pattern could be compared with the development dataset. Validity indices were illustrated with the accuracy rate, sensitivity, specificity, positive predictive value (PPV), negative predictive value (NPV), and radar charts.
In terms of community-based geriatric medicine, a simplified and easy-to-respond instrument with less cognitive demand is beneficial. Thus, in order to facilitate the convenience and intuitiveness of responding to questions, the items in the PSQI that necessitate responders to fill in actual data, such as bedtime, rise time, latency to fall asleep, and total sleep time, were not considered as candidate items for the RCSSQ. Therefore, this study selected all 13 multiple-choice items (score range: 0–3) in the PSQI as the initial set of candidate questions for the RCSSQ. All of these questions enquire about the responders’ sleep-wake conditions in the past four weeks, including items in the component one, “How would you rate your sleep quality overall?” (Sleep Quality); one of the items in component 2, “How often have you had trouble sleeping because you cannot get to sleep within 30 minutes?” (Sleep Latency); all eight items in component 5, “How often have you had trouble sleeping because you wake in the middle of the night or early morning?” (Sleep Disruption); “Have to get up to the bathroom?” (Nocturia); “Cannot breathe comfortably?” (Difficulty Breathing); “Cough or snore loudly?” (Disordered-breathing Sleep); “Feel too cold?” (Cold); “Feel too hot?” (Hot); “Had bad dreams?” (Nightmares), and “Have pain?” (Pain); the item in component 6, “How often have you taken medicine (prescribed or “over the counter”) to help you sleep?” (Hypnotics Use); and all two items in component 7, “How often have you had trouble staying awake while driving, eating meals, or engaging in social activity?” (Sleepy Activities); “How much of a problem has it been for you to keep up enough enthusiasm to get things done?” (Lacking Enthusiasm). The stepwise multinomial logistic regressions ensued to determine a most predictive set of items for the criterion standard by specifying these questions as predictors (the full model). Afterward, according to the explanatory power of each item included in the full model, a series of reduced models were specified by removing less explanatory items one-by-one. Eventually, by comparing the performance of each reduced model with the full model, a parsimonious model without compromised validity was determined as the final version of the RCSSQ.
Variables Used to Profile Mental and Physical Well-Being of Predicted Subgroups
In order to profile the mental and physical well-being with the criterion standard, this study used seven health dimensions (nine variables) to construct the radar chart, which included the number of physical morbidities, physical disability, handgrip strength, health-related quality of life (mental and physical), insomnia severity, mood (anxiety and depression), and daytime sleepiness. The definitions, contents, and instruments for measuring these health-related outcomes have been detailed in the previous Yilan study.39 In brief, the number of chronic physical morbidities, including hypertension, diabetes mellitus, heart disease, stroke, hyperlipidemia, cancer, and gout, was counted to reflect the disease burden. Only those who simultaneously reported to have a physical disease and to have specific treatment were coded as having a history of a specific morbidity. This approach has been proven to have good validity.46 Regarding the level of physical disability, the Groningen Activity Restriction Scale was used. Higher scores indicate a poor activity of daily life and instrumental activities of daily living.47 Handgrip strength (kg) was estimated using a dynamometer (Jamar, Jackson, MI, USA). The Short Form 12 Health Survey Version 2 was used to evaluate the health-related quality of life, including the mental component summary (MCS) and physical component summary (PCS). Higher scores in the component summary indicate a better health-related quality of life.48,49 The Hospital Anxiety and Depression Scale was utilized to measure the severity of depression and anxiety symptoms.50 Higher scores indicate more anxiety and depression symptoms. The severity of insomnia symptoms and daytime sleepiness were measured by the five-item Athens Insomnia Scale (AIS-5),51 and the Epworth Sleepiness Scale (ESS),52 respectively. Higher scores in the AIS-5 and the ESS indicate more severe symptoms.
Statistical Analysis
All statistical analyses were performed using SPSS for Windows, version 17.0 (SPSS Inc., Chicago, IL, USA). The univariate analyses were conducted using the χ2 test, t-test, and ANOVA. Multiple comparisons of the ANOVA were corrected using the Bonferroni method. By using four mutually exclusive subgroups of the PSQI-defined sleep quality as the dependent variables (criterion standard), forward stepwise multinomial logistic regression was used to determine the most predictive set of candidate items that were adopted from the original PSQI. This stepwise procedure determines predictors to orderly enter the final model according to the −2 log-likelihood and Chi-squared test. The resulting model was regarded as the full model. Afterwards, a series of reduced models were specified by removing items in the order of least to most explainable items one-by-one. The performance of these reduced models to predict PSQI-defined poor sleep quality and respective subgroups was compared. On the premise of parsimonious items without compromised validity, the best-reduced model was selected and was designated as the final version of the RCSSQ. We also profiled radar charts to illustrate all component scores of the PSQI and mental and physical well-being of the predicted subgroups, which were clustered by the final version of the RCSSQ with the validation dataset. These sets of visualized information were compared with those of the criterion standard in the development dataset to demonstrate generalizability. For a consistent direction of comparison, all measurements of mental and physical well-being were transformed to t-scores, with higher scores indicating worse health status. A p-value < 0.05 was considered statistically significant.
Results
A total of 3779 individuals in one development and two validation datasets participated in the study. Table 1 compares the basic sociodemographics, lifestyle, and clinical characteristics across these three datasets. Compared with the development dataset, the participants in the validation dataset of Yilan City were younger (post-hoc p < 0.001), less illiterate (post-hoc p < 0.001), more likely to live alone (post-hoc p = 0.01), but had no significant difference for the disease burden. In terms of the sleep-wake related measurements, individuals of the Yilan City validation dataset had lower total PSQI scores (post-hoc p < 0.001), AIS-5 (p = 0.01), and ESS (post-hoc p < 0.001). Although the older people in the validation datasets of Yilan City had healthier physical conditions, including higher PCS (p < 0.001) and handgrip strength (p < 0.001), they had higher levels of anxiety, depression, and poor MCS (all ps < 0.001). In contrast, the age (post-hoc p=0.07) and level of physical disability (post-hoc p=0.22) of participants in the validation dataset of the Taipei City had no significant difference with the development dataset. However, they had higher PSQI scores (post-hoc p < 0.001) and ESS (post-hoc p < 0.001), when compared with those in the development dataset.
 |
Table 1 The Comparison of Demographic and Clinical Characteristics of Participants by Datasets* |
Eight of the 13 candidate items of the PSQI that were specified using the stepwise multinomial logistic regression model to predict subgroups of the criterion standard survived (Table S1). The entry order for these eight items into this full model was (1) Sleep Quality, (2) Hypnotics Use, (3) Sleep Latency, (4) Lacking Enthusiasm, (5) Sleep Disruption, (6) Pain, (7) Sleepy Activities, and (8) Nightmares. Table 2 compares the criterion validity for PSQI-defined poor sleep quality across the full model and various reduced models. In terms of the validity for identifying PSQI ≥ 6, at least the first three explainable items (Model V: Sleep Quality, Hypnotics Us, Sleep Onset) should be considered in order to reach 80% for sensitivity, specificity, PPV, and NPV. However, if we expect the overall accuracy rate for classifying four subgroups to reach 80%, at least the five-item model (Model III: Sleep Quality, Hypnotics Use, Sleep Onset, Lacking Enthusiasm, Sleep Disruption) should be selected. Accordingly, to balance the item parsimony and criterion validity, the reduced model with three to five items was initially selected to further consider the final optimal reduced model.
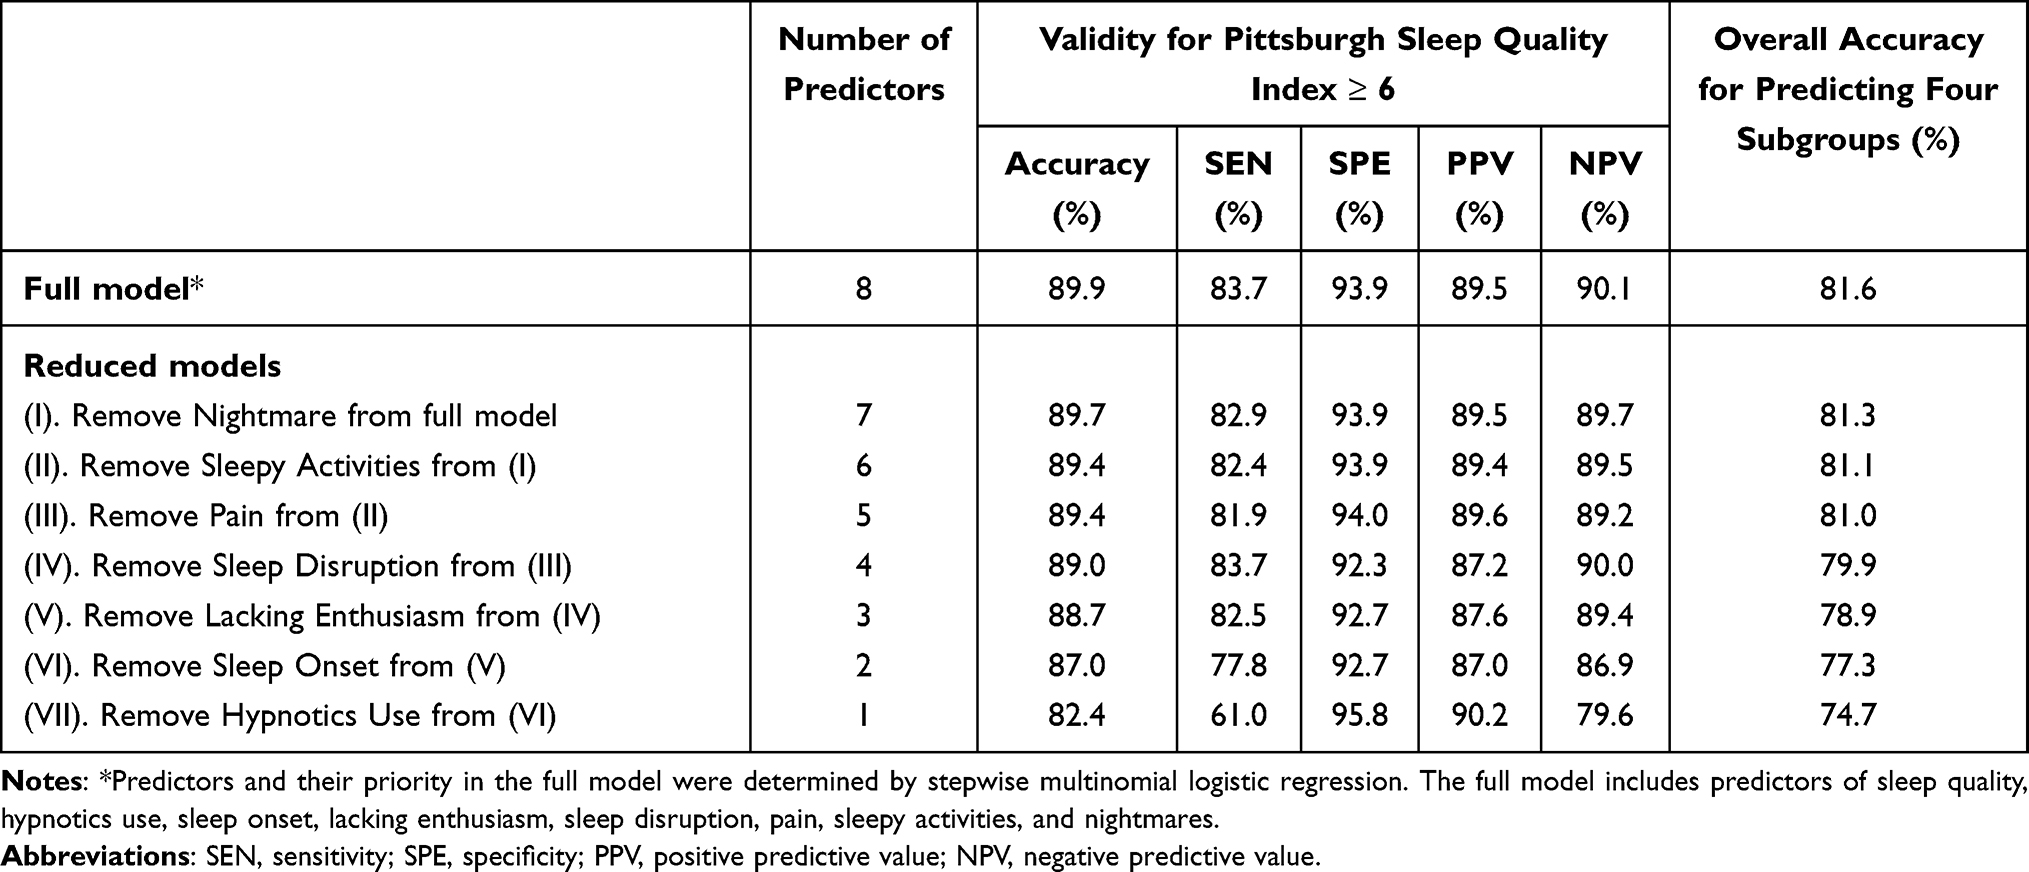 |
Table 2 Internal Validity of the Predictive Models by Various Predictor Combinations |
Table 3 summarized the criterion validity for classifying three specific subgroups in the full model and reduced models with the three to five most predictive items. In comparison with the PPV and NPV in the full eight-item model, those of all reduced models are comparable. Regarding the sensitivity and specificity to classify the LI group, the five-item model has the best sensitivity (63.9%), followed by the four-item model (61.3%). The full eight-item model has the best sensitivity (64.4%) for detecting HI, while the three-item model has the highest sensitivity (77.2%), followed by the four-item model (60.6%) to identify HH. In summary, all validity indices of the full model exceeded 50%. Among the three-to five-item reduced models, on the premise that all indices of criterion validity also reach over 50.0%, the four-item model of the RCSSQ (RCSSQ-4) is the most optimal option.
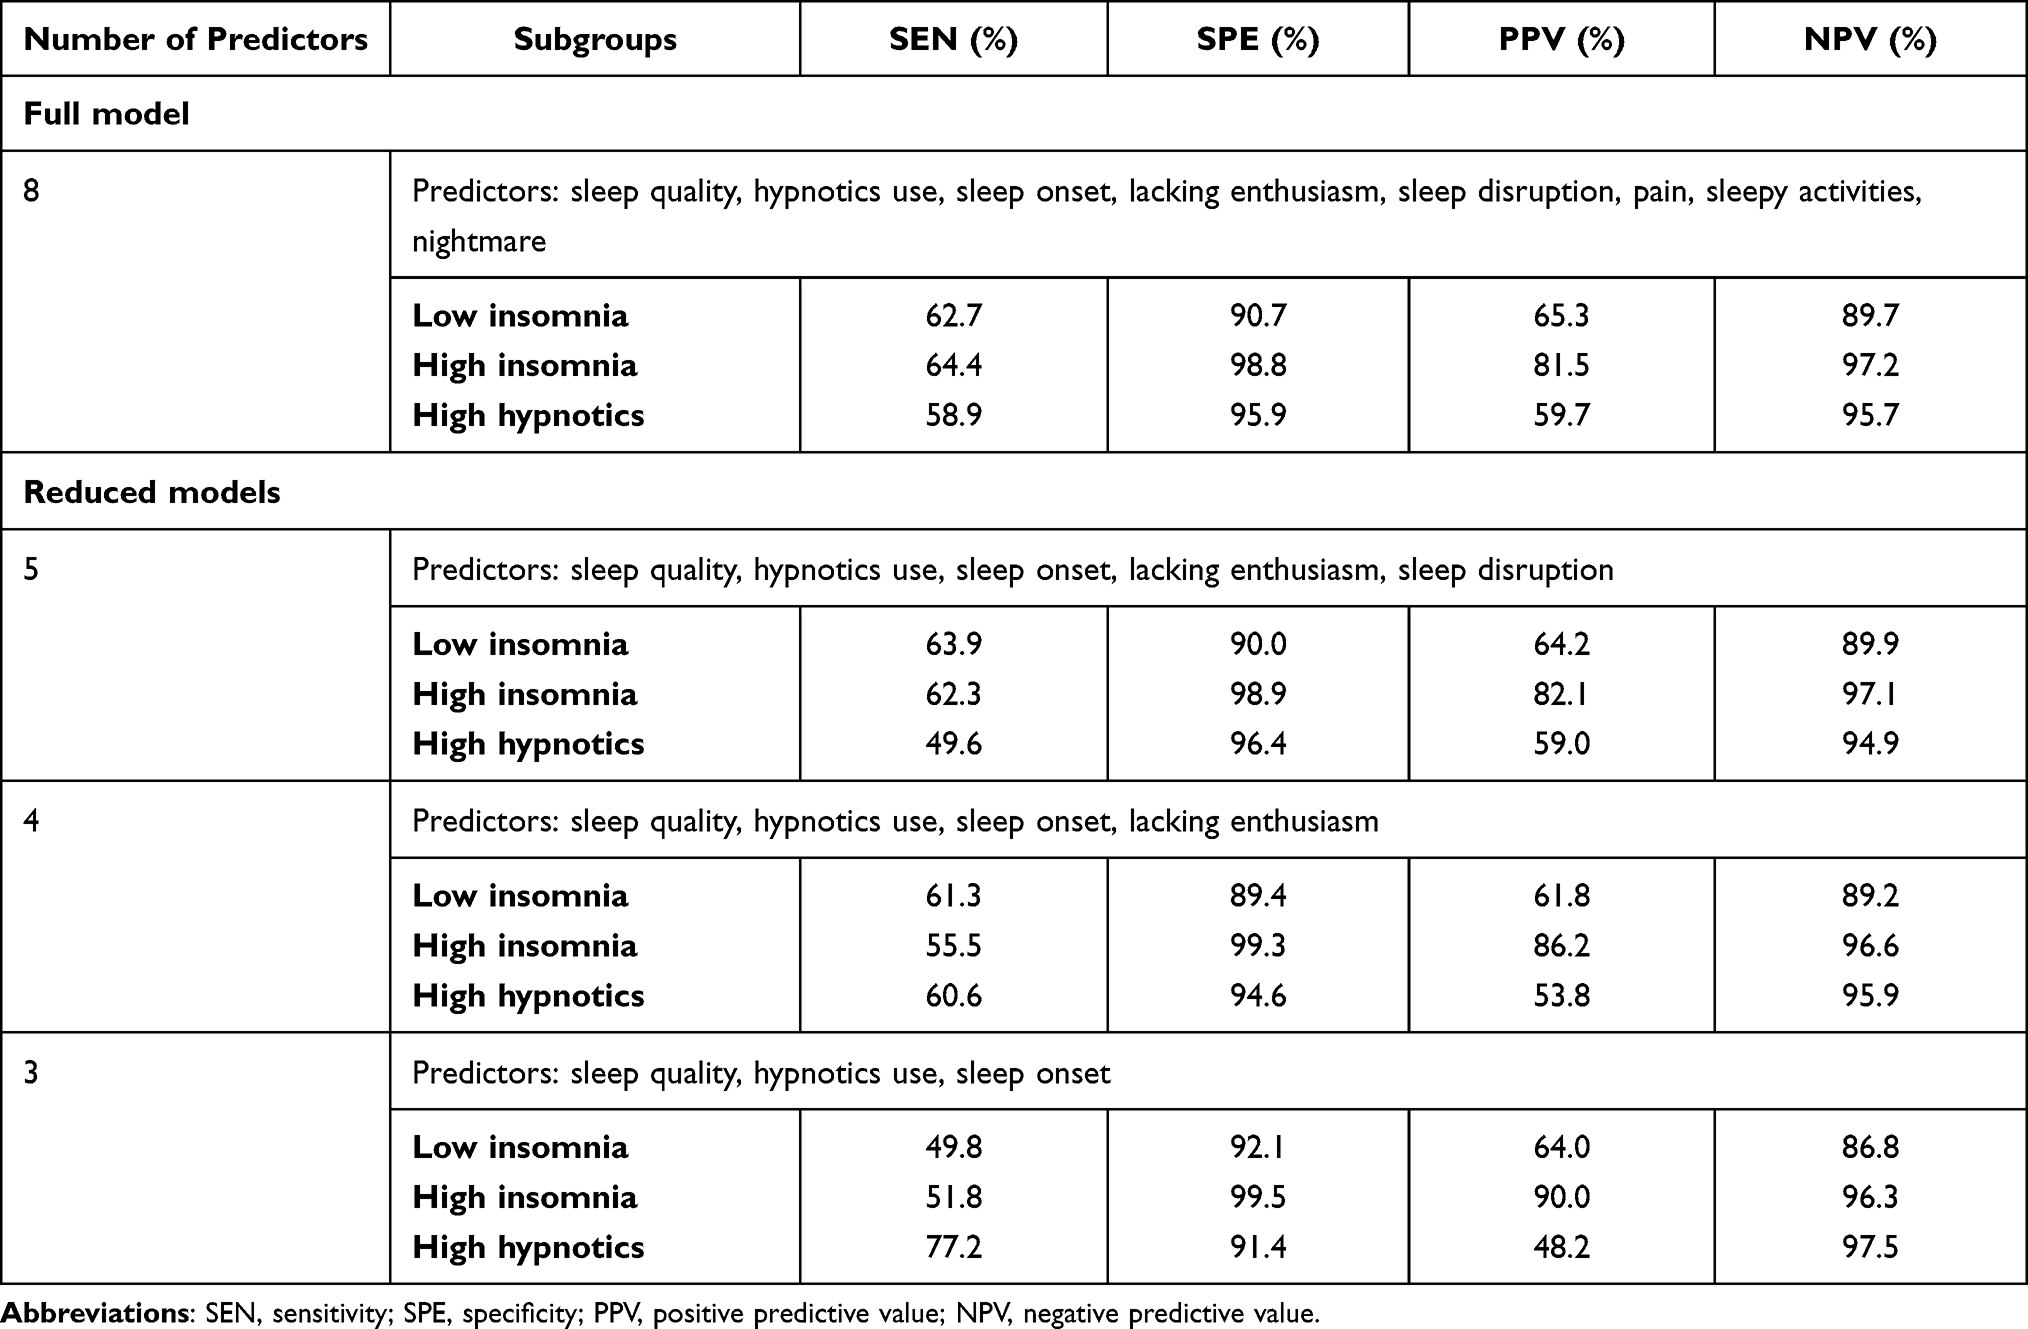 |
Table 3 Internal Validity of Predictive Models for the Pittsburgh Sleep Quality Index ≥6 by Various Combinations of Predictors |
Detailed coefficients in the multinomial logistic regression models for each item in the full eight-item and three to five-item reduced models are summarized in Tables S1 and 4, respectively. According to these classifiers, the probability for each individual to be classified into specific subgroups could be estimated and compared in the validation dataset of Yilan City. As a result, each participant in the validation set could be allocated into one specific predicted subgroup. Accordingly, the external validity for the RCSSQ-4 could be evaluated. Overall, the RCSSQ-4 illustrates good generalizability to detect the PSQI-defined poor sleep quality in the validation datasets (Accuracy: 89.1–90.7%; sensitivity: 87.5%, and specificity: 89.7–94.4%) (Table 5).
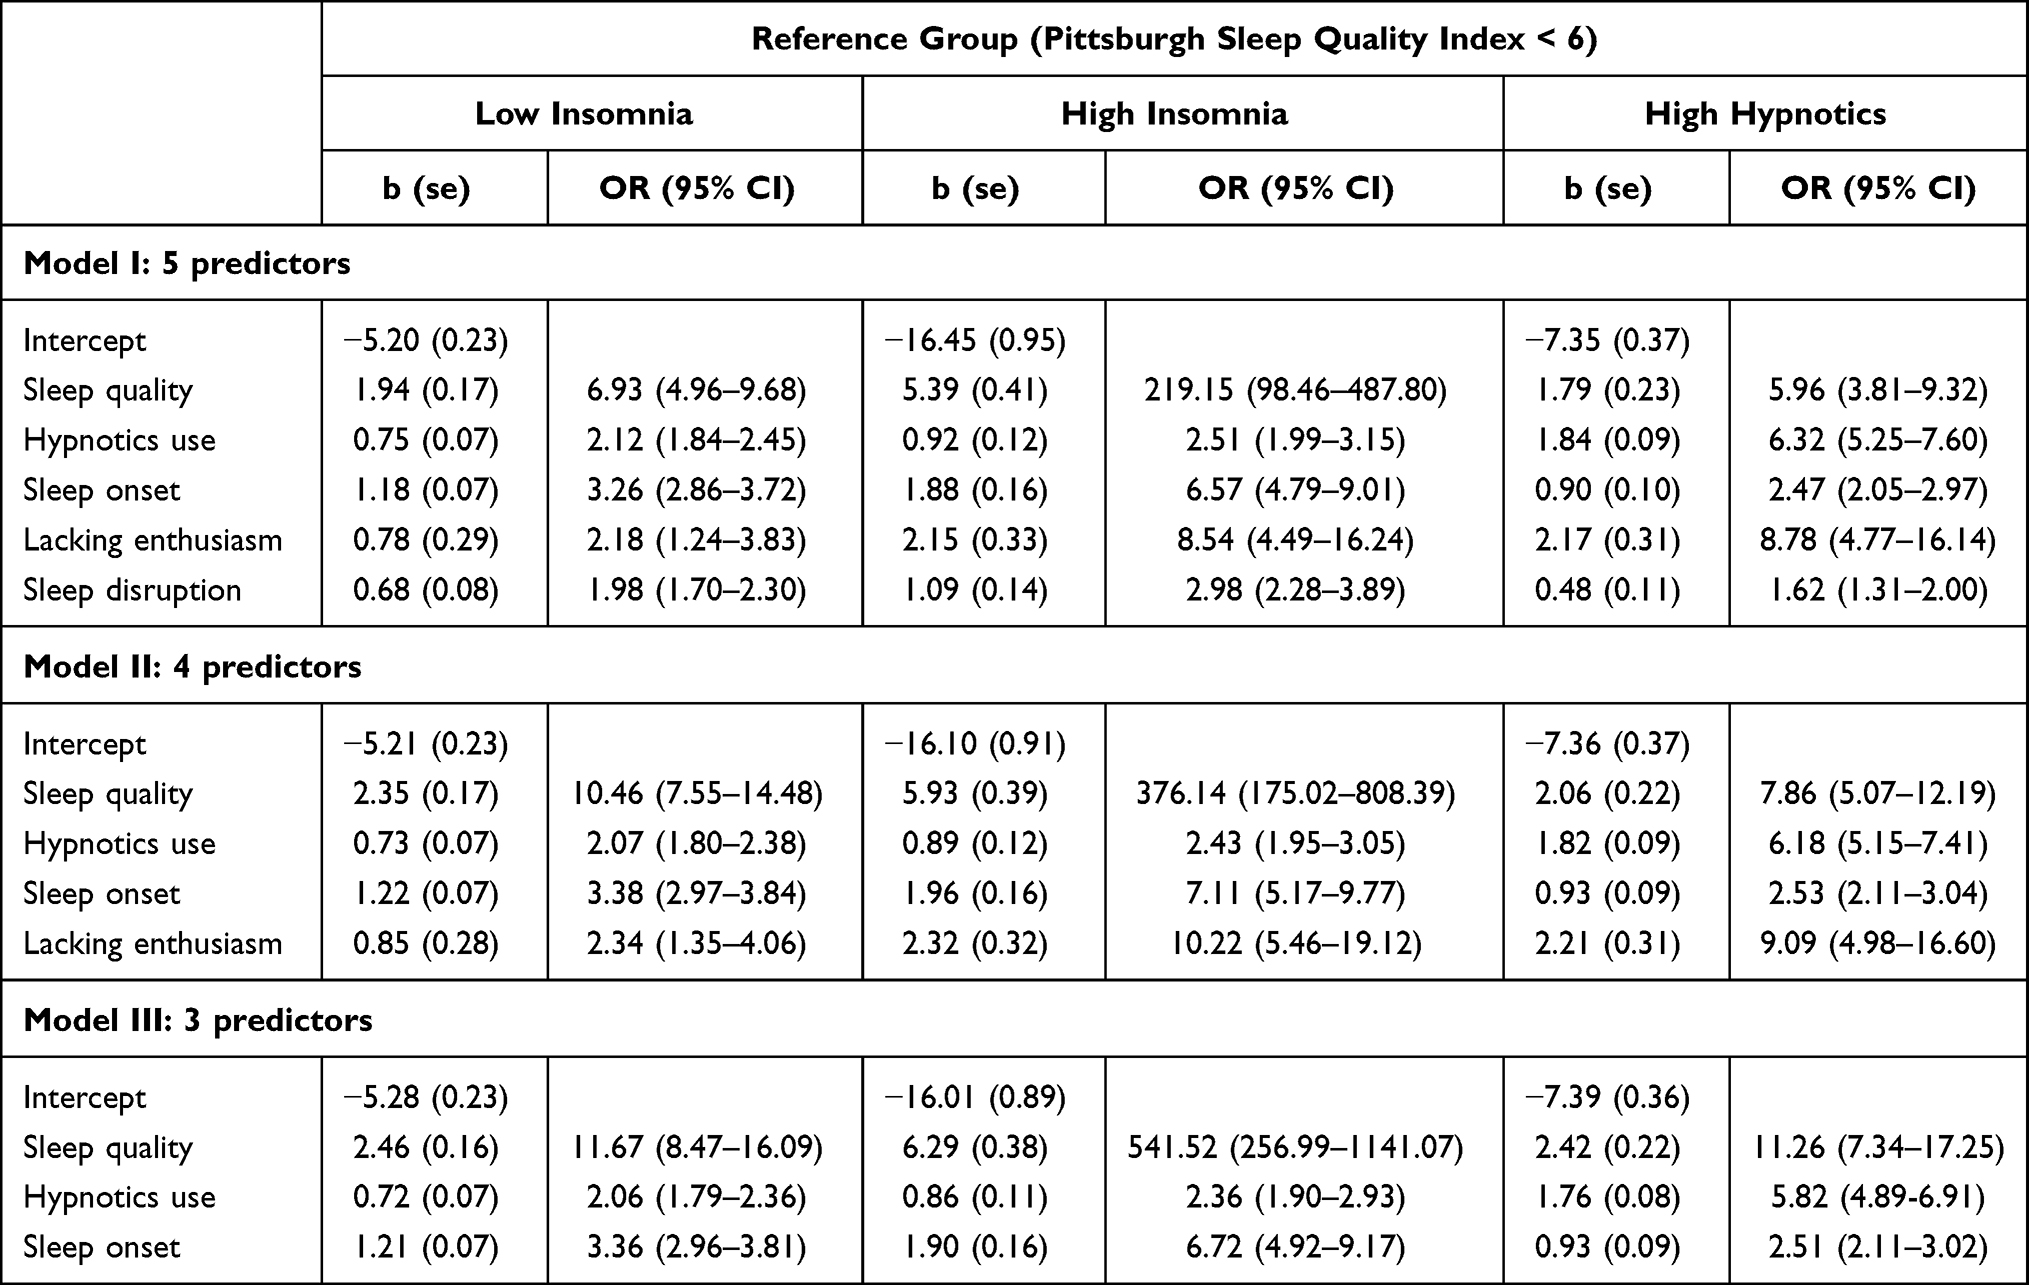 |
Table 4 Parameter Estimates of Multinomial Logistic Regression Analyses for Predicting Subgroups of Poor Sleep Quality in the Development Dataset |
 |
Table 5 The Validity of the Four-Item Rapid Classification Scale for Sleep Quality for the Pittsburgh Sleep Quality Index ≥6 |
The comparisons of the seven component scores in the PSQI and well-being conditions for the predicted subgroups obtained from the RCSSQ-4 in the validation dataset are summarized in Tables S1 and S2. Table S2 (Yilan City) illustrates that the individuals in the predicted HH scored even lower than those in the predicted LI in most component scores of the PSQI, except the predicted HH scored higher for hypnotics use, daytime impairment and no difference with predicted LI in terms of sleep disturbance. Meanwhile, except for sleep onset latency, all the other component scores of the PSQI in the predicted HI are significantly higher than those of the predicted LI. In addition, except for hypnotics use, all other component scores in the predicted HI are higher than those in the predicted HH. These differences are also profiled in Figure 1B and are similar to those observed in the criterion standard (Figure 1A). The comparisons of the seven component scores in the PSQI for the predicted subgroups obtained from the RCSSQ-4 in the validation dataset of Taipei City are provided in Table S3.
In terms of mental and physical well-being, the predicted LI has the healthiest conditions over the entire dimensions, while the predicted HI and predicted HH have similar profiles of well-being, being poorer than that in the predicted LI. However, a few different patterns among predicted subgroups in the validation dataset (Yilan City) are observed when compared with the criterion standard (Table S4 and Figure 2). In the criterion standard, HI and HH showed no significant differences in anxiety symptoms and MCS (Figure 2A). However, the predicted HI shows a higher level of anxiety symptoms and poor MCS when compared with the predicted HH in the validation dataset (Figure 2B). Besides, in the criterion standard, individuals in the HH had significantly weaker handgrip strength and more severe levels of physical disability than those in LI. In contrast, in the validation dataset, the predicted HI, instead of predicted HH, has poorer conditions than the predicted LI in these two measurements. Finally, the HI had a significantly higher level of daytime sleepiness than the LI in the development dataset, which was not observed between the predicted HI and predicted LI in the validation dataset. In general, the profile of mental and physical well-being in the predicted subgroups that were classified by the RCSSQ-4 with the validation dataset remained comparable with the criterion standard in the development dataset. However, regarding the within-dataset comparisons, the predicted HI in the validation dataset had overall worse mental and physical well-being than the HI in the development dataset (Figure 2).
Discussion
The present study used large cohorts and established subgroups as the criterion standard to develop a simplified and valid instrument, the RCSSQ-4, to efficiently screen and cluster community-dwelling older adults with PSQI-defined poor sleep quality. The RCSSQ-4, which has balanced parsimony and validity, is an optimal option for community-based, personalized sleep care. The RCSSQ-4 has good internal and external validity to detect PSQI-defined poor sleep quality and to classify feature-based subgroups. Thus, the RCSSQ-4 is a highly applicable instrument to implement personalized care for poor sleep quality in community-dwelling older adults. Given that poor sleep quality is prevalent and deleterious but heterogeneous in older adults, our findings help to promote access to preventive medicine in sleep quality under the context of a community-based stepped care approach.
Performance of the RCSSQ-4 to Screen and Classify PSQI-Defined Poor Sleep Quality
The Validity of Screening for PSQI-Defined Poor Sleep Quality
This study demonstrated that the RCSSQ-4 had a desirable internal and external validity to identify older adults with PSQI ≥ 6. Although the RCSSQ-4 had a very good PPV and NPV in the validation dataset of Taipei City, its superior performance in these two indices related with a higher prevalence of PSQI ≥ 6 in Taipei City. With respect to the massive screen in the community, the outstanding sensitivity and specificity of the RCSSQ-4 are particularly noteworthy because they are independent of the prevalence rate of PSQI ≥ 6. Furthermore, we believe that, at least in the Chinese population, our findings endorse the generalizability of the RCSSQ-4, because the participants in these two validation datasets had different sociodemographic, clinical, and geographic characteristics to those in the development dataset.
The Validity of Classifying Subgroups for PSQI-Defined Poor Sleep Quality
In essence, the predicted subgroups and the criterion standard had shared patterns for the component scores of the PSQI and the well-being conditions. A few differences were observed, which may be related to the participant characteristics and the selection of candidate items for the RCSSQ. Firstly, although the individuals in the development and validation datasets of Yilan City have similar geographic characteristics, their differences in sociodemographic and clinical features may influence the resulting PSQI profile and the well-being conditions of the predicted subgroups in the validation dataset. Secondly, the most significant discrepancy when comparing the patterns of the subgroups datasets in the PSQI was that the difference between the predicted HI and predicted LI on sleep onset latency disappeared. Specifically, in the criterion standard, all component scores of the HI were higher than those of the LI.39 In the interest of the quality easy-to-respond, we removed the question about the actual sleep latency in the PSQI as a candidate item. This approach may compromise the capability of the RCSSQ to discriminate sleep latency among subgroups. Thus, the rationale and algorithm to determine the final predictive model may also influence the composition of predicted subgroups. However, despite these differences between the criterion standard and predicted subgroups, the comparable profiles of the PSQI and well-being conditions ensure the generalizability of implementing the RCSSQ-4 for personalized interventions in the community.
The Balance Between Parsimony and Validity of the RCSSQ
Based on the tradeoff between item parsimony and instrument validity, we suggest using the RCSSQ-4 for implementing community-based medicine. Among the reduced models, the three-item model with sleep quality, hypnotics use, and sleep onset enables all validity indices for detecting PSQI ≥ 6, reaching 80% in the development dataset. However, if requesting a performance validity of ≥50% for subgroup classification, an additional item of Lacking Enthusiasm is necessary. In all reduced models, the models with more items had better sensitivity but poor specificity in identifying LI and HI in the development dataset. In contrast, the reduced model with fewer items is more sensitive but less specific for detecting HH. In real-world practice, the optimal version of RCSSQ can be flexibly determined, depending on the target subgroup that we intend to yield by applying the RCSSQ.
Implications of the RCSSQ-4 Under the Context of Community-Based Stepped Care
The simplified format and scoring system of the RCSSQ-4 is beneficial to conduct massive screen and clustering in the community, either by means of paper-pencil surveys or online investigations. In the viewpoint of preventive medicine, the resulting subgroups could adhere to corresponding levels of prevention. Firstly, regarding primary prevention, those designated as good sleep quality by the RCSSQ-4 may receive a general health promotion program in the community to enhance their sleep drive or consolidate the circadian cues. For secondary prevention, the RCSSQ-4 could detect and intervene earlier for “cases.” Specifically, low professional demand but high accessibility and availability of interventions, such as self-help programs, online consultations, or general interventions offered by primary health providers, are indicated for the LI group, a preclinical to clinical stage of impaired sleep quality. In the HI group, in-depth diagnosis and interventions are mandatory because comorbid conditions increase. These could be provided by general physicians in primary clinics. As for the HH group, the indications for higher frequency and longer duration of using hypnosedatives should be carefully examined. In some patients, the exposure to hypnosedatives may be justified due to complex comorbidities and severe insomnia. In this case, the tertiary prevention should be introduced to confine the harm incurred by using hypnosedatives in older adults, such as optimizing the effectiveness of non-pharmacological interventions or a hypnotics reduction program. Obviously, the medical intervention that the HH group needs would require the high expertise that can only be provided by sleep specialists. Accordingly, using the RCSSQ-4 could help to implement preventive medicine in community-dwelling older adults under the context of personalized and stepped care.
Limitations
This study is subject to several limitations. Firstly, the RCSSQ is developed to optimize the detection and intervention for sleep quality on the population level. The RCSSQ can not replace the most commonly used PSQI, which has been the best instrument to comprehensively evaluate sleep quality in clinical settings. Secondly, although the RCSSQ-4 is sensitive to identify PSQI-defined poor sleep quality, the subgroups classified by the RCSSQ-4 may suffer from misclassification bias. It implies that most older adults with poor sleep quality can be identified by the RCSSQ-4 and can be assigned to respective modules of intervention. However, the assigned module of intervention may be imprecise because of the misclassification of the subgroups. This limitation would not affect those who are misclassified to receive modules with higher intensity, while those who are misclassified to modules with lower intensity could be referred to a higher level of stepped care if the treatment effect is limited. Thirdly, although validation datasets were used to examine the external validity of the RCSSQ-4, the inherent limitation of within-sample analyses of the traditional clustering methods makes it difficult to have adequate representativeness across different ages, ethnicities, and cultures. Fourthly, although the subgroups that are defined in this study suggest different interventions, the cross-sectional design of this study did not allow us to make causal inferences for the relationship between poor sleep quality and co-occurring mental or physical conditions. Thus, the suggested modules of interventions for each subgroup in this study are merely based on clinical experience. Finally, to enhance the feasibility of implementing the RCSSQ for older adults in the community, as an instrument for mass screening and subgrouping, we used the PSQI and its items to define sleep quality, classify subgroups, and develop predictive models in the present study. The PSQI has been commonly used for convergent validity, suggesting that it can be considered as an accepted reference for self-perceived sleep quality.53 However, sleep quality represents a complex construct that comprises several aspects of the sleep phenomenon and opposes a simple definition.54 Applying different measurements or definitions for sleep quality, such as other subjective instruments and objective parameters of sleep, may yield different subgroups and predictive models.
Conclusion
For the community medicine of the aging society, the RCSSQ-4 could serve as a rapid and efficient instrument to screen and classify poor sleep quality in older adults. By applying the RCSSQ-4, we may streamline the cost of various adverse outcomes related to poor sleep quality from the perspective of preventive medicine. Besides, it also becomes possible to deliver personalized interventions and achieve stepped care at the community level. In the future, longitudinal studies would be required to examine the validity of subgroups by comparing differences in clinical courses, health outcomes, treatment effects, and biological markers. In addition, novel clustering approaches, such as machine learning,55 might help to refine the validity of RCSSQ and promote generalizability. Hopefully, the implementation of the RCSSQ-4 will help guide need-based interventions, which will eventually lead to community-level precision medicine.
Abbreviations
AIS-5, the 5-item Athens Insomnia Scale; ESS, Epworth Sleepiness Scale; HI, high insomnia group; HH, high hypnotics group; LI, low insomnia group; MCS, mental component summary; NPV, negative predictive value; PCS, physical component summary; PPV, positive predictive value; PSQI, Pittsburgh Sleep Quality Index; RCSSQ, Rapid Classification Scale for Sleep Quality; RCSSQ-4, the 4-item Rapid Classification Scale for Sleep Quality.
Data Sharing Statement
The datasets generated during and/or analysed during the current study are available from the corresponding author on reasonable request.
Acknowledgments
The authors acknowledge statistical assistance provided by the Center of Statistical Consultation and Research in the Department of Medical Research, National Taiwan University Hospital. The authors would also like to thank the Yang-Ming Crusaders, Mr. Da-Wei Lin, Ms. Yu-Hui Lin, Mr. Chia-Hsiang Lin, and Ms. Tzu-Chun Lo for their help with data collection.
Author Contributions
All authors contributed to data analysis, drafting or revising the article, have agreed on the journal to which the article will be submitted, gave final approval of the version to be published, and agree to be accountable for all aspects of the work.
Funding
This work was supported by the Ministry of Science and Technology, Taiwan [MOST-107-2314-B-010 -049], [MOST-108-2314-B-002 -110 -MY2], and [MOST-110-2314-B-002 -096 -MY3].
Disclosure
We have no conflict of interest to declare.
References
1. Ancoli-Israel S. Sleep and its disorders in aging populations. Sleep Med. 2009;10(Suppl 1):S7–S11. doi:10.1016/j.sleep.2009.07.004
2. Chien MY, Chen HC. Poor sleep quality is independently associated with physical disability in older adults. J Clin Sleep Med. 2015;11(3):225–232. doi:10.5664/jcsm.4532
3. Chen HC, Hsu NW, Chou P. The association between sleep duration and hand grip strength in community-dwelling older adults: the Yilan Study, Taiwan. Sleep. 2017;40(4):ZSX021. doi:10.1093/sleep/zsx021
4. Wu CY, Su TP, Fang CL, Yeh Chang M. Sleep quality among community-dwelling elderly people and its demographic, mental, and physical correlates. J Chin Med Assoc. 2012;75(2):75–80. doi:10.1016/j.jcma.2011.12.011
5. Luo J, Zhu G, Zhao Q, et al. Prevalence and risk factors of poor sleep quality among Chinese elderly in an urban community: results from the Shanghai aging study. PLoS One. 2013;8(11):e81261. doi:10.1371/journal.pone.0081261
6. Beaudreau SA, Spira AP, Stewart A, et al. Validation of the Pittsburgh Sleep Quality Index and the Epworth Sleepiness Scale in older black and white women. Sleep Med. 2012;13(1):36–42. doi:10.1016/j.sleep.2011.04.005
7. Chang KJ, Son SJ, Lee Y, et al. Perceived sleep quality is associated with depression in a Korean elderly population. Arch Gerontol Geriatr. 2014;59(2):468–473. doi:10.1016/j.archger.2014.04.007
8. McHugh JE, Casey AM, Lawlor BA. Psychosocial correlates of aspects of sleep quality in community-dwelling Irish older adults. Aging Ment Health. 2011;15(6):749–755. doi:10.1080/13607863.2011.562180
9. Wang P, Song L, Wang K, et al. Prevalence and associated factors of poor sleep quality among Chinese older adults living in a rural area: a population-based study. Aging Clin Exp Res. 2019;32(1):125–231.
10. Del Brutto OH, Mera RM, Sedler MJ, et al. The effect of age in the association between frailty and poor sleep quality: a population-based study in community-dwellers (The Atahualpa Project). J Am Med Dir Assoc. 2016;17(3):269–271. doi:10.1016/j.jamda.2015.12.009
11. Morin CM, Belleville G, Belanger L, Ivers H. The insomnia severity index: psychometric indicators to detect insomnia cases and evaluate treatment response. Sleep. 2011;34(5):601–608. doi:10.1093/sleep/34.5.601
12. Grandner MA, Kripke DF, Yoon I-Y, Youngstedt SD. Criterion validity of the Pittsburgh Sleep Quality Index: investigation in a non-clinical sample. Sleep Biol Rhythms. 2006;4(2):129–139. doi:10.1111/j.1479-8425.2006.00207.x
13. Min Y, Kirkwood CK, Mays DP, Slattum PW. The effect of sleep medication use and poor sleep quality on risk of falls in community-dwelling older adults in the US: a prospective cohort study. Drugs Aging. 2016;33(2):151–158. doi:10.1007/s40266-015-0339-9
14. Bernert RA, Joiner TE
15. Del Brutto OH, Mera RM, Penaherrera E, Costa AF, Penaherrera R, Castillo PR. On the association between sleep quality and arterial stiffness: a population study in community-dwelling older adults living in rural ecuador (The Atahualpa Project). J Clin Sleep Med. 2019;15(8):1101–1106. doi:10.5664/jcsm.7798
16. Nicassio PM, Ormseth SR, Custodio MK, Olmstead R, Weisman MH, Irwin MR. Confirmatory factor analysis of the Pittsburgh Sleep Quality Index in rheumatoid arthritis patients. Behav Sleep Med. 2014;12(1):1–12. doi:10.1080/15402002.2012.720315
17. Miyata S, Noda A, Iwamoto K, Kawano N, Okuda M, Ozaki N. Poor sleep quality impairs cognitive performance in older adults. J Sleep Res. 2013;22(5):535–541. doi:10.1111/jsr.12054
18. Nakakubo S, Makizako H, Doi T, et al. Impact of poor sleep quality and physical inactivity on cognitive function in community-dwelling older adults. Geriatr Gerontol Int. 2017;17(11):1823–1828. doi:10.1111/ggi.12973
19. Potvin O, Lorrain D, Forget H, et al. Sleep quality and 1-year incident cognitive impairment in community-dwelling older adults. Sleep. 2012;35(4):491–499. doi:10.5665/sleep.1732
20. Martin JL, Fiorentino L, Jouldjian S, Mitchell M, Josephson KR, Alessi CA. Poor self-reported sleep quality predicts mortality within one year of inpatient post-acute rehabilitation among older adults. Sleep. 2011;34(12):1715–1721. doi:10.5665/sleep.1444
21. Chiu HF, Leung T, Lam LC, et al. Sleep problems in Chinese elderly in Hong Kong. Sleep. 1999;22(6):717–726. doi:10.1093/sleep/22.6.717
22. Ohayon MM. Epidemiology of insomnia: what we know and what we still need to learn. Sleep Med Rev. 2002;6(2):97–111. doi:10.1053/smrv.2002.0186
23. Ohayon M, Wickwire EM, Hirshkowitz M, et al. National sleep foundation’s sleep quality recommendations: first report. Sleep Health. 2017;3(1):6–19. doi:10.1016/j.sleh.2016.11.006
24. Buysse DJ, Reynolds CF
25. Babson KA, Blonigen DM, Boden MT, Drescher KD, Bonn-Miller MO. Sleep quality among U.S. military veterans with PTSD: a factor analysis and structural model of symptoms. J Trauma Stress. 2012;25(6):665–674. doi:10.1002/jts.21757
26. Casement MD, Harrington KM, Miller MW, Resick PA. Associations between Pittsburgh Sleep Quality Index factors and health outcomes in women with posttraumatic stress disorder. Sleep Med. 2012;13(6):752–758. doi:10.1016/j.sleep.2012.02.014
27. Magee CA, Caputi P, Iverson DC, Huang X-F. An investigation of the dimensionality of the Pittsburgh Sleep Quality Index in Australian adults. Sleep Biol Rhythms. 2008;6(4):222–227. doi:10.1111/j.1479-8425.2008.00371.x
28. Otte JL, Rand KL, Carpenter JS, Russell KM, Champion VL. Factor analysis of the Pittsburgh Sleep Quality Index in breast cancer survivors. J Pain Symptom Manage. 2013;45(3):620–627. doi:10.1016/j.jpainsymman.2012.03.008
29. Tomfohr LM, Schweizer CA, Dimsdale JE, Loredo JS. Psychometric characteristics of the Pittsburgh Sleep Quality Index in English speaking non-Hispanic whites and English and Spanish speaking Hispanics of Mexican descent. J Clin Sleep Med. 2013;9(1):61–66. doi:10.5664/jcsm.2342
30. Mariman A, Vogelaers D, Hanoulle I, Delesie L, Tobback E, Pevernagie D. Validation of the three-factor model of the PSQI in a large sample of chronic fatigue syndrome (CFS) patients. J Psychosom Res. 2012;72(2):111–113. doi:10.1016/j.jpsychores.2011.11.004
31. Cole JC, Motivala SJ, Buysse DJ, Oxman MN, Levin MJ, Irwin MR. Validation of a 3-factor scoring model for the Pittsburgh sleep quality index in older adults. Sleep. 2006;29(1):112–116. doi:10.1093/sleep/29.1.112
32. Black DS, O’Reilly GA, Olmstead R, Breen EC, Irwin MR. Mindfulness meditation and improvement in sleep quality and daytime impairment among older adults with sleep disturbances: a randomized clinical trial. JAMA Intern Med. 2015;175(4):494–501. doi:10.1001/jamainternmed.2014.8081
33. Campanini MZ, Guallar-Castillon P, Rodriguez-Artalejo F, Lopez-Garcia E. Mediterranean diet and changes in sleep duration and indicators of sleep quality in older adults. Sleep. 2017;40(3). doi:10.1093/sleep/zsw083
34. Chan AW, Yu DS, Choi KC, Lee DT, Sit JW, Chan HY. Tai chi qigong as a means to improve night-time sleep quality among older adults with cognitive impairment: a pilot randomized controlled trial. Clin Interv Aging. 2016;11:1277–1286. doi:10.2147/CIA.S111927
35. Seol J, Abe T, Fujii Y, Joho K, Okura T. Effects of sedentary behavior and physical activity on sleep quality in older people: a cross-sectional study. Nurs Health Sci. 2019;22(1):64–71.
36. Espie CA. “Stepped care”: a health technology solution for delivering cognitive behavioral therapy as a first line insomnia treatment. Sleep. 2009;32(12):1549–1558. doi:10.1093/sleep/32.12.1549
37. Edinger JD, Buysse DJ, Deriy L, et al. Quality measures for the care of patients with insomnia. J Clin Sleep Med. 2015;11(3):311–334. doi:10.5664/jcsm.4552
38. Sateia MJ, Buysse DJ, Krystal AD, Neubauer DN. Adverse effects of hypnotic medications. J Clin Sleep Med. 2017;13(6):839.
39. Chen HC, Hsu NW, Chou P. Subgrouping poor sleep quality in community-dwelling older adults with latent class analysis - the Yilan Study, Taiwan. Sci Rep. 2020;10(1):5432. doi:10.1038/s41598-020-62374-4
40. Buscemi N, Vandermeer B, Friesen C, et al. The efficacy and safety of drug treatments for chronic insomnia in adults: a meta-analysis of RCTs. J Gen Intern Med. 2007;22(9):1335–1350. doi:10.1007/s11606-007-0251-z
41. Chen SY, Chen CH, Lo C, et al. Differential co-occurring patterns between depressive symptomatology and sleep-wake-related disturbances in mood disorders. Nat Sci Sleep. 2021;13:503–514. doi:10.2147/NSS.S301357
42. O’Donohue WT, Draper C; SpringerLink (Online service). Stepped Care and e-Health Practical Applications to Behavioral Disorders. New York, NY: Springer Science+Business Media, LLC; 2011. doi:10.1007/978-1-4419-6510-3
43. Hsu NW, Tsao HM, Chen HC, Chou P. Anxiety and depression mediate the health-related quality of life differently in patients with cardiovascular disease and stroke-preliminary report of the Yilan study: a population-based community health survey. PLoS One. 2014;9(9):e107609. doi:10.1371/journal.pone.0107609
44. Tsai PS, Wang SY, Wang MY, et al. Psychometric evaluation of the Chinese version of the Pittsburgh Sleep Quality Index (CPSQI) in primary insomnia and control subjects. Qual Life Res. 2005;14(8):1943–1952. doi:10.1007/s11136-005-4346-x
45. Ferguson L. External validity, generalizability, and knowledge utilization. J Nurs Scholarsh. 2004;36(1):16–22. doi:10.1111/j.1547-5069.2004.04006.x
46. Wu CS, Lai MS, Gau SS, Wang SC, Tsai HJ. Concordance between patient self-reports and claims data on clinical diagnoses, medication use, and health system utilization in Taiwan. PLoS One. 2014;9(12):e112257. doi:10.1371/journal.pone.0112257
47. Suurmeijer TP, Doeglas DM, Moum T, et al. The Groningen activity restriction Scale for measuring disability: its utility in international comparisons. Am J Public Health. 1994;84(8):1270–1273. doi:10.2105/AJPH.84.8.1270
48. Bullinger M, Alonso J, Apolone G, et al. Translating health status questionnaires and evaluating their quality: the IQOLA project approach. International Quality of Life Assessment. J Clin Epidemiol. 1998;51(11):913–923. doi:10.1016/S0895-4356(98)00082-1
49. Tseng HM, Lu JF, Gandek B. Cultural issues in using the SF-36 health survey in Asia: results from Taiwan. Health Qual Life Outcomes. 2003;1(1):72. doi:10.1186/1477-7525-1-72
50. Zigmond AS, Snaith RP. The hospital anxiety and depression scale. Acta Psychiatr Scand. 1983;67(6):361–370. doi:10.1111/j.1600-0447.1983.tb09716.x
51. Chiang HL, Chen HC, Bai CH, et al. A validation study of the Chinese version of the Athens Insomnia Scale. Taiwan J Psychiatry. 2009;23(1):43–52.
52. Johns MW. A new method for measuring daytime sleepiness: the Epworth sleepiness Scale. Sleep. 1991;14(6):540–545. doi:10.1093/sleep/14.6.540
53. Fabbri M, Beracci A, Martoni M, Meneo D, Tonetti L, Natale V. Measuring subjective sleep quality: a review. Int J Environ Res Public Health. 2021;18(3):1082. doi:10.3390/ijerph18031082
54. Landry GJ, Best JR, Liu-Ambrose T. Measuring sleep quality in older adults: a comparison using subjective and objective methods. Front Aging Neurosci. 2015;7:166. doi:10.3389/fnagi.2015.00166
55. Blanken TF, Benjamins JS, Borsboom D, et al. Insomnia disorder subtypes derived from life history and traits of affect and personality. Lancet Psychiatry. 2019;6(2):151–163. doi:10.1016/S2215-0366(18)30464-4
 © 2021 The Author(s). This work is published and licensed by Dove Medical Press Limited. The
full terms of this license are available at https://www.dovepress.com/terms
and incorporate the Creative Commons Attribution
- Non Commercial (unported, 3.0) License.
By accessing the work you hereby accept the Terms. Non-commercial uses of the work are permitted
without any further permission from Dove Medical Press Limited, provided the work is properly
attributed. For permission for commercial use of this work, please see paragraphs 4.2 and 5 of our Terms.
© 2021 The Author(s). This work is published and licensed by Dove Medical Press Limited. The
full terms of this license are available at https://www.dovepress.com/terms
and incorporate the Creative Commons Attribution
- Non Commercial (unported, 3.0) License.
By accessing the work you hereby accept the Terms. Non-commercial uses of the work are permitted
without any further permission from Dove Medical Press Limited, provided the work is properly
attributed. For permission for commercial use of this work, please see paragraphs 4.2 and 5 of our Terms.