Back to Journals » Diabetes, Metabolic Syndrome and Obesity » Volume 16
The Correlation Between Leg Muscle Mass Index and Non-Alcoholic Fatty Liver Disease in Patients with Type 2 Diabetes Mellitus
Authors Liu M, Zhang Q, Liu J, Bai H, Yang P, Ye X, Yuan X
Received 6 October 2023
Accepted for publication 15 December 2023
Published 20 December 2023 Volume 2023:16 Pages 4169—4177
DOI https://doi.org/10.2147/DMSO.S443329
Checked for plagiarism Yes
Review by Single anonymous peer review
Peer reviewer comments 2
Editor who approved publication: Dr Konstantinos Tziomalos
Menggege Liu,1,2 Qing Zhang,1,3 Juan Liu,1 Huiling Bai,1 Ping Yang,1 Xinhua Ye,1,3 Xiaoqing Yuan1,3
1Department of Endocrinology, The Affiliated Changzhou No. 2 People’s Hospital of Nanjing Medical University, Changzhou, People’s Republic of China; 2Second Clinical College, Dalian Medical University, Dalian, People’s Republic of China; 3Changzhou Medical Center, The Affiliated Changzhou No. 2 People’s Hospital of Nanjing Medical University, Changzhou, People’s Republic of China
Correspondence: Xiaoqing Yuan; Xinhua Ye, Email [email protected]; [email protected]
Objective: To analyze the relationship between leg skeletal muscle mass index (LSMI) and non-alcoholic fatty liver disease (NAFLD) in patients with type 2 diabetes mellitus (T2DM) and the ability of LSMI to predict NAFLD.
Methods: Two hundred patients with T2DM and NAFLD treated at Changzhou Second People’s Hospital Affiliated with Nanjing Medical University and the National Metabolic Management Center from June 2022 to June 2023 were divided into four LSMI quartiles. The clinical information from the four patient groups was compared, and the relationship between type 2 diabetes and LSMI and NAFLD was examined. We used receiver operating characteristic curves to determine how well the LSMI predicts NAFLD in T2DM.
Results: The lowest quartile (Q1) had a higher prevalence of NAFLD than group Q4 (P < 0.05). LSMI was negatively associated with body mass index, LS, CAP, and other markers (P < 0.05). Receiver operating characteristic curve analysis LSMI predicted NAFLD with an ideal critical value of 0.64 and an area under the curve of 70.9%. The combined predictive value of the LSMI and the appendicular skeletal muscle mass index was more significant.
Conclusion: Reduced LSMI is associated with NAFLD.
Keywords: non-alcoholic fatty liver disease, type 2 diabetes mellitus, LSMI, ASMI
Introduction
The excessive buildup of triglycerides in the liver that does not result from heavy alcohol consumption or other underlying conditions is known as non-alcoholic fatty liver disease (NAFLD) and can develop non-alcoholic steatohepatitis, liver fibrosis, cirrhosis, poor liver function, and ultimately hepatocellular cancer.1 Patients with NAFLD have an increased risk of death as well as a twofold increased risk of acquiring type 2 diabetes mellitus (T2DM) compared to non-NAFLD patient.2,3 Around 25% of the world’s population has NAFLD; this proportion is increasing quickly due to a rise in the prevalence of metabolic syndrome, obesity, T2DM, and other conditions. NAFLD prevalence in China is 29.2%, making it a significant public health concern.4 The causes of NAFLD are not fully understood but are strongly linked to metabolic diseases like metabolic syndrome. T2DM is a separate risk factor for NAFLD development and progression.5,6
T2DM is characterized by high blood sugar, dysfunctional pancreatic islet cells, and insulin resistance. The major pathophysiological mechanism of NAFLD is insulin resistance, and there are reciprocal connections between T2DM, NAFLD, and IR7. The main organ regulating glucose homeostasis is skeletal muscle. NAFLD is independently associated with loss of muscle mass, one of the primary consequences of T2DM,8 which raises the risk of NAFLD 1.5-fold.9 The loss of lower limb muscle mass and function increases the risk of dying from all causes by 84% within ten years.10 However, there are few investigations on the relationship between NAFLD and decreased leg skeletal muscle mass in type 2 diabetic patients.
Therefore, the goal of the present study was to analyze skeletal muscle distribution characteristics of patients with T2DM with NAFLD, the correlation between the leg skeletal muscle mass index (LSMI) and NAFLD in T2DM patients, and the ability of LSMI to predict NAFLD.
Methods
Research Objects
Two hundred T2DM patients (122 men and 78 women) were treated between June 2022 and June 2023 at the National Metabolic Management Center (MMC) and the Department of Endocrinology and Metabolism at Changzhou Second People’s Hospital Affiliated to Nanjing Medical University. All met the diagnostic criteria of the 2020 China Diabetes Prevention and Treatment Guidelines, with an average age of 53.19±10.20 years. Exclusion criteria were (1) serum indicators for the hepatitis B virus, (2) Hepatitis C virus infection, cirrhosis, or hepatocellular cancer have a history, (3) weekly alcohol consumption for men and women >140 g and >70 g, respectively. All research participants provided written informed consent, and the hospital ethics committee evaluated and approved the study.
Research methods
Collection of General Information
Including the patient’s age, gender, height, weight, body mass index (BMI), systolic blood pressure(SBP), diastolic blood pressure(DBP), and duration of diabetes, etc. Before taking hypoglycemic medications, fasting blood samples and morning urine samples were taken from all patients who had fasted for longer than eight hours. These samples were used to measure several blood and urine biomarkers, including fasting blood glucose (FBG), insulin 0 minutes (0’INS), glycosylated hemoglobin (HbA1c), alanine aminotransferase (ALT), aspartate aminotransferase (AST), γ- glutamyl transpeptidase (γ- GT), serum uric acid (UA), serum high-density lipoprotein (HDL-C), serum low-density lipoprotein (LDL-C), urine microalbumin/creatinine ratio (UA/CR), etc.

Analysis of Body Composition
A bioelectrical impedance analyzer, the Inbody520 body composition tester (Biospace, South Korea), was used to measure the appendicular skeletal muscle mass (ASM), leg skeletal muscle mass (LSM), and body fat percentage (BFP). The same technician performed on each subject. LSMI = LSM/BMI, and ASMI= ASM/BMI.11 From low to high, the LSMI was divided into quartiles: Q1 group (LSMI≤0.50), Q2 group (0.50<LSMI≤0.60), Q3 group (0.60<LSMI≤0.70), and Q4 group (LSMI≥0.70).
Diagnosis of NAFLD
We measured these variables using a FibroTouch (Wuxi Heiskell Company, model: Pro 3800X). To measure the liver stiffness measurement (LS) (in units of kPa) and controlled attenuation parameter (CAP) (in units of dB/m), the patient must lie down when fasting. The probe must then be placed on the right intercostal space. We used an LSM > 9.7 kPa to identify liver fibrosis and CAP > 240 dB/m to identify liver steatosis.
Measuring Visceral Fat Area and Abdominal Subcutaneous Fat Area
The visceral fat area (VFA) and abdominal subcutaneous fat area (ASFA) were measured using Omron HDS-2000 equipment. Visceral obesity is defined as VFA >100 cm2.
Statistical Analysis
SPSS 26.0 software was used for statistical analysis. One-way analysis of variance was used to compare normally distributed measurement data, which were reported as mean standard deviation ( ). The Kruskal–Wallis H-test was used to compare non-normally distributed measurement data, expressed as the median (lower quartile, higher quartile) M(P25, P75). The chi-square test was used to compare count data expressed as composition ratio or rate (%). Determine the incidence rate for various NAFLD groups. Receiver operating characteristic (ROC) curves were used to determine the diagnostic value of LSMI for NAFLD and the ideal diagnostic cutoff value using the maximal Youden index. Spearman correlation analysis was used to determine correlations between LSMI and NAFLD. Linear regression analysis was used to identify factors influencing NAFLD. Differences where P < 0.05 were regarded as statistically significant.
Results
Baseline Characteristics of NAFLD and Non-NAFLD Patients Among Patients with T2DM
Two hundred T2DM patients were enrolled, of whom 160 were in the NAFLD group, and 40 were in the non-NAFLD group. The NAFLD group had lower LSMI and ASMI, higher BMI, BFP, VFA, more severe insulin resistance, and higher levels of CAP, LS, ALT, and AST than the non-NAFLD group. The differences between the groups were statistically significant (P < 0.05) for weight, BMI, BFP, ASMI, LSMI, VFA, ASFA, duration of diabetes, 0’INS, HOMA-IR, ALT, AST, γ-GT, UA, TG, HDL-c, UA/CR, LS, and CAP. We shall then do group statistics using LSMI quartiles (Table 1).
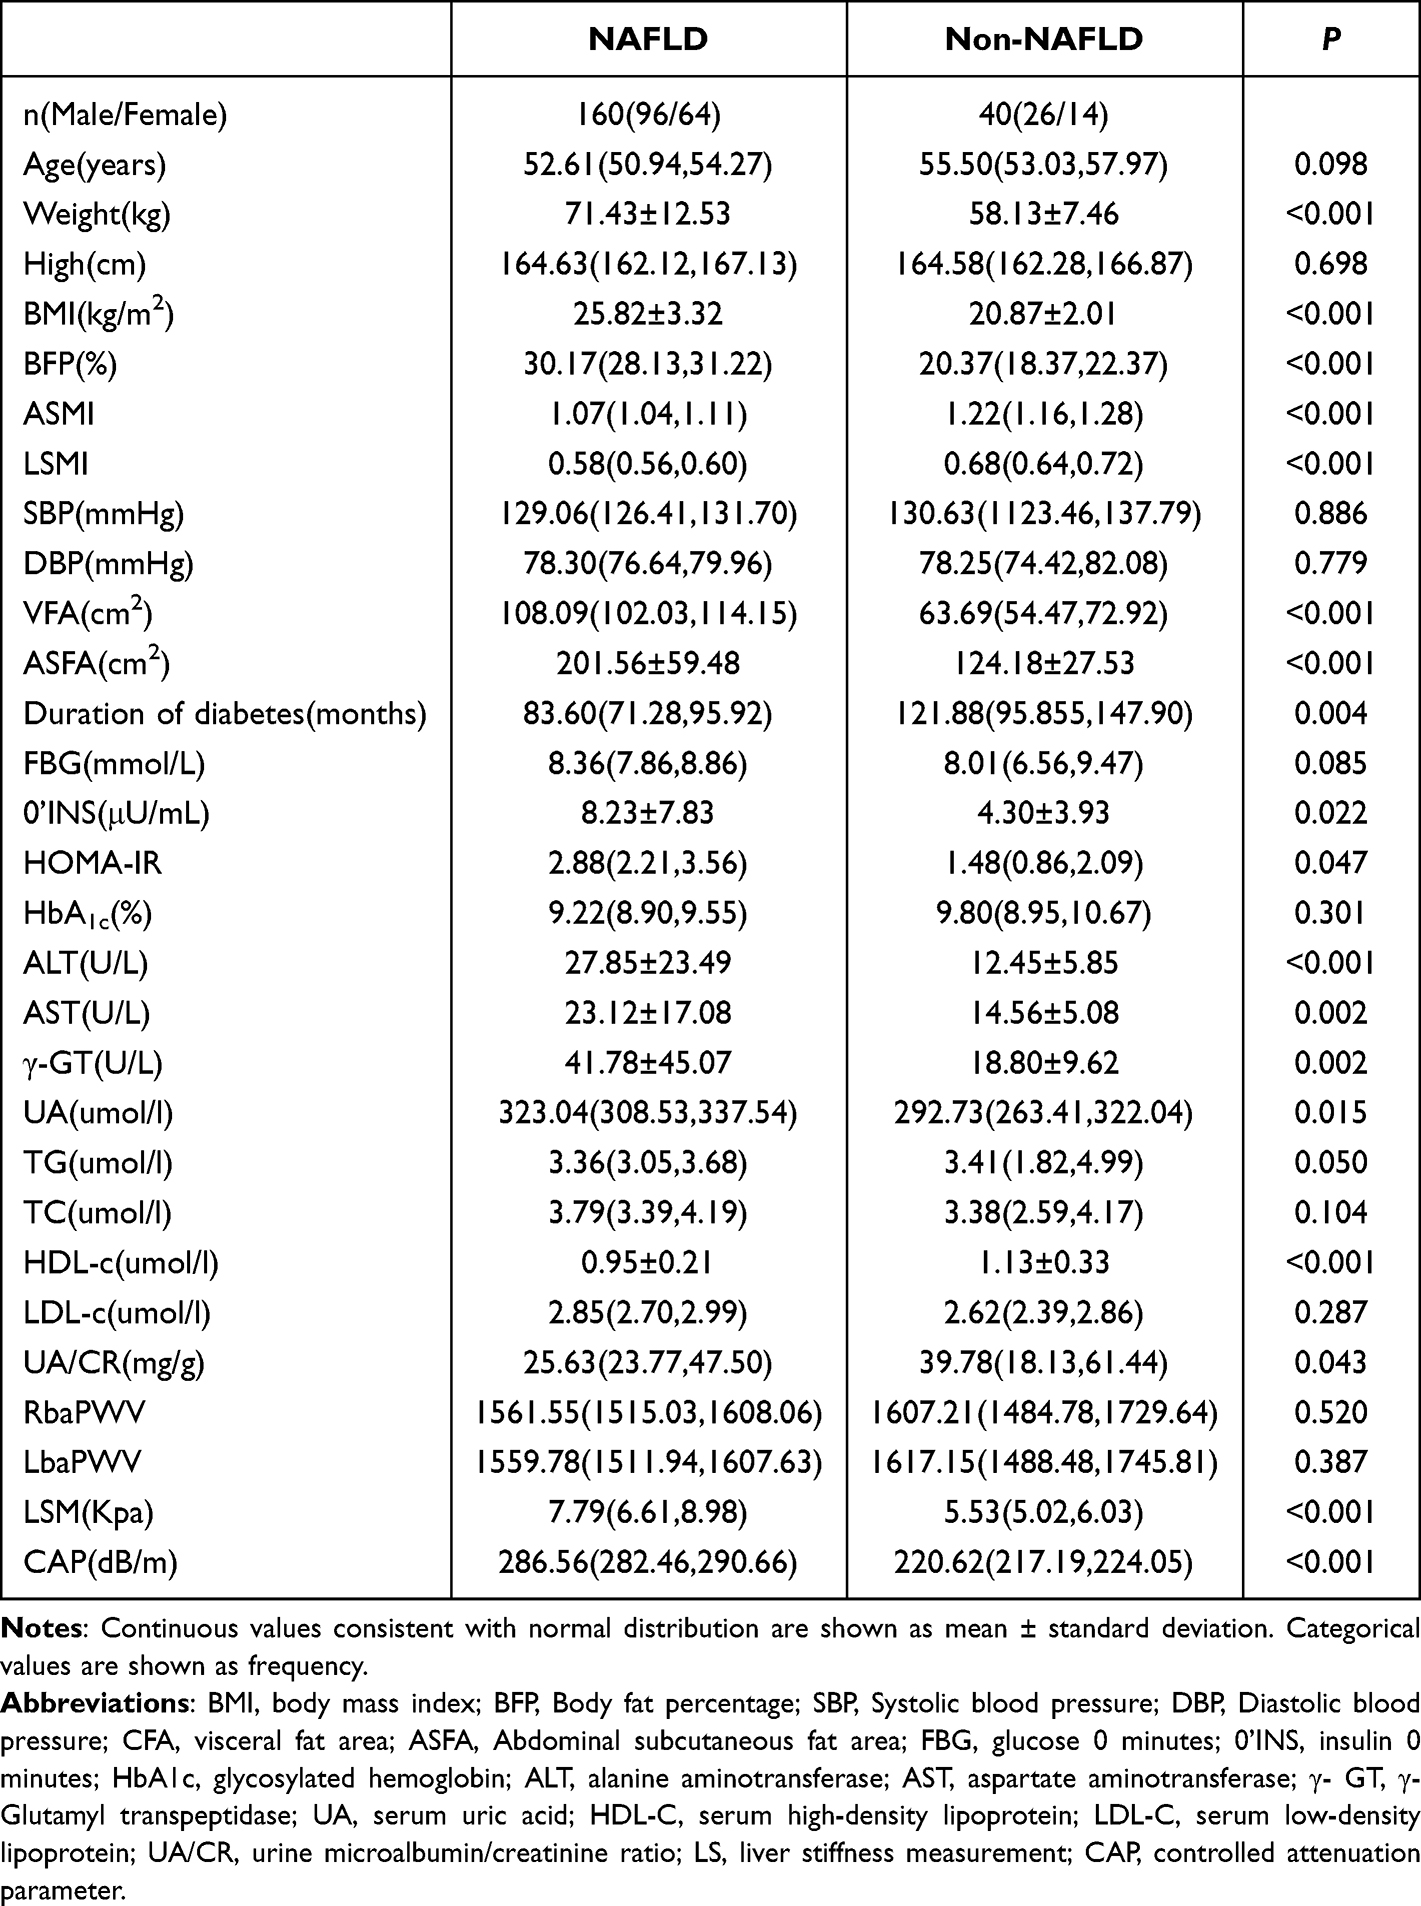 |
Table 1 Baseline Characteristics of NALFD and Non-NAFLD |
Comparison of General Information and Biochemical Indicators Among Each LSMI Quartile Group
The patients were separated into quartiles, with 51 patients in Q1, 50 in Q2, 51 in Q3, and 48 in Q4. The CAP and liver stiffness measurement become more problematic as LSM decreases. The Q1 group differed from the Q4 group in that it had lower levels of ASM and LSM, higher levels of BMI, BFP, visceral fat, and HOMA-IR, and greater levels of the indicators of liver damage ALT, AST, LSM, and CAP. There were statistically significant differences in gender, weight, BMI, ASM, BFP, VFA, ASFA, HOMA-IR, AST, γ-GT, LS, and CAP among the quartiles (P < 0.05). There were no differences in TG, TC, HDL-c, or LDL-c among the four groups (Table 2).
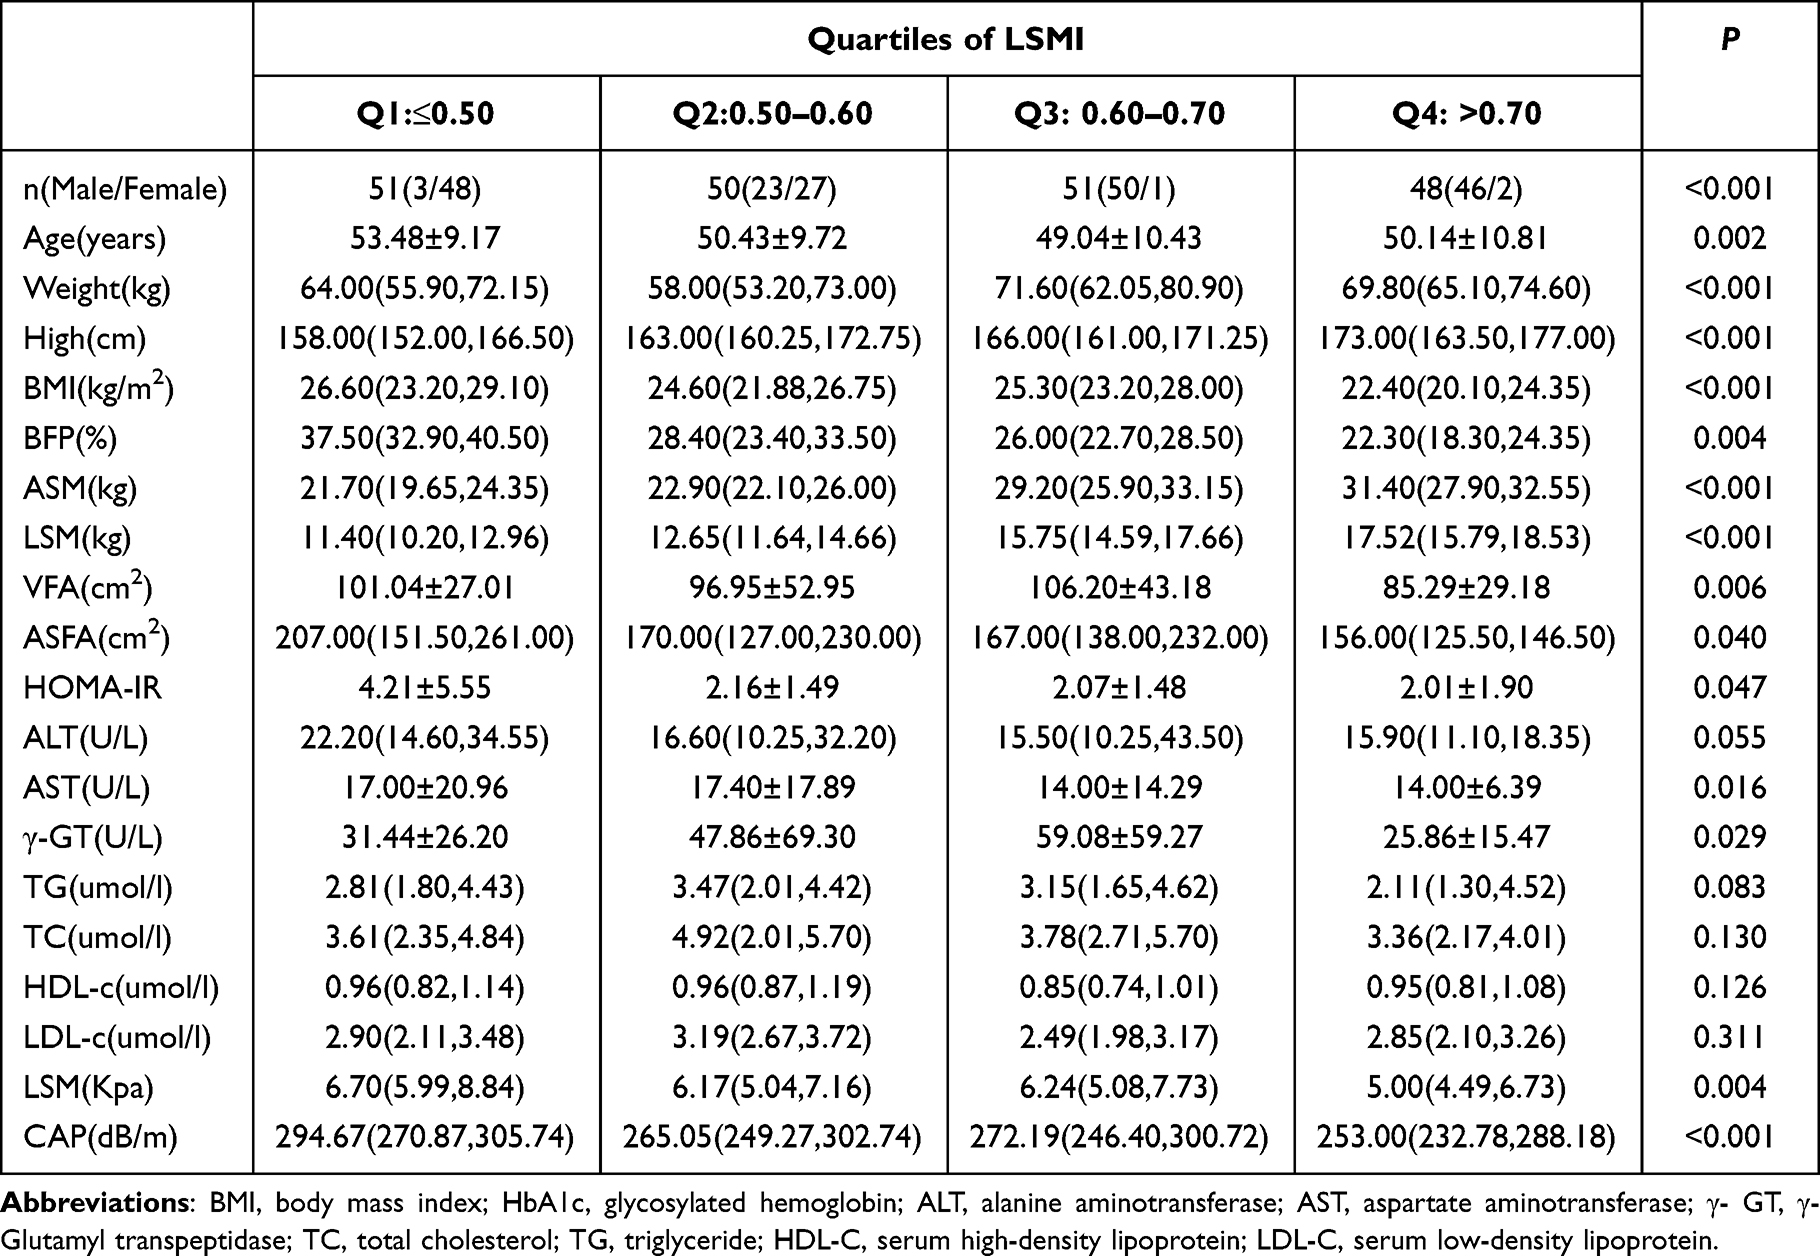 |
Table 2 Comparison of General Information and Laboratory Parameters Between Quartile Groups of LSMI |
LSMI is Negatively Correlated with the Risk of NAFLD
The prevalence of NAFLD was 90.20% in Q1, 86.00% in Q2, 84.31% in Q3, and 58.33% in Q4. Q1 had the highest incidence of NAFLD, and Q4 group had the lowest incidence (P < 0.05) (Figure 1).
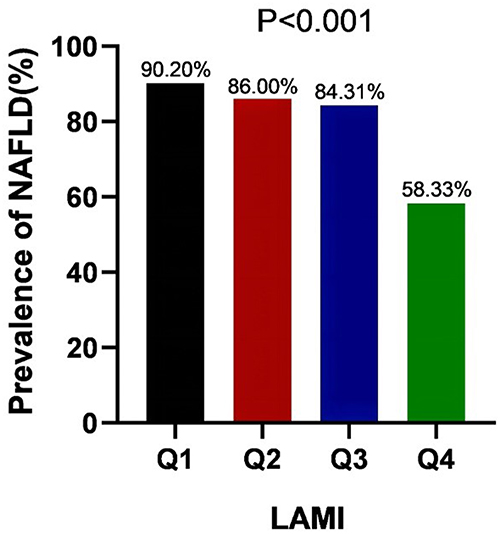 |
Figure 1 Prevalence of nonalcoholic fatty liver disease (NAFLD) across quartile groups of LSMI. |
Correlation Analysis Between LSMI and NAFLD
There was a negative association between LSMI, ASMI, gender, age, BMI, BFP, ASFA, AST, ALT, LS, and CAP (P < 0.05) (Table 3).
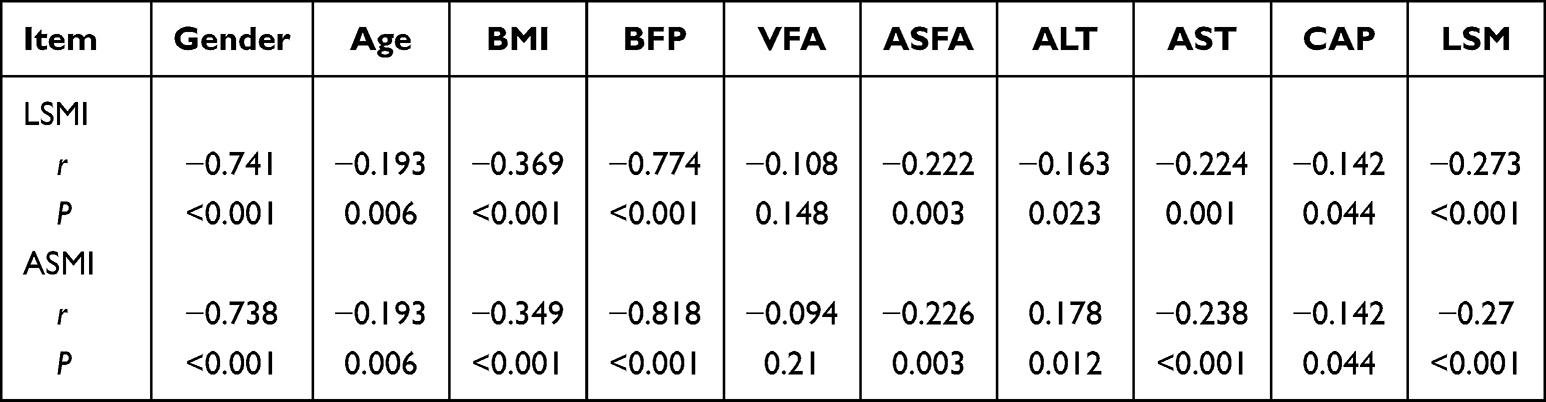 |
Table 3 Spearman Correlation Between LSMI and SMI and NAFLD |
Multivariate Logistic Regression Analysis s of Odds Ratios of the Risk of NAFLD in T2DM
According to multivariate logistic regression analysis, LSMI, ASMI were independent protective factors for NAFLD in T2DM. BMI, BFP, VFA, ASFA, HOMA-IR, ALT, AST, CAP were independent risk factors for NAFLD (Table 4).
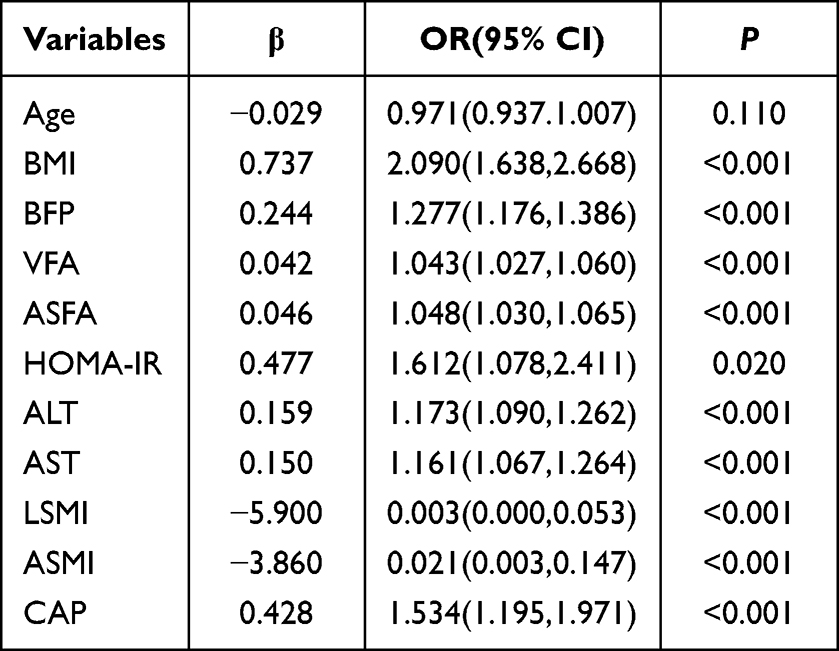 |
Table 4 Odds Ratios of the Risk for NAFLD in Type 2 Diabetes Mellitus |
ROC Curve Analysis of the Diagnostic Value of LSMI for NAFLD
We performed a ROC analysis to determine the ability of LSMI to predict NAFLD. LSMI and LSMI both predicted NAFLD. The areas under the curve were both 70.9% (P < 0.05). The cutoff value of LSMI for diagnosing NAFLD was 0.64, the sensitivity was 73.1%, and the specificity was 67.5%, according to the maximum Youden index. The cutoff value for ASMI was 1.18, the sensitivity was 71.9%, and the specificity was 67.5%. The combined predictive value of LSMI and ASMI was greater, with a sensitivity of 76.9%, a specificity of 65.0%, and an area under the curve of 71.2% (Figure 2).
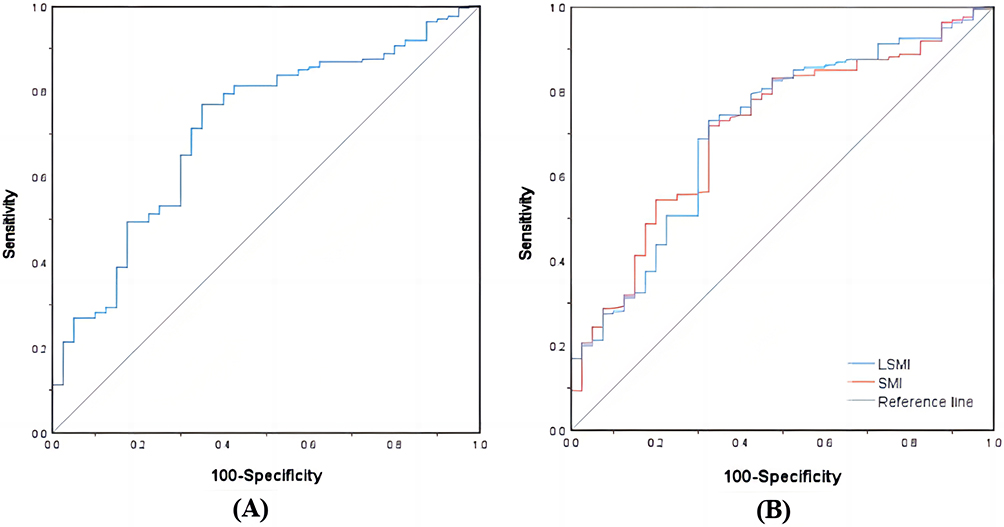 |
Figure 2 (A) LSMI, SMI predicts ROC curve for NAFLD. (B) LSMI combined with SMI predicts ROC curve NAFLD. |
Linear Regression Analysis of Influencing Factors of NAFLD
With CAP as the dependent variable and LSMI as the independent variable, linear regression analysis was carried out to further investigate the effect of LSMI on NAFLD according to various genders. The findings demonstrated that LSMI was a risk factor for NAFLD in all subjects (P<0.001) (Table 5).
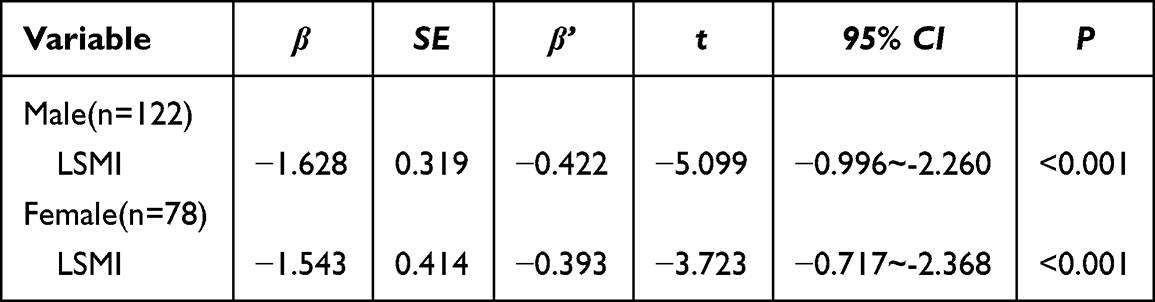 |
Table 5 Linear Regression Analysis of Factors Influencing Indicators of NAFLD |
Discussion
According to recent studies, NAFLD and severe liver fibrosis are common in individuals with reduced skeletal muscle mass.12 Additionally, there is a direct correlation between the distribution of fat and muscles in the lower limbs and a higher risk of IR and NAFLD.13 Few research have examined the relationship between lower leg muscles and NAFLD in T2DM patients and so far. In this investigation, LSMI (LSM/BMI) was utilized to assess patient condition. The current results indicated that lower LSMI was associated with an increased risk of NAFLD in those with T2DM and may have some predictive value for the development of the illness.
Other complications of T2DM, such as Sarcopenia, have gained increased attention in addition to microvascular and macrovascular issues. Age, malnutrition, insulin resistance, and other variables all have a strong correlation with low muscle mass and sarcopenia. According to earlier research, 40% of T2DM patients under the age of 80 exhibit sarcopenia.14 Our statistical findings support the findings of other studies in that the Q1 group was older than the Q4 group. In addition, HOMA-IR was greater in Q1 than Q4. According to published reports, insulin resistance mostly contributes to muscle loss in skeletal muscle by activating the ubiquitin-proteasome proteolytic pathway.15 Inadequate insulin secretion occurs in T2DM due to reduced pancreatic islet function. Furthermore, inadequate insulin secretion occurs in T2DM due to reduced pancreatic islet function. Insulin can accelerate protein synthesis, and its breakdown can be stopped. Decreased protein synthesis caused by impaired pancreatic islet function results in decreased muscle mass and sarcopenia16, possibly explaining this outcome.
The loss of muscle mass reduces exercise tolerance, which can result in obesity (particularly the buildup of visceral fat),17 and increase the risk of NAFLD.18 By altering the metabolism of fat muscles and IR, loss of muscle mass and obesity primarily encourage lipotoxic effects and have a negative impact on NAFLD onset and progression.19 Sarcopenia and obesity increase the risk of NAFLD20 and all-cause mortality compared to obesity alone.21 In the present study, the NAFLD group had greater BMI and VFA and lower ASMI and LSMI than the non-NAFLD group. The LSMI decreased with the increase in CAP and LS, the incidence of NAFLD, the increase in the liver damage index AST, the accumulation of visceral fat, and the worsening of insulin resistance. These findings suggest that, while reducing visceral fat, attention should be paid to increasing lower limb muscles to delay NAFLD progression.
Approximately 60% of T2DM patients have NAFLD,22 and T2DM with NAFLD exacerbates ASM loss.11 In T2DM, IR reduces the anti-lipolytic action and induces Wat to break down, releasing a significant quantity of free fatty acid.23 Excess fatty acids are stored in the liver in the form of triglycerides, forming ectopic lipid deposition, which can develop into NAFLD, NASH, cirrhosis, liver cancer, and even death. In the present study, the NAFLD group had lower ASMI and LSMI and greater HOMA-IR than the non-NAFLD group. Multivariate logistic regression analysis and Spearman correlation analysis confirmed that LSMI was independent risk factor for NAFLD and was negatively associated with BMI, BFP, VFA, and other conditions in T2DM. According to the ROC curve data, LSMI had a cutoff value of 0.64, a sensitivity of 73.1%, a specificity of 67.5%, and a greater predictive value when paired with ASMI. Sarcopenia is defined as LSMI (ASM/BMI) < 0.789 for males and <0.512 for women,24 In the present study, it was challenging to diagnose sarcopenia due to our limited sample size. There was a variable course and severity of the disease among the subjects. As a result, our cutoff value of 0.64 can be used as an evaluation indicator for early NAFLD.
Calf circumference is significantly linked to a higher risk of NAFLD.13 However, lower limb edema, varicose veins, muscle atrophy, diabetic peripheral neuropathy, osteoarthritis, and others can influence calf circumference measurement. These limitations are circumvented by the Inbody520 body composition analyzer, allowing us to determine the subject’s muscle content precisely. In practice, the lowering of ASM, especially LSM, brought on by T2DM is frequently disregarded, and the diagnosis and treatment strategy is inadequate. For these reasons, research must identify the factors that need to be assessed, what cutoff values are helpful for diagnosis and treatment, and the best methods for assessing the effects of treatment and outcomes.
Our findings suggest that the clinical traits of people with T2DM and NAFLD—increased visceral fat and reduced LSM, are comparable to those of obese sarcopenia. Research on the consequences of muscle loss and visceral obesity on the liver in T2DM is currently lacking. We demonstrated a link between LSMI and NAFLD. Unlike previous studies, this study showed that LSMI (LSM/BMI) can predict the development of NAFLD in people with T2DM. We computed the cutoff value to improve early diagnosis and simplify outcomes assessments following therapeutic interventions. This value will significantly impact the prevention and treatment of NAFLD and the decrease of LSM in T2DM patients.
There are also certain restrictions on this study. First of all, muscle mass and function are evaluated as part of the sarcopenia assessment. However, we did not examine muscular function, we merely examined muscle mass. In further experimental research, the identification and statistical analysis of muscle function should be added. Second, the study only had a small number of samples, which could have influenced how the cutoff value of the LSMI for diagnosing NAFLD was determined. Finally, this study did not divide respondents into groups of male and female participants for statistical analysis due to variances in body composition analyses between men and women. Therefore, a larger sample size is required for additional validation.
In conclusion, LSMI is significantly decreased in patients with T2DM and NAFLD. LSMI can predict NAFLD and is expected to become a screening indicator for NAFLD.
Data Sharing Statement
All data generated or analyzed during this study are included in the article. Further inquiries about the datasets can be directed to the corresponding author on reasonable request.
Ethics and Consent Statements
The study complies with the Declaration of Helsinki.
Funding
This study was supported by grants from Clinical Research Project of Changzhou Medical Center of Nanjing Medical University (CMCC202310), Changzhou Sci & Tech Program (No. CJ20210111), Young Talent Development Plan of Changzhou Health Commission (No. CZQM2020078) and Clinical Research Project of Changzhou Medical Center of Nanjing Medical University (CMCB202230).
Disclosure
Menggege Liu are first authors for this study. The authors declare that they have no conflicts of interest for this work.
References
1. Chen XY, Cai CZ, Yu ML, et al. LB100 ameliorates nonalcoholic fatty liver disease via the AMPK/Sirt1 pathway. World J Gastroenterol. 2019;25(45):6607–6618. doi:10.3748/wjg.v25.i45.6607
2. Ballestri S, Zona S, Targher G, et al. Nonalcoholic fatty liver disease is associated with an almost twofold increased risk of incident type 2 diabetes and metabolic syndrome. Evidence from a systematic review and meta-analysis. J Gastroenterol Hepatol. 2016;31(5):936–944. doi:10.1111/jgh.13264
3. Yang H, Suh DH, Kim DH, et al. Metabolomic and lipidomic analysis of the effect of pioglitazone on hepatic steatosis in a rat model of obese Type 2 diabetes. Br J Pharmacol. 2018;175(17):3610–3625. doi:10.1111/bph.14434
4. Li L, Huang Q, Yang L, et al. The association between Non-Alcoholic Fatty Liver Disease (NAFLD) and advanced fibrosis with serological vitamin B12 markers: results from the NHANES 1999–2004. Nutrients. 2022;14(6):1224.
5. American Diabetes A. 2. Classification and diagnosis of diabetes: standards of medical care in diabetes-2021. Diabetes Care. 2021;44:S15–S33.
6. Abdelhameed RFA, Ibrahim AK, Elfaky MA, et al. Antioxidant and anti-inflammatory activity of cynanchum acutum L. Isolated flavonoids using experimentally induced type 2 diabetes mellitus: biological and in silico investigation for NF-kappaB Pathway/miR-146a expression modulation. Antioxidants. 2021;10(11):1713. doi:10.3390/antiox10111713
7. Bhanji RA, Narayanan P, Allen AM, Malhi H, Watt KD. Sarcopenia in hiding: the risk and consequence of underestimating muscle dysfunction in nonalcoholic steatohepatitis. Hepatology. 2017;66(6):2055–2065. doi:10.1002/hep.29420
8. Yang S, Yang G, Wu H, et al. MicroRNA-193b impairs muscle growth in mouse models of type 2 diabetes by targeting the PDK1/Akt signalling pathway. Diabetologia. 2022;65(3):563–581. doi:10.1007/s00125-021-05616-y
9. Pacifico L, Perla FM, Andreoli G, Grieco R, Pierimarchi P, Chiesa C. Nonalcoholic fatty liver disease is associated with low skeletal muscle mass in overweight/obese youths. Front Pediatr. 2020;8:158. doi:10.3389/fped.2020.00158
10. Araujo CG, de Souza ESCG, Laukkanen JA, et al. Successful 10-second one-legged stance performance predicts survival in middle-aged and older individuals. Br J Sports Med. 2022;56(17):975–980. doi:10.1136/bjsports-2021-105360
11. Seo JY, Cho EJ, Kim MJ, et al. The relationship between metabolic dysfunction-associated fatty liver disease and low muscle mass in an asymptomatic Korean population. J Cachexia Sarcopenia Muscle. 2022;13(6):2953–2960. doi:10.1002/jcsm.13099
12. Charatcharoenwitthaya P, Karaketklang K, Aekplakorn W. Muscle strength, but not body mass index, is associated with mortality in patients with non-alcoholic fatty liver disease. J Cachexia Sarcopenia Muscle. 2022;13(5):2393–2404. doi:10.1002/jcsm.13001
13. Zhang W, Yang Z, Niu Y, et al. Association of calf circumference with insulin resistance and non-alcohol fatty liver disease: the REACTION study. BMC Endocr Disord. 2017;17(1):28. doi:10.1186/s12902-017-0176-4
14. Murata Y, Kadoya Y, Yamada S, Sanke T. Sarcopenia in elderly patients with type 2 diabetes mellitus: prevalence and related clinical factors. Diabetol Int. 2018;9(2):136–142. doi:10.1007/s13340-017-0339-6
15. Wang X, Hu Z, Hu J, Du J, Mitch WE. Insulin resistance accelerates muscle protein degradation: activation of the ubiquitin-proteasome pathway by defects in muscle cell signaling. Endocrinology. 2006;147(9):4160–4168. doi:10.1210/en.2006-0251
16. Aleman-Mateo H, Lopez Teros MT, Ramirez FA, Astiazaran-Garcia H. Association between insulin resistance and low relative appendicular skeletal muscle mass: evidence from a cohort study in community-dwelling older men and women participants. J Gerontol a Biol Sci Med Sci. 2014;69(7):871–877. doi:10.1093/gerona/glt193
17. Kim JA, Hwang SY, Chung HS, et al. Proportion and characteristics of the subjects with low muscle mass and abdominal obesity among the newly diagnosed and drug-naive type 2 diabetes mellitus patients. Diabetes Metab J. 2019;43(1):105–113. doi:10.4093/dmj.2018.0036
18. Bulur A, Sivritepe R. The association between non-alcoholic fatty liver disease and dynapenia in men diagnosed with type 2 diabetes mellitus. Healthcare. 2023;11(2):243. doi:10.3390/healthcare11020243
19. Jin R, Wang X, Li X, et al. Appendicular Skeletal Muscle Index and HbA1c evaluate liver steatosis in patients with metabolic associated fatty liver disease. Front Med. 2022;9:919502. doi:10.3389/fmed.2022.919502
20. Lee JH, Lee HS, Lee BK, Kwon YJ, Lee JW. Relationship between muscle mass and non-alcoholic fatty liver disease. Biology. 2021;10(2):122. doi:10.3390/biology10020122
21. Van Dongen C, Paik JM, Harring M, et al. Sarcopenia, healthy living, and mortality in patients with chronic liver diseases. Hepatol Commun. 2022;6(11):3140–3153. doi:10.1002/hep4.2061
22. Younossi ZM, Golabi P, de Avila L, et al. The global epidemiology of NAFLD and NASH in patients with type 2 diabetes: a systematic review and meta-analysis. J Hepatol. 2019;71(4):793–801. doi:10.1016/j.jhep.2019.06.021
23. Samuel VT, Shulman GI. Mechanisms for insulin resistance: common threads and missing links. Cell. 2012;148(5):852–871. doi:10.1016/j.cell.2012.02.017
24. Studenski SA, Peters KW, Alley DE, et al. The FNIH sarcopenia project: rationale, study description, conference recommendations, and final estimates. J Gerontol a Biol Sci Med Sci. 2014;69(5):547–558. doi:10.1093/gerona/glu010
 © 2023 The Author(s). This work is published and licensed by Dove Medical Press Limited. The
full terms of this license are available at https://www.dovepress.com/terms
and incorporate the Creative Commons Attribution
- Non Commercial (unported, 3.0) License.
By accessing the work you hereby accept the Terms. Non-commercial uses of the work are permitted
without any further permission from Dove Medical Press Limited, provided the work is properly
attributed. For permission for commercial use of this work, please see paragraphs 4.2 and 5 of our Terms.
© 2023 The Author(s). This work is published and licensed by Dove Medical Press Limited. The
full terms of this license are available at https://www.dovepress.com/terms
and incorporate the Creative Commons Attribution
- Non Commercial (unported, 3.0) License.
By accessing the work you hereby accept the Terms. Non-commercial uses of the work are permitted
without any further permission from Dove Medical Press Limited, provided the work is properly
attributed. For permission for commercial use of this work, please see paragraphs 4.2 and 5 of our Terms.