Back to Journals » Diabetes, Metabolic Syndrome and Obesity » Volume 14
The Association of Serum Uric Acid with Beta-Cell Function and Insulin Resistance in Nondiabetic Individuals: A Cross-Sectional Study
Authors Yu P, Huang L, Wang Z, Meng X, Yu X
Received 24 March 2021
Accepted for publication 6 May 2021
Published 14 June 2021 Volume 2021:14 Pages 2673—2682
DOI https://doi.org/10.2147/DMSO.S312489
Checked for plagiarism Yes
Review by Single anonymous peer review
Peer reviewer comments 3
Editor who approved publication: Dr Konstantinos Tziomalos
Peng Yu,1,2 Li Huang,1,2 Zhihan Wang,1,2 Xiaoyu Meng,1,2 Xuefeng Yu1,2
1Department of Internal Medicine, Tongji Hospital, Huazhong University of Science and Technology, Wuhan, Hubei, 430030, People’s Republic of China; 2Branch of National Clinical Research Center for Metabolic Diseases, Hubei, China
Correspondence: Xuefeng Yu Tel/Fax +8602783663331
Email [email protected]
Purpose: Higher serum levels of uric acid (SUA) are associated with an increased risk of developing type 2 diabetes. Meanwhile, insulin resistance and beta-cell dysfunction are critical factors that mediate the progression from normal glucose tolerance to impaired fasting glucose (IFG) and type 2 diabetes. We aimed to investigate the association between SUA levels and insulin resistance and beta-cell dysfunction in individuals without diabetes, thus explicating the role of uric acid in the early stage of the natural history of type 2 diabetes.
Patients and Methods: We used cross-sectional data from the China Health and Nutrition Survey to examine the association. Insulin resistance and beta-cell dysfunction were estimated using the homeostasis model assessment of insulin resistance (HOMA-IR) index and homeostasis model assessment of beta-cell function (HOMA-beta) index, respectively. The associations were analyzed by using partial correlation analysis and multivariate logistic regressionl analysis.
Results: SUA levels were positively associated with fasting glucose, fasting insulin, HOMA-IR in the total population. After adjustment for age, drinking, smoking, living area, daily dietary nutrient intake, body mass index (BMI), estimated glomerular filtration rate (eGFR), hypertension, and dyslipidemia, compared with participants in the lowest quartile of SUA, the adjusted odds ratios for the fourth quartiles were 1.56(1.09-2.24) for IFG, 1.51(1.27-1.78) for insulin resistance, and 1.06(0.88-1.27) for beta-cell dysfunction. In the subgroup analysis, no interactions were found between serum uric acid and age, drinking status, smoking status, BMI, hypertension, or dyslipidemia (all p for interaction> 0.05).
Conclusion: In nondiabetic individuals, SUA levels are independently associated with IFG and insulin resistance, while no significant association exists between SUA and beta-cell dysfunction.
Keywords: uric acid, beta-cell function, insulin resistance, nondiabetic
Introduction
Uric acid is the end product of the degradation of purine mononucleotides catalyzed by xanthine oxidoreductase, and it has two interconvertible forms: xanthine dehydrogenase and xanthine oxidase. Under stress conditions, including hypoxia and ischemia, xanthine oxidase predominates, and reactive oxygen species (ROS) are concomitantly generated in the process of uric acid production; moreover, uric acid is a potent antioxidant and acts as a free radical scavenger in human blood.1–3 The main source of uric acid is endogenous purines, but it can also be derived from dietary sources. In recent years, with changes in lifestyles and diet, especially increased intake in foods rich in purine, an increasing trend in the prevalence of hyperuricemia has been witnessed worldwide.4 In China, the estimated prevalence of hyperuricemia ranges from 5.5% to 23.6% in different regions.5
Hyperuricemia has drawn much attention in recent decades, as patients with hyperuricemia often present with metabolic diseases, cardiovascular diseases and cardio-metabolic related complications.6,7 Regarding diabetes, various longitudinal studies have demonstrated that higher baseline levels of serum uric acid increased the risk of developing type 2 diabetes, and a meta-analysis of 11 cohort studies including 42,834 participants indicated a 17% increase in the risk of type 2 diabetes for each 1 mg/dl increase in SUA.8–10 Thus, how uric acid contributes to the pathophysiology of type 2 diabetes deserves research.
Insulin resistance, and beta-cell dysfunction are two major pathophysiological defects in the development of type 2 diabetes. The interplay between genetic predisposition and lifestyle factors induces metabolic stress and systematic inflammation, thus initiating the disease.11 Subsequently, hyperglycemia occurs, and patient presents with IFG and/or impaired glucose tolerance owing to the reduction in whole-body insulin sensitivity and increased secretory burden of beta-cells. Studies have reported that prediabetes has been associated with a 40% reduction in whole-body insulin sensitivity and a substantial decline in beta-cell glucose sensitivity.12,13 Finally, prediabetes tends to progress to diabetes. Meanwhile, the natural history of type 2 diabetes can be changed by routine screening to identify prediabetes and early diabetes.14 Thus, clarifying the factors and their role in linking prediabetes to diabetes is crucial. Currently, the relationship between SUA and insulin resistance and beta-cell function has been established in several studies in patients with diabetes.15–18 However, a large-scale study investigating this relationship in nondiabetic population is still lacking. In the present study, we explored the association of SUA with glucose homeostasis in nondiabetic individuals as assessed by HOMA models, which may help to define the role of SUA in the early natural history of type 2 diabetes.
Patients and Methods
Data Source and Study Population
The China Health and Nutrition Survey (CHNS) is an ongoing longitudinal survey aimed at investigating nutrition status, health outcomes and associated economic, sociological, demographic, and behavioral characteristics in the Chinese population. The participants were randomly selected from 216 communities in nine provinces. To date, ten rounds of surveys have been conducted. Individual health-related data and socioeconomic data were collected during each survey; however, blood samples were not collected until the 2009 survey. Currently, the data are freely available in CHNS website. The study protocols were approved by the Institutional Review Committees of the University of North Carolina at Chapel Hill and the China National Institute of Nutrition and Food Safety. All participants had signed informed consent forms during the CHNS survey. Detailed information on this survey can be found in the published cohort profile.19
In this cross-sectional study, we utilized the data from the 2009 survey database. Participants greater than 18 years old were included in the study. Participants were excluded if they were pregnant, missing blood biochemical indicator measurements, missing anthropometric measurements, or lacking information on lifestyle data (smoking, drinking, dietary intake). Next, participants with a history of diabetes (self-reported previous diagnosis of diabetes or receiving anti-diabetes therapy or a fasting blood glucose level of ≥7.0 mmol/L or HbA1c ≥6.5%), myocardial infarction, stroke, chronic kidney diseases (eGFR<60 mL/min·1.73 m2), or severe liver dysfunction (ALT≥120U/L) were excluded. As anti-hypertensive drugs may affect uric acid levels, we also excluded those receiving anti-hypertensive therapy. Finally, 6027 participants were included in the analysis (Figure 1).
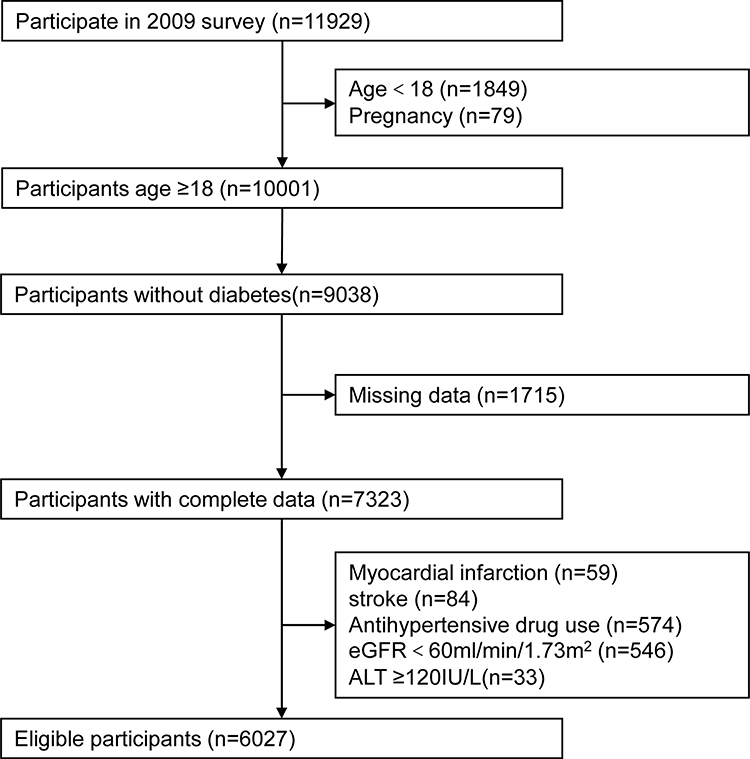 |
Figure 1 The flow chart of sample selection from the China Health and Nutrition Survey. |
Data Collection and Measurements
In the 2009 survey, a structured questionnaire and face-to-face interviews were used to collect information on the demographic characteristics, lifestyle (smoking/drinking status), medical history and medications of the participants. Dietary information was recorded through a 24-h recall of the food items and the proportion of each dish they consumed over the previous day for three consecutive days. Dietary intake of nutrients was estimated by trained nutritionists on the basis of the Chinese Food Composition Table. Height was measured without shoes to the nearest 0.2 cm using a portable stadiometer. Body weight was measured on a calibrated digital scale with subjects wearing light clothing without shoes, to the nearest 0.1 kg. BMI was calculated as weight in kilograms divided by the square of height in meters. Blood pressure was measured in duplicate, and the average of the values was calculated as the results. After overnight fasting, a venous blood sample was collected in an EDTA anticoagulant tube, the whole blood sample was centrifuged at 3000g for 15 minutes and serum was separated by a vacuum tube with a separation gel. The serum concentrations of ALT, Cr, uric acid, TC, TG, HDL-C, LDL-C, glucose and insulin were measured through an automated biochemistry analyzer with quality control. Uric acid was measured using the enzymatic colorimetric method, TC was measured using the CHOD-PAP method, and HDL-C was measured using the enzymatic method. The estimated glomerular filtration rate (eGFR) was estimated by using the CKD-EPI equation.20 The homeostatic model of insulin resistance (HOMA-IR) was calculated using the formula: HOMA-IR = fasting insulin (μU/mL)×fasting glucose (mmol/L)/22.5.21 Beta-cell function was evaluated using the homeostatic model assessment of beta-cell function (HOMA-beta), which was calculated using the formula: HOMA-beta=(360 × fasting insulin (μU/mL))/(fasting glucose (mg/dl)-63).21
Definitions
We defined hyperuricemia as serum uric acid greater than 420μmol/L in males and greater than 360μmol/L in females.22 Hypertension was defined as a self-reported previous diagnosis of hypertension or systolic blood pressure≥140 mmHg or diastolic blood pressure≥90 mmHg.23 Dyslipidemia was defined as the presence of any of the following: TG≥1.70mmol/L, TC≥5.2mmol/L, HDL-C<1.0mmol/L or LDL-C≥3.4mmol/L.24 IFG was defined as 6.1 mmol/L≤ fasting plasma glucose (FPG) < 7.0 mmol/L.25 Insulin resistance was defined as HOMA-IR ≥2.5.21 Beta cell dysfunction was defined as HOMA-beta within the lowest quartile among all participants.26
Statistical Analysis
Qualitative variables are expressed as percentages and quantitative variables are expressed as the means ± standard deviations (SDs). We compared the characteristics of participants in different groups by using the chi-square test (for categorical variables), one-way ANOVA (for multiple groups with equal variance), and Kruskal–Wallis test (data with unequal variances or nonnormal distribution). The correlation between serum uric acid and other quantitative variables was examined by partial correlation analysis. Logistic regression was used to estimate the association between serum uric acid and IFG, insulin resistance and beta-cell dysfunction, and the odds ratios (ORs) and corresponding 95% confidence intervals (95% CIs) were calculated. SUA was entered the regression model for both continuous variables and categorical variables according to sex-specific serum uric acid quartiles. Despite the crude model, covariate adjustments were made for age, sex, living area, smoking, alcohol consumption, daily dietary nutrient intake, BMI, eGFR, hypertension status, and hyperlipidemia status. In addition, subgroup analysis was used to check the robustness of the results of the logistic regression and identify factors potentially affecting the associations. The interactions between serum uric acid and stratifying factors were examined using likelihood ratio test in subgroup analysis. All statistical methods were implemented in IBM SPSS 20.0 and STATA 16.0 software. A p-value < 0.05 was considered statistically significant.
Results
Characteristics of Participants by Serum Uric Acid Level
Overall, 6027 eligible individuals including 2843 males and 3184 females, selected from the CHNS study, were included in our analysis; 674 study participants had hyperuricemia, and 329 participants had IFG. The incidence of insulin resistance was 40.0% in males and 41.1% in females. The characteristics of the study population stratified by sex-specific quartiles of serum uric acid are shown in Table 1. The median (IQR) SUA was 334 μmol/L for males and 242 μmol/L for females. Individuals with higher uric acid levels were more likely to live in urban areas and to be alcohol consumers and had a higher prevalence of hypertension and dyslipidemia. Meanwhile, BMI, WC, systolic and diastolic blood pressure, creatinine, eGFR, FPG, and insulin level increased with increasing quartiles of SUA. There were no significant differences in age or the proportion of current smokers across the quartiles.
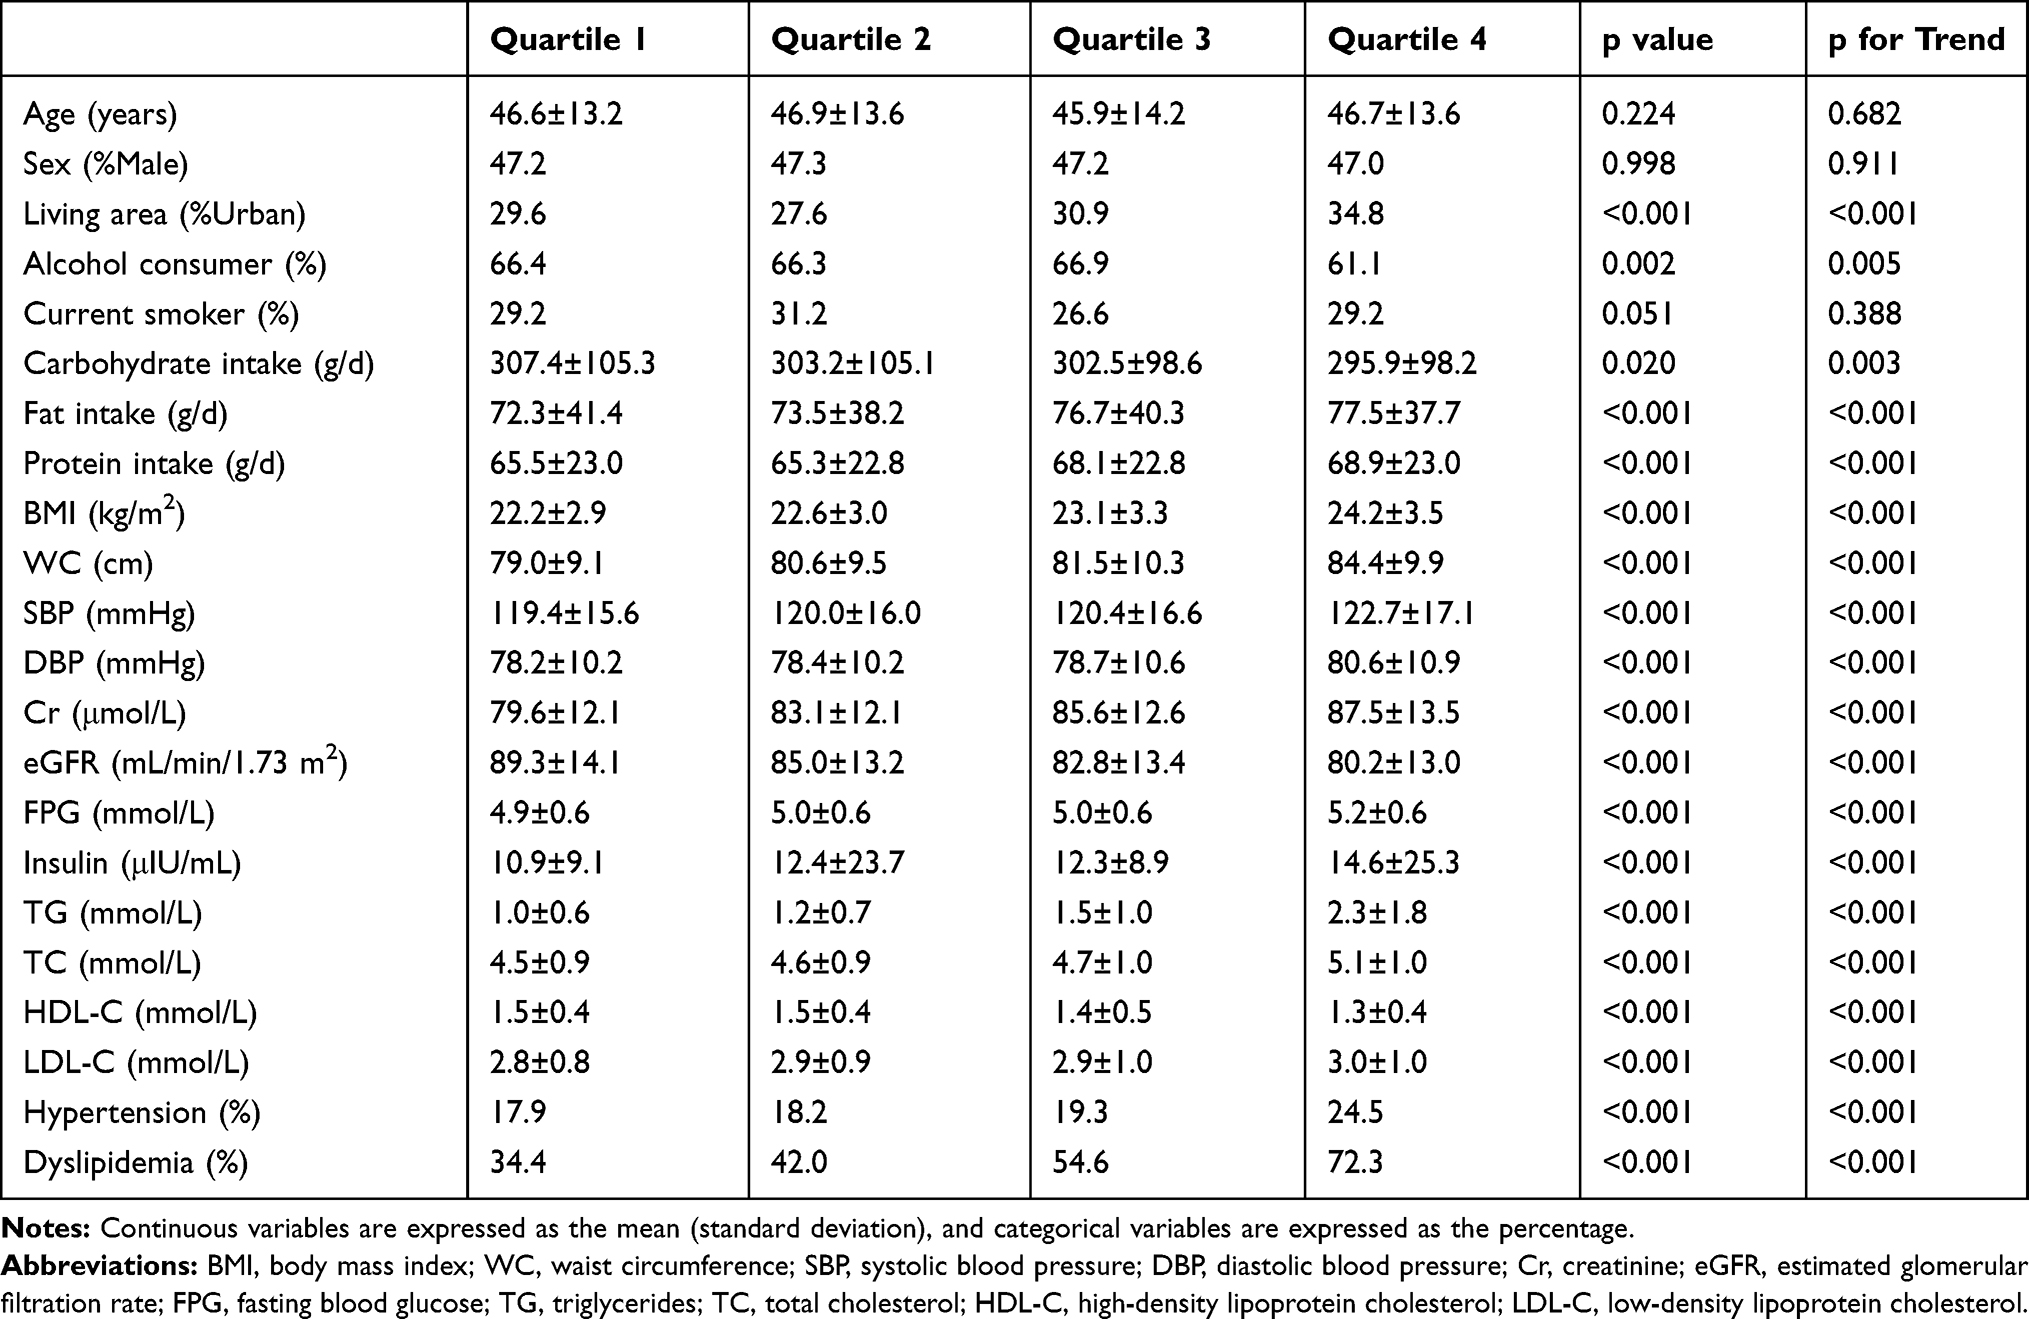 |
Table 1 Baseline Characteristics of Study Participants According to Sex-Specific SUA Quartiles |
The incidence of IFG and insulin resistance was significantly higher in participants with hyperuricemia than in those without hyperuricemia, while there was no difference in the incidence of beta-cell dysfunction (Table 2).
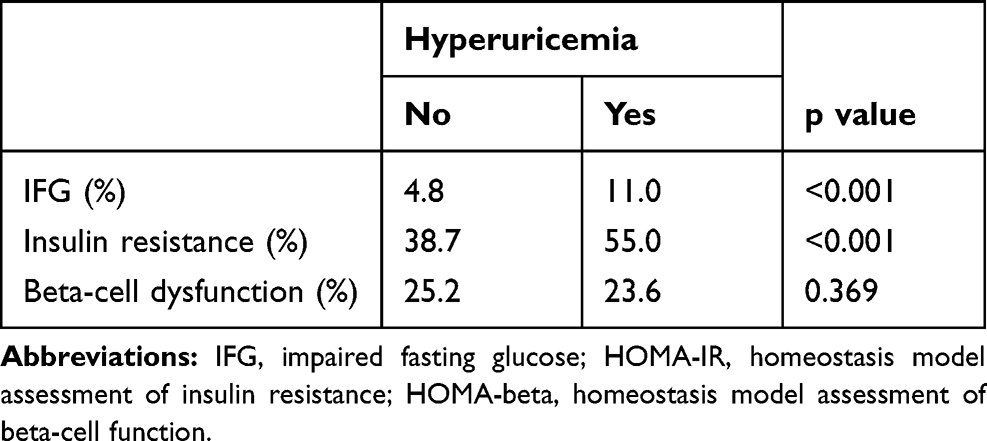 |
Table 2 Incidence of IFG, Insulin Resistance and Beta-Cell Dysfunction in Participants with Hyperuricemia |
Correlation Between SUA and Other Indexes
The partial correlations between uric acid levels and other parameters are shown in Table 3. After adjusting for age and sex, SUA positively correlated with BMI (r=0.212, p<0.001), WC (r=0.196, p<0.001), SBP (r=0.074, p<0.001), DBP (r=0.092, p<0.001), Cr (r=0.262, p<0.001), FPG (r=0.148, p<0.001), insulin (r=0.066, p<0.001), TG (r=0.518, p<0.001), TC (r=0.233, p<0.001), LDL-C (r=0.038, p=0.003), and HOMA-IR (r=0.075, p<0.001) and negatively correlated with eGFR (r=−0.261, p<0.001), and HDL-C (r=−0.172, p<0.001) in the total population. However, no correlation between SUA and HOMA-beta was found.
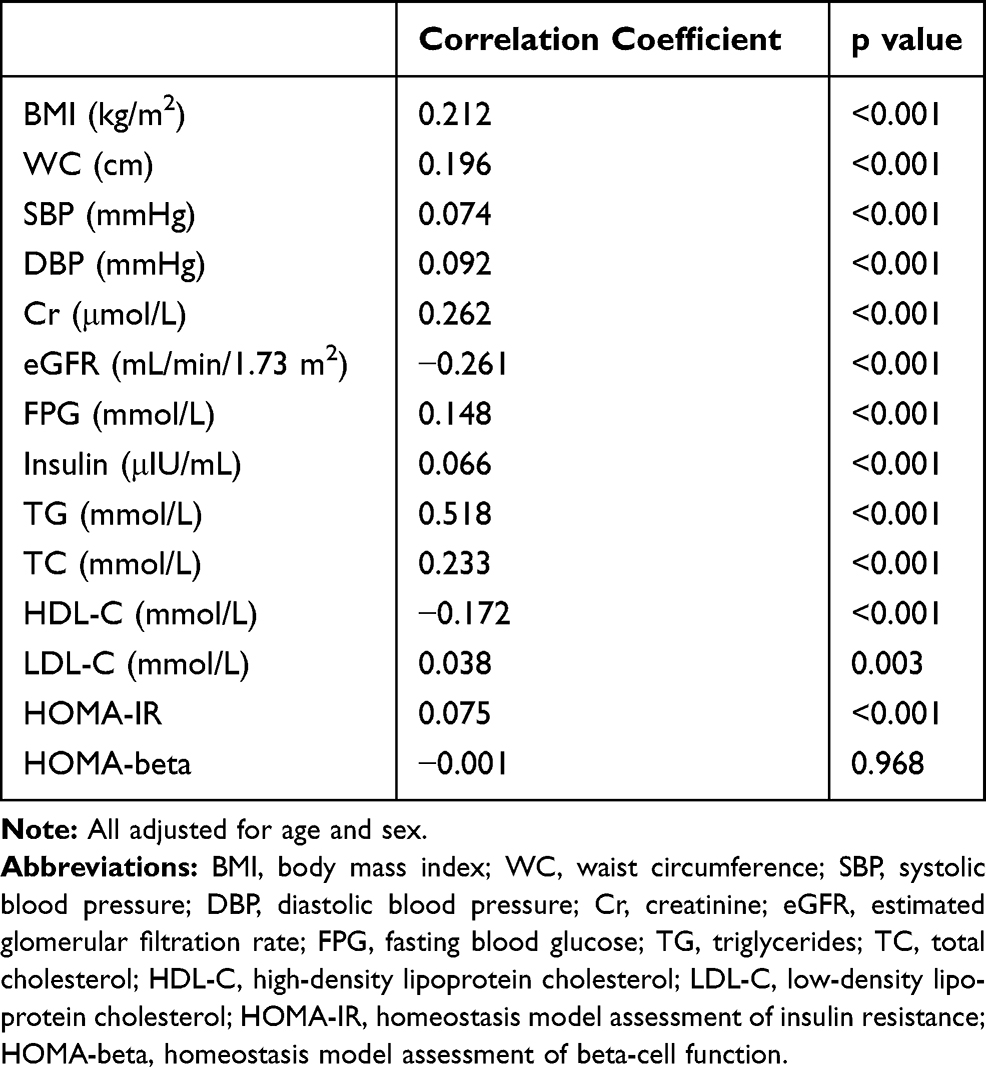 |
Table 3 Partial Correlation Coefficients Between SUA and Other Indexes |
Multivariable Association Between Serum Uric Acid and IFG, Insulin Resistance, and Beta-Cell Dysfunction
In the cross-sectional analysis, the incidence of IFG across the SUA quartiles was 55 cases (3.6%), 73 cases (4.9%), 79 cases (5.2%), and 122 cases (8.1%). In the unadjusted model (Model 1), the ORs for IFG were higher with increasing uric acid quartiles (p for trend < 0.001; Table 4). After adjusting for age, smoking, alcohol consumption, living area, and daily dietary nutrient intake, the ORs and 95% CIs were not substantially changed (Model 2). In the final model (Model 3) additional adjusted for BMI, eGFR, hypertension, and dyslipidemia, the magnitude of the ORs was significantly reduced, compared to the first quartile of uric acid levels, and the ORs and 95% CIs for IFG in the second, third, and fourth quartiles were 1.20 (0.84–1.73), 1.19 (0.82–1.72), and 1.56 (1.09–2.24) respectively (p for trend < 0.001). When SUA was included as a continuous variable, the ORs and 95% CIs for a one standard deviation increase in SUA in relation to IFG were 1.18 (1.04–1.34) for males and 1.47 (1.25–1.72) for females, which revealed an independent association between SUA and IFG (Table 4).
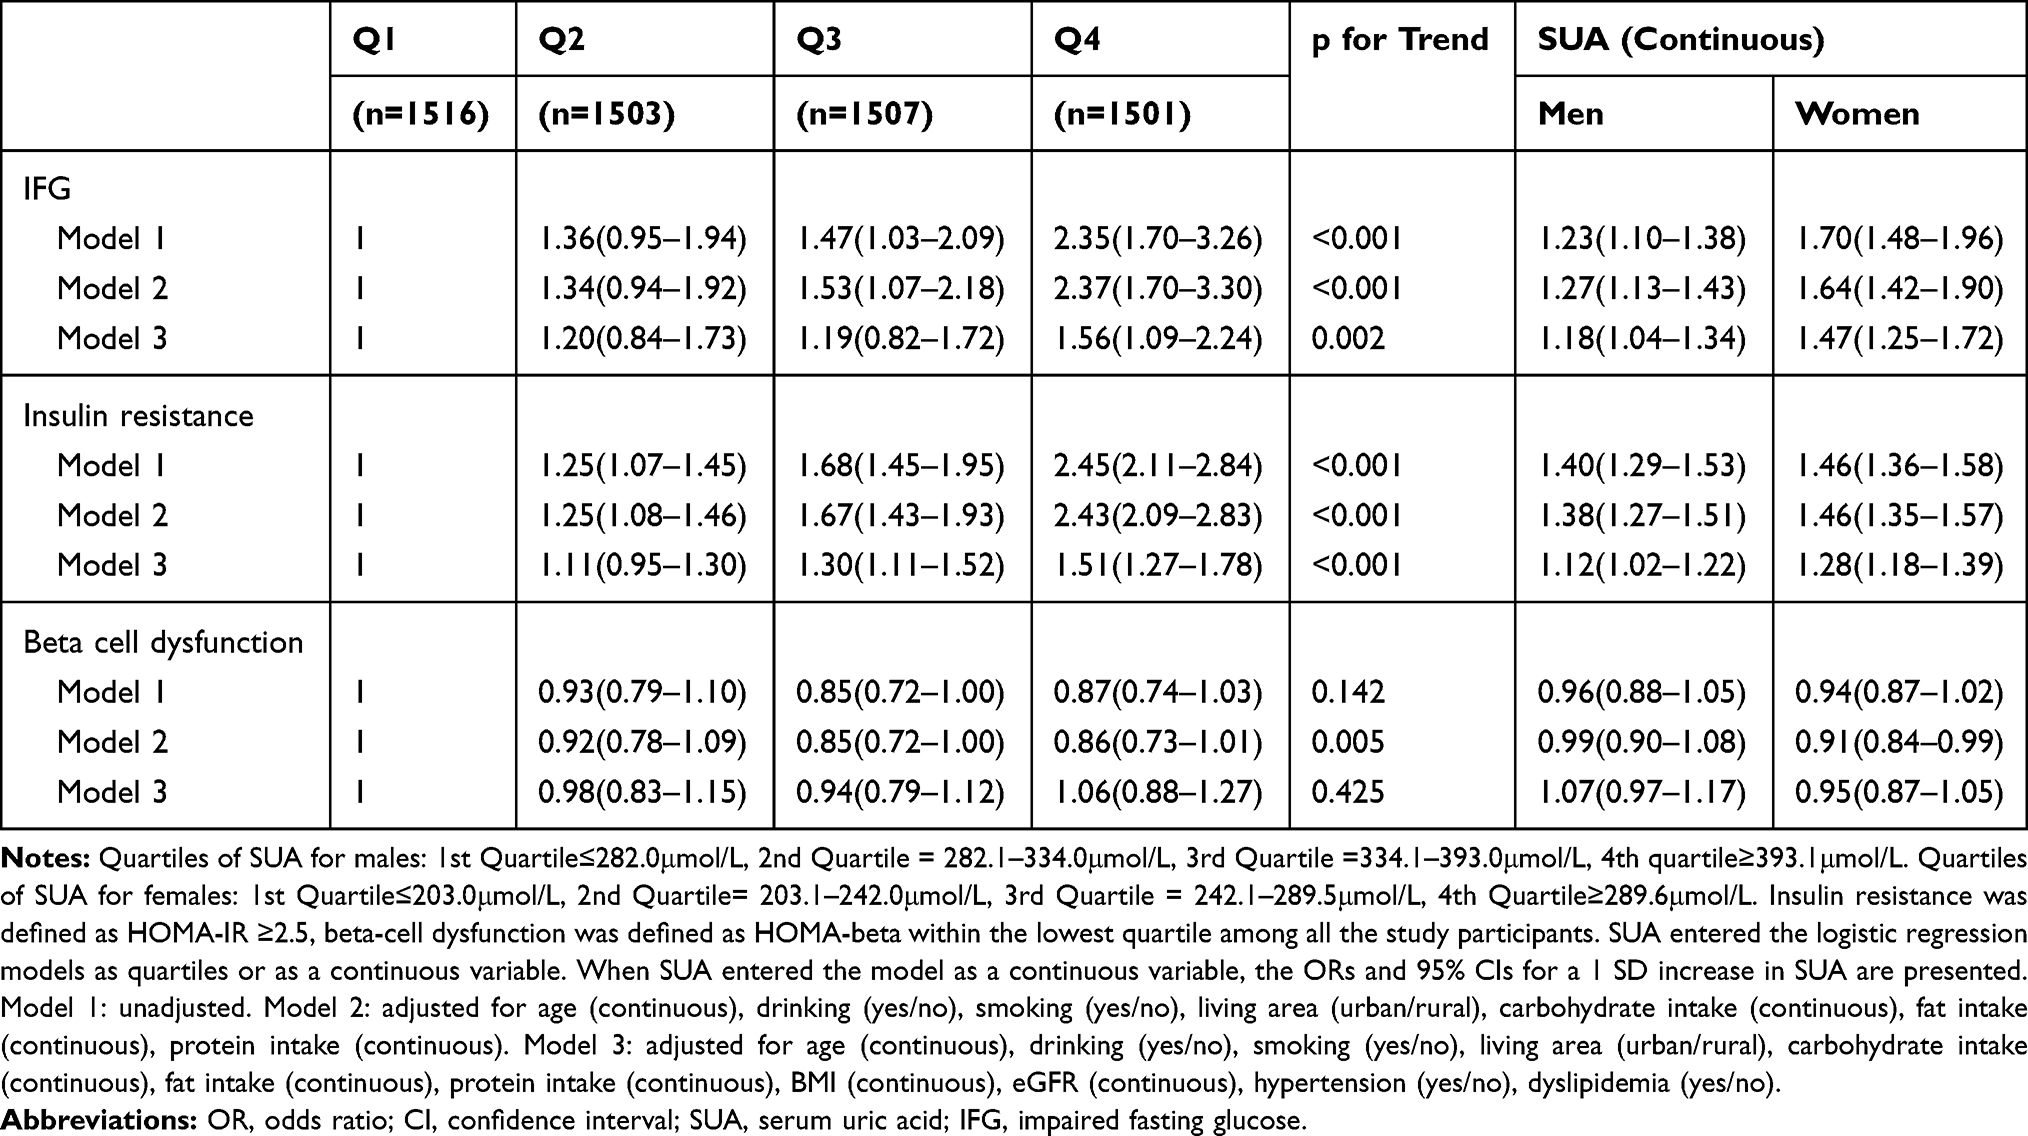 |
Table 4 ORs and 95% CIs for Association of SUA Levels with IFG, Insulin Resistance, and Beta-Cell Dysfunction |
The association between SUA and insulin resistance, and beta-cell dysfunction was also investigated by using three models. For insulin resistance, the ORs and 95% CIs for Model 1 and Model 2 largely overlapped. After multivariable adjustment (Model 3), SUA levels in the third and fourth quartiles compared with the lowest quartile were independently significantly associated with insulin resistance (1.30 (1.11–1.52) for quartile 3 and 1.51 (1.27–1.78) for quartile 4). When SUA was included as a continuous variable, this independent association was also found in both sexes, and females had higher OR values than males. With regard to beta-cell dysfunction, we found no significant association between serum uric acid and the incidence of decreased beta-cell function (the incidence of beta-cell dysfunction across the uric acid quartiles was 26.8%, 25.4%, 23.6%, and 24.2%, respectively, p=0.190). Moreover, no statistically significant association was found between SUA and beta-cell dysfunction after adjusting for potential cofounders (Table 4). A similar result was achieved when we divided the total population into hyperuricemic and nonhyperuricemic groups and set the nonhyperuricemic group as the reference group (Table 5).
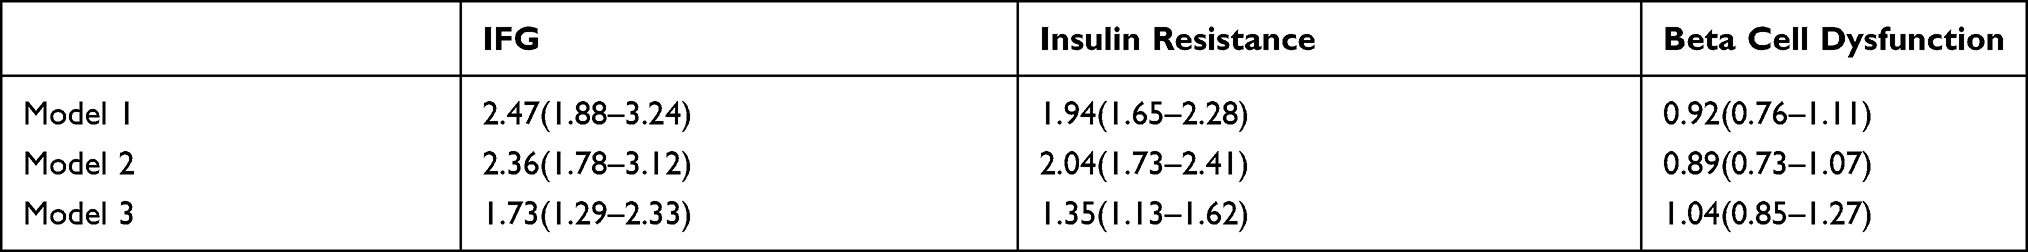 |
Table 5 ORs and 95% CIs for the Association of Hyperuricemia with IFG, Insulin Resistance, and Beta-Cell Dysfunction |
Subgroup Analysis
A subgroup analysis was performed to further evaluate the association between SUA and IFG, insulin resistance and beta-cell dysfunction (Table 6). The stratifying factors were age, drinking status, smoking status, BMI, hypertension, and dyslipidemia. No interactions were found between serum uric acid and these stratifying factors (all p for interaction>0.05). For IFG and insulin resistance, the association was obviously more pronounced in individuals who were overweight/obese, hypertensive or had dyslipidemia.
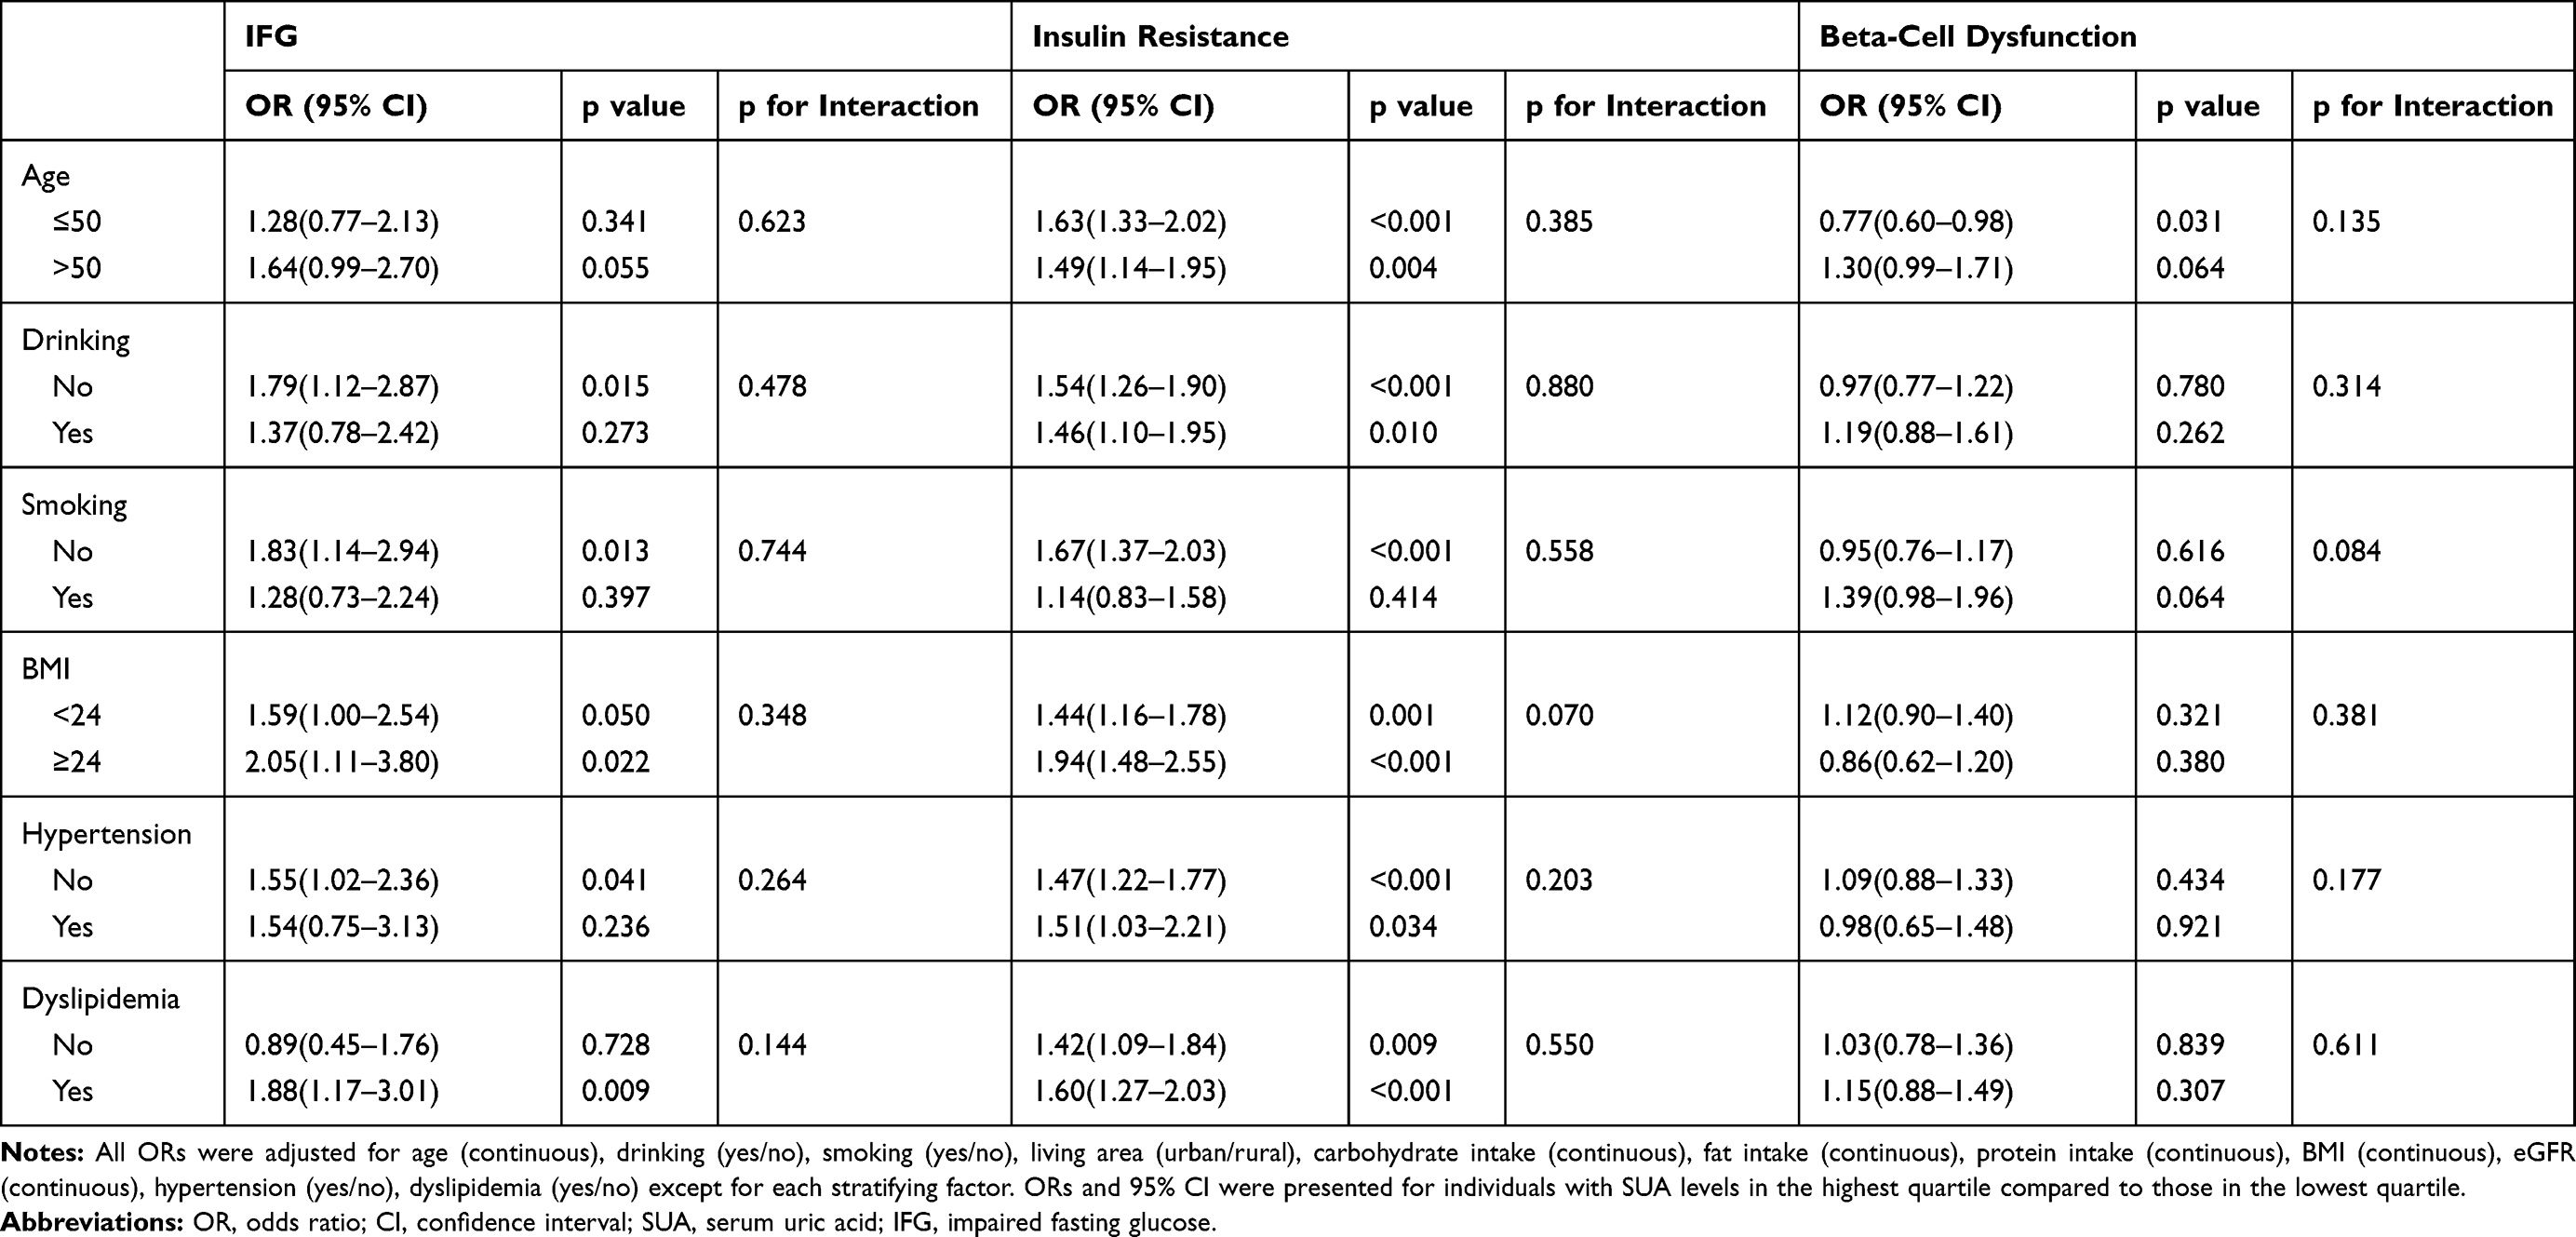 |
Table 6 The Relationship Between SUA Quartiles and IFG, Insulin Resistance, and Beta-Cell Dysfunction in Relevant Subgroups |
Discussion
In this cross-sectional study conducted in a nondiabetic population, we found that individuals with higher SUA levels were associated with a higher incidence of IFG and insulin resistance, which was independent of confounders including age, drinking, smoking, living area, daily dietary nutrient intake, BMI, eGFR, hypertension, and dyslipidemia. In addition, each 1 SD increase in SUA was associated with a greater likelihood of the presence of IFG and insulin resistance in women than in men, which means that the association was more pronounced in women. We also investigated the relationship between elevated uric acid concentrations and beta-cell failure, and no statistically significant correlation was found.
Insulin resistance, beta-cell dysfunction and IFG are related to the pathogenesis of diabetes. In our study performed in nondiabetic individuals, we found that those with elevated SUA levels presented a higher risk of IFG and insulin resistance, while the risk of beta cell dysfunction was not affected. This indicates that insulin resistance but not beta cell dysfunction may play a more important role in the early stage of the development of type 2 diabetes in patients with hyperuricemia.
Consistent with previous studies on individuals without diabetes, our study revealed that SUA was positively correlated with the indexes of insulin resistance.27,28 Moreover, considering the coexistence of obesity, hypertension, and dyslipidemia in patients with hyperuricemia, and their mutual relationships with insulin resistance, there was a possibility that the relationship between serum uric acid and insulin resistance was completely or partly mediated by these factors.29 We adjusted for these confounders in logistic regression models and found that the OR values significantly decreased compared to the unadjusted model; however, the ORs were still statistically significant, which helped clarify the independent association between uric acid and insulin resistance. The mechanisms behind this association are not fully illuminated, and current studies have revealed that uric acid can induce insulin resistance in two ways. First, uric acid per se can phosphorylate insulin receptor substrate 1 (ser473) and Akt (ser307), leading to the inhibition of insulin signaling in target cells.30,31 Second, hyperuricemia can increase nicotinamide adenine dinucleotide phosphate (NADPH) oxidase and xanthine oxidase activity, thus further increasing the production of reactive oxygen species (ROS). On the one hand, ROS and uric acid can activate the pro-inflammatory factors;32 on the other hand, ROS can reduce NO bioavailability, thus inhibiting GLUT4 translocation and the glucose uptake process which are NO-cGMP-dependent.33
In in vitro studies, uric acid can induce beta-cell apoptosis and inhibit glucose-stimulated insulin secretion, leading to reduced beta-cell mass and beta-cell dysfunction.34,35 However, we observed that the incidence of beta-cell dysfunction slightly decreased across SUA quartiles although it did not reach statistical significance, which should be explained. Contrary to in vitro studies, a series of animal and human studies revealed that uric acid can promote insulin release to some extent. For example, Luis et al reported a significant positive correlation between uric acid levels and the early phase and late phase of insulin release after adjusting for HOMA-IR and triglyceride levels in apparently healthy individuals.36 By using the hyperglycemia clamp technique, Robles et al found that uric acid showed a positive relationship with the total phase of insulin secretion in individuals with type 2 diabetes mellitus but without hyperuricemia.37 Considering that individuals with elevated serum uric acid levels usually have insulin resistance, the increase in insulin secretion may be a compensatory response to insulin resistance. Tang et al found that in patients with type 2 diabetes, compared with those with lower SUA levels, individuals with higher SUA had greater HOMA-IR and exhibited higher insulin secretion ability at the early stage of disease, but their residual beta-cell function deteriorated more rapidly along with disease progression.16 Their study offers a potential interpretation of conflicting results about the relationship between SUA and beta-cell function. In the nondiabetic population, there is a possibility that elevated SUA levels can also lead to a compensatory increase in insulin secretion; thus, the results observed in our study may just be a transient state. A continuous observational prospective study is needed to determine the dynamic change in beta-cell function along the natural history of T2DM according to baseline SUA levels.
Our study has several strengths. First, our study had a relatively large sample size and was based on data from the CHNS survey, which can be representative of the general population. Second, as the relationship between SUA and markers of glucose homeostasis has rarely been investigated in nondiabetic individuals in previous studies, our study provides new insights in this area. Several limitations of our study should be considered. First, the cross-sectional nature of this study can not provide causal inference between the dependent and independent variables, thus our results are descriptive and do not explain biological links. Second, as an observational study, potential residual confounders may exist. We failed to including factors such as lipids lowering drugs, dipping pattern of the participants in our study, which may modulate the association between uric acid and glucose homeostasis.38 Third, we did not investigate the factors underlying this relationship. UA can act as an antioxidant and protect cells from oxidative stress, while under stressful conditions, UA acts as a prooxidant that causes oxidative damage to cells. It is not yet clear under which conditions it mainly acts as a prooxidant; however, current studies indicate that the hyperactivity of xanthine oxidase may lead to prooxidant activation of UA and the production of excess ROS.39,40 Moreover, a recent prospective cohort study proposed that elevated serum xanthine oxidase activity, but not the UA concentration, independently predicts the risk of developing T2DM.41 Thus, there is a possibility that the relationship between SUA levels and abnormal glucose metabolism is not directly causal and that xanthine oxidase is a crucial link. However, we did not have measures of xanthine oxidase in the data sources, thus a study aiming at to determine whether xanthine oxidase mediated the association between uric acid and insulin resistance is needed in the future. Fourth, as our study participants had not undergone the OGTT test, we only used HOMA models to evaluate the estimation of insulin resistance and beta-cell dysfunction. Although it is a widely used clinical and epidemiological tool, HOMA only provides information about the basal state of glucose homeostasis, while the stimulated state is lacking.42 Combining other OGTT-based surrogate indexes such as the Matsuda index, insulin secretion-sensitivity index-2, and insulinogenic index would be better for assessing insulin sensitivity and beta-cell function. Fifth, as our study was only performed in a Chinese population, and there are ethnic differences in the distribution of insulin sensitivity and insulin response in the natural course from a normal glucose state to type 2 diabetes,43 our findings are not generalizable to other populations.
Conclusion
In conclusion, our study revealed that SUA was independently associated with insulin resistance and IFG in nondiabetic individuals, while a significant link between SUA and beta-cell dysfunction was missing. This means that a considerable proportion of those with hyperuricemia were at high risk for the onset of type 2 diabetes. In this stage, insulin resistance is the major problem, and lifestyle changes or interventions aimed at alleviating insulin resistance may reduce the risk of further type 2 diabetes.
Acknowledgments
This research uses data from China Health and Nutrition Survey (CHNS) which is freely available online. We are grateful to research grant funding from the National Institute for Health (NIH), the Eunice Kennedy Shriver National Institute of Child Health and Human Development (NICHD) for R01 HD30880, National Institute on Aging (NIA) for R01 AG065357, National Institute of Diabetes and Digestive and Kidney Diseases (NIDDK) for R01DK104371 and R01HL108427, the NIH Fogarty grant D43 TW009077 since 1989, and the China-Japan Friendship Hospital, Ministry of Health for support for CHNS 2009, Chinese National Human Genome Center at Shanghai since 2009, and Beijing Municipal Center for Disease Prevention and Control since 2011. We thank the National Institute for Nutrition and Health, China Center for Disease Control and Prevention, Beijing Municipal Center for Disease Control and Prevention, and the Chinese National Human Genome Center at Shanghai.
Disclosure
The authors declare no conflicts of interest in this work.
References
1. Brucato A, Cianci F, Carnovale C. Management of hyperuricemia in asymptomatic patients: a critical appraisal. Eur J Intern Med. 2020;74:8–17. doi:10.1016/j.ejim.2020.01.001
2. Bowman GL, Shannon J, Frei B, Kaye JA, Quinn JF. Uric acid as a CNS antioxidant. J Alzheimer’s Dis. 2010;19(4):1331–1336. doi:10.3233/jad-2010-1330
3. Doehner W, Anker SD. Uric acid in chronic heart failure. Semin Nephrol. 2005;25(1):61–66. doi:10.1016/j.semnephrol.2004.09.010
4. Dehlin M, Jacobsson L, Roddy E. Global epidemiology of gout: prevalence, incidence, treatment patterns and risk factors. Nat Rev Rheumatol. 2020;16(7):380–390. doi:10.1038/s41584-020-0441-1
5. Liu R, Han C, Wu D, et al. Prevalence of hyperuricemia and Gout in Mainland China from 2000 to 2014: a systematic review and meta-analysis. Biomed Res Int. 2015;2015:762820. doi:10.1155/2015/762820
6. Kocak MZ, Aktas G, Erkus E, Sincer I, Atak B, Duman T. Serum uric acid to HDL-cholesterol ratio is a strong predictor of metabolic syndrome in type 2 diabetes mellitus. Revista Da Associacao Medica Brasileira (1992). 2019;65(1):9–15. doi:10.1590/1806-9282.65.1.9
7. Kocak MZ, Aktas G, Duman TT, Atak BM, Savli H. Is Uric Acid elevation a random finding or a causative agent of diabetic nephropathy? Revista Da Associacao Medica Brasileira (1992). 2019;65(9):1155–1160. doi:10.1590/1806-9282.65.9.1156
8. Bhole V, Choi JW, Kim SW, de Vera M, Choi H. Serum uric acid levels and the risk of type 2 diabetes: a prospective study. Am J Med. 2010;123(10):957–961. doi:10.1016/j.amjmed.2010.03.027
9. Lv Q, Meng XF, He FF, et al. High serum uric acid and increased risk of type 2 diabetes: a systemic review and meta-analysis of prospective cohort studies. PLoS One. 2013;8(2):e56864. doi:10.1371/journal.pone.0056864
10. Kodama S, Saito K, Yachi Y, et al. Association between serum uric acid and development of type 2 diabetes. Diabetes Care. 2009;32(9):1737–1742. doi:10.2337/dc09-0288
11. Skyler JS, Bakris GL, Bonifacio E, et al. Differentiation of diabetes by pathophysiology, natural history, and prognosis. Diabetes. 2017;66(2):241–255. doi:10.2337/db16-0806
12. Ferrannini E. Definition of intervention points in prediabetes. Lancet Diabetes Endocrinol. 2014;2(8):667–675. doi:10.1016/s2213-8587(13)70175-x
13. Ferrannini E, Mari A. How to measure insulin sensitivity. J Hypertens. 1998;16(7):895–906. doi:10.1097/00004872-199816070-00001
14. Phillips LS, Ratner RE, Buse JB, Kahn SE. We can change the natural history of type 2 diabetes. Diabetes Care. 2014;37(10):2668–2676. doi:10.2337/dc14-0817
15. Li M, Gu L, Yang J, Lou Q. Serum uric acid to creatinine ratio correlates with β-cell function in type 2 diabetes. Diabetes Metab Res Rev. 2018;34(5):e3001. doi:10.1002/dmrr.3001
16. Tang W, Fu Q, Zhang Q, et al. The association between serum uric acid and residual β -cell function in type 2 diabetes. J Diabetes Res. 2014;2014:709691. doi:10.1155/2014/709691
17. Zhong X, Zhang D, Yang L, Du Y, Pan T. The relationship between serum uric acid within the normal range and β-cell function in Chinese patients with type 2 diabetes: differences by body mass index and gender. PeerJ. 2019;7:e6666. doi:10.7717/peerj.6666
18. Kutoh E, Wada A, Kuto AN, Hayashi J. Regulation of serum uric acid with canagliflozin monotherapy in type 2 diabetes: a potential link between uric acid and pancreatic β-cell function. Int J Clin Pharmacol Ther. 2019;57(12):590–595. doi:10.5414/cp203513
19. Popkin BM, Du S, Zhai F, Zhang B. Cohort profile: the China health and nutrition survey–monitoring and understanding socio-economic and health change in China, 1989–2011. Int J Epidemiol. 2010;39(6):1435–1440. doi:10.1093/ije/dyp322
20. Levey AS, Stevens LA, Schmid CH, et al. A new equation to estimate glomerular filtration rate. Ann Intern Med. 2009;150(9):604–612. doi:10.7326/0003-4819-150-9-200905050-00006
21. Matthews DR, Hosker JP, Rudenski AS, Naylor BA, Treacher DF, Turner RC. Homeostasis model assessment: insulin resistance and beta-cell function from fasting plasma glucose and insulin concentrations in man. Diabetologia. 1985;28(7):412–419. doi:10.1007/bf00280883
22. [Chinese multi-disciplinary consensus on the diagnosis and treatment of hyperuricemia and its related diseases]. Zhonghua Nei Ke Za Zhi. 2017;56(3):235–248. doi:10.3760/cma.j.issn.0578-1426.2017.03.021
23. Liu LS. [2010 Chinese guidelines for the management of hypertension]. Zhonghua Xin Xue Guan Bing Za Zhi. 2011;39(7):579–615.
24. Joint committee for guideline revision. 2016 Chinese guidelines for the management of dyslipidemia in adults. J Geriatric Cardiol. 2018;15(1):1–29. doi:10.11909/j.issn.1671-5411.2018.01.011
25. Report of the expert committee on the diagnosis and classification of diabetes mellitus. Diabetes Care. 1997;20(7):1183–1197. doi:10.2337/diacare.20.7.1183
26. Wang B, Li M, Zhao Z, et al. Urinary bisphenol A concentration and glucose homeostasis in non-diabetic adults: a repeated-measures, longitudinal study. Diabetologia. 2019;62(9):1591–1600. doi:10.1007/s00125-019-4898-x
27. Bonora E, Capaldo B, Perin PC, et al. Hyperinsulinemia and insulin resistance are independently associated with plasma lipids, uric acid and blood pressure in non-diabetic subjects. The GISIR database. Nutr Metab Cardiovasc Dis. 2008;18(9):624–631. doi:10.1016/j.numecd.2007.05.002
28. Kimberly WT, O’Sullivan JF, Nath AK, et al. Metabolite profiling identifies anandamide as a biomarker of nonalcoholic steatohepatitis. JCI Insight. 2017;2(9). doi:10.1172/jci.insight.92989
29. Mazidi M, Katsiki N, Mikhailidis DP, Banach M. The link between insulin resistance parameters and serum uric acid is mediated by adiposity. Atherosclerosis. 2018;270:180–186. doi:10.1016/j.atherosclerosis.2017.12.033
30. Zhu Y, Hu Y, Huang T, et al. High uric acid directly inhibits insulin signalling and induces insulin resistance. Biochem Biophys Res Commun. 2014;447(4):707–714. doi:10.1016/j.bbrc.2014.04.080
31. Zhi L, Yuzhang Z, Tianliang H, Hisatome I, Yamamoto T, Jidong C. High uric acid induces insulin resistance in cardiomyocytes in vitro and in vivo. PLoS One. 2016;11(2):e0147737. doi:10.1371/journal.pone.0147737
32. Baldwin W, McRae S, Marek G, et al. Hyperuricemia as a mediator of the proinflammatory endocrine imbalance in the adipose tissue in a murine model of the metabolic syndrome. Diabetes. 2011;60(4):1258–1269. doi:10.2337/db10-0916
33. Ndrepepa G. Uric acid and cardiovascular disease. Clin Chim Acta. 2018;484:150–163. doi:10.1016/j.cca.2018.05.046
34. Jia L, Xing J, Ding Y, et al. Hyperuricemia causes pancreatic β-cell death and dysfunction through NF-κB signaling pathway. PLoS One. 2013;8(10):e78284. doi:10.1371/journal.pone.0078284
35. Lu J, He Y, Cui L, et al. Hyperuricemia predisposes to the onset of diabetes via promoting pancreatic β-cell death in uricase-deficient male mice. Diabetes. 2020;69(6):1149–1163. doi:10.2337/db19-0704
36. Simental-Mendía LE, Simental-Mendía E, Rodríguez-Morán M, Guerrero-Romero F. Hyperuricemia is associated with the increase of insulin release in non-obese subjects with normal glucose tolerance. Endocr Res. 2017;42(1):1–5. doi:10.3109/07435800.2016.1155597
37. Robles-Cervantes JA, Ramos-Zavala MG, González-Ortiz M, et al. Relationship between serum concentration of uric acid and insulin secretion among adults with type 2 diabetes mellitus. Int J Endocrinol. 2011;2011:107904. doi:10.1155/2011/107904
38. Zupo R, Castellana F, Boninfante B, et al. Uric acid and potassium serum levels are independent predictors of blood pressure non-dipping in overweight or obese subjects. Nutrients. 2019;11(12):2970. doi:10.3390/nu11122970
39. Siemińska E, Sobczak P, Skibińska N, Sikora J. The differential role of uric acid - The purpose or cause of cardiovascular diseases? Med Hypotheses. 2020;142:109791. doi:10.1016/j.mehy.2020.109791
40. Maruhashi T, Hisatome I, Kihara Y, Higashi Y. Hyperuricemia and endothelial function: from molecular background to clinical perspectives. Atherosclerosis. 2018;278:226–231. doi:10.1016/j.atherosclerosis.2018.10.007
41. Li X, Meng X, Gao X, et al. Elevated serum xanthine oxidase activity is associated with the development of type 2 diabetes: a Prospective Cohort Study. Diabetes Care. 2018;41(4):884–890. doi:10.2337/dc17-1434
42. Wallace TM, Levy JC, Matthews DR. Use and abuse of HOMA modeling. Diabetes Care. 2004;27(6):1487–1495. doi:10.2337/diacare.27.6.1487
43. Kodama K, Tojjar D, Yamada S, Toda K, Patel CJ, Butte AJ. Ethnic differences in the relationship between insulin sensitivity and insulin response: a systematic review and meta-analysis. Diabetes Care. 2013;36(6):1789–1796. doi:10.2337/dc12-1235
 © 2021 The Author(s). This work is published and licensed by Dove Medical Press Limited. The
full terms of this license are available at https://www.dovepress.com/terms
and incorporate the Creative Commons Attribution
- Non Commercial (unported, 3.0) License.
By accessing the work you hereby accept the Terms. Non-commercial uses of the work are permitted
without any further permission from Dove Medical Press Limited, provided the work is properly
attributed. For permission for commercial use of this work, please see paragraphs 4.2 and 5 of our Terms.
© 2021 The Author(s). This work is published and licensed by Dove Medical Press Limited. The
full terms of this license are available at https://www.dovepress.com/terms
and incorporate the Creative Commons Attribution
- Non Commercial (unported, 3.0) License.
By accessing the work you hereby accept the Terms. Non-commercial uses of the work are permitted
without any further permission from Dove Medical Press Limited, provided the work is properly
attributed. For permission for commercial use of this work, please see paragraphs 4.2 and 5 of our Terms.