Back to Journals » Nature and Science of Sleep » Volume 12
The Association Between School Start Time and Sleep Duration, Sustained Attention, and Academic Performance
Authors Alfonsi V ![]() , Palmizio R
, Palmizio R ![]() , Rubino A, Scarpelli S
, Rubino A, Scarpelli S ![]() , Gorgoni M
, Gorgoni M ![]() , D'Atri A
, D'Atri A ![]() , Pazzaglia M
, Pazzaglia M ![]() , Ferrara M
, Ferrara M ![]() , Giuliano S, De Gennaro L
, Giuliano S, De Gennaro L ![]()
Received 25 July 2020
Accepted for publication 14 November 2020
Published 10 December 2020 Volume 2020:12 Pages 1161—1172
DOI https://doi.org/10.2147/NSS.S273875
Checked for plagiarism Yes
Review by Single anonymous peer review
Peer reviewer comments 3
Editor who approved publication: Dr Steven Shea
Valentina Alfonsi,1,2 Rossella Palmizio,3 Annalisa Rubino,3 Serena Scarpelli,2 Maurizio Gorgoni,1 Aurora D’Atri,4 Mariella Pazzaglia,1,2 Michele Ferrara,4 Salvatore Giuliano,3 Luigi De Gennaro1,2
1Department of Psychology, “Sapienza” University of Rome, Rome, Italy; 2I.R.C.C.S. Fondazione Santa Lucia, Rome, Italy; 3I.I.S.S. “Ettore Majorana”, Brindisi, Italy; 4Department of Biotechnological and Applied Clinical Sciences, University of L’Aquila, L’Aquila, Italy
Correspondence: Luigi De Gennaro
“Sapienza” University of Rome, Via Dei Marsi, 78, Rome 00185, Italy
Tel (+39) 06-49917647
Fax (+39) 06-49917711
Email [email protected]
Purpose: In adolescence, physiological (circadian and homeostatic regulation of sleep) and social habits contribute to delayed sleep onset, while social obligations impose early sleep offset. The effects of delayed school start time on the subjective/objective measures of sleep–wake patterns and academic achievement have not been established.
Methods: This pre-, post-, and longitudinal non-randomized study included an early (8:00 am; ESC=30 students) and the late (9:00 am; LSC=21 students) start class. Multiple sleep data included a weekly sleep diary, Karolinska Sleepiness Scale, Pittsburgh Sleep Quality Index, and Epworth Sleepiness Scale. Sustained attention was measured using the Psychomotor Vigilance Task. Academic performance was evaluated by two different mathematical and scientific standard tests (entrance and final) and by school attendance indicators. Data were collected at monthly intervals from October 2018 to May 2019 and the beginning and end of the academic year (pre/post).
Results: All students turned their lights off at similar times (LSC=11:21pm, ESC=11:11pm), but LSC students woke up later (7:23am) than ESC students (6:55am; F1,48=11.81, p=0.001) on school days. The groups did not differ in total sleep duration on non-school days. Longitudinal measures revealed a significant increase (8.9%, 34 min) in total sleep duration of LSC students across the academic year. ESC students maintained approximately the same sleep duration. Furthermore, changes in sleep duration had parallelled significant differences in sustained attention, with LSC students outperforming ESC students. Longitudinal changes of sleep and sustained attention were associated with a coherent pattern of changes in academic performance.
Conclusion: Findings indicate that a one-hour delay in school start time is associated with longer sleep, better diurnal sustained attention, attendance, and improved academic performance. Notably, sleep changes were limited to school days. A delay in school start time should be seriously considered to improve sleep and academic achievements of students.
Keywords: sleep, school start time, attention, school health, sleep loss, adolescence
Introduction
Due to specific developmental changes in both the circadian1 and homeostatic regulation2 of sleep, adolescents exhibit a natural tendency to remain active until late at night and awaken late in the morning.3–5 In adolescence, the circadian system’s period lengthens, delaying the onset of sleep. Furthermore, the homeostatic regulation of sleep is associated with decreased sleep pressure during waking periods, which allows adolescents to stay awake longer than younger adolescents and adults.
Behavioral and social factors, such as the nighttime use of electronic devices, contribute to delayed sleep onset.6 Social obligations (eg, school attendance) also impose an early sleep offset, resulting in considerably less sleep than the eight to ten hours the American Academy of Sleep Medicine (AASM) recommends.7
Over the past 20 years, our knowledge about the crucial role of sleep in adolescents’ well-being has dramatically increased.8 Chronic sleep restriction among adolescents has been connected to many adverse outcomes affecting several daytime functioning areas (eg, mental and physical health, cognitive and academic performance, and risk-taking behaviors).9 Therefore, insufficient sleep in adolescents has become a major public health issue.10 Carskadon11 described the detrimental and cumulative effects of biological, psychological, and social factors on adolescent sleep as a “perfect storm.”
The American Academy of Pediatrics12 recommends delaying middle and high school start times to reduce sleep deprivation among adolescents. Consequently, many schools worldwide instituted later start times, and many non-experimental studies started advocating delayed school start times. A systematic review13 evaluated six pre/post design studies where school start times were delayed by 25–60 minutes, and it showed increases of 25–77 minutes in total sleep time (TST) per weeknight as a result. Postponing school start times also reduced daytime sleepiness, tardiness, and trouble staying awake. A subsequent review14 using empirical evidence from 11 studies (297,994 participants) proposed that delayed school start times may enhance physiological, academic, and psychosocial outcomes. Six studies reported significant positive relationships between later school start times and amount of sleep. Four studies, in contrast, reported mixed results regarding the association between later school start times and academic outcomes. Although these studies13,14 suggested several benefits of delaying school start times, they highlighted the need for higher-quality, longitudinal primary evidence. However, randomized controlled trials and high-quality primary studies are challenging. Indeed, school systems often refuse to allow researchers the necessary control over scheduling and data collection. Most studies also use a single-time survey not quantified by objective data (ie, behavioral or physiological measures). A recent study15 on secondary school start time delayed by 55 minutes overcame this limitation by using actigraphy to measure wake–sleep schedules. This pre/post study revealed a significant increase (4.5%, 34 min) in sleep duration and an improvement in attendance. However, the effect of increased nightly sleep was moderate in similar objective studies,16 and the later-start approach has not yet entirely convinced all school administrators. More consistent evidence and studies focusing on the process rather than solely the effects are thus urgently needed.17 Chronic sleep deprivation critically impacts not only physical and mental health but also attention,18 learning, and memory consolidation,19 potentially affecting daytime academic performance.20
Therefore, we systematically collected subjective and objective data at one-month intervals throughout an entire academic year in an Italian pilot project studying delayed school starts. To examine the relationships between later school start, increased nighttime sleep, and academic performance, we introduced a behavioral assessment of psychomotor vigilance using a well-established task21 that provided the most widely used metrics of sustained attention. Academic performance could be guided by sleep quality, which affects memory, learning consolidation, and more directly, the diurnal level of vigilance.8 According to the intrinsic nature of this field study, we used a non-randomized controlled trial design, prospectively assigning participants to 8:00
Within the theoretical framework determined by existing empirical studies, we hypothesized that delaying school start times would lead to primary effects on sleep (longer sleep duration) and secondary effects on daytime functioning (greater sustained attention and better academic performance).
Participants and Methods
Participants
Invitations were sent to the parents of all high school freshmen of two sections of a secondary school at the I.I.S.S. “Ettore Majorana” in Brindisi requesting the students’ participation in a pilot study to investigate the potential benefits of a one-hour delay in school start time.
Participants were asked to self-select into either the 9:00
Informed consent was obtained from the students and their parents. The study was conducted in accordance with the Declaration of Helsinki, and the protocol was approved by the “Ettore Majorana” Public School Board. This study followed the Transparent Reporting of Evaluations with Non-randomized Design guidelines.
Measures
Pittsburgh Sleep Quality Index
An Italian version of the Pittsburgh Sleep Quality Index (PSQI) was given to the participants. This instrument is a reliable, valid, and standardized self-rating scale designed to assess sleep quality from the previous month22. The questionnaire shows high internal consistency (Cronbach’s alpha of 0.84) and good reliability (split-half reliability of 0.85)23. PSQI comprises 19 items divided into 7 subscales rated on a 0–3 points Likert scale to evaluate the subjective quality of sleep, sleep latency, sleep duration, habitual sleep efficiency, sleep disorders, use of hypnotic drugs, and disorders during the day. A score of “0” indicates the absence of difficulty, while a score of “3” indicates the presence of serious difficulty. The sum of the scores of the seven components gives the overall score, ranging between 0 and 21, with “0” indicating the absence of difficulty and “21” indicating serious difficulties in all areas. Scores above 5 are indicative of the presence of poor sleep quality.
Epworth Sleepiness Scale
The Italian version of the Epworth Sleepiness Scale (ESS)24 asks the respondent to rate on a 4-point scale (0–3) their usual chances of dozing off or falling asleep while engaged in eight activities that differ widely in their “somnificity”. The questionnaire shows good internal consistency (Cronbach’s alpha of 0.73) and high reliability (split-half reliability of 0.89) for daytime sleepiness in adolescents25. The total ESS score (the sum of the 8-item scores) provides a rating of a person’s general and stable sleep propensity.
Owing to its psychometric characteristics, ESS was only administered at the beginning and end of the academic year. Participants were asked to rate their sleepiness level by KSS across monthly intervals for the whole academic year (ie, at every monthly evaluation).
Karolinska Sleepiness Scale
The Karolinska Sleepiness Scale (KSS)26 is a 9-point rating scale ranging from 1 to 9, corresponding, respectively, to “Very alert” and “Very sleepy, fighting sleep.” It measures the subjective feelings of alertness/drowsiness during the 5 minutes preceding its administration.
Weekly Sleep Diary
This is a tablet-adapted version of a sleep diary filled in within 30 minutes after the final morning awakening. It collected information on the following variables: lights-out, sleep latency, total sleep time (TST), total bedtime, sleep efficiency (TST/total bedtime × 100), number of awakenings, and time of awakening.
Morningness–Eveningness Questionnaire
The Italian version of the Morningness–Eveningness Questionnaire (MEQ)27 was administered to identify the circadian preference of our participants. MEQ is a 19-item test that also allows subdividing participants into six categories: definitely morning (70–86), moderately morning (59–69), intermediate morning (50–58), intermediate evening (42–49), moderately evening (31–41), and definitely evening (16–30).
Psychomotor Vigilance Task
The Psychomotor Vigilance Task (PVT) is a well-established computerized simple cued reaction time (RT) task28 that provides the most widely used metrics of sustained attention and sleep loss21. During the PVT, subjects are placed in front of a computer screen for 5 minutes and tasked to click the left mouse button every time a scrolling timer appears at irregular intervals with a random interstimulus (from 2 s to 100 s) interval. In this way, vigilance must be maintained across the entire 5-min task.
The dependent variables considered in this study are median RT, speed (1000/RT), 10% slowest RT, and 10% fastest RT.
Academic Performance
According to the procedure used in the I.I.S.S. “Ettore Majorana” in Brindisi, academic performance is currently measured two times, at the beginning and the end of the academic year, by an online test (administered via a Google Module) assessing mathematical and scientific knowledge. The entrance test includes 24 questions (20 multiple-choice, 4 open questions), and its score ranges from 0 to 28 (1 point for the multiple-choice, 2 points for the open questions). The final test is a different form that includes 41 multiple-choice questions. Hence, the final grades range from 0 to 41.
As a further measure of school attendance, the number of tardies and early leaving in the two classes (collected by the school records) were also considered.
Pre/post measures included (1) Pittsburgh Sleep Quality Index (PSQI) (2) Epworth Sleepiness Scale (ESS) (3) Morningness–Eveningness Questionnaire (MEQ) (4) two online mathematical and scientific tests (entrance and final); and (5) instances of tardiness and early leaving as indicators of school attendance. Longitudinal instruments comprised (1) a sleep diary to record daily sleep–wake patterns, (2) the Karolinska Sleepiness Scale (KSS), and (3) the Psychomotor Vigilance Task (PVT). These are common, reliable measures of sleep, alertness, and sustained attention.
Procedures
Data were collected at monthly intervals from October 2018 to May 2019. December was excluded because of the Christmas vacation. The first data collection coincided with the start of the academic year, providing the baseline measures, and it included all the considered measures. Then, some measures were longitudinally collected across the academic year in 1-month rounds (approximately around the middle of each month): (a) weekly sleep diary; (b) KSS; (c) PVT. Each monthly session was preceded by a request to fill in the electronic version of a sleep diary in the week preceding the administration of the PVT and KSS at school. KSS and PVT were administered in a fixed order. The identical procedural sequence was repeated every month. KSS provided information on sleep propensity at the time of evaluation. Differently from the ESS, which was only administered at the beginning and end of the academic year because it measures individual stable sleep propensity, participants were asked to rate their sleepiness level by KSS on the basis of how they felt during the 5 minutes preceding the administration of the PVT. The PVT was administered individually and approximately at the same hour and the same sequential order across the consecutive months. In contrast, the PSQI, ESS, MEQ, and academic performance assessment were administered only at the school year’s start and end.
Data Analysis
The pre/post measures (PSQI, ESS, MEQ, academic performance) were submitted to the mixed-design repeated measure analyses of covariance (ANCOVAs) comparing the two classes (Early Start Class [ESC] vs Late Start Class [LSC]) and Time (Pre vs Post) and considering gender as a covariate. The dependent variables were the total PSQI, ESS, and MEQ scores. Concerning the grades related to academic performance, collected at the beginning and the end of the academic year by different—although comparable—tests with different ranges, these were analyzed by separate one-way ANCOVAs comparing the classes (ESC vs LSC) and considering gender as a covariate. The online form of this evaluation was not completed at the beginning of the academic year by six students (3 in ESC, 3 in LSC), while 3 (1 in ESC, 2 in LSC) did not complete it at the end of the academic year.
The longitudinal measures were analyzed by mixed-design repeated measure Class x Month ANCOVAs comparing the two classes (ESC vs LSC) and month (November vs January vs February vs March vs April vs May). Given the basic differences in the two self-selected groups, every dependent variable was expressed as a percentage of changes between each monthly evaluation (November vs January vs February vs March vs April vs May) and the corresponding starting value at the beginning of the academic year, which was considered as a baseline measure. Gender was considered a covariate. Data were represented as mean±SEM, and the significance was p<0.05.
The data in the figures and tables include the four students with learning disabilities, as control analyses showed that the results did not substantially change when these students were excluded.
Results
Pre/Post Measures
The PSQI, ESS, and MEQ scores did not differ between the classes (eTable 1). A small but significant decrease in MEQ scores was noted at the end of the academic year. According to the conventional chronotype distribution of the MEQ, the observed decrease corresponds to a higher prevalence of intermediate-morning chronotype at the beginning of the academic year versus an intermediate-evening chronotype at the end of the academic year.
Variations in the presence of sleep disorders and diurnal sleepiness (Figure 1) show that both variables improved in the LSC at the end of the academic year. Diurnal sleepiness was significantly lower (p=0.03) in the LSC than in the ESC by the end of the academic year, although statistically insignificant differences were observed at the beginning (p=0.68).
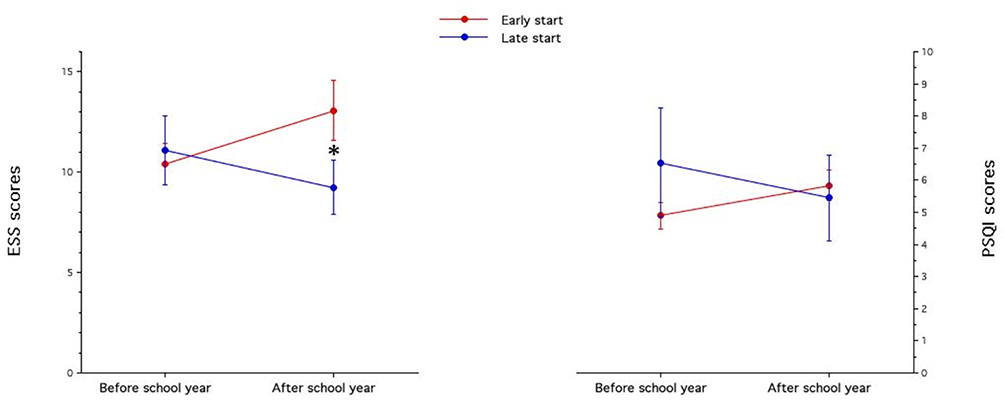 |
Figure 1 Pre-post changes in subjective sleepiness and sleep concerns across the school year. Means (and SE) of scores at the Pittsburgh sleep quality index (PSQI) and Epworth sleepiness scale (ESS) at the beginning and end of the academic year. |
Concerning academic performance (Figure 2), the scores obtained on the entrance test were significantly higher in the ESC than in the LSC (F1,41=14.61, p=0.0004, ηp2=0.26), with no statistically significant effect of the sex covariate. By contrast, scores obtained on the final test did not differ significantly between the classes (F1,46=3.05, p=0.09), with no statistically significant effect of the sex covariate (F1,46=1.35, p=0.25).
 |
Figure 2 Academic performance at the beginning and end of the academic year. Means (and SE) of grades at two forms (entrance and final tests) administered in the late and early start classes at the beginning and end of the academic year. ***p≤.001, and “NS” to indicate non-significance. |
The results did not substantially change when the four students with learning disabilities in the LSC were excluded. Again, the two classes were different at the beginning (ESC=17.1±1.07, LSC=13.9±1.18; F1,38=8.52, p=0.006, ηp2=0.18) and not significantly different at the end of the academic year (ESC=21.8±0.67, LSC=20.2±1.45; F1,43=1.30, p=0.26).
To determine which variable most affected academic performance, we performed a backward stepwise regression considering performance at the PVT (median RT), with TST and wake-up hours averaged across the academic year as predictors and academic performance as the dependent variable. This regression was significant (rmultiple=0.42, F2.46=5.03, p=0.01), with median RT at the PVT as the only variable entering the equation (Beta=−0.31, partial r=−0.32, t=−2.31, p=0.02).
Longitudinal Measure
Figure 3 shows the mean lights-off time in the two classes across the academic year. Our finding at baseline (Table 1) indicated that while sleep and sleepiness measures did not differ between classes, the ESC was characterized by significantly better performance and sustained attention than the LSC. To determine whether school timing affected the baseline measures, we considered the percentage changes of longitudinal measures across the subsequent months.
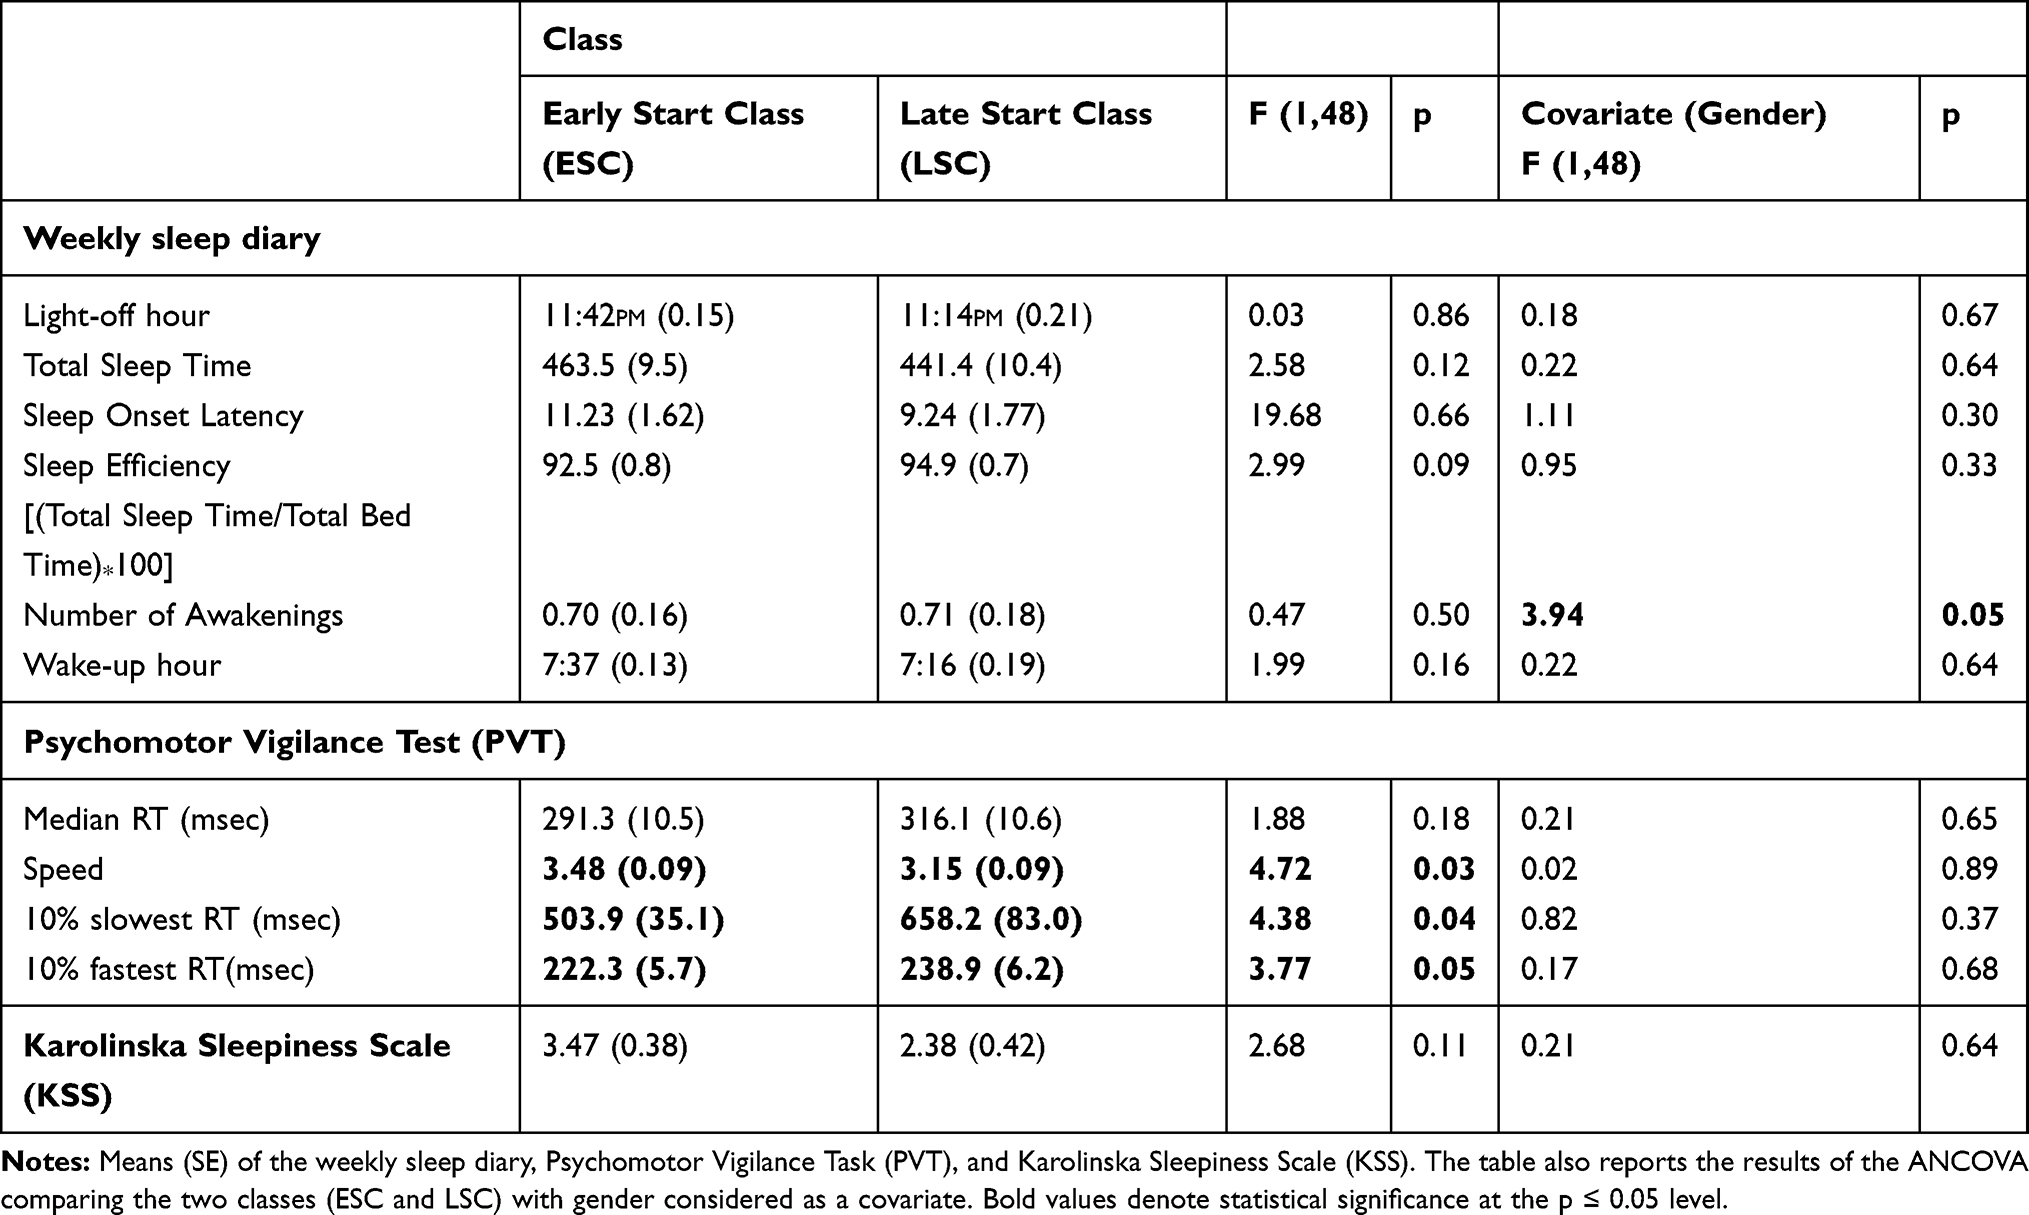 |
Table 1 Longitudinal Measures at the Baseline |
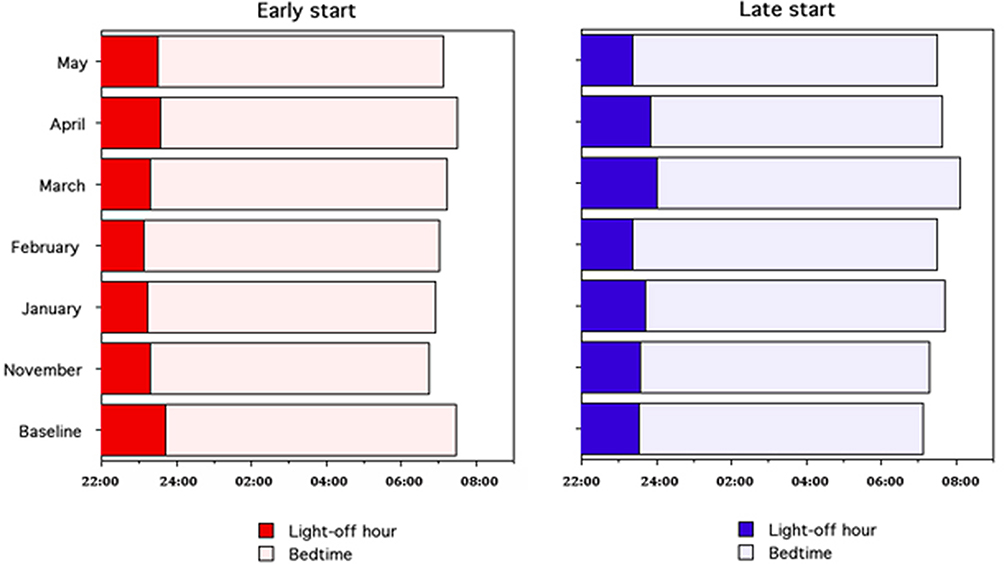 |
Figure 3 Lights-off hour and bedtime in the two classes across the academic year. Means (and SE) of lights-off hour and bedtime (and, consequently, wake-up hour) in the late and early start classes. |
The longitudinal measures indicated different trends in the two classes (Table 2). Sleep duration and wake-up times on school days were the only factors distinguishing the two groups. LSC students had delayed wake-up time and longer TST on school days. ESC had approximately the same sleep duration from the beginning to the end of the academic year (Figure 4A).
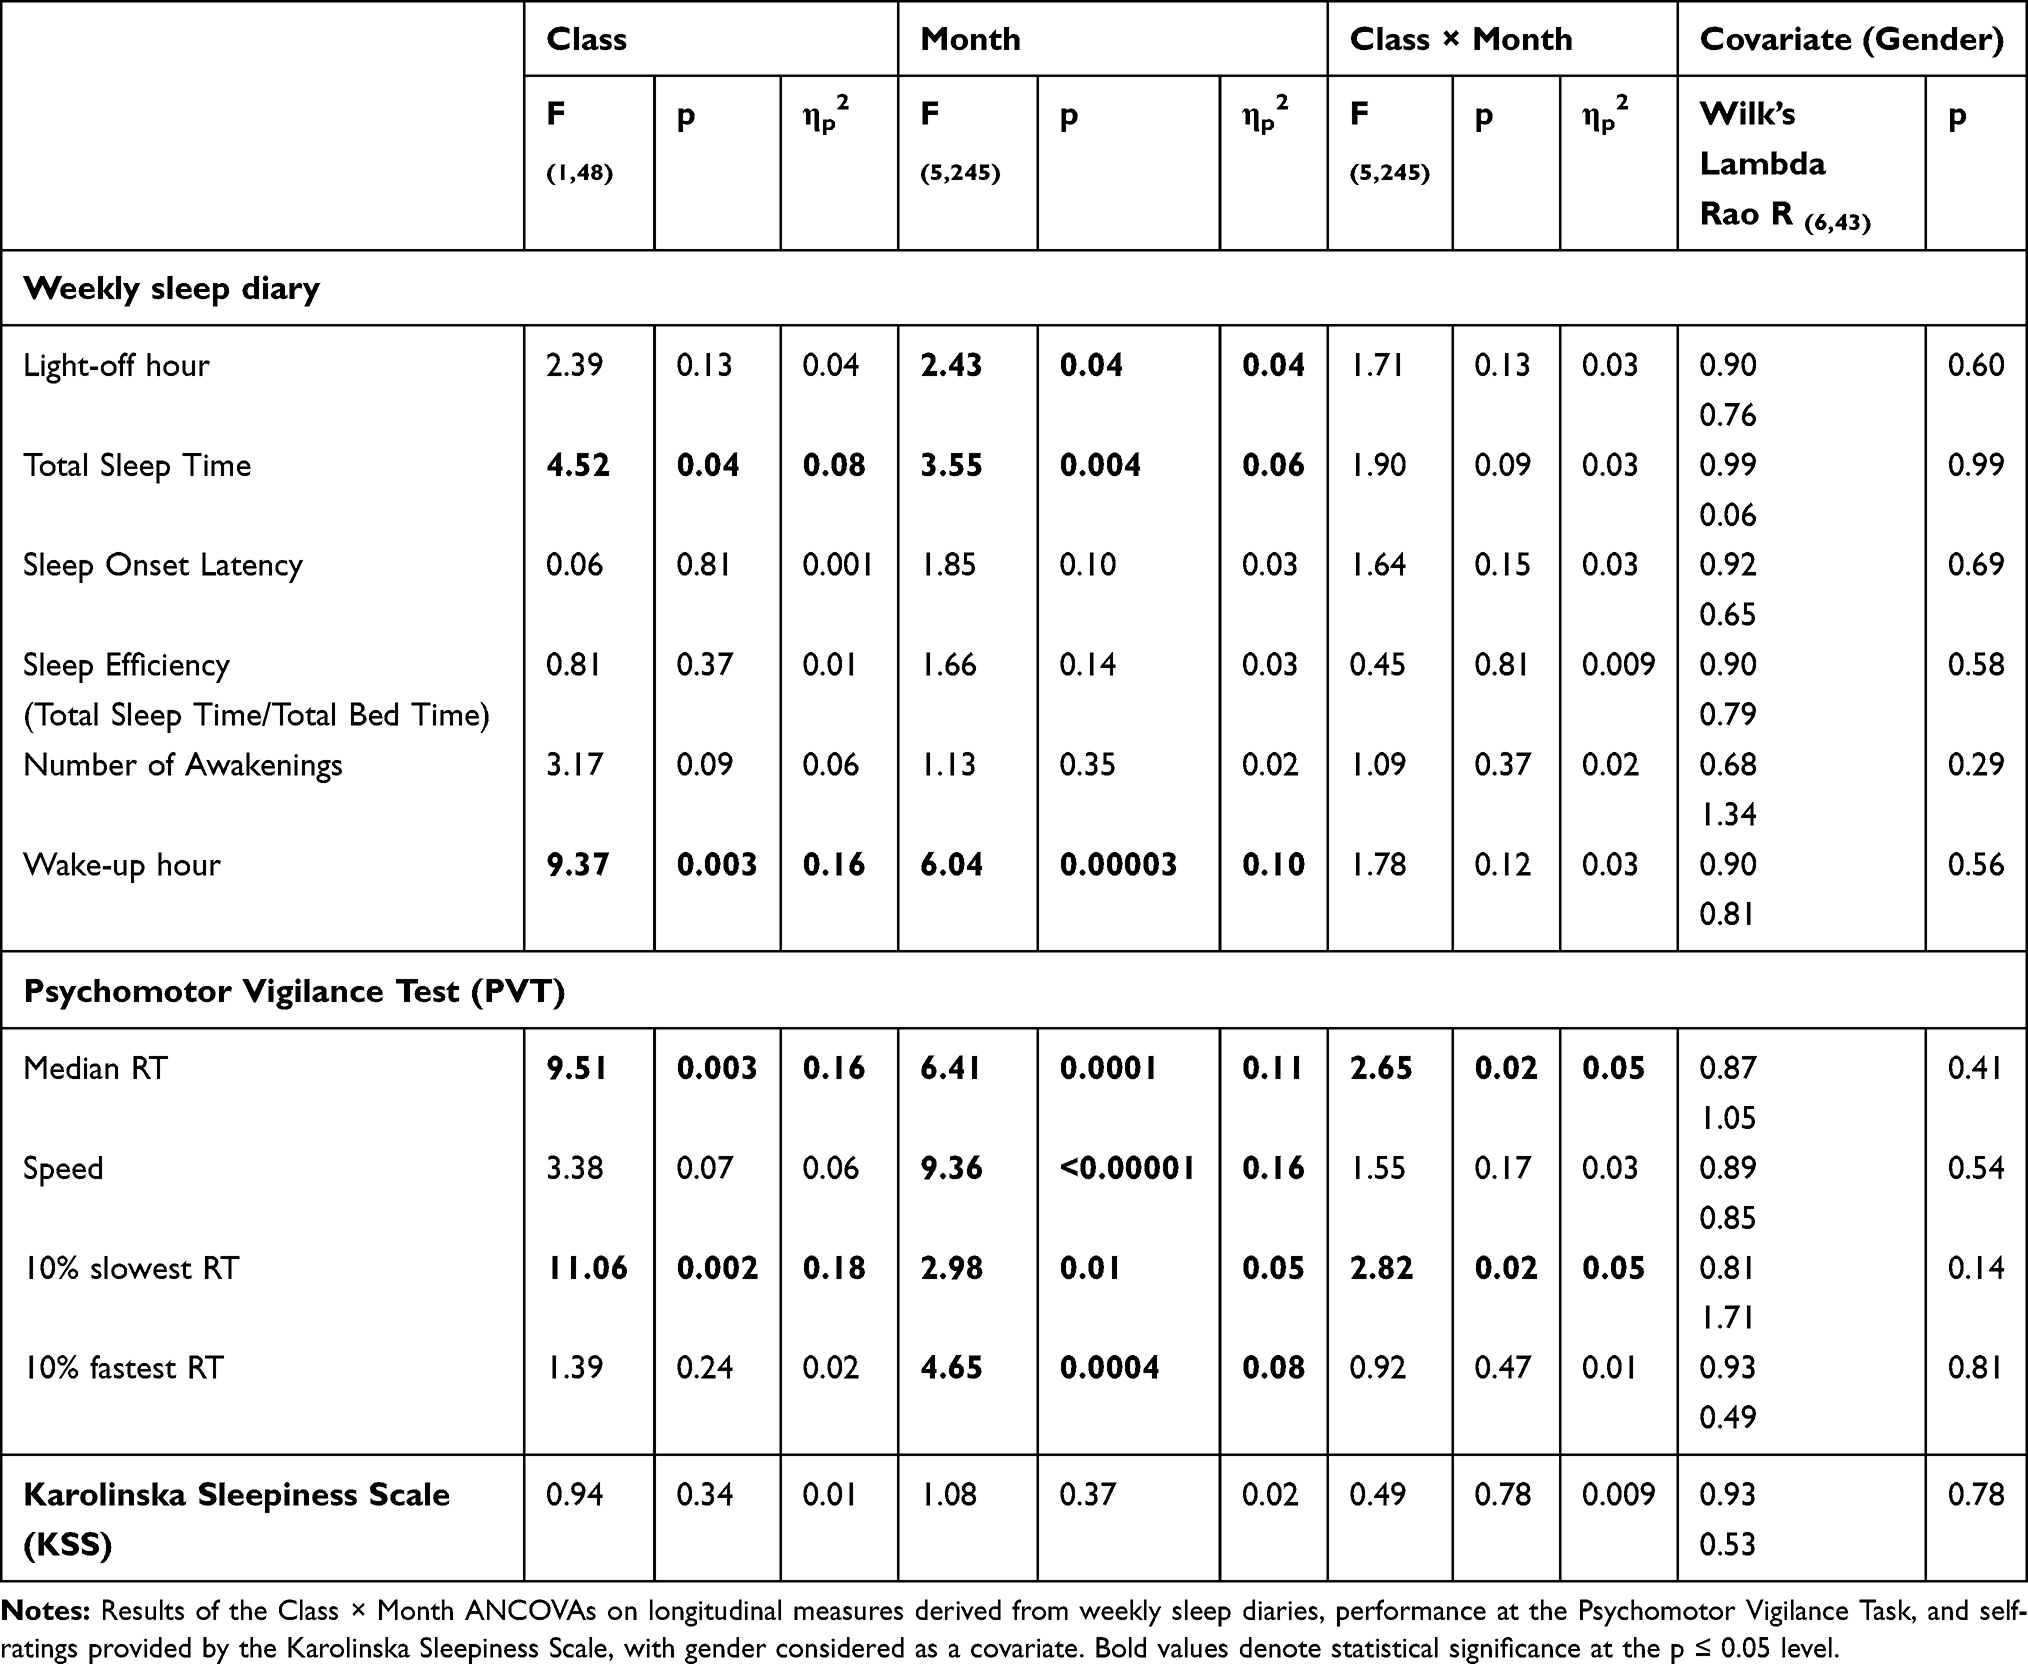 |
Table 2 Longitudinal Measures |
 |
Figure 4 Longitudinal changes in total sleep time and attentional performance across the academic year. Means (and SE) of percentage changes in total sleep time (panel (A) and measures of the Psychomotor Vigilance Task (panel (B) in the late and early start classes. *p≤.05, ***p≤.001. |
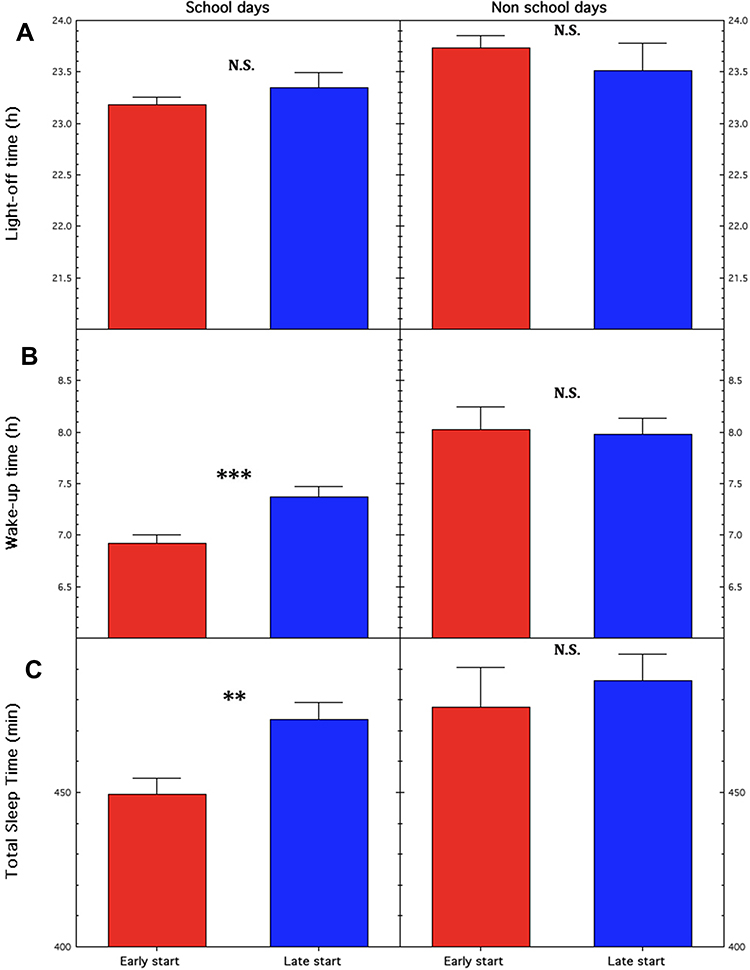 |
Figure 5 Lights-off hour, wake-up hour, and total sleep time as a function of school and non-school days. Means (and SE) of (A) lights-off hour, (B) wake-up hour, (C) total sleep time in the late and early start classes plotted as a function of school and non-school days. ***p≤.001, **p≤.01, and “NS” to indicate non-significance. |
Although the students switched their lights off at similar times (LSC 11:21
On average, LSC TST increased by 8.9%±0.03, corresponding to an additional 34.1±11.9 minutes of sleep across the academic year. By contrast, ESC TST decreased by 0.01%±0.03, corresponding to 11.4±13.3 minutes of sleep and indicating a constant sleep time in the same period (Figure 4A). Longer sleep was also associated more with wake-up time (rho=0.43, z=3.06, p=0.002) than with lights-off time (rho=−0.32; z=−2.26, p=0.02).
In contrast to school days, the two classes show no differences on non-school days (Figure 5): all students turned their lights off (LSC=11:31
These data indicated that students used the extra time to sleep in, and their early-morning social obligations forced them to truncate their sleep.
We found significant seasonal effects regarding lights-off hours, TST, and wake-up hours (Table 2). These effects were primarily explained by a phase delay in lights-off and wake-up times in February, March, and April and associated with longer sleep duration in February and March (p<0.05 by post hoc tests). Self-ratings of sleep showed no significant difference for the other variables measured through the weekly sleep diary.
This sleep changes pattern paralleled behavioral indices of diurnal vigilance measured by PVT (median reaction time [RT] and 10% slowest RT reported in Table 2 and Figure 4B). ANCOVA revealed a significant difference in LSC compared to ESC toward better performance across the following months, indicating that the adolescents adapted eventually to the delayed schedule. The Class × Month interaction was significant, indicating a seasonal effect on the ESC related to diminished vigilant attentional performance in winter. There were significant differences between classes in the interaction of median RT and 10% slowest RT, which were limited to the period between November and March. Although the general trend was similar for speed and 10% fastest RT, the significant effect of Month was due to the decreased performance in winter.
Another consequence of the later school start was a decrease in tardiness and early leaving across the academic year, as indicated in school reports. Beyond the significant seasonal winter peak, these variables collected from school records (eTable 2) exhibited a significant Class × Month interaction (eFigure 1), with LSC demonstrating significantly less frequent tardiness than ESC in February (p=0.003) and May (p=0.04) and less frequent early leaving in October (p=0.02), February (p=0.02), and March (p=0.01).
The longitudinal changes in PVT and the attendance data mirrored the pattern of sleep duration changes, suggesting a relationship between longer sleep and better academic performance in LSC. These changes were modulated by seasonality, with larger between-group differences in the winter months. By contrast, self-ratings of sleepiness, as provided by the KSS, did not differ significantly between groups (Table 2).
Discussion
This field study of a later school start pilot project involved students who self-selected into 8:00
Longitudinal Measures
One relevant aspect of the parallel trends found in the PVT and the weekly diary was that the later start time affected these measures differently. LSC students steadily increased their TST across the academic year, while ESC students approximately maintained their baseline. The self-rated amount of sleep for both classes before starting the academic year did not reach 8 hours,7 the minimum recommended for their age group. The later school start partially closed this sleep gap. The trend in psychomotor vigilance changes also suggested the supportive role of the later school start on sustained attention. Notably, ESC students’ performance declined in most months, whereas LSC students maintained their performance levels across the academic year.
These results were associated with a longer TST in the LSC, with sleep offsets delayed but onsets unchanged. Students with an early sleep onset at 8:00
One possible interpretation of these trends in the amount of sleep and attentional performance is that more sleep stabilizes sustained attention. The diurnal level of vigilance may affect knowledge acquisition, information retrieval, and learning during school days. What is learned during the day is also consolidated during sleep, so insufficient sleep and widespread sleep deprivation may undermine academic performance in adolescence.29
Alternatively, differences in baseline measures may explain these trends. We collected sleep self-ratings from before the academic year and behavioral measures at the beginning of the academic year (after the students had chosen the 9:00
Behavioral and sleep data show large seasonal changes. The general pattern includes a winter peak of longer sleep and decreased performance. Reports consistently associate winter months with longer sleep30–37 and more sleep concerns.38 An online survey of 2003 adults commissioned by the AASM showed that one-third (34%) of the respondents slept “more than usual” during the winter.
On average, sleep duration is nearly 1 hour longer in the winter than in the summer.36 The human circadian clock is sensitive to seasonal changes in the natural light–dark cycle, which is reflected as an expansion of the biological night in winter. Modern lighting conditions do not entirely replicate living in the natural summer photoperiod.35
Independent of school start times, our students slept nearly 20 minutes longer in the winter than in other seasons. We hypothesize that this lengthening does not completely compensate for the seasonal biological need, and this lack may cause a parallel decline in attentional performance in winter. Consistent with this hypothesis, a similar winter peak in tardiness was observed. Therefore, seasonal changes in sleep may have offset potential positive effects. These winter trends in sleep and performance strengthen the case that more sleep has complex effects on attentional performance and that other factors must also be considered.
Pre/Post Measures
Consistent with the longer TST during the academic year, LSC students exhibited lower diurnal sleepiness than ESC students, as measured by the ESS, and fewer sleep disorders, as indicated by their PSQI scores. Although the effects were small, these results suggest that the later school start had a health-promoting impact, at least on daytime sleepiness and sleep disorders.
Academic performance appeared to be affected positively by the 9:00
This finding should be considered with caution because of the small proportion of variance it explained. However, our regression analysis suggests that attentional performance plays a greater role than the amount of sleep and the wake-up time in predicting grades at the end of the academic year.
Strengths and Limitations
Both the nature of field studies and our relatively small sample size necessarily limit our results. First, the self-selection of participants in inclusive classrooms introduced common biases based on sample size, gender, learning disabilities, level of psychomotor performance, and academic performance. We adjusted our analyses for self-selection bias by considering gender a covariate, excluding students with learning disabilities, and using percentage changes as dependent behavioral performance measures. Importantly, the two classes showed no statistical difference in sleep measures at the baseline; the 8:00
Conclusions
Our findings indicate that delaying school start time to align with the natural wake-up rhythm of adolescents improves wake-up time, sleep duration, attentional performance, and academic success while decreasing absences and drop-outs, as reported by the teaching staff. Sleep deprivation degraded objective attentional performance measures in students who opted to start classes at 8:00
Future studies on larger samples of students are certainly necessary to check the robustness of these results, and follow-up studies are strongly recommended to test the long-term effectiveness of the intervention.
Lastly, despite the well-documented benefits of delaying school start times, future research will have to consider the unresolved economic and logistic problems inherent in this kind of intervention.9
Acknowledgments
Thanks to all the students and the teaching staff who participated in the project.
Author Contributions
All authors made a significant contribution to the work reported, whether that is in the conception, study design, execution, acquisition of data, analysis and interpretation, or in all these areas; took part in drafting, revising or critically reviewing the article; gave final approval of the version to be published; have agreed on the journal to which the article has been submitted; and agree to be accountable for all aspects of the work.
Disclosure
The authors report no conflicts of interest in this work.
References
1. Wright KP
2. Jenni OG, Achermann P, Carskadon MA. Homeostatic sleep regulation in adolescents. Sleep. 2005;28(11):1446–1454. doi:10.1093/sleep/28.11.1446
3. Taylor DJ, Jenni OG, Acebo C, Carskadon MA. Sleep tendency during extended wakefulness: insights into adolescent sleep regulation and behavior. J Sleep Res. 2005;14(3):239–244. doi:10.1111/j.1365-2869.2005.00467.x
4. Carskadon MA. Sleep in Children: Developmental Changes in Sleep Patterns. C L Marcus, Ed. Informa Healthcare; 2008.
5. Colrain IM, Baker FC. Changes in sleep as a function of adolescent development. Neuropsychol Rev. 2011;21(1):5–21.
6. Carter B, Rees P, Hale L, Bhattacharjee D, Paradkar MS. Association between portable screen-based media device access or use and sleep outcomes: a systematic review and meta-analysis. JAMA Pediatr. 2016;170(12):1202–1208. doi:10.1001/jamapediatrics.2016.2341
7. Paruthi S, Brooks LJ, D’Ambrosio C, et al. Recommended amount of sleep for pediatric populations: a consensus statement of the american academy of sleep medicine. J Clin Sleep Med. 2016;12(6):785–786. doi:10.5664/jcsm.5866
8. Shochat T, Cohen-Zion M, Tzischinsky O. Functional consequences of inadequate sleep in adolescents: a systematic review. Sleep Med Rev. 2014;18(1):75–87. doi:10.1016/j.smrv.2013.03.005
9. Alfonsi V, Scarpelli S, D’Atri A, Stella G, De Gennaro L. Later school start time: the impact of sleep on academic performance and health in the adolescent population. Int J Environ Res Public Health. 2020;17(7):2574. doi:10.3390/ijerph17072574
10. Louzada F. Adolescent sleep: a major public health issue. Sleep Sci. 2019;12(1):1. doi:10.5935/1984-0063.20190047
11. Carskadon MA. Sleep in adolescents: the perfect storm. Pediatr Clin North Am. 2011;58(3):637–647. doi:10.1016/j.pcl.2011.03.003
12. Adolescent Sleep Working G, Committee on A, Council on School H. School start times for adolescents. Pediatrics. 2014;134(3):642–649. doi:10.1542/peds.2014-1697
13. Minges KE, Redeker NS. Delayed school start times and adolescent sleep: a systematic review of the experimental evidence. Sleep Med Rev. 2016;28:86–95. doi:10.1016/j.smrv.2015.06.002
14. Marx R, Tanner-Smith EE, Davison CM, et al. Later school start times for supporting the education, health, and well-being of high school students. Cochrane Database Syst Rev. 2017;7:CD009467.
15. Dunster GP, de la Iglesia L, Ben-Hamo M, et al. Sleepmore in Seattle: later school start times are associated with more sleep and better performance in high school students. Sci Adv. 2018;4(12):eaau6200. doi:10.1126/sciadv.aau6200
16. Lo JC, Lee SM, Lee XK, et al. Sustained benefits of delaying school start time on adolescent sleep and well-being. Sleep. 2018;41(6).
17. Storey KE. Later school start times for supporting the education, health, and well-being of high school students. Paediatr Child Health. 2020;25(3):139–142. doi:10.1093/pch/pxz055
18. Hudson AN, Van Dongen HPA, Honn KA. Sleep deprivation, vigilant attention, and brain function: a review. Neuropsychopharmacology. 2020;45(1):21–30. doi:10.1038/s41386-019-0432-6
19. Rasch B, Born J. About sleep’s role in memory. Physiol Rev. 2013;93(2):681–766.
20. Louca M, Short MA. The effect of one night’s sleep deprivation on adolescent neurobehavioral performance. Sleep. 2014;37(11):1799–1807. doi:10.5665/sleep.4174
21. Lim J, Dinges DF. Sleep deprivation and vigilant attention. Ann N Y Acad Sci. 2008;1129(1):305–322. doi:10.1196/annals.1417.002
22. Curcio G, Tempesta D, Scarlata S, et al. Validity of the Italian version of the Pittsburgh sleep quality index (PSQI). Neurol Sci. 2013;34(4):511–519. doi:10.1007/s10072-012-1085-y
23. Buysse DJ, Reynolds CF
24. Vignatelli L, Plazzi G, Barbato A, et al. Italian version of the Epworth sleepiness scale: external validity. Neurol Sci. 2003;23(6):295–300. doi:10.1007/s100720300004
25. Janssen KC, Phillipson S, O’Connor J, Johns MW. Validation of the Epworth sleepiness scale for children and adolescents using rasch analysis. Sleep Med. 2017;33:30–35. doi:10.1016/j.sleep.2017.01.014
26. Kaida K, Takahashi M, Akerstedt T, et al. Validation of the Karolinska sleepiness scale against performance and EEG variables. Clin Neurophysiol. 2006;117(7):1574–1581. doi:10.1016/j.clinph.2006.03.011
27. Mecacci L, Zani A. Morningness–eveningness preferences and sleep-waking diary data of morning and evening types in student and worker samples. Ergonomics. 1983;26(12):1147–1153. doi:10.1080/00140138308963450
28. Dinges DF, Powell JW. Microcomputer analyses of performance on a portable, simple visual RT task during sustained operations. Behav Res Methods Instrum Comput. 1985;17(6):652–655. doi:10.3758/BF03200977
29. Owens J, Adolescent Sleep Working G, Committee on A. Insufficient sleep in adolescents and young adults: an update on causes and consequences. Pediatrics. 2014;134(3):e921–932. doi:10.1542/peds.2014-1696
30. Scarlett S, Nolan H, Kenny RA, O’Connell MD. Objective sleep duration in older adults: results from the Irish longitudinal study on ageing. J Am Geriatr Soc. 2020;68(1):120–128. doi:10.1111/jgs.16177
31. van Egmond L, Ekman M, Benedict C. Bed and rise times during the age of enlightenment: a case report. J Sleep Res. 2019;28(6):e12862. doi:10.1111/jsr.12862
32. Cepeda M, Koolhaas CM, van Rooij FJA, et al. Seasonality of physical activity, sedentary behavior, and sleep in a middle-aged and elderly population: the Rotterdam study. Maturitas. 2018;110:41–50. doi:10.1016/j.maturitas.2018.01.016
33. Putilov AA. A cross-sectional study of retrospectively reported seasonality in native and non-native residents of Chukotka and Turkmenistan. Int J Occup Environ Health. 2018;24(1–2):17–26. doi:10.1080/10773525.2018.1500804
34. Hashizaki M, Nakajima H, Shiga T, Tsutsumi M, Kume K. A longitudinal large-scale objective sleep data analysis revealed a seasonal sleep variation in the Japanese population. Chronobiol Int. 2018;35(7):933–945. doi:10.1080/07420528.2018.1443118
35. Stothard ER, McHill AW, Depner CM, et al. Circadian entrainment to the natural light-dark cycle across seasons and the weekend. Curr Biol. 2017;27(4):508–513. doi:10.1016/j.cub.2016.12.041
36. Yetish G, Kaplan H, Gurven M, et al. Natural sleep and its seasonal variations in three pre-industrial societies. Curr Biol. 2015;25(21):2862–2868. doi:10.1016/j.cub.2015.09.046
37. Allebrandt KV, Teder-Laving M, Kantermann T, et al. Chronotype and sleep duration: the influence of season of assessment. Chronobiol Int. 2014;31(5):731–740. doi:10.3109/07420528.2014.901347
38. Lukmanji A, Williams JVA, Bulloch AGM, Patten SB. Seasonal variation in specific depressive symptoms: a population based study. J Affect Disord. 2020;261:153–159. doi:10.1016/j.jad.2019.10.003
 © 2020 The Author(s). This work is published and licensed by Dove Medical Press Limited. The
full terms of this license are available at https://www.dovepress.com/terms
and incorporate the Creative Commons Attribution
- Non Commercial (unported, 3.0) License.
By accessing the work you hereby accept the Terms. Non-commercial uses of the work are permitted
without any further permission from Dove Medical Press Limited, provided the work is properly
attributed. For permission for commercial use of this work, please see paragraphs 4.2 and 5 of our Terms.
© 2020 The Author(s). This work is published and licensed by Dove Medical Press Limited. The
full terms of this license are available at https://www.dovepress.com/terms
and incorporate the Creative Commons Attribution
- Non Commercial (unported, 3.0) License.
By accessing the work you hereby accept the Terms. Non-commercial uses of the work are permitted
without any further permission from Dove Medical Press Limited, provided the work is properly
attributed. For permission for commercial use of this work, please see paragraphs 4.2 and 5 of our Terms.