")
Back to Journals » Diabetes, Metabolic Syndrome and Obesity » Volume 12
The Association Between Normal BMI With Central Adiposity And Proinflammatory Potential Immunoglobulin G N-Glycosylation
Authors Liu D, Li Q, Dong J, Li D, Xu X, Xing W, Zhang X, Cao W, Hou H , Wang H, Song M , Tao L, Kang X, Meng Q, Wang W , Guo X, Wang Y
Received 19 May 2019
Accepted for publication 16 October 2019
Published 14 November 2019 Volume 2019:12 Pages 2373—2385
DOI https://doi.org/10.2147/DMSO.S216318
Checked for plagiarism Yes
Review by Single anonymous peer review
Peer reviewer comments 2
Editor who approved publication: Professor Ming-Hui Zou
Di Liu,1,* Qihuan Li,1,2,* Jing Dong,3 Dong Li,4 Xizhu Xu,4 Weijia Xing,4 Xiaoyu Zhang,1 Weijie Cao,1 Haifeng Hou,4 Hao Wang,1,5 Manshu Song,1 Lixin Tao,1 Xiaoping Kang,6 Qun Meng,1 Wei Wang,1,4,5 Xiuhua Guo,1 Youxin Wang1
1Beijing Key Laboratory of Clinical Epidemiology, School of Public Health, Capital Medical University, Beijing 100069, People’s Republic of China; 2Meinian Institute of Health, Beijing 100191, People’s Republic of China; 3Center for Physical Examination, Xuanwu Hospital, Capital Medical University, Beijing 100050, People’s Republic of China; 4School of Public Health, Shandong First Medical University & Shandong Academy of Medical Sciences, Taian 271016, Shandong Province, People’s Republic of China; 5School of Medical and Health Sciences, Edith Cowan University, Perth 6027, Australia; 6The Rehabilitation Center, Beijing Xiaotangshan Hospital, Beijing 102211, People’s Republic of China
*These authors contributed equally to this work
Correspondence: Youxin Wang
School of Public Health, Capital Medical University, 10 Youanmen Xitoutiao, Beijing 100069, People’s Republic of China
Tel +86 10 83911779
Email [email protected]
Xiuhua Guo
School of Public Health, Capital Medical University, 10 Youanmen Xitoutiao, Beijing 100069, People’s Republic of China
Tel +86 10 83911504
Email [email protected]
Background: The mechanism by which normal body mass index (BMI) with central adiposity (NWCA) increases the risk of the diseases has not been completely elucidated. The inflammatory role of immunoglobulin G (IgG) N-glycosylation in obesity defined by BMI or central adiposity defined by waist-to-hip ratio (WHR) was reported, respectively. We undertook this three-center cross-sectional study to determine the association between the IgG N-glycans and NWCA.
Methods: The participants were categorized into four different phenotypes: normal BMI with normal WHR (NW), normal BMI with central adiposity (NWCA), obesity with normal WHR (ONCA) and obesity with central adiposity (OCA). The IgG N-glycans were analyzed using ultra-performance liquid chromatography analysis of released glycans, and differences among groups were compared.
Results: In total, 17 out of 24 initial IgG N-glycans were significantly different among the four groups (NW, ONCA, NWCA and OCA) (P<0.05/6*78=0.0001). The changes of IgG glycans in central obesity (12 GPs) were more than those in obesity (3 GPs). In addition, lower galactosylation and bisecting GlcNAc and higher fucosylation were associated with increased risk of NWCA.
Conclusion: Central obesity was involved in more changes of IgG N-glycosylation representing stronger inflammation than obesity, which might make a greater contribution to the risk of related disorders. NWCA was associated with an increased pro-inflammatory of IgG N-glycosylation, which was accompanied by the development of central obesity and other related disorders.
Keywords: body mass index, BMI, waist-to-hip ratio, WHR, normal BMI with central adiposity, immunoglobulin G, N-glycosylation, N-glycan
Introduction
Obesity, especially central adiposity, is a growing public health problem.1,2 Obesity defined by body mass index (BMI) or central adiposity such as measuring by waist circumference and waist-to-hip ratio (WHR) is one of the most important risk factors of the majority of chronic non-communicable diseases, including metabolic syndrome, cardiovascular disease and cancers.3,4 In addition, a multicohort study has shown that overweight participants lost 1 disease-free year, the mild obesity 3 to 4 years and the severe obesity 7 to 8 years compared with normal BMI participants.5
However, the BMI does not consider body fat distribution, which is an important limitation since there are suggestions that the metabolic complications of central adiposity are more closely related to visceral adiposity than overall adiposity.6 WHR is a good parameter of abdominal fat accumulation, reflecting central adiposity more than BMI.7–9 The increasing evidences show that central adiposity makes a greater contribution to the risk of suffering insulin resistance, type 2 diabetes, metabolic syndrome and cardiovascular diseases than general obesity.8–11 In addition, a recent study showed that normal BMI with central adiposity (NWCA), which is defined as normal BMI but abdominal fat accumulation, is also associated with increased mortality risk of total and cardiovascular disease.8 However, the mechanism by which NWCA increases the risk of these diseases has not been completely elucidated.
N-glycosylation, as the most common and essential post-translational modification of human proteins, is closer to biological function.12 N-glycosylation significantly affects protein structure and function, and thus participates in multiple physiology and pathologic process.12 Changes in immunoglobulin G (IgG) N-glycosylation patterns have been associated with the incidence and development of aging, chronic non-communicable diseases and inflammatory diseases.13,14 IgG plays an important role in the human immune system, and N-glycans attach to the conserved asparagine 297 in the fragment crystallizable (Fc) part of this molecule and act as a switch between pro- and anti-inflammatory IgG functionality, and even slight aberrant IgG N-glycosylation can promote inflammation.15
Obesity and central adiposity are characterized by a pro-inflammatory state and elevated levels of inflammatory markers, such as C-reactive protein and interleukin-6, that have been associated with risk of developing obesity and central obesity.16,17 The inflammatory role of IgG N-glycosylation in obesity defined by BMI and central adiposity defined by WHR were, respectively, reported in European and Australian populations.18,19 However, IgG N-glycosylation patterns in NWCA remain unknown. We hypothesized that the changes in IgG N-glycan profiles are involved in the pathogenesis of NWCA by regulating the inflammatory response. In the present study, we aimed to determine the association between the IgG N-glycans and NWCA in the multi-center cross-sectional study, and to further investigate the potential role of IgG N-glycosylation in NWCA.
Materials And Methods
Ethical Approval
Written informed consent was obtained from each subject at the beginning of the study, and the study has been approved by the Ethics Committee of the Capital Medical University, Beijing, China. The ethics approval was given in compliance with the Declaration of Helsinki.
Participants
All participants were recruited from our three cohort studies, including Xicheng community-based cohort in the Xuanwu hospital (from September 2009 to September 2012 of the baseline population), China suboptimal health cohort study in the Jidong Oil-field hospital (from September 2013 to September 2014 of the baseline population) and Beijing health management cohort in the Beijing Xiaotangshan hospital (from August 2014 to October 2015 of the follow-up population).20–22 The inclusion and exclusion criteria of the study population were as follows: inclusion criteria: (1) signed informed consent prior to participation, (2) age equal to or greater than 18 years and (3) no medication history during the previous 2 weeks; exclusion criteria: (1) underweight participants, (2) pregnant or lactating women, (3) history of mental illness or infectious disease and (4) history of stroke or other cerebrovascular diseases, congenital heart disease, liver disease, renal failure, malignant tumor, chronic obstructive pulmonary disease, rheumatoid arthritis or other diseases. Of note, the participants in the previous study who were recruited from the Tiantan Hospital were eliminated because they were diagnosed with ischemic stroke.22 The flowchart for the process of including study population is illustrated in Figure 1.
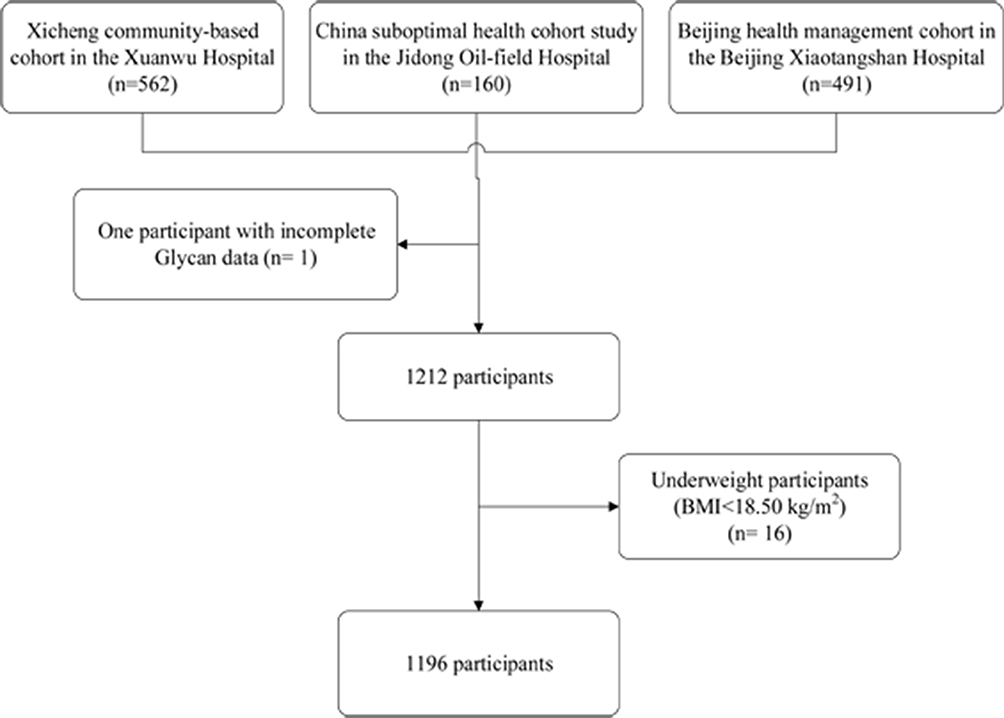 |
Figure 1 The flow chart of study populations. |
Diagnosis Of Obesity And Central Adiposity
The body mass index (BMI) was calculated by the formula weight (in kilograms)/height2 (in meters squared), which was categorized as normal weight (BMI of 18.50 to 23.99 kg/m2), overweight (BMI of 24.00 to 27.99 kg/m2) and obesity (BMI≥28.00 kg/m2).23 Underweight participants (BMI<18.50 kg/m2) were excluded to avoid reverse causation. The waist-to-hip ratio (WHR) was calculated as waist circumference (in centimeter)/height (in centimeter). Central adiposity was defined using WHR of 0.85 or higher in women and 0.90 or higher in men.24 The participants were divided into four different obesity and central adiposity groups for normal BMI with normal WHR (NW), normal BMI with central adiposity (NWCA), obesity with normal WHR (ONCA) and obesity with central adiposity (OCA).
Covariates
Each participant was required to complete a thorough health examination, which included anthropometric measurements and an analysis of the physical and chemical properties of a blood sample. Blood samples were collected from participants in the morning and plasma samples were separated in the hospital laboratory after centrifugation at 3000 rpm for 10 mins. Detailed information about demographic characteristics and blood sample collection were previously described.20,22
The participants were then classified into the hypertension group [mean systolic blood pressure (SBP) ≥140 mmHg or mean diastolic blood pressure (DBP) ≥90 mmHg] or the normal blood pressure group (mean SBP <120 mmHg and mean DBP <80 mmHg).25 Diagnosis of type 2 diabetes was made by physicians according to the 1999 WHO Criteria [Fasting plasma glucose (FPG) greater than or equal to 7.0 mmol/L].26 According to the guideline for the prevention and control of dyslipidemia of adults in China, the participants were grouped into dyslipidemia with total cholesterol (TC) ≥6.2 mmol/L, or triglycerides (TG) ≥2.3 mmol/L, or high-density lipoprotein cholesterol (HDLC) <1.0 mmol/L, or low-density lipoprotein cholesterol (LDLC) ≥4.1 mmol/L.20
IgG N-Glycans Analysis
IgG N-glycans were detected by the method of hydrophilic interaction chromatography (HILIC)-ultra-performance liquid chromatography (UPLC), which was reported in the previous study.27 In brief, IgG was isolated using protein G monolithic plates, and then IgG N-glycans were released, labelled and purified, and finally IgG N-glycans were analyzed by 24 initial glycan peaks (GPs). An additional 54 derived traits were calculated by the remaining 24 directly measured glycans, which were described in the published papers.27
Statistical Analysis
Continuous variables underlying normal distribution were represented as the mean± standard deviation (SD); otherwise, medians (P25- P75) were used. The differences of continuous variables among the groups were tested by one-way ANOVA or the Kruskal–Wallis tests. Categorical variables were represented as n (proportion), and the differences among the groups were tested by chi-square tests. The association between the two variables was performed using Pearson or Spearmen’s rank correlation. The description of IgG glycans was based on non-parametric methods because deviations from normal distribution were observed. The Holm method was applied to correct the multiple comparisons.
Analyses of associations between disease status and glycan traits were performed using a logistic regression model with age, sex, diabetes, hypertension and dyslipidemia included as additional covariates. Prior to correlation and regression analysis, the z-score of normalized transformations for IgG N-glycans was applied to add the consistent comparability among IgG N-glycans.
To explore the association of FPG, SBP, DBP, TC, TG, HDLC and LDLC on IgG N-glycans in the NWCA group, canonical correlation analysis (CCA) was performed, which determined the linear combination of variables derived from two sets of the glycan structures (x) and the indicators including FBG, SBP, DBP, TC, TG, HDLC and LDLC (y). The identified variables with statistically significant impact on the canonical variables were judged by the canonical loadings. Generally, the absolute values greater than 0.30 are used to define significant loadings.
Clustering analysis was performed on the difference between IgG N-glycans in participants with NWCA to identify the subgroups with the similarity in patterns of glycan changes with the “clustergram” function (Matlab, Mathworks USA) with “average linkage” option and “correlation” distance both for rows (corresponding to each glycans) and columns (average levels of glycans for each group) defined as one Pearson’s correlation coefficient.
In addition, we combined the present study and the European and West Australian study to explore the association of IgG N-glycans with BMI and WHR; the result was to be expressed as correlation coefficient with 95% CI and was analyzed using by the R package “metacor”.
Data analysis was performed using SPSS Statistics version 24.0 for Windows (IBM Corp., Armonk, NY, USA), R 3.2.4 and SAS software version 9.4 (SAS Institute, Chicago, IL, USA). All reported P values were two-sided, and P< 0.05 was considered statistically significant.
Results
Participant Characteristics
Finally, 1196 participants who had a complete dataset of blood measurements and IgG N-glycan traits were included in the further analysis. The basic characteristics of all participants in four different obesity and central adiposity groups (Table 1) were described. The detailed information of the three studies is shown in the supplemental content (Table S1). In total, 9 clinical traits were significantly different among the four groups (P<0.05/6). Of note, the median (P25–P75) of age in the NWCA subjects was 55 (49–63) years, which was higher than that in the other three groups. The proportion of males (77.75%) in the NWCA group was higher than females (22.25%). The prevalence of hypertension in the ONCA group was higher than it in the NWCA group, whereas higher prevalence of diabetes was found in the NWCA group (P<0.017). As shown in Figure S1, more than half of 1196 participants were classified as having obesity and central adiposity. The prevalence of NWCA was 36% with 95% CI (33–38%).
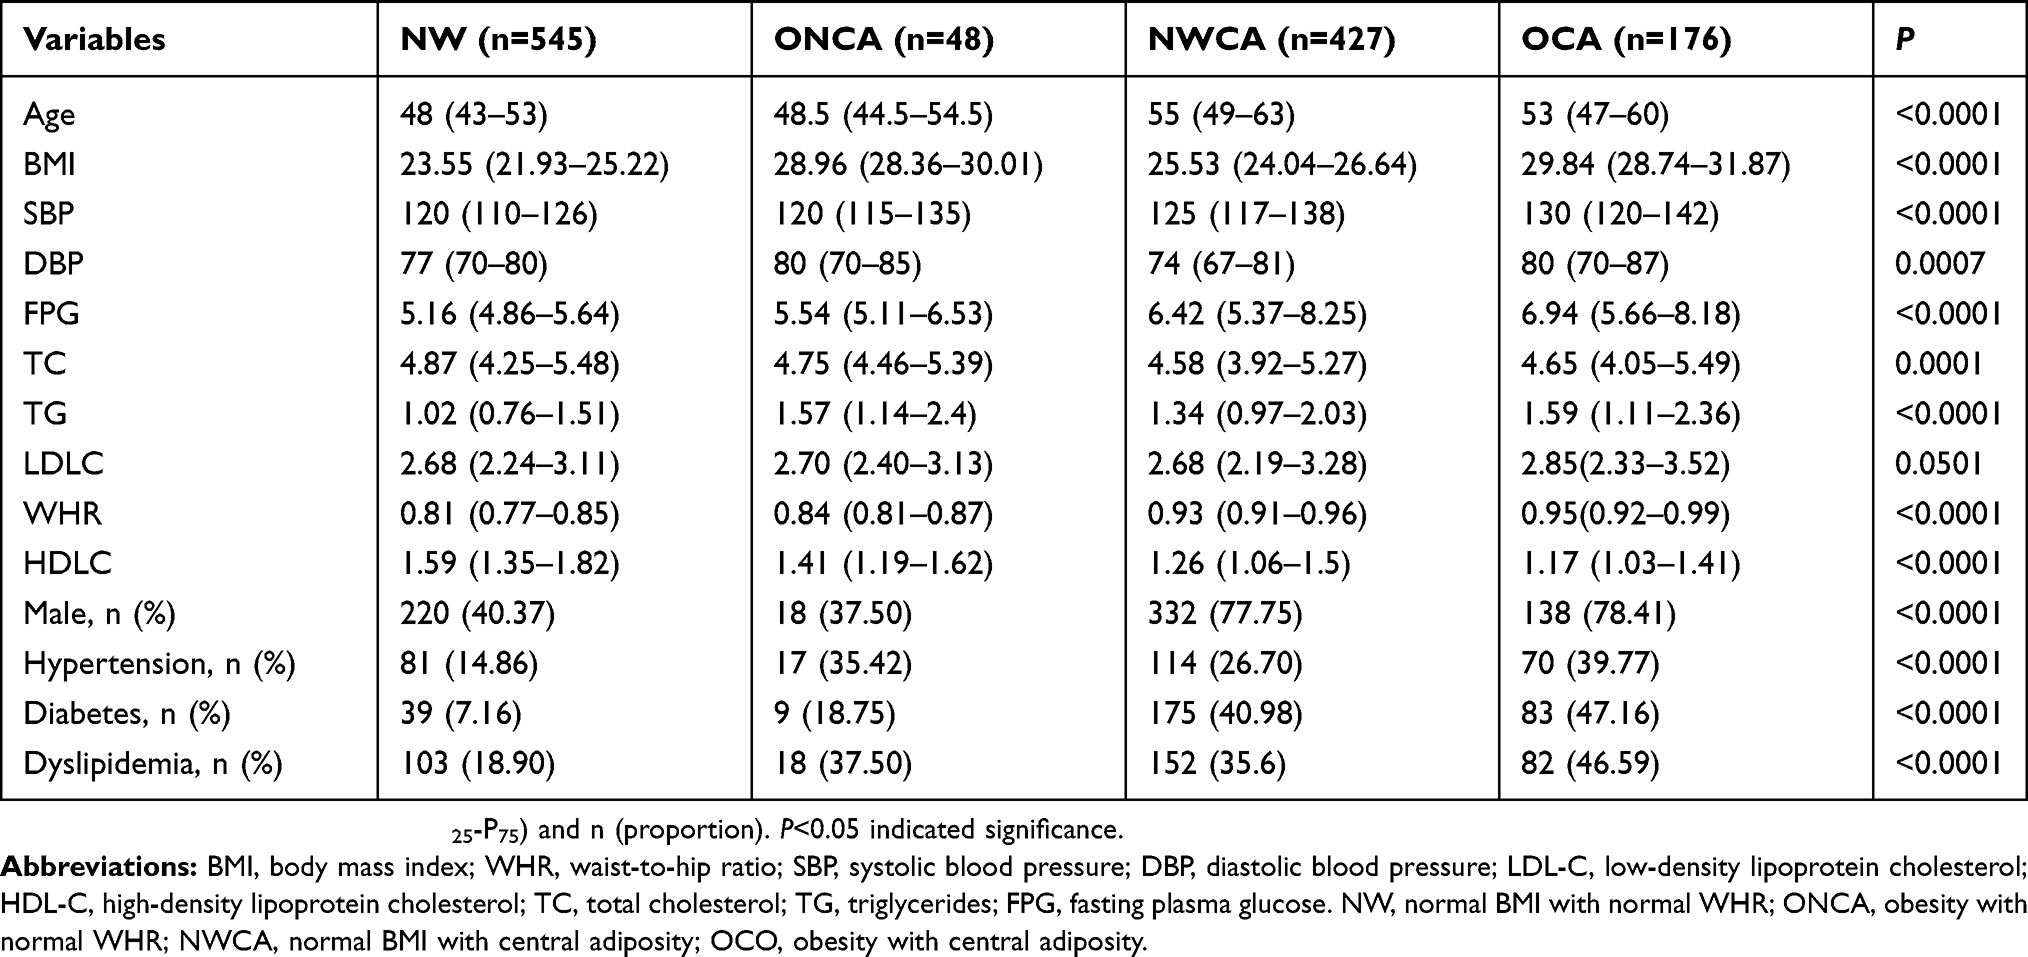 |
Table 1 Characteristics Of Participants In Different Four Different Obesity And Central Adiposity Groups |
Associations Of IgG N-Glycans With NWCA, ONCA And OCA
We performed the associations of IgG N-glycans with obesity and central adiposity patients taking into consideration adjusting for the effects of gender, age, diabetes, hypertension and dyslipidemia. The association of significant normalized IgG N-glycans with central adiposity was not exactly the same as those with obesity (Figure 2). Twelve normalized IgG N-glycans (GP4, GP5, GP7, GP10, GP11, GP13, GP15, GP16, GP17, GP23 and GP24) linking to central adiposity, which was more than three normalized IgG N-glycans (GP1, GP7 and GP13) connected with obesity, delineated the most remarkable effect of glycans in the progression of central adiposity.
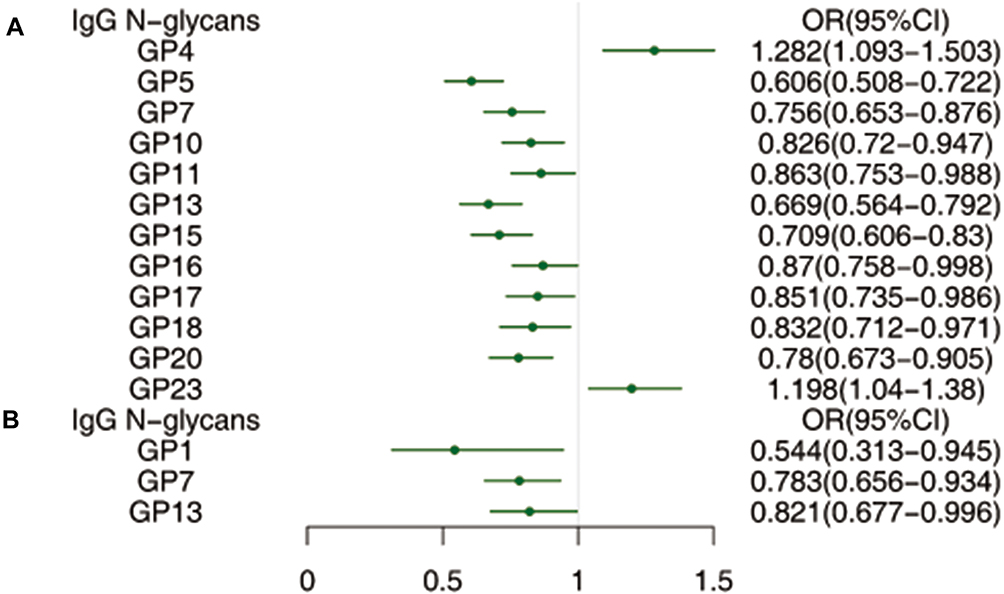 |
Figure 2 The profile of statistically significant correlations of IgG N-glycans with central adiposity (A) and obesity (B) after adjusting for the effects of gender, age, diabetes, hypertension and dyslipidemia. |
Statistically significant differences in IgG N-glycans among four groups were observed after correction for multiple comparisons (Figure 3). In total, 17 out of 24 initial IgG N-glycans were significantly different among the four groups (NW, ONCA, NWCA and OCA) (P<0.05/6*78=0.0001). Compared to NW population, 13 and 7 normalized IgG N-glycans found significant associations with NWCA and OCA after adjusting for the effects of gender, age, diabetes, hypertension and dyslipidemia (Table S2), while no significant association was found in ONCA. Compared to NW and ONCA, IgG N-glycans in OCA population were always changing in company with those in NWCA population implying that the progression of central adiposity might be taken part in IgG glycosylation, which inspired us to further explore the connections between glycans and central adiposity.
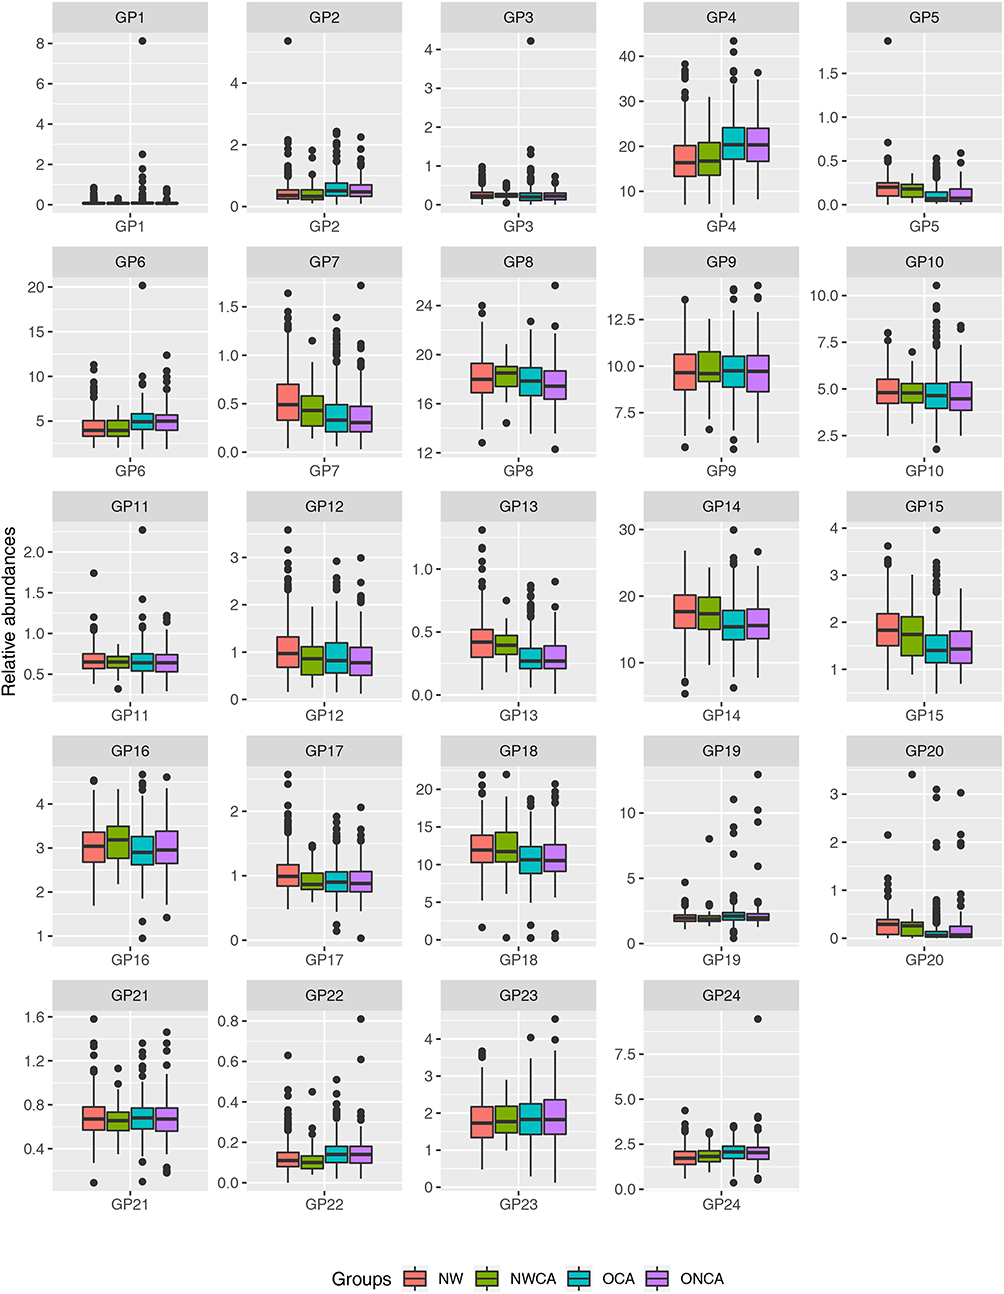 |
Figure 3 Differences of IgG N-glycans among NW, ONCA, NWCA and OCA in the whole populations. Data are shown as box and whiskers plots. Median was represented by lines inside the boxes represented by the 25th to 75th percentiles. The whiskers appearing denoted the lowest and highest values. (P<0.05/6*78=0.0001 indicated significant after multiple comparisons). |
The profile of statistically significant correlations of IgG N-glycans and NWCA and OCA was not absolutely consistent, but GP5, GP7, GP10, GP11, GP13, GP15 GP23 were found to be statistically significantly associated with NWCA and OCA (Figure 4). Derived traits were calculated representing common biologically meaningful features (sialylation, galactosylation glycan branching and fucosylation). In parallel, 33 derived traits representing sialylation, galactosylation glycan branching and fucosylation were found to be statistically significantly associated with NWCA and OCA. The changes of IgG N-glycans and glycosylation in the NWCA group were more than those in the ONCA group. The detailed information is described in the supplemental content (Tables S3 and S4).
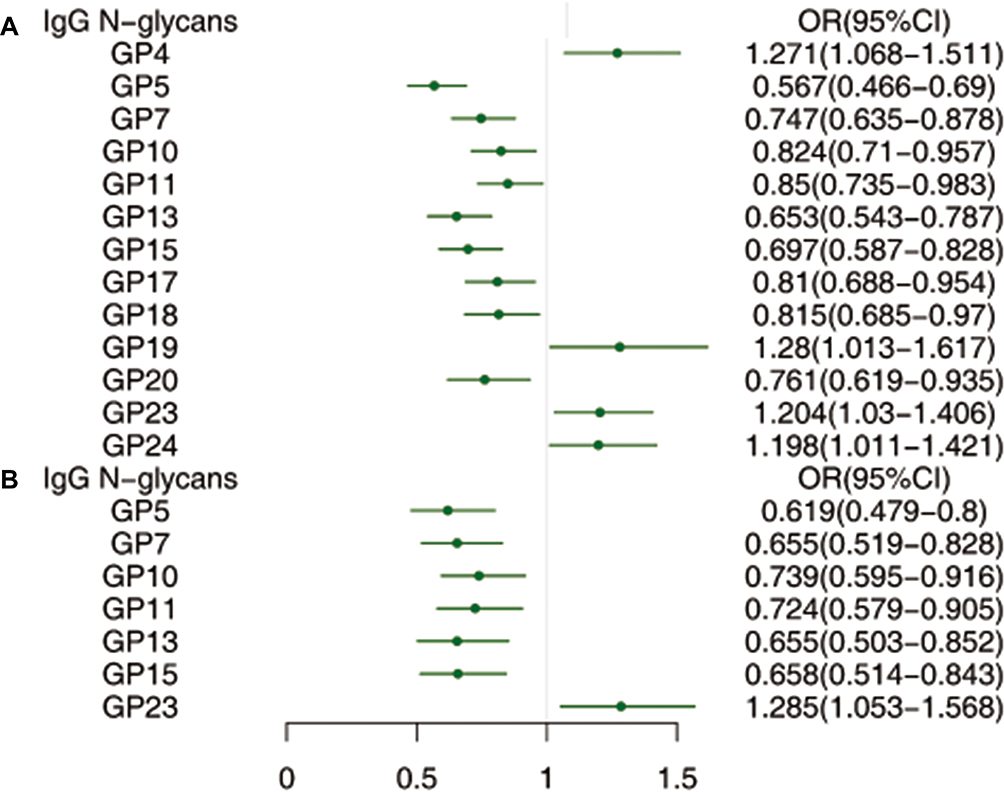 |
Figure 4 The profile of statistically significant correlations of IgG N-glycans with NWCA (A) and OCA (B) after adjusting for age, sex, hypertension, diabetes and dyslipidemia. |
In the gross, changes in glycan expression correlated with NWCA activity cannot be too worthy to investigate. GP4, GP19, GP23 and GP24 were positively associated NWCA, whereas GP5, GP7, GP10, GP11, GP13, GP15, GP17, GP18 and GP20 had negative relations with NWCA after adjusting for age, sex, hypertension, diabetes and dyslipidemia. For the derived glycans, IgG glycans showed lower level of galactosylation (G1n and G2n) and higher level of agalactosylation (G0n) for NWCA patients compared to the controls. While, the level of bisecting N-acetylglucosamine (GlcNAc) (FBStotal/FStotal, FBS1/FS1, FBS1/(FS1+ FBS1), FBS2/FS2 and FBS2/(FS2+ FBS2)) and fucosylation (Fntotal and Fn) in the NWCA patients was significantly higher than those in the control group. In addition, the high level of FBGS/(FBG+FBGS), FBGS/(FB+FBG+FBGS), FG2S2/(FG2+FG2S1+FG2S2), FBG2S1/(FBG2+FBG2S1+FBG2S2) and FBG2S2/(FBG2+FBG2S1+FBG2S2) increased the risk of NWCA, while the low level of FtotalS1/FtotalS2 and FS1/FS2 increased the risk of NWCA.
The IgG N-Glycans Patterns In The NWCA Populations
In NWCA populations, seven pairs of canonical variables in CCA were shown, with canonical correlations of 0.6690 (F= 2.56, P< 0.001), 0.3728 (F= 1.23, P=0.0418), 0.2877 (F= 0.97, P= 0.5714), 0.2654 (F= 0.85, P= 0.8370), 0.2349 (F= 0.68, P= 0.9684), 0.1489 (F= 0.47, P=0.9974) and 0.1465 (F= 0.49, P= 0.9621) for each successive pair by the CCA. The first and the second canonical groups were statistically significant, which demonstrated that IgG glycan traits were significantly linked to the clinical variables. As shown in Figure 5, 10 initial IgG glycan traits (GP4, GP5, GP7, GP8, GP13, GP15 and GP20) had the tendency to be significantly related to FPG, SBP, DBP, TC, TG, LDLC and HDLC levels in the first canonical group.
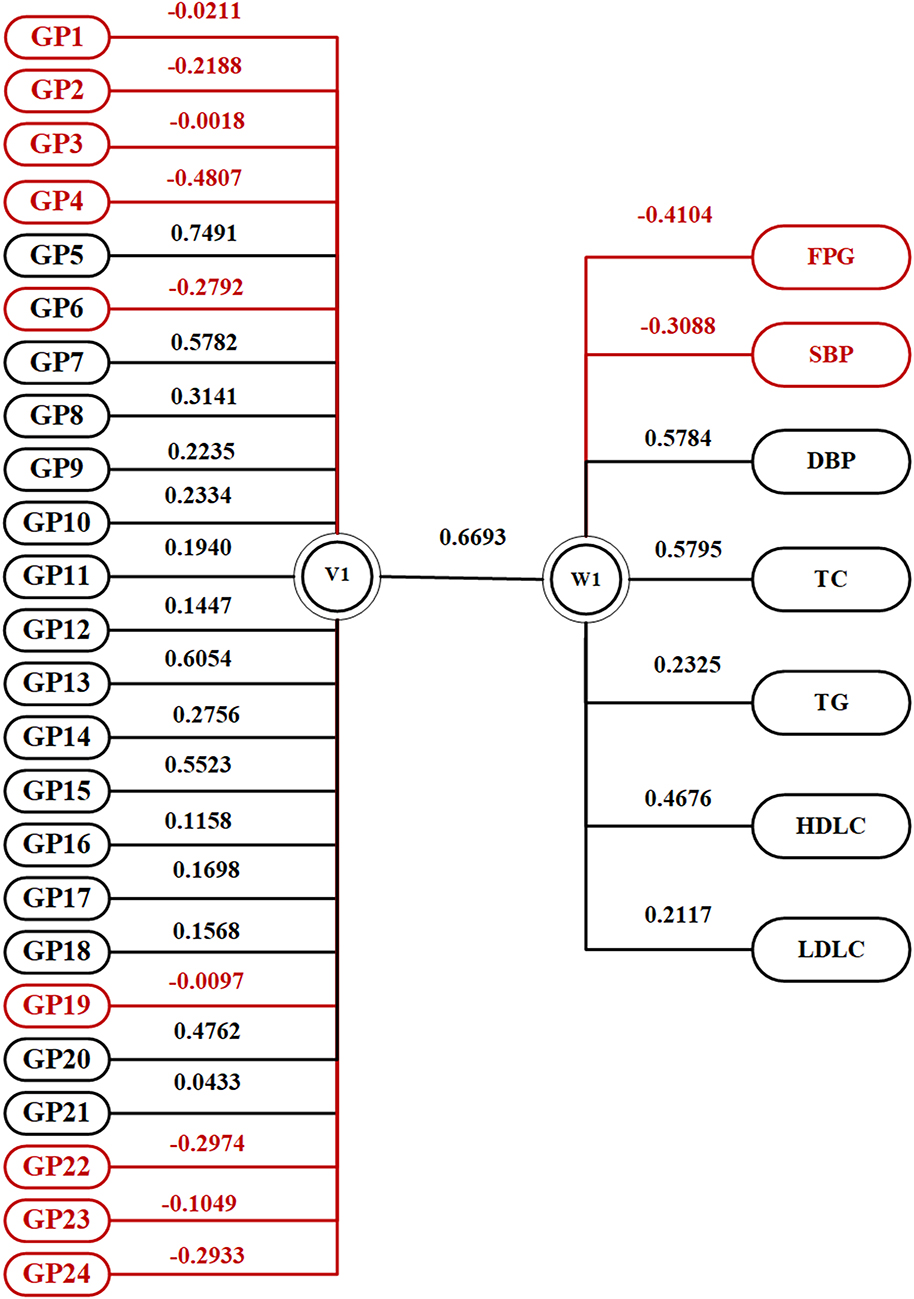 |
Figure 5 Canonical structures of the normalized IgG N‑glycan patterns and FPG, SBP, DBP, TC, TG, HDLC and LDLC in the first canonical set in the NWCA population. The absolute value of canonical loadings greater than 0.30 was significant loadings. All of the variables are sorted by the absolute value of their canonical loadings. The positive relationships are represented in black boxes, while negative relationships are shown in red boxes. |
In addition, aiming to identify individuals with similar patterns of changes, we have applied a bi-clustering algorithm, which at the same time clusters changes in individual glycans and group participants of NWCA according to the similarity in patterns of glycan changes. As shown in Figure 6, 2 subgroups including NWCA without any of diabetes, hypertension and dyslipidemia and NWCA with more than one of three disease outcomes were identified using different IgG glycosylation patterns.
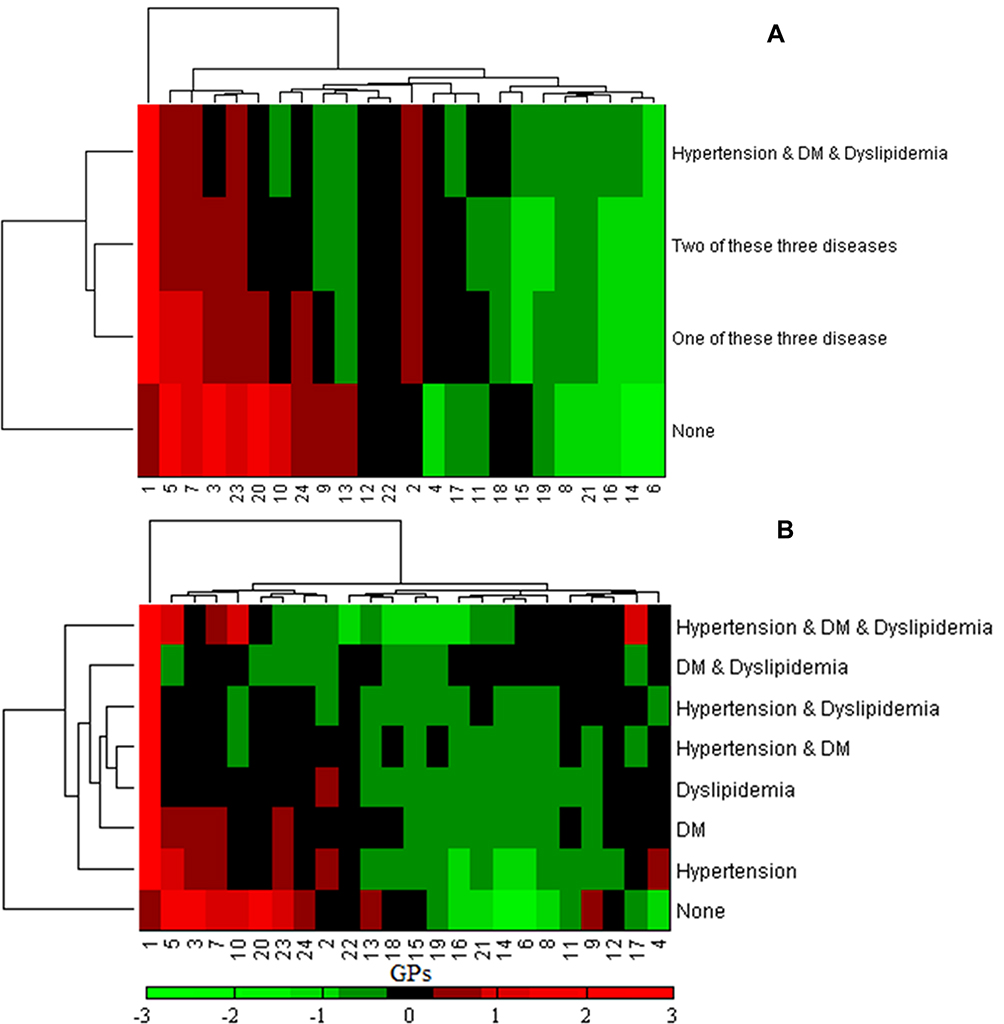 |
Figure 6 Clustering analysis on the difference between normalized IgG N-glycan patterns in the NWCA population. (A) Represented the changes in glycosylation among four participant groups with all three diseases (hypertension and diabetes and dyslipidemia), two of these diseases, one of these diseases and none, respectively. (B) Represented the changes in glycosylation among eight participant groups with all three diseases (hypertension and diabetes and dyslipidemia), two of these diseases (hypertension and diabetes, diabetes and dyslipidemia and hypertension and dyslipidemia), one of these diseases (hypertension, diabetes and dyslipidemia) and none, respectively. |
Discussion
The prevalence of the obesity and central adiposity are rising worldwide. Our finding showed that 18.7% of subjects were affected by obesity, 50.4% were affected by central adiposity, more than half of the included participants were classified as having obesity or central adiposity. In addition, the prevalence rates of NWCA were 36.0%. According to the data from the National Health and Nutrition Examination Survey in the US,8,28 34.6% of subjects were overweight, 25.1% were affected by obesity, 70.2% were affected by central adiposity and the prevalence rates of NWCA were 11.7%. The cross-sectional studies showed that the prevalence rates of NWCA were 36.9% and 15.4% in South Africa and Thai, respectively.9,29 It may be due to the different definition of obesity and central adiposity that the reported prevalence rate of NWCA is very different. However, NWCA is gradually developing as a major health problem worldwide, and identification of the underlying mechanism might translate new knowledge into the prevention and treatment of central adiposity.
Combining the present study and previous studies,18,19 we found that BMI and WHR were positively associated with GP4, GP6, and negatively associated with GP7, GP12-15, GP17-18 and GP20 (Table 2). In our present study, high level of GP23 and low level of GP5, GP7, GP10, GP11, GP13 and GP15 increased the risk of NWCA and OCA. In addition, lower galactosylation and bisecting GlcNAc and higher fucosylation increased the risk of NWCA. Consistent with previous studies,13,22,30 the changes of lower galactosylation and bisecting GlcNAc and higher fucosylation are involved in an imbalance of the inflammatory response that increases the risk of diseases. In addition, considering that accumulating evidence indicates the changes in IgG glycosylation mechanism could be a part of the molecular mechanism leading to the promotion of inflammation,13,30 the changes of IgG N-glycans and N-glycosylation in obesity and central adiposity may be one of the molecular mechanisms of inflammation in NWCA.
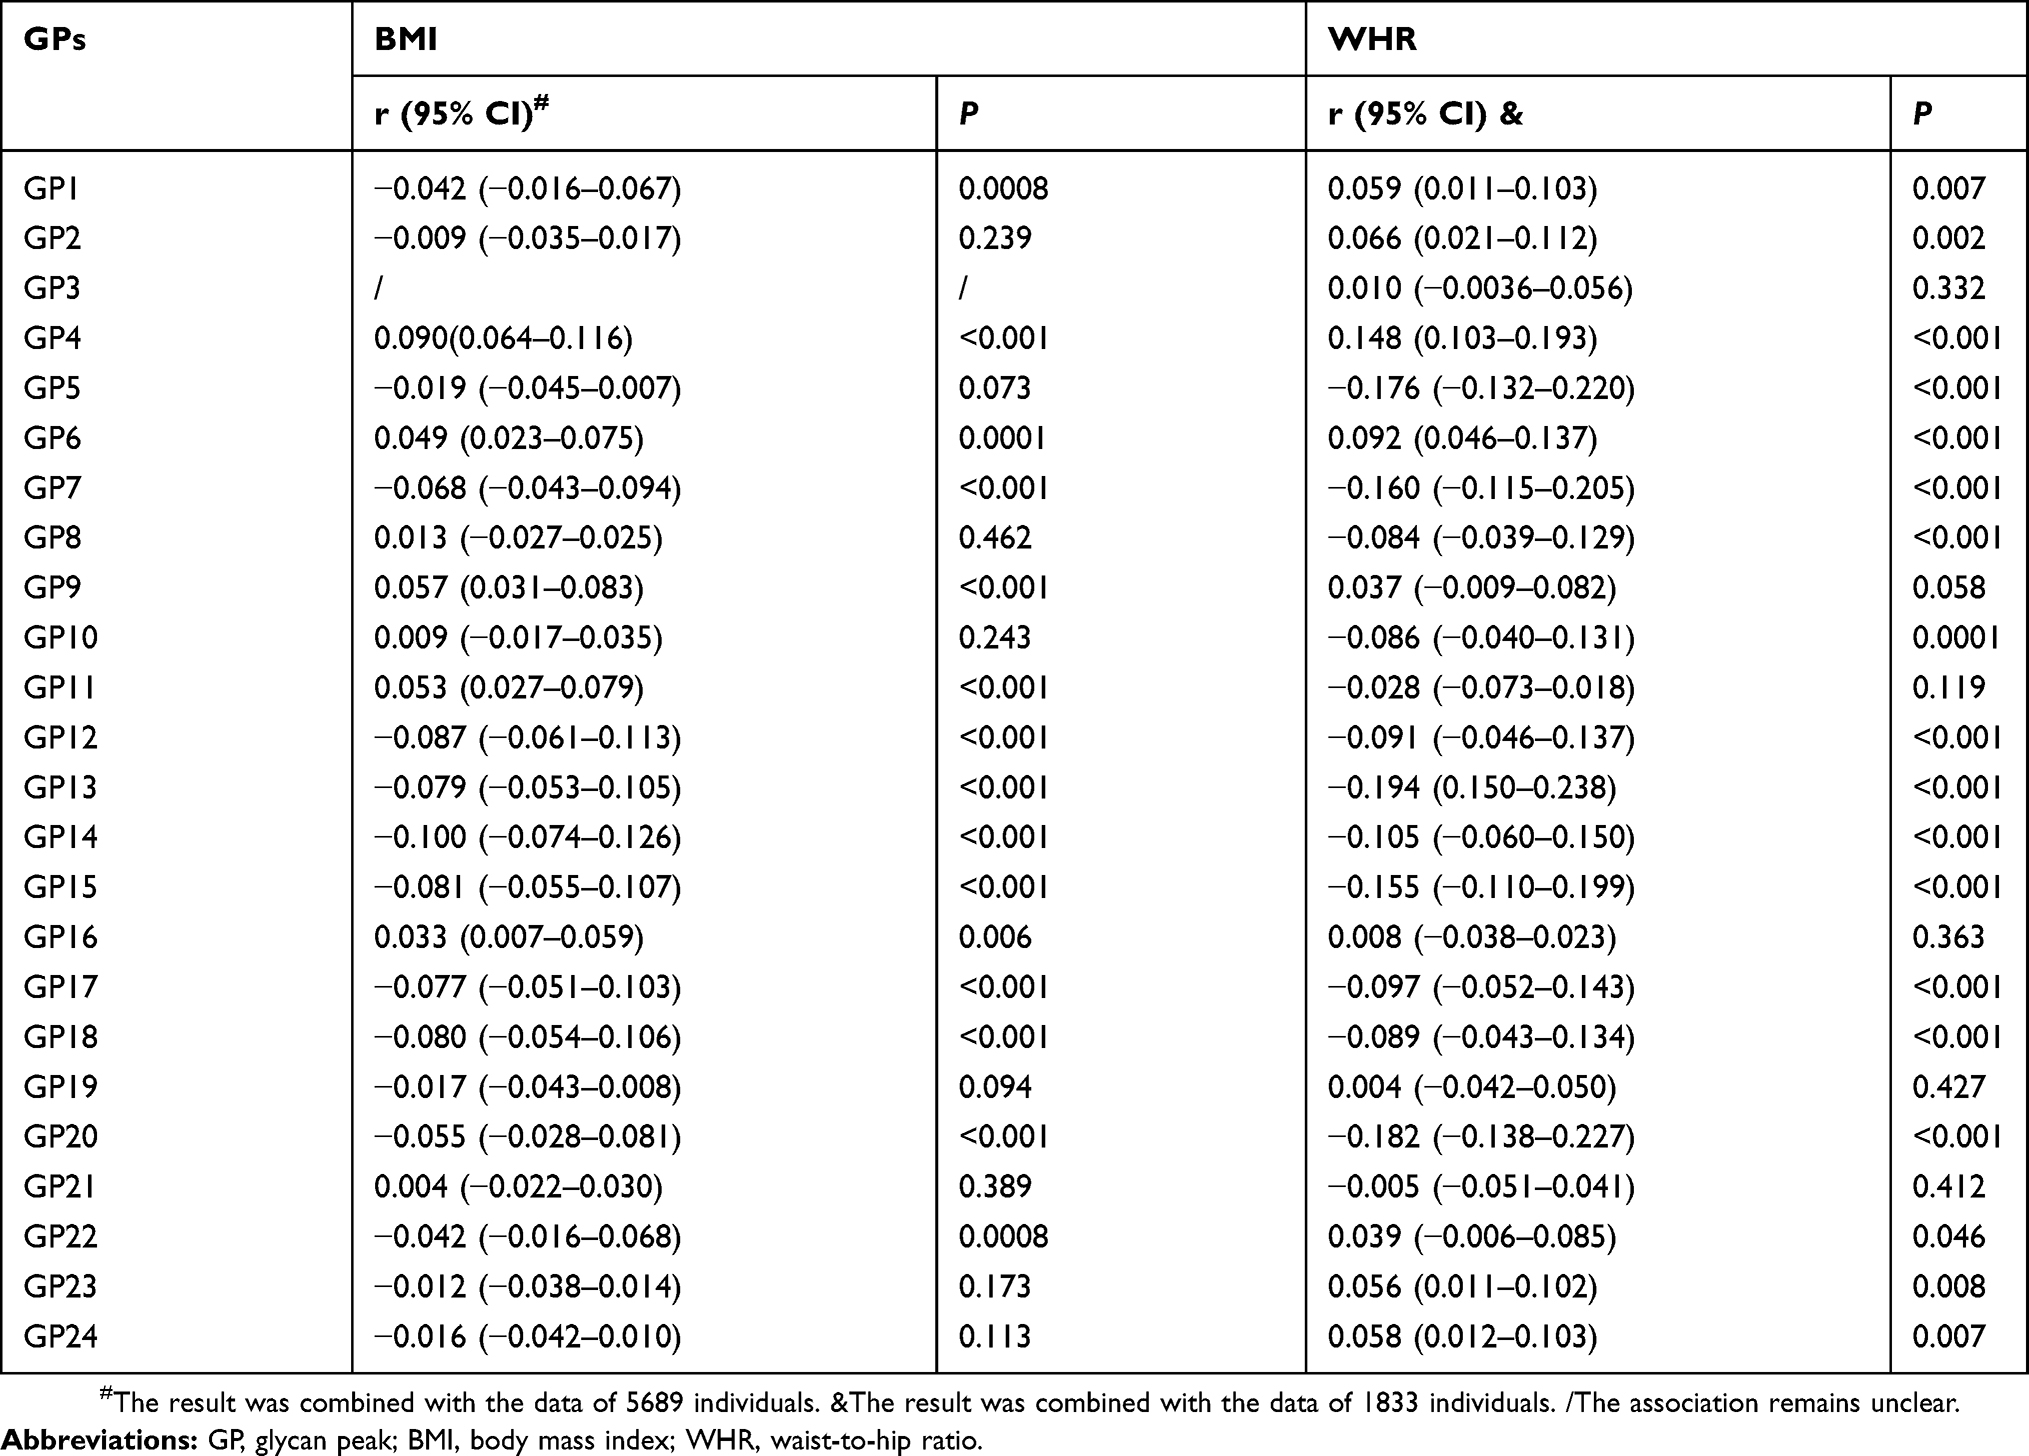 |
Table 2 IgG N-Glycans Associated With BMI And WHR |
The inflammatory role of IgG N-glycosylation in obesity and central adiposity could be associated with chronic inflammation as one of the characteristics of obesity and central adiposity. Central adiposity involves impairment of immune response affecting both innate and adaptive immunity, and adipose tissue can produce and secrete inflammatory molecules like tumor necrosis factor-α (TNF-α) and interleukin-1 receptor-associated kinase (IRAK)-1.16,17 Alternative IgG N-glycosylation plays a crucial role in activation of complement by regulating antibody-dependent cellular cytotoxicity (ADCC) and complement-dependent cytotoxicity (CDC), thus acting as a switch between pro- and anti-inflammatory IgG functionality.14,15 Inflammatory disorders lead to several signaling transduction pathways activation, inflammatory cytokine chemokine production and cell migration, which in turn cause metabolic dysfunction.31,32 Although the causal relationship of central adiposity with inflammation and IgG N-glycosylation is unknown, the changes in IgG N-glycans observed in our study might also reflect the chronic inflammatory processes in obesity and central adiposity. Inflammation has emerged as one of the key factors regulating obesity and central adiposity triggering metabolic syndrome and other related disorders.33,34 There are shared genes that have been associated with both IgG glycosylation and obesity and central obesity (FUT8 and IL6ST), and an established association between complement activation and obesity and central obesity; it is suggested that pro-inflammatory IgG might be a contributor to the disease pathophysiology in this disease.35
Furthermore, the changes of IgG N-glycans and N-glycosylation in central adiposity were more than those in obesity, which performed the stronger immune response in central obesity. In addition, we found that that correlations of IgG N-glycans with WHR were stronger than those with BMI combining previous studies and the present study. Compared to NW and ONCA, IgG N-glycans in OCA population were always changing in company with those in NWCA population implying that the progression of central adiposity might take part in IgG N-glycosylation. The molecular mechanism of IgG N-glycosylation may explain that central adiposity makes a greater contribution to the risk of diseases than general obesity.8,9 The changes of IgG N-glycans and N-glycosylation in NWCA were more than those in OCA, indicating that IgG N-glycosylation performed more effect on NWCA. Therefore, we continued to explore the IgG N-glycans patterns in the NWCA populations. In NWCA populations, we found that IgG N-glycans were associated with the three disease outcomes including diabetes, hypertension and dyslipidemia, which would be related disorders reduced by NWCA. In addition, bi-clustering analysis participants of NWCA revealed the existence of two subgroups of patients with distinct patterns of IgG glycosylation changes, which suggested us that NWCA as a basic metabolic disorder with different IgG glycosylation patterns which presented different inflammatory reaction might reduce the different other related disease outcomes.
In our present study, there are several common limitations and insufficiencies. First, the differential glycosylation described above may provide exciting insights into pathogenesis of NWCA. However, causation is difficult to infer in the observational data and the observed changes may be a consequence rather than causes of the disease. The distribution of four different obesity and central adiposity groups in our multi-center cross-sectional study was uneven, which might lead to the evaluation bias. In addition, the study protocol should be registered previously to ensure its feasibility. Furthermore, we only use WHR to define central adiposity, which may induce evaluation bias. Although the inflammatory role of IgG N-glycosylation was performed in diseases, we should investigate other inflammatory biomarkers to corroborate the inflammatory status of obesity and central adiposity. Therefore, further cohort studies with more comprehensive study design are needed to provide a more definite explanation about the role of IgG glycosylation in the association between NWCA and its related disorders.
Conclusion
In summary, central adiposity was involved in more changes of IgG N-glycosylation, representing a stronger inflammation status than obesity, which might make a greater contribution to the risk of related disorders. NWCA was associated with an increased pro-inflammatory of IgG N-glycosylation, which was accompanied by the development of central adiposity and other related disorders.
Data Sharing Statements
We do not intend to share any further data at present.
Acknowledgments
This work was supported by grants from National Natural Science Foundation of China (81673247, 81530087, 81872682 and 81773527) and Joint Project of the Australian National Health & Medical Research Council (NHMRC) and the NSFC (NH&MRC- APP1112767 –NSFC81561128020).
Author Contributions
All authors participated in the study design and data collection. All authors contributed to data analysis, drafting or revising the article, gave final approval of the version to be published and agree to be accountable for all aspects of the work.
Disclosure
The authors report no conflicts of interest in this work.
References
1. Gurwitz AA. The spreading worldwide obesity epidemic. J Community Health. 2014;39(5):827. doi:10.1007/s10900-014-9901-3
2. Ng M, Fleming T, Robinson M, et al. Global, regional, and national prevalence of overweight and obesity in children and adults during 1980–2013: a systematic analysis for the Global Burden of Disease Study 2013. Lancet. 2014;384(9945):766–781. doi:10.1016/S0140-6736(14)60460-8
3. Flegal KM, Kit BK, Orpana H, Graubard BI. Association of all-cause mortality with overweight and obesity using standard body mass index categories: a systematic review and meta-analysis. JAMA. 2013;309(1):71–82. doi:10.1001/jama.2012.113905
4. Cerhan JR, Moore SC, Jacobs EJ, et al. A pooled analysis of waist circumference and mortality in 650,000 adults. Mayo Clin Proc. 2014;89(3):335–345. doi:10.1016/j.mayocp.2013.11.011
5. Nyberg ST, Batty GD, Pentti J, et al. Obesity and loss of disease-free years owing to major non-communicable diseases: a multicohort study. Lancet Public Health. 2018;3(10):e490–e7. doi:10.1016/S2468-2667(18)30139-7
6. Aronne LJ. Classification of obesity and assessment of obesity-related health risks. Obes Res. 2002;10(12):105S–115S. doi:10.1038/oby.2002.203
7. Lam BC, Koh GC, Chen C, Wong MT, Fallows SJ. Comparison of Body Mass Index (BMI), Body Adiposity Index (BAI), Waist Circumference (WC), Waist-To-Hip Ratio (WHR) and Waist-To-Height Ratio (WHtR) as predictors of cardiovascular disease risk factors in an adult population in Singapore. PLoS ONE. 2015;8(4):55–56.
8. Hamer M, O’Donovan G, Stensel D, Stamatakis E. Normal-weight central obesity and risk for mortality. Ann Intern Med. 2017;166(12):1. doi:10.7326/L17-0022
9. Sahakyan KR, Somers VK, Rodriguez JP, et al. Normal-weight central obesity: implications for total and cardiovascular mortality. Ann Intern Med. 2015;163(11):827–835. doi:10.7326/M14-2525
10. Sharma S, Batsis JA, Coutinho T, et al. Normal-weight central obesity and mortality risk in older adults with coronary artery disease. Mayo Clin Proc. 2016;91(3):343–351. doi:10.1016/j.mayocp.2015.12.007
11. Michio S. Cardiac adiposity and global cardiometabolic risk: new concept and clinical implication. Circ J. 2009;73(1):27–34. doi:10.1253/circj.CJ-08-1012
12. Ohtsubo K, Marth JD. Glycosylation in cellular mechanisms of health and disease. Cell. 2006;126(5):855–867. doi:10.1016/j.cell.2006.08.019
13. Gudelj I, Lauc G, Pezer M. Immunoglobulin G glycosylation in aging and diseases. Cell Immunol. 2018;333:65–79. doi:10.1016/j.cellimm.2018.07.009
14. Biermann MH, Griffante G, Podolska MJ, et al. Sweet but dangerous – the role of immunoglobulin G glycosylation in autoimmunity and inflammation. Lupus. 2016;25(8):934–942. doi:10.1177/0961203316640368
15. Shade KTC, Anthony RM. Antibody glycosylation and inflammation. Antibodies. 2013;2(3):392–414.
16. Ellulu MS, Patimah I, Khaza’Ai H, Rahmat A, Abed Y. Obesity and inflammation: the linking mechanism and the complications. Arch Med Sci. 2017;13(4):851–863. doi:10.5114/aoms.2016.58928
17. Zagotta I, Dimova EY, Debatin KM, Wabitsch M, Kietzmann T, Fischer-Posovszky P. Obesity and inflammation: reduced cytokine expression due to resveratrol in a human in vitro model of inflamed adipose tissue. Front Pharmacol. 2015;6:79. doi:10.3389/fphar.2015.00079
18. Perkovic MN, Bakovic MP, Kristic J, et al. The association between galactosylation of immunoglobulin G and body mass index. Prog Neuropsychopharmacol Biol Psychiatry. 2014;48(1433):20–25. doi:10.1016/j.pnpbp.2013.08.014
19. Russell AC, Kepka A, Trbojević-Akmačić I, et al. Increased central adiposity is associated with pro-inflammatory immunoglobulin G N-glycans. Immunobiology. 2019;224(1):110–115. doi:10.1016/j.imbio.2018.10.002
20. Liu D, Chu X, Wang H, et al. The changes of immunoglobulin G N-glycosylation in blood lipids and dyslipidaemia. J Transl Med. 2018;16(1):235–244. doi:10.1186/s12967-018-1616-2
21. Xu CN, Ma ZM, Wang YF, et al. Visceral adiposity index as a predictor of NAFLD: a prospective study with 4-year follow-up. Liver Int. 2018;38(12):2294–2300. doi:10.1111/liv.2018.38.issue-12
22. Liu D, Zhao ZY, Wang AX, et al. Ischemic stroke is associated with the pro-inflammatory potential of N-glycosylated immunoglobulin G. J Neuroinflammation. 2018;15(1):123–132. doi:10.1186/s12974-018-1161-1
23. Chen C. Overview of obesity in Mainland China. Obes Rev. 2008;9(1):14–21. doi:10.1111/j.1467-789X.2007.00433.x
24. Zhou BF. Predictive values of body mass index and waist circumference for risk factors of certain related diseases in Chinese adults – study on optimal cut-off points of body mass index and waist circumference in Chinese adults. Biomed Environ Sci. 2002;15(1):83–96.
25. Wang YX, Klaric L, Yu XW, et al. The association between glycosylation of immunoglobulin G and hypertension: a multiple ethnic cross-sectional study. Medicine. 2016;95(17):e3379. doi:10.1097/MD.0000000000003379
26. Ge SQ, Wang YX, Song MS, et al. Type 2 diabetes mellitus: integrative analysis of multiomics data for biomarker discovery. Omics. 2018;22(7):514–523. doi:10.1089/omi.2018.0053
27. Puciä‡ M, Knezeviä‡ A, Vidic J, et al. High throughput isolation and glycosylation analysis of IgG-variability and heritability of the IgG glycome in three isolated human populations. Mol Cell Proteomics. 2011;10(10):
28. Yuri A, Carey JP, Santina CC, Della, Schubert MC, Minor LB. Disorders of balance and vestibular function in US adults: data from the National Health and Nutrition Examination Survey, 2001–2004. Arch Intern Med. 2009;169(10):938–944. doi:10.1001/archinternmed.2009.66
29. Owolabi EO, Ter Goon D, Adeniyi OV. Central obesity and normal-weight central obesity among adults attending healthcare facilities in Buffalo City Metropolitan Municipality, South Africa: a cross-sectional study. J Health Popul Nutr. 2017;36(1):54. doi:10.1186/s41043-017-0133-x
30. Novokmet M, Lukić E, Vučković F, et al. Changes in IgG and total plasma protein glycomes in acute systemic inflammation. Sci Rep. 2014;4(10):4347. doi:10.1038/srep04347
31. Greenberg AS, Obin MS. Obesity and the role of adipose tissue in inflammation and metabolism. Am J Clin Nutr. 2006;83(2):461S–465S. doi:10.1093/ajcn/83.2.461S
32. Wu CK, Yang CY, Lin JW, et al. The relationship among central obesity, systemic inflammation, and left ventricular diastolic dysfunction as determined by structural equation modeling. Obesity. 2012;20(4):730–737. doi:10.1038/oby.2011.30
33. Cavalcante-Silva LHA, Galvão JGFM, Sales-Neto JMD, Rodrigues-Mascarenhas S. Obesity-driven gut microbiota inflammatory pathways to metabolic syndrome. Front Physiol. 2015;6(461):341.
34. Holtmann MH, Neurath MF. Differential TNF-signaling in chronic inflammatory disorders. Curr Mol Med. 2004;4(4):439–444. doi:10.2174/1566524043360636
35. Lauc G, Huffman JE, Pucic M, et al. Loci associated with N-glycosylation of human immunoglobulin G show pleiotropy with autoimmune diseases and haematological cancers. PLoS Genet. 2013;9(1):e1003225. doi:10.1371/journal.pgen.1003225
 © 2019 The Author(s). This work is published and licensed by Dove Medical Press Limited. The full terms of this license are available at https://www.dovepress.com/terms.php and incorporate the Creative Commons Attribution - Non Commercial (unported, v3.0) License.
By accessing the work you hereby accept the Terms. Non-commercial uses of the work are permitted without any further permission from Dove Medical Press Limited, provided the work is properly attributed. For permission for commercial use of this work, please see paragraphs 4.2 and 5 of our Terms.
© 2019 The Author(s). This work is published and licensed by Dove Medical Press Limited. The full terms of this license are available at https://www.dovepress.com/terms.php and incorporate the Creative Commons Attribution - Non Commercial (unported, v3.0) License.
By accessing the work you hereby accept the Terms. Non-commercial uses of the work are permitted without any further permission from Dove Medical Press Limited, provided the work is properly attributed. For permission for commercial use of this work, please see paragraphs 4.2 and 5 of our Terms.