Back to Archived Journals » Integrated Blood Pressure Control » Volume 15
The Association Between Habitual Sleep Duration and Blood Pressure Control in United States (US) Adults with Hypertension
Authors Ogugu EG ![]() , Catz SL, Bell JF, Drake C, Bidwell JT, Gangwisch JE
, Catz SL, Bell JF, Drake C, Bidwell JT, Gangwisch JE
Received 22 January 2022
Accepted for publication 17 May 2022
Published 25 May 2022 Volume 2022:15 Pages 53—66
DOI https://doi.org/10.2147/IBPC.S359444
Checked for plagiarism Yes
Review by Single anonymous peer review
Peer reviewer comments 3
Editor who approved publication: Professor Turgay Celik
Everlyne G Ogugu,1 Sheryl L Catz,1 Janice F Bell,1 Christiana Drake,2 Julie T Bidwell,1 James E Gangwisch3
1Betty Irene Moore School of Nursing, University of California Davis, Sacramento, CA, USA; 2Department of Statistics, University of California Davis, Davis, CA, USA; 3Department of Psychiatry, Columbia University, New York City, NY, USA
Correspondence: Everlyne G Ogugu, Betty Irene Moore School of Nursing, University of California Davis 2570 48th Street Sacramento, Sacramento, CA, 95817, USA, Email [email protected]
Purpose: This study examined the relationship between habitual sleep duration and blood pressure (BP) control in adults with hypertension.
Methods: This cross-sectional study used data of 5163 adults with hypertension obtained from the 2015– 2018 National Health and Nutrition Examination Survey (NHANES). Multivariable logistic regression was used to analyze the association between habitual sleep duration and BP control. Habitual sleep duration was self-reported and defined as the amount of sleep usually obtained in a night or main sleep period during weekdays or workdays. It was categorized as < 6, 6 - < 7, 7– 9, and > 9 hours. BP control was defined as average systolic BP < 130mmHg and diastolic BP < 80mmHg.
Results: Results from the fully adjusted models show that among all adults with hypertension, habitual sleep duration of < 6 hours night/main sleep period was associated with reduced odds of BP control (OR = 0.53, 95% CI: 0ss.37– 0.76, P = 0.001) when compared to 7– 9 hours. In the subpopulation of adults who were on antihypertensive medication, those with a sleep duration of < 6 hours had lower odds of BP control than those with a sleep duration of 7– 9 hours (OR = 0.53, 95% CI: 0.36– 0.77, P = 0.002). No significant differences were noted in all adults with hypertension and in the subpopulation of those on antihypertensive medication in BP control between the reference sleep duration group (7– 9 hours) and the 6 - < 7 or > 9 hours groups. There were no significant differences across age groups or gender in the relationship between habitual sleep duration and BP control.
Conclusion: Sleep duration of < 6 hours is associated with reduced odds of hypertension control. These significant findings indicate that interventions to support adequate habitual sleep duration may be a promising addition to the current hypertension management guidelines.
Keywords: hypertension, blood pressure control, hypertension control, sleep, sleep duration
A Letter to the Editor has been published for this article.
Introduction
In the 2015–2018 period, 47.3% of US adults had hypertension, defined as systolic blood pressure (SBP) ≥130 mmHg or diastolic blood pressure (DBP) ≥80 mmHg, or current intake of BP-lowering medications.1 Of those, only 20.6% had achieved hypertension control.1 Hypertension is a major modifiable risk factor for heart disease and stroke.2 In 2018, heart disease and stroke were among the top five causes of death in the United States (US).3 Insufficient sleep is also a significant health issue, with over one-third of US adults sleeping <7 hours per day.4 The American Academy of Sleep Medicine and Sleep Research Society (AASM/SRS) recommends a minimum of 7 hours daily of sleep to support optimal function of body systems, including the systems involved in BP regulation.5
The 2017 American College of Cardiology and American Heart Association (ACC/AHA) guidelines on non-pharmacological interventions for prevention and management of hypertension focus on well-known modifiable risk factors for hypertension such as obesity, unhealthy diet, and excessive alcohol intake.2,6,7 However, several observational studies have also found a link between insufficient sleep and the risk of hypertension.8–14 These findings are supported by experimental studies, which have demonstrated a link between sleep restriction and elevation of BP.15–18 Other findings indicate that the association between short sleep and hypertension risk decreases with age,9,11,19 and is stronger in women than men.9,20 However, there is limited information on age or gender differences in the relationship between sleep duration and BP control in those with hypertension.
The growing evidence showing that sleep duration is a significant predictor of hypertension risk points to the need to examine the potential role of sleep duration in managing and controlling hypertension. However, little is known about the relationship between habitual sleep duration and BP control. A few studies that have examined the relationship between sleep duration and BP outcomes in adults with hypertension have yielded mixed results. One of the studies demonstrated a significant BP increase when sleep was restricted to <5 hours a day.15 The other, a cross-sectional study, found a positive correlation between self-reported long sleep duration (≥10 hours/day) and SBP.21 Further research is needed to explore if any differences noted in BP across various sleep duration categories translate to differences in BP control in adults with hypertension. We addressed this gap in knowledge by examining the association between habitual sleep duration and BP control in adults with hypertension. We also examined whether the relationship between sleep duration and BP control was modified by age or gender.
Methods
Data Source and Study Population
This cross-sectional study used the data of adults aged 18 years and above who participated in the 2015–2016 and 2017–2018 cycles of the National Health and Nutrition Examination Survey (NHANES). NHANES employs complex multistage sampling procedures to survey the civilian, noninstitutionalized US population. The participants are interviewed at home, followed by physical examinations and further interviews at a mobile examination center (MEC).22 The NHANES protocol was approved by the National Center for Health Statistics Ethics Review Board. All NHANES sample persons aged 18 years and above provided written informed consent. For all adults with cognitive impairment, informed consent was obtained from guardians or representatives who had the legal authority to consent to the NHANES participant’s medical care.23 We used de-identified and publicly available data that did not meet human subjects research criteria and thus was exempt from oversight by the University of California Davis’s Institutional Review Board. The datasets used in this study are available at https://wwwn.cdc.gov/nchs/nhanes/.
In order to be included in our analysis, participants needed to meet the 2017 ACC/AHA criteria for hypertension.2 Of the 19,225 adults (≥18 years old) in the 2015–2018 NHANES,24 5712 participated in interviews and physical examinations and met at least one of the following recommended 2017 ACC/AHA criteria for defining hypertension: current use of BP-lowering medication (n=3076), average SBP ≥130mmHg (n=3744), or DBP ≥80mmHg (n=2323). Participants that had missing data on sleep duration or BP were excluded from the study. To minimize the potential for unmeasured confounding,25 we also excluded pregnant women and those with severe disease, including congestive heart failure and severe (stage 4–5) chronic kidney disease (defined as a history of undergoing dialysis in the previous 12 months or a Chronic Kidney Disease Epidemiology Collaboration estimated glomerular filtration rate <30 mL/min/1.73 m2).26–28 The final study sample was 5163 (Figure 1).
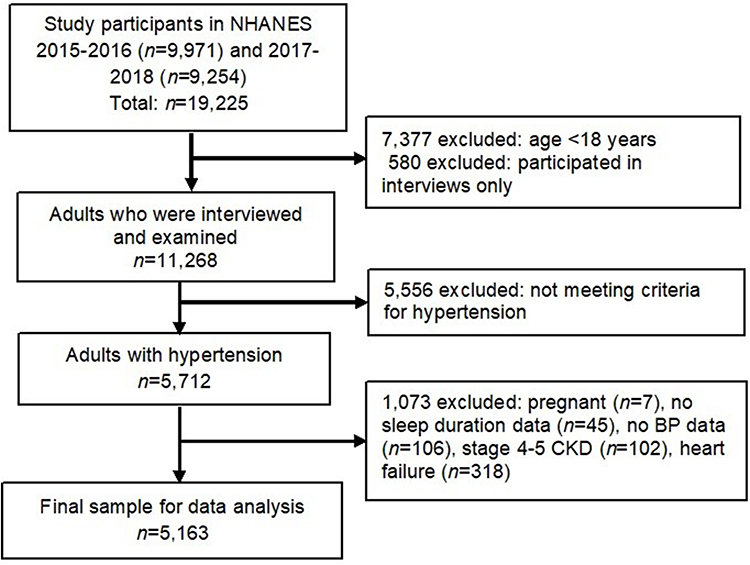 |
Figure 1 Flow diagram for the inclusion and exclusion criteria used in the study. |
Key Measures
Habitual Sleep Duration
The NHANES calculated the amount of sleep usually obtained in a night or main sleep period during weekdays or workdays from two survey questions: “What time do you usually fall asleep on weekdays or workdays?” and “What time do you usually wake up on weekdays or workdays?” We categorized habitual sleep duration into <6, 6 – <7, 7–9, and >9 hours/night or main sleep period.5,11,12
Blood Pressure Control
A standardized protocol was used to obtain three BP readings taken one minute apart at the MEC.29 The average SBP and DBP were calculated using the available SBP and DBP readings. Blood pressure control was defined as average SBP <130mmHg and DBP <80mmHg.2
Confounders
Based on previous studies, several sociodemographic, sleep, and health-related factors associated with sleep duration and BP control were identified as potential confounders.9,11,12,30–36 The factors included in this study were gender (male, female), age (<18 - 39, 40–59, 60–79, ≥80 years), nativity (US.-born, not US.-born), education level (less than high school, high school graduate, some college, college graduate), employment status (part time <35 hours, fulltime 35–44 hours, fulltime ≥45 hours, not working), health insurance (insured, uninsured), and annual household income (<$55,000, ≥$55,000). The $55,000 NHANES income category was used as a cut-point because it is close to the US median household income for the 2015 to 2017 period.37 Race/ethnicity, a social construct38 associated with sleep duration33,34 and hypertension control,31,35 was self-reported and classified as non-Hispanic White, non-Hispanic Black, Hispanic, and Other.
History of sleep apnea symptoms was defined as a history of; (1) snoring ≥3 times/week; (2) snorting, gasping, or stopping breathing while sleeping ≥3 times/week; or (3) being excessively sleepy during the day ≥16 times/month despite sleeping for ≥7 hours per night.39,40 Help-seeking for sleeping difficulty was defined as a history of ever telling a health care professional that one had trouble sleeping. Depressive symptoms were screened using the 9-item Patient Health Questionnaire (PHQ-9, range of 0–27) and categorized as minimal or none (0–4), mild (5–9), moderate to severe (≥10 – 14).41
The number of healthcare visits in the past 12 months (excluding home visits, phone consultations, overnight hospitalization, and emergency room visits) was grouped into none, 1–2, and >2 visits. Body mass index (BMI) was analyzed as a continuous variable. Cardiovascular disease was defined as a history of being told by a health professional that one had coronary heart disease, angina, a heart attack, or stroke. Diabetes was defined based on either a history of being told by a health care professional that one has diabetes or having a blood glycohemoglobin level of 6.5% or higher.42 Moderate chronic kidney disease was defined as an eGFR of 30 - <60 mL/min/1.73 m2.26
Cigarette smoking was categorized as never smoker (never smoked at least 100 cigarettes in their lifetime), former smoker (smoked at least 100 cigarettes in their lifetime but not smoking currently), and current smoker. Physical activity was self-reported and included leisure, work, and transportation (commuting by walking or bicycling) activities. Moderate-intensity and transportation-related physical activities were assigned four metabolic equivalents of task (MET) scores/minute, and vigorous-intensity physical activity eight MET scores/minute.43 Weekly physical activity levels were categorized as none (0 MET-minutes), low (<600 MET-minutes), sufficient (600–1200 MET-minutes), and high (>1200 MET-minutes).44 Alcohol intake was classified as none (never had at least 12 alcoholic drinks in a lifetime or any alcohol in the past year), moderate (not more than one drink for women and not more than two drinks for men in a day), and heavy (more than one or two drinks in a day for women and men, respectively).45
During the home interview phase of NHANES, participants were asked if they had taken prescribed medicine in the past 30 days and the reason for use for each reported medication. Those who gave an affirmative answer were requested to show the medication container to the interviewer, and each reported medication name was converted to a generic drug code and name using the Cerner Multum Lexicon drug database.46 Multum Lexicon uses a 3-level category nested system to classify generic drugs based on their ingredients and therapeutic use.46 Those who reported use of medications to manage insomnia or other unspecified sleep disorder or had documented intake of any of the following FDA-approved drugs for insomnia were classified as taking prescribed sleep medication: triazolam, estazolam, temazepam, zolpidem, zaleplon, eszopiclone, ramelteon, doxepin, butobarbital, suvorexant, mirtazapine, trazodone, doxepin, imipramine, amitriptyline, diphenhydramine, and doxylamine.47 Use of antihypertensive medication was derived from the Multum Lexicon second-level category of cardiovascular agents and classified as angiotensin-converting enzyme inhibitor or angiotensin receptor blocker (ACEI/ARB), diuretic, βeta-blocker, calcium channel blocker (CCB), and antihypertensive combinations. The classes and number of antihypertensive agents in the combination medications were obtained from Multum Lexicon’s third-level category of cardiovascular agents. Among those on antihypertensive therapy, the total number of antihypertensive agents the respondent was on was categorized as one, two, and three or more.
Statistical Analysis and Missing Data
The percentage of observations with complete data for all covariates was 85%. The covariates with missing data included education level, annual household income, health insurance, alcohol intake, BMI, depressive symptoms, and healthcare visits in the past year (Appendix Table 1). The missing data were imputed using multiple imputation with chained equations (MICE).48 Twenty imputed datasets were generated, and the results pooled to generate estimates of the multiply impute model using STATA’s multiple imputation (MI) estimate procedures.49 Refer to Supplementary Information Appendix Section 1 for further details.
We compared the observed data to the complete imputed data to check for differences in data distribution in the covariates with missing data. In the annual household income, the proportion of the <$55,000 group increased from 48.5% to 49.3% while the ≥$55,000 group reduced from 51.5% to 50.7% after imputation (see Supplementary Information Appendix Table 1). The distribution remained similar for depressive symptoms, BMI, healthcare visits in the past year, education level, health insurance, and alcohol intake. Models to analyze the association between habitual sleep duration and BP control were fit using the complete imputed data.
Data distribution across various variables was analyzed for the total study sample and across habitual sleep duration categories. Logistic regression models (unadjusted and adjusted) were fit to analyze the association between habitual sleep duration and BP control, with the crude and adjusted odds ratios for controlled BP and their corresponding 95% confidence intervals presented. The logistic regression analyses were done for all adults with hypertension (n=5163) and for a subpopulation of adults with hypertension who were on antihypertensive medication (n=2711). Effect modification by age and gender was assessed separately by adding an interaction term (sleep duration × age or sleep duration × gender) to the adjusted logistic regression models.
All data were analyzed using STATA 1C Version 15.50 Survey commands were used to apply sample weights to account for the NHANES complex sampling design. The significance level for all analyses was set at a p-value <0.05.
Results
Study Population
The current study included 5163 adults with hypertension (see Figure 1). Of these, 2711 reported being on antihypertensive therapy. Table 1 presents the descriptive characteristics of the participants by habitual sleep duration based on the 2015–2018 NHANES data. The average age of the adults with hypertension was 55.4 years, and 52.2% were male. Most participants (64.3%) were non-Hispanic White. More than half (53.2%) had some college education or higher level of education. Most of the participants had health insurance and had visited a health care facility for care at least once in the past year. The mean BMI was 31.2 kg/m2, and 49.3% reported being highly physically active (>1200 MET minutes/week), while 25.1% were physically inactive.
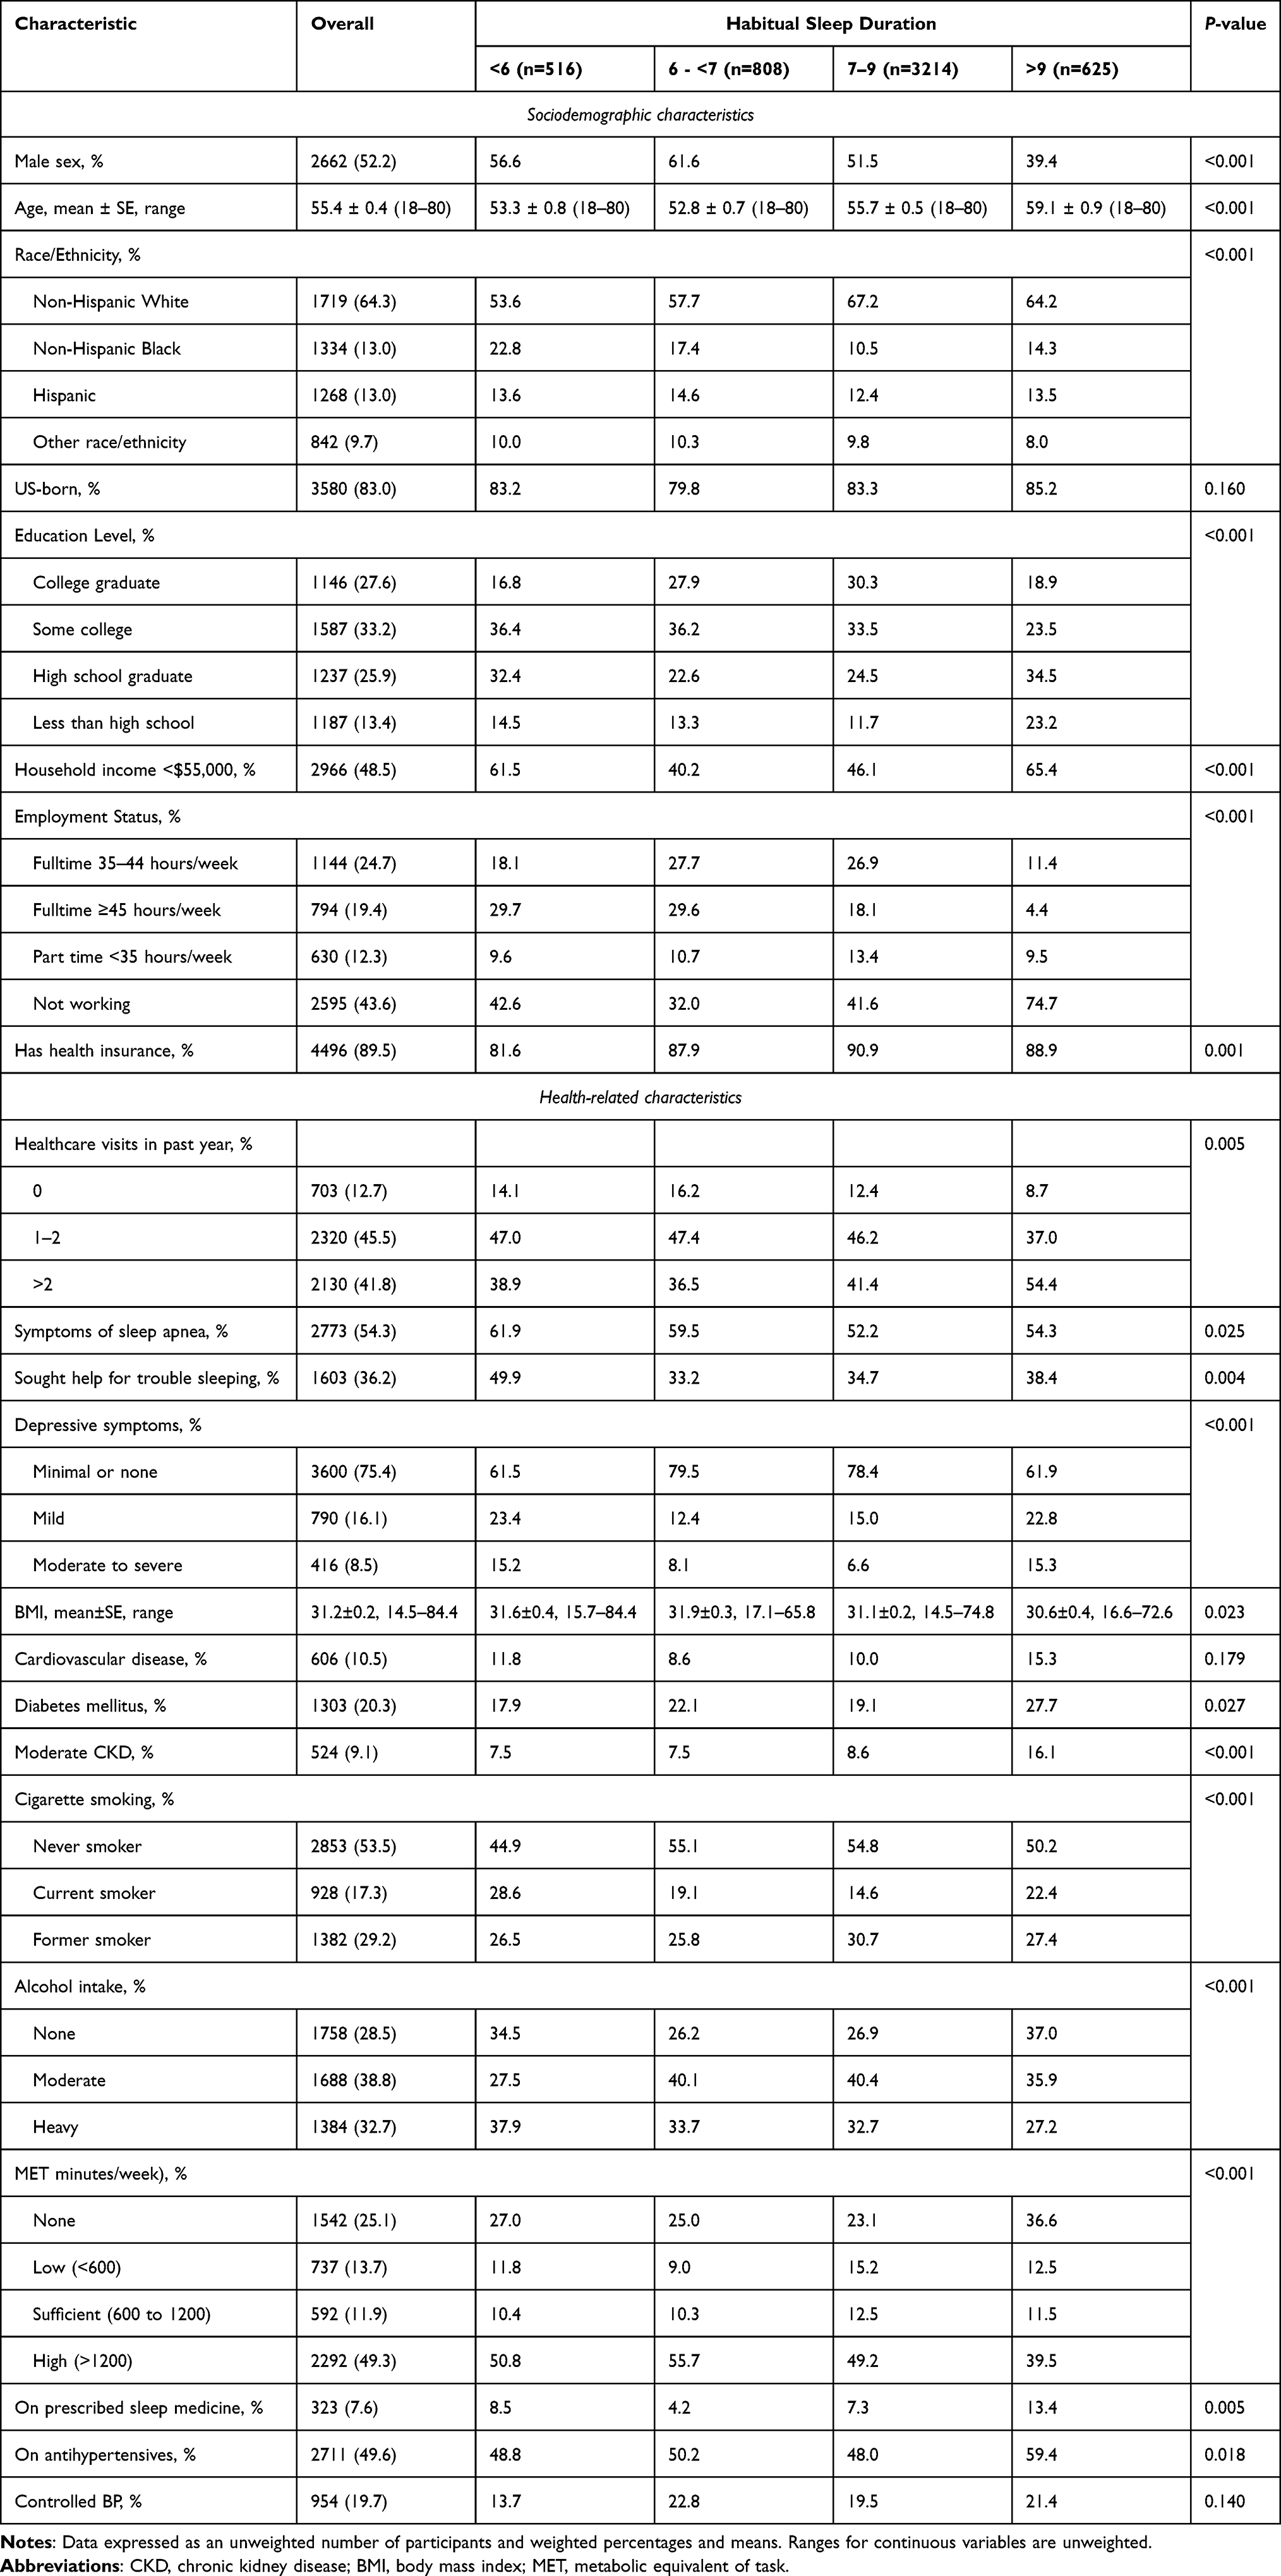 |
Table 1 Characteristics of NHANES Sample of US Adults with Hypertension by Habitual Sleep Duration, n=5163 |
Over half (54.3%) reported a history of sleep apnea symptoms, and 36.2% had a history of telling a health care professional that they had trouble sleeping. The majority (66.0%) reported sleeping 7–9 hours in a night or main sleep period, while 23.7% slept <7 hours. The proportion of those on antihypertensive medication was 49.6%, and 7.6% reported using prescribed sleep medicine in the past month (Table 1). Over half (51.1%) of those on antihypertensive therapy reported using one agent, and the commonly used antihypertensive medication was an ACEI or ARB (Table 2).
 |
Table 2 BP Control and Antihypertensive Medication Use in the NHANES Sample on Antihypertensive Therapy Stratified by Habitual Sleep Duration, n=2711 |
Habitual Sleep Duration and Hypertension Control
Results from the logistic regression models for all adults with hypertension and the adults with hypertension who were on antihypertensive medications are presented in Table 3. In the unadjusted logistic regression analyses of all adults with hypertension, those with a sleep duration of <6 hours were less likely to have controlled BP than those whose sleep duration was 7–9 hours (crude OR = 0.65, 95% CI: 0.44–0.98, p-value = 0.041). A similar trend was noted in the subpopulation of adults with hypertension who were on antihypertensive medications. Compared to those with sleep duration of 7–9 hours, those with <6 hours of sleep were less likely to have controlled BP (crude OR = 0.58, 95% CI: 0.38–0.88, p-value = 0.011). No significant differences were noted in BP control between the sleep duration reference group (7–9 hours) and those whose sleep duration was 6 - <7 hours or >9 hours (Table 3).
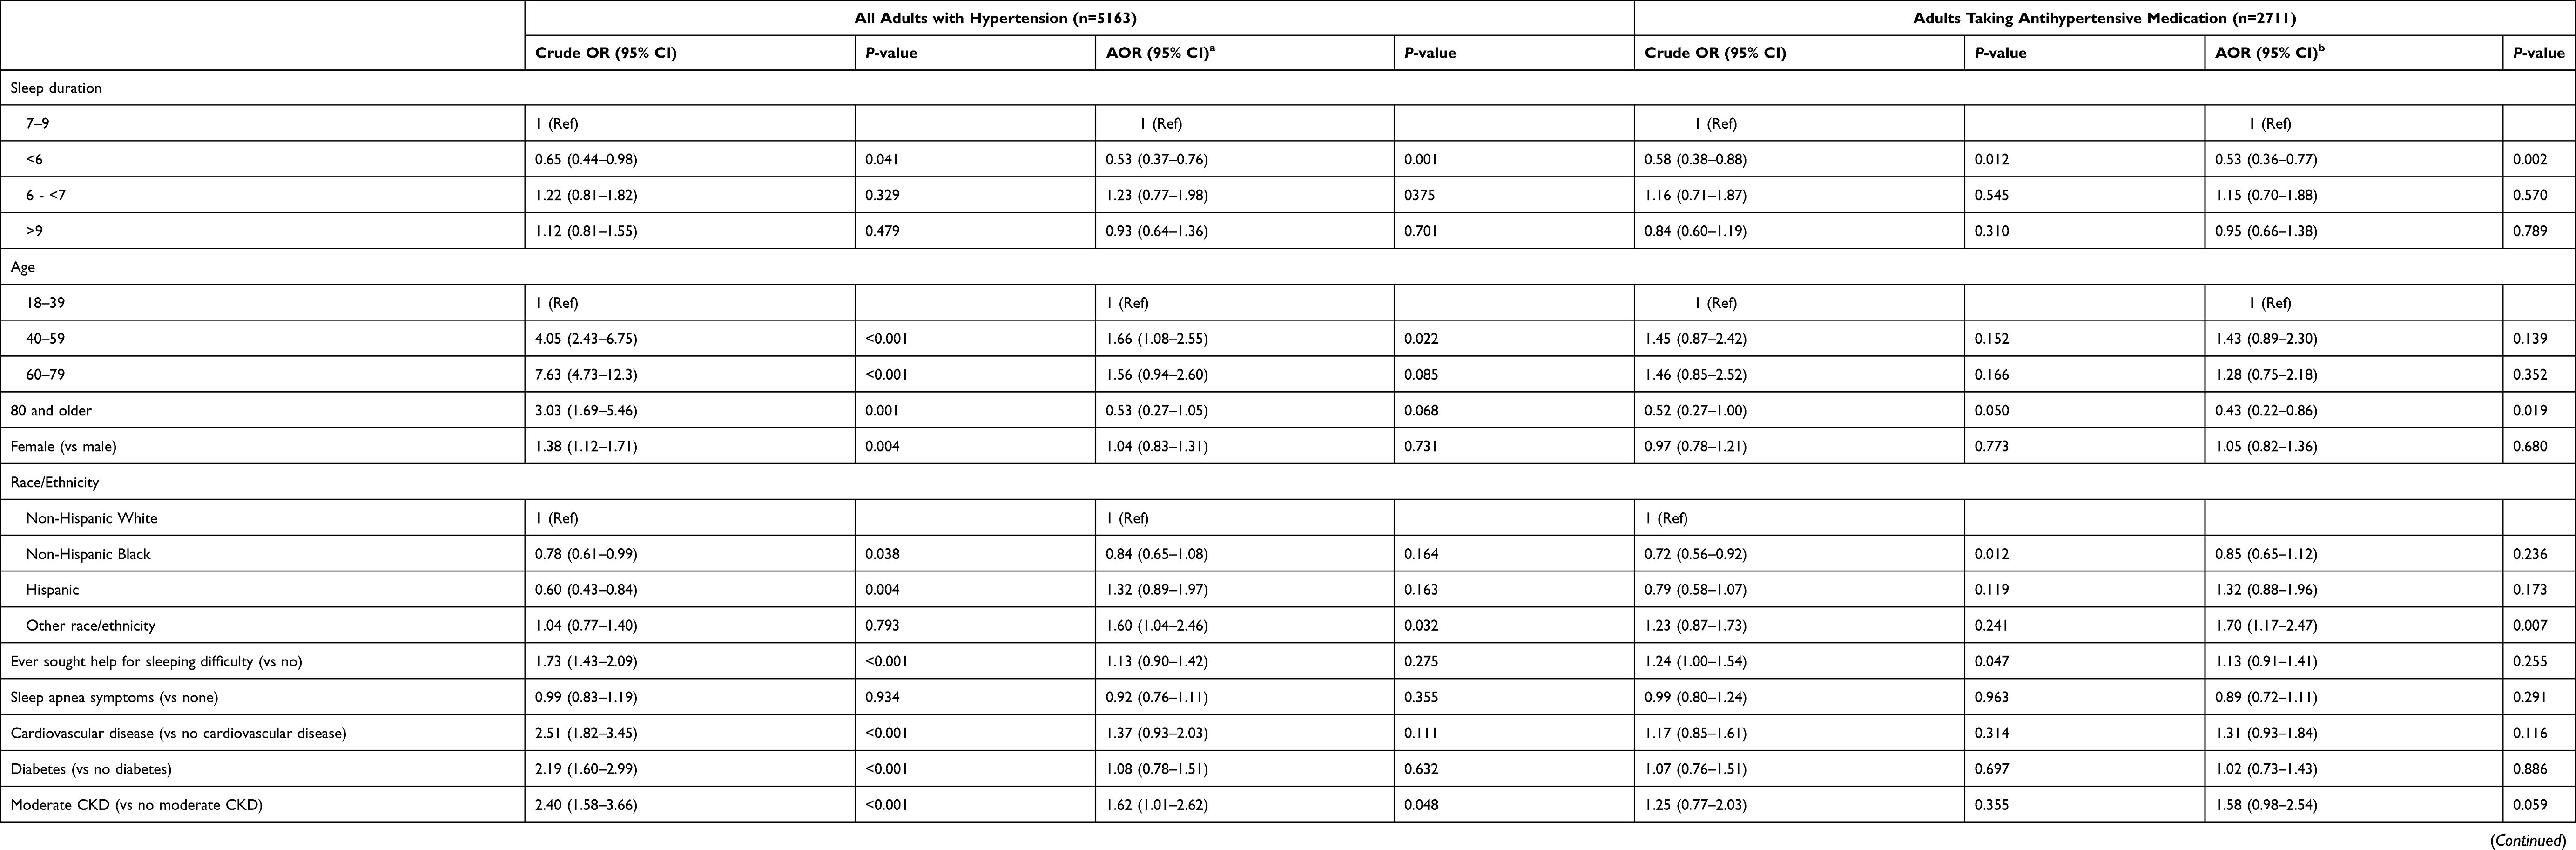 |
Table 3 The Odds for BP Control in NHANES Sample of US Adults with Hypertension |
After adjusting for all covariates (sociodemographic, health-related, and other sleep characteristics), the relationship between habitual sleep duration and BP control remained robust. In all adults with hypertension, those with less than <6 hours of sleep were 47% less likely than those sleeping 7–9 hours to have controlled BP (OR = 0.53, 95% CI: 0.37–0.76, p-value = 0.001). In those on antihypertensive medications, a sleep duration of <6 hours was associated with lower BP control than 7–9 hours of sleep (OR = 0.53, 95% CI: 0.36–0.77, p-value = 0.002). In all adults with hypertension and the subpopulation on antihypertensive medications, no significant differences were noted in BP control between the 6 - <7 hours or >9 hours of sleep groups and those with 7–9 hours of sleep (Table 3).
In other findings from the adjusted model of all adults with hypertension, those aged 40–59 years were 66% more likely to have BP control than those 18–39 years old. In adults on antihypertensive medication, those aged ≥80 years were 57% less likely to have BP control than those aged 18–39 years. In all adults with hypertension, having a history of moderate CKD was associated with 62% higher odds of BP control. However, none of the comorbid conditions were associated with BP control in the subpopulation of those on antihypertensive medications. Among all those with hypertension and in the subpopulation of those on antihypertensive medication, those classified as Other race/ethnicity were more likely than non-Hispanic White adults to have BP control (Table 3).
Among all adults with hypertension other factors positively associated with BP control included being on antihypertensive treatment (OR = 34.10, 95% CI: 19.85–58.50), having at least 1–2 (OR = 2.28, 95% CI: 1.05–4.93) or more than 2 (OR = 2.35, 95% CI: 1.07–5.18) health care visits in the past year compared to none and having an annual household income of ≥$55,000 compared to <$55,000 (OR = 1.46, 95% CI: 1.03–2.06). In the model of only those on antihypertensive therapy, income and nativity were the other covariates that showed significant associations with BP control. Compared to <$55,000, those with an annual household income of ≥$55,000 were 44% more likely to have BP control. Those who were not US-born were 40% less likely to have BP control than those born in the US (Results not shown on the table).
In the fully adjusted logistic model with the interaction term, habitual sleep duration × age, no significant interactions were noted between habitual sleep duration and age on the odds of hypertension control. A separate, fully adjusted model with the interaction term habitual sleep duration × gender also yielded no significant interactions.
In sensitivity analyses, the multivariable logistic regression model results from the complete imputed data (n=5163) were compared to those from the observed data (n=4384) to note any differences. Among all adults with hypertension, the adjusted odds for BP control in those with a sleep duration of <6 hours when using complete imputed data (OR = 0.53, 95% CI: 0.37–0.76) were not significantly different from the observed data results (OR = 0.52, 95% CI: 0.35–0.77). Similarly, among those on antihypertensive medications, the complete imputed data (n=2711) adjusted logistic regression results on the odds for BP control in those with sleep duration of <6 hours (OR = 0.53, 95% CI: 0.36–0.77) were not significantly different from those from observed data (OR = 0.52, 95% CI: 0.35–0.77). In both models, no significant differences were noted in BP control between the reference group (7–9 hours) and the 6-<7 hours or >9 hours group (refer to Supplementary Information Appendix Tables 2 and 3 for further details).
Discussion
In this nationally representative study of US adults with hypertension, we find a negative association between short sleep duration and BP control, both in all adults with hypertension and in the subpopulation of those on antihypertensive medications. Importantly, the association was robust, with no age or gender differences in magnitude or significance in the relationship between sleep duration and BP control. These findings build upon evidence from previous studies showing short sleep duration to be a significant risk factor for hypertension.8–13
Our findings of an association between short sleep duration and BP control at <6 hours of sleep but not 6-<7 hours support prior findings that have noted a stronger association between short sleep and hypertension at fewer hours of sleep. In a cross-sectional study that used 7–8 hours/night as the normal sleep duration, self-reported sleep duration of 5–6 hours was associated with a 22% increased risk for hypertension, and the risk substantially increased by twofold in those with a sleep duration of <5 hours/night.51 These findings are consistent with another study, which reported a 86%, 56%, and 27% increase in the risk of hypertension in adults whose sleep duration was ≤4, 5, and 6 hours, respectively, compared to 7 hours of sleep.9 A dose-response relationship has been demonstrated in a meta-analysis of longitudinal studies, which reported a 0.32% reduction in risk for hypertension with each hour increase in sleep duration. The meta-analysis findings also showed that a sleep duration of ≤5 hours was associated with a higher risk for hypertension than a sleep duration of 6 hours (p <0.05) compared to 7 hours of sleep.8 These findings, taken together, point to a higher risk of poor BP outcomes in adults habitually sleeping for less than 6 hours a day.
There are several ways through which inadequate sleep may negatively impact BP and BP control. Sleeping for less than the recommended hours can cause alterations in physiological functions, leading to many adverse effects, including an increase in BP. Examples of these alterations include increased sympathetic nervous system (SNS) activity, reduced insulin sensitivity, endothelial dysfunction, and hormonal alterations that increase the risk for obesity.52–56 For instance, experimental studies in adults with normal BP and those with hypertension have shown that restricting sleep to less than 5 hours/day leads to a significant increase in SNS activity and elevation in BP.15–18 Insufficient sleep is thought to lead to a sustained elevation in SNS activity throughout the time one remains awake during the night and throughout the next day following sleep loss.54 Inadequate sleep can also interfere with specific neurocognitive functions and impair attention to health-related cues such as being physically active and eating healthy food.57 All these factors can contribute to difficulty achieving BP control among individuals with hypertension.
The 2017 ACC/AHA guidelines outline pharmacological and non-pharmacological interventions for hypertension management to improve overall health status and reduce cardiovascular disease risk.2 The main non-pharmacological interventions recommended are based on findings from clinical trials. These interventions include weight control, physical activity, a healthy diet, increased dietary potassium, reduced dietary sodium, and reduced alcohol intake for those who consume alcohol.2 These interventions are focused on well-known modifiable risk factors for hypertension, such as obesity, unhealthy diet, and excessive alcohol intake.2,6,7 Based on the findings from our study and others who have demonstrated a relationship between short sleep and hypertension,8–13,15,16,18 habitual sleep duration may play a crucial role in the prevention, management, and control of hypertension. Consequently, supporting adequate habitual sleep duration may be an important addition to the various pharmacological and non-pharmacological hypertension management modalities. It should be considered as one of the recommended basic lifestyle interventions for BP control in future iterations of the hypertension management guidelines.
There are a few limitations related to this study. We cannot infer a causal link between habitual sleep duration and hypertension control because of the cross-sectional nature of the NHANES data. There may be response bias because data for several variables, including habitual sleep duration, other sleep characteristics, some chronic health conditions, and health behaviors, were self-reported. However, objective measures to assess variables such as habitual sleep duration and other health behaviors may not be feasible in large population-based studies. The use of objective measures to measure these variables in future studies examining the relationship between habitual sleep duration and hypertension control is recommended. The NHANES lacked data on potential confounders of the sleep and hypertension relationship, such as shift work, caffeine use, diagnosed sleep disorders such as obstructive sleep apnea and insomnia, and antihypertensive medications adherence.58–60 Although the measurement of BP was done by specially trained health professionals that followed a standardized protocol and used repeated measures, the BP readings used to calculate the average BP were all obtained in a single visit to the mobile examination center. Using BP readings obtained only in a single visit can lead to misclassification of hypertension status or BP control status because of the difficulty of identifying whitecoat and masked hypertension cases in a single office visit.61
Despite the limitations noted, the strength of this study that used the nationally representative NHANES lies in the generalizability of findings to a larger population of community-dwelling US adults with hypertension. Similar to the present study’s results, most experimental and population-based cross-sectional and longitudinal observational studies that measured sleep duration using retrospective self-report, sleep diaries, and objective measures have shown concordance in findings on the relationship between insufficient sleep duration and cardiovascular disease outcomes.5 Therefore, the information generated on the relationship between sleep duration and BP control adds to the current literature and provides insight into the potential role of habitual sleep duration in supporting hypertension management. Future longitudinal studies are recommended to examine how habitual sleep predicts BP changes and BP control in adults with hypertension. These findings also have implications for clinical practice and public health. Working with individuals who have hypertension to help them get enough sleep, as part of the other recommended lifestyle interventions and pharmacological therapies, may positively improve BP control outcomes in the US adult population.
Conclusion
The present study examined the relationship between habitual sleep duration and blood pressure control in adults with hypertension. The findings show that a habitual sleep duration of <6 hours is associated with lower odds of blood pressure control when compared to the normative sleep duration (7–9 hours of sleep). There was no age or gender difference in the relationship between habitual sleep duration and BP control. The findings suggest that promoting adequate sleep in individuals who have hypertension as part of the other recommended hypertension management guidelines may positively impact their BP control. These measures may be especially impactful in those reporting a habitual sleep duration of <6 hours. However, since this was an observational cross-sectional study, future longitudinal studies are recommended to examine causal relationships between habitual sleep duration and hypertension control.
Funding
This project was partly supported by Betty Irene Moore School of Nursing through Gordon and Betty Moore Foundation grant GBMF4294.
Disclosure
The authors declare no conflict of interest in this work.
References
1. US Department of Health and Human Services. Centers for Disease Control and Prevention. Hypertension cascade: hypertension prevalence, treatment and control estimates among us adults aged 18 years and older applying the criteria from the American College of Cardiology and American Heart Association’s 2017 hypertension guideline—NHANES 2015–2018. Available from: https://millionhearts.hhs.gov/data-reports/hypertension-prevalence.html.
2. Whelton PK, Carey RM, Aronow WS, et al. 2017 ACC/AHA/AAPA/ABC/ACPM/AGS/APhA/ASH/ASPC/NMA/PCNA guideline for the prevention, detection, evaluation, and management of high blood pressure in adults: a report of the American College of Cardiology/American Heart Association task force on clinical practice guidelines. Hypertension. 2018;71(6):e13–e115. doi:10.1161/HYP.0000000000000065
3. Murphy SL, Xu J, Kochanek KD, Arias E, Tejada-Vera B; National Center for Health Statistics. Deaths: final data for 2018. Available from: https://www.cdc.gov/nchs/data/nvsr/nvsr69/nvsr69-13-508.pdf.
4. Centers for Disease Control and Prevention. Data and statistics - short sleep duration among US adults; 2017. Available from: https://www.cdc.gov/sleep/data_statistics.html.
5. Watson NF, Badr MS, Belenky G, et al. Joint consensus statement of the American Academy of Sleep Medicine and Sleep Research Society on the recommended amount of sleep for a healthy adult: methodology and discussion. Sleep. 2015;38(8):1161–1183. doi:10.5665/sleep.4886
6. Saxena T, Ali AO, Saxena M. Pathophysiology of essential hypertension: an update. Expert Rev Cardiovasc Ther. 2018;16(12):879–887. doi:10.1080/14779072.2018.1540301
7. Hall ME, Hall JE. Pathogenesis of hypertension. In: George L, Bakris, Sorrentino MJ, editors. Hypertension: A Companion to Braunwald’s Heart Disease.
8. Li H, Ren Y, Wu Y, Zhao X. Correlation between sleep duration and hypertension: a dose-response meta-analysis. J Hum Hypertens. 2019;33(3):218–228. doi:10.1038/s41371-018-0135-1
9. Grandner M, Mullington JM, Hashmi SD, Redeker NS, Watson NF, Morgenthaler TI. Sleep duration and hypertension: analysis of > 700,000 adults by age and sex. J Clin Sleep Med. 2018;14(6):1031–1039. doi:10.5664/jcsm.7176
10. Jackowska M, Steptoe A. Sleep and future cardiovascular risk: prospective analysis from the English longitudinal study of ageing. Sleep Med. 2015;16(6):768–774. doi:10.1016/j.sleep.2015.02.530
11. Okunowo O, Orimoloye HT, Bakre SA, Njesada NS, Solomon A. Age- and body weight-dependent association between sleep duration and hypertension in US adults: findings from the 2014–2017 national health interview survey. Sleep Health. 2019;5(5):509–513. doi:10.1016/j.sleh.2019.05.003
12. Yadav D, Hyun DS, Ahn SV, Koh SB, Kim JY. A prospective study of the association between total sleep duration and incident hypertension. J Clin Hypertens. 2017;19(5):550–557. doi:10.1111/jch.12960
13. Matthews EE, Li C, Long CR, Narcisse MR, Martin BC, McElfish PA. Sleep deficiency among Native Hawaiian/Pacific Islander, black, and white Americans and the association with cardiometabolic diseases: analysis of the national health interview survey data. Sleep Health. 2018;4(3):273–283. doi:10.1016/j.sleh.2018.01.004
14. Gangwisch JE, Feskanich D, Malaspina D, Shen S, Forman JP. Sleep duration and risk for hypertension in women: results from the nurses’ health study. Am J Hypertens. 2013;26(7):903–911. doi:10.1093/ajh/hpt044
15. Lusardi P, Zoppi A, Preti P, Pesce RM, Piazza E, Fogari R. Effects of insufficient sleep on blood pressure in hypertensive patients: a 24-h study. Am J Hypertens. 1999;12(1):63–68. doi:10.1016/s0895-7061(98)00200-3
16. Lusardi P, Mugellini A, Preti P, Zoppi A, Derosa G, Fogari R. Effects of a restricted sleep regimen on ambulatory blood pressure monitoring in normotensive subjects. Am J Hypertens. 1996;9(5):503–505. doi:10.1016/0895-7061(95)00389-4
17. Ogawa Y, Kanbayashi T, Saito Y, et al. Total sleep deprivation elevates blood pressure through arterial baroreflex resetting: a study with microneurographic technique. Sleep. 2003;26(8):986–989. doi:10.1093/sleep/26.8.986
18. Yang H, Haack M, Gautam S, Meier-Ewert HK, Mullington JM. Repetitive exposure to shortened sleep leads to blunted sleep-associated blood pressure dipping. J Hypertens. 2017;35(6):1187–1194. doi:10.1097/HJH.0000000000001284
19. Li J, Gooneratne NS. Sleep and health in older adults. In Grandner MA, editor. Sleep and Health.
20. Wang Y, Mei H, Jiang YR, et al. Relationship between duration of sleep and hypertension in adults: a meta-analysis. J Clin Sleep Med. 2015;11(9):1047–1056. doi:10.5664/jcsm.5024
21. Hu L, Huang X, You C, et al. Relationship of sleep duration on workdays and non-workdays with blood pressure components in Chinese hypertensive patients. Clin Exp Hypertens. 2019;41(7):627–636. doi:10.1080/10641963.2018.1529777
22. Zipf G, Chiappa M, Porter KS, Ostchega Y, Lewis BG, Dostal J. National health and nutrition examination survey: plan and operations, 1999–2010. Vital Health Statistics. 2013. Available from: https://www.cdc.gov/nchs/data/series/sr_01/sr01_056.pdf.
23. Centers for Disease Control and Prevention. NHANES questionnaires, datasets, and related documentation. Available from: https://wwwn.cdc.gov/nchs/nhanes/.
24. U.S. Department of Health and Human Services, Centers for Disease Control and Prevention. Centers for Disease Control and Prevention, National Center for Health Statistics. NHANES response rates and population totals. Available from: https://wwwn.cdc.gov/nchs/nhanes/responserates.aspx.
25. Jager KJ, Zoccali C, Macleod A, Dekker FW. Confounding: what it is and how to deal with it. Kidney Int. 2008;73(3):256–260. doi:10.1038/sj.ki.5002650
26. Levey AS, Eckardt K-U, Tsukamoto Y, et al. Definition and classification of chronic kidney disease: a position statement from Kidney Disease: Improving Global Outcomes (KDIGO). Kidney Int. 2005;67(6):2089–2100. doi:10.1111/j.1523-1755.2005.00365.x
27. Levey AS, Stevens LA, Schmid CH, et al. A new equation to estimate glomerular filtration rate. Ann Intern Med. 2009;150(9):604–612. doi:10.7326/0003-4819-150-9-200905050-00006
28. Murphy D, McCulloch CE, Lin F, et al. Trends in prevalence of chronic kidney disease in the United States. Ann Intern Med. 2016;165(7):473–481. doi:10.7326/M16-0273
29. Centers for Disease Control and Prevention. Physician examination procedures manual. Centers for Disease Control and Prevention; 2018.
30. Ostchega Y, Zhang G, Hughes JP, Nwankwo T. Factors associated with hypertension control in US adults using 2017 ACC/AHA guidelines: national health and nutrition examination survey 1999–2016. Am J Hypertens. 2018;31(8):886–894. doi:10.1093/ajh/hpy047
31. Dinkler JM, Sugar CA, Escarce JJ, Ong MK, Mangione CM. Does age matter? Association between usual source of care and hypertension control in the US population: data from NHANES 2007–2012. Am J Hypertens. 2016;29(8):934–940. doi:10.1093/ajh/hpw010
32. Lee SY, Waring ME, Park CL, Blake EC. Do depressive symptoms predict blood pressure control in us veterans?. J Gen Intern Med. 2022;37(1):57–63. doi:10.1007/s11606-021-06709-5
33. Carnethon MR, De Chavez PJ, Zee PC, et al. Disparities in sleep characteristics by race/ethnicity in a population-based sample: Chicago area sleep study. Sleep Med. 2016;18:50–55. doi:10.1016/j.sleep.2015.07.005
34. Cunningham TJ, Wheaton AG, Ford ES, Croft JB. Racial/ethnic disparities in self-reported short sleep duration among US-born and foreign-born adults. Ethn Health. 2016;21(6):628–638. doi:10.1080/13557858.2016.1179724
35. Gu A, Yue Y, Desai RP, Argulian E. Racial and ethnic differences in antihypertensive medication use and blood pressure control among US adults with hypertension: the national health and nutrition examination survey, 2003 to 2012. Circ Cardiovasc Qual Outcomes. 2017;10(1). doi:10.1161/CIRCOUTCOMES.116.003166
36. Ogugu EG, Catz SL, Bell JF, Drake C, Bidwell JT, Gangwisch JE. Factors associated with habitual sleep duration in US adults with hypertension: a cross-sectional study of the 2015–2018 national health and nutrition examination survey. BMC Public Health. 2022;22(1). doi:10.1186/s12889-021-12465-2
37. United States Census Bureau. Historical income tables: households. Available from: https://www.census.gov/data/tables/time-series/demo/income-poverty/historical-income-households.html.
38. Geronimus AT, Pearson JA, Linnenbringer E, et al. Weathering in Detroit: place, race, ethnicity, and poverty as conceptually fluctuating social constructs shaping variation in allostatic load. Milbank Q. 2020;98(4):1171–1218. doi:10.1111/1468-0009.12484
39. Healthy People 2020. U.S. Department of Health and Human Services, Office of Disease Prevention and Health Promotion. Sleep health data details. Available from: https://www.healthypeople.gov/node/3506/data-details.
40. Scinicariello F, Buser MC, Feroe AG, Attanasio R. Antimony and sleep-related disorders: NHANES 2005–2008. Environ Res. 2017;156:247–252. doi:10.1016/j.envres.2017.03.036
41. Kroenke K, Spitzer RL, Williams JBW. The PHQ-9: validity of a brief depression severity measure. J Gen Intern Med. 2001;16(9):606–613. doi:10.1046/j.1525-1497.2001.016009606.x
42. American Diabetes Association. Classification and diagnosis of diabetes: standards of medical care in diabetes—2021. Diabetes Care. 2021;44(Supplement 1):S15–S33. doi:10.2337/dc21-s002.
43. Centers for Disease Control and Prevention, National Center for Health Statistics. National health and nutrition examination survey 2017–2018 data documentation, codebook, and frequencies: physical activity (PAQ_J). Available from: https://wwwn.cdc.gov/Nchs/Nhanes/2017-2018/PAQ_J.htm.
44. 2018 Physical Activity Guidelines Advisory Committee. 2018 Physical activity guidelines advisory committee scientific report. U.S. Department of Health and Human Services. Available from: https://health.gov/sites/default/files/2019-09/PAG_Advisory_Committee_Report.pdf.
45. U.S. Department of Health and Human Services. U.S. department of agriculture. 2015 – 2020 dietary guidelines for Americans. Available from: http://health.gov/dietaryguidelines/2015/guidelines/.
46. Multum C. Drug database. Cerner corporation. Available from: https://www.cerner.com/solutions/drug-database.
47. Lie JD, Tu KN, Shen DD, Wong BM. Pharmacological treatment of insomnia. P T. 2015;40(11):759–771.
48. Royston P, White IR. Multiple Imputation by Chained Equations (MICE): implementation in stata. J Stat Softw. 2011;45(4):1–20. doi:10.18637/jss.v045.i04
49. StataCorp. Stata multiple-imputation reference manual: release 15. Stata Press; 2017.
50. StataCorp. Stata User’s Guide: release 15. College Station, Texas: StataCorp LLC; 2017.
51. Grandner MA, Chakravorty S, Perlis ML, Oliver L, Gurubhagavatula I. Habitual sleep duration associated with self-reported and objectively determined cardiometabolic risk factors. Sleep Med. 2014;15(1):42–50. doi:10.1016/j.sleep.2013.09.012
52. Gangwisch JE. A review of evidence for the link between sleep duration and hypertension. Am J Hypertens. 2014;27(10):1235–1242. doi:10.1093/ajh/hpu071
53. Javaheri S, Omobomi O, Redline S. Insufficient sleep and cardiovascular disease risk. In: Grandner MA, editor. Sleep and Health. Academic Press; 2019.
54. Lanfranchi PA, Pépin J-L, Somers VK. Cardiovascular physiology: autonomic control in health and in sleep disorders. In Kryger M, Roth T, Dement WC, editors. Principles and Practice of Sleep Medicine.
55. Sauvet F, Drogou C, Bougard C, et al. Vascular response to 1 week of sleep restriction in healthy subjects. A metabolic response? Int J Cardiol. 2015;190:246–255. doi:10.1016/j.ijcard.2015.04.119
56. Broussard JL, Ehrmann DA, Van Cauter E, Tasali E, Brady MJ. Impaired insulin signaling in human adipocytes after experimental sleep restriction. Ann Intern Med. 2012;157(8):549–557. doi:10.7326/0003-4819-157-8-201210160-00005
57. Baron KG, Culnan E. Sleep and healthy decision making. In: Grandner MA, editor. Sleep and Health. Academic Press; 2019.
58. Hossain A, Mithila O. Sleep duration and treatment compliance: a population-based cross-sectional study of hypertensive patients in Bangladesh. BMC Res Notes. 2016;9(1). doi:10.1186/s13104-016-2075-6
59. Reid KJ, Weng J, Ramos AR, et al. Impact of shift work schedules on actigraphy-based measures of sleep in Hispanic workers: results from the Hispanic Community Health Study/Study of Latinos ancillary Sueno study. Sleep. 2018;41(10). doi:10.1093/sleep/zsy131
60. Riegel B, Daus M, Lozano AJ, Malone SK, Patterson F, Hanlon AL. Shift workers have higher blood pressure medicine use, but only when they Are short sleepers: a longitudinal UK biobank study. J Am Heart Assoc. 2019;8(20). doi:10.1161/jaha.119.013269
61. Muntner P, Shimbo D, Carey RM, et al. Measurement of blood pressure in humans: a scientific statement from the American Heart Association. Hypertension. 2019;73(5):e35–e66. doi:10.1161/HYP.0000000000000087
 © 2022 The Author(s). This work is published and licensed by Dove Medical Press Limited. The
full terms of this license are available at https://www.dovepress.com/terms
and incorporate the Creative Commons Attribution
- Non Commercial (unported, 3.0) License.
By accessing the work you hereby accept the Terms. Non-commercial uses of the work are permitted
without any further permission from Dove Medical Press Limited, provided the work is properly
attributed. For permission for commercial use of this work, please see paragraphs 4.2 and 5 of our Terms.
© 2022 The Author(s). This work is published and licensed by Dove Medical Press Limited. The
full terms of this license are available at https://www.dovepress.com/terms
and incorporate the Creative Commons Attribution
- Non Commercial (unported, 3.0) License.
By accessing the work you hereby accept the Terms. Non-commercial uses of the work are permitted
without any further permission from Dove Medical Press Limited, provided the work is properly
attributed. For permission for commercial use of this work, please see paragraphs 4.2 and 5 of our Terms.