Back to Journals » Journal of Hepatocellular Carcinoma » Volume 9
The Abnormal Proliferation of Hepatocytes is Associated with MC-LR and C-Terminal Truncated HBX Synergistic Disturbance of the Redox Balance
Authors Cai DM, Mei FB, Zhang CJ, An SC, Lv RB, Ren GH, Xiao CC, Long L, Huang TR, Deng W ![]()
Received 12 September 2022
Accepted for publication 23 November 2022
Published 5 December 2022 Volume 2022:9 Pages 1229—1246
DOI https://doi.org/10.2147/JHC.S389574
Checked for plagiarism Yes
Review by Single anonymous peer review
Peer reviewer comments 3
Editor who approved publication: Dr David Gerber
Dong-Mei Cai,1,* Fan-Biao Mei,1,* Chao-Jun Zhang,1 San-Chun An,1 Rui-Bo Lv,1 Guan-Hua Ren,1 Chan-Chan Xiao,1 Long Long,1,2 Tian-Ren Huang,1,2 Wei Deng1,2
1Department of Experimental Research, Guangxi Medical University Cancer Hospital, Nanning, Guangxi, 530021, People’s Republic of China; 2Guangxi Cancer Molecular Medicine Engineering Research Center, Nanning, Guangxi, 530021, People’s Republic of China
*These authors contributed equally to this work
Correspondence: Wei Deng; Tianren Huang, Department of Experimental Research, Guangxi Medical University Cancer Hospital, No. 71, Hedi Road, Nanning, Guangxi, 530021, People’s Republic of China, Email [email protected]; [email protected]
Background: Microcystin-LR (MC-LR) and hepatitis B virus (HBV) are associated with hepatocellular carcinoma (HCC). However, the concentrations of MC-LR in drinking water and the synergistic effect of MC-LR and HBV on hepatocellular carcinogenesis through their disturbance of redox balance have not been fully elucidated.
Methods: We measured the MC-LR concentrations in 168 drinking water samples of areas with a high incidence of HCC. The relationships between MC-LR and both redox status and liver diseases in 177 local residents were analyzed. The hepatoma cell line HepG2 transfected with C-terminal truncated hepatitis B virus X gene (Ct-HBX) were treated with MC-LR. Reactive oxygen species (ROS), superoxide dismutase (SOD), glutathione (GSH) and malondialdehyde (MDA) were measured. Cell proliferation, migration, invasion, and apoptosis were assessed with cell activity assays, scratch and transwell assays, and flow cytometry, respectively. The mRNA and protein expression-related redox status genes were analyzed with qPCR and Western blotting.
Results: The average concentration of MC-LR in well water, river water and reservoir water were 57.55 ng/L, 76.74 ng/L and 132.86 ng/L respectively, and the differences were statistically significant (P < 0.05). The MC-LR levels in drinking water were correlated with liver health status, including hepatitis, clonorchiasis, glutamic pyruvic transaminase abnormalities and hepatitis B surface antigen carriage (all P values < 0.05). The serum MDA increased in subjects who drank reservoir water and were infected with HBV (P < 0.05). In the cell experiment, ROS increased when Ct-HBX-transfected HepG2 cells were treated with MC-LR, followed by a decrease in SOD and GSH and an increase in MDA. MC-LR combined with Ct-HBX promoted the proliferation, migration and invasion of HepG2 cells, upregulated the mRNA and protein expression of MAOA gene, and downregulated UCP2 and GPX1 genes.
Conclusion: MC-LR and HBV may synergistically affect redox status and play an important role in hepatocarcinoma genesis.
Keywords: hepatocellular carcinoma, microcystins-LR, hepatitis B virus X gene, redox balance
Introduction
Hepatitis B virus (HBV) infection, aflatoxin intake and microcystin-polluted drinking water have been verified the major three risk factors of liver cancer in high incidence areas of China since 1980s.1–3 In recent decades, through a series of comprehensive liver cancer preventive measures, such as vaccination against hepatitis B, elimination of aflatoxin in food and projects to renovate water sources, the hepatitis B surface antigen (HBsAg) carrying rate in China has decreased from 9.75% in 1992 to 5–6% in 2019;4,5 moreover, aflatoxin is now seldom present in food,6–8 and algal blooms in large lakes, such as Taihu Lake, and microcystin pollution in drinking water have also been effectively governed and controlled.9 As a result, the rising trend in liver cancer crude incidence in China has also been controlled and maintained at 26.92/100,000 in recent years, and the age-standardized incidence rate by Chinese standard population was 17.64/100,000.10 However, in the same period, the crude and age-standardized incidence rates of liver cancer in some high incidence areas, such as Guangxi, declined slowly and have been higher than the national average, reached to 45.61/100,000 and 37.98/100,000 respectively in 2016.11 The HBsAg positive rate in local people with a high incidence of liver cancer was also higher than the national average, with a positive rate of 20.21% in men aged 35 to 64 years old and of 13.18% in women aged 40 to 64 years old;12 In terms of the HBV genotype and genetic variation, the high incidence areas with a higher HBV infection rate dominated by HBV C genotype, while the low incidence areas were dominated by HBV B genotype.13,14 Moreover, Microcystins-LR (MC-LR) was detected in local water sources in the high incidence areas.15 However, the levels of MC-LR pollution in different drinking water sources, the synergistic effect of MC-LR and specific HBV infection on the pathogenesis of hepatocellular carcinoma and the mechanism involved have not been fully clarified.
MC-LR is toxic to liver cells and has been confirmed in many studies to promote abnormal hepatocyte proliferation, invasion and migration,16–19 and is also related to apoptosis and cell cycle changes.20,21 In addition, long-term exposure to MC-LR can induce human hepatitis and even hepatocellular carcinoma.22 However, the mechanism by which MC-LR is involved in the pathogenesis of hepatocellular carcinoma is still unclear. Moreover, disturbance of redox status due to MC-LR has recently become a concern. Several studies have shown that MC-LR can induce damage to hepatocytes by producing excessive reactive oxygen species (ROS), leading to oxidant/antioxidant system disorders, lipid peroxidation, and oxidative stress.23–25 Regarding the relationship between HBV and hepatocellular carcinoma, previous studies have shown that fragments of HBV DNA can be detected in 80% ~ 90% of human chromosomes in liver tissues of HBV-related hepatocellular carcinoma patients,26 and that more than half of the integrated fragments are the HBV X gene (HBX).27,28 HBX, with a full length of 465 bp, is usually integrated into human chromosomes in the form of a C-terminal truncation.29–31 Our previous study also revealed that 4 amino acid and 32 amino acid deletions in the C-terminus of HBX (HBXΔ4 and HBXΔ32) were the most common integrated fragments of the HBV genome found in Infected people in areas with high incidence of liver cancer. These two C-terminal truncated hepatitis B virus X (Ct-HBX) have been shown to play an important role in the occurrence and development of hepatocellular carcinoma.32–34 HBX can significantly increase the level of ROS in the liver of transgenic mice expressing HBX protein,35 leading to the loss of mitochondrial membrane potential, inducing mitochondrial-dependent cell death, and causing oxidative stress damage in hepatocytes and the occurrence of hepatitis and HCC.36–38 Therefore, the disturbance in hepatocyte redox status due to MC-LR and Ct-HBX may be related to the occurrence and development of hepatocellular carcinoma. However, the synergistic effects of MC-LR and Ct-HBX on cell ROS levels and oxidation/antioxidation systems have not been elucidated, and there is a need to explore whether the synergistic effects can lead to more serious cytotoxicity or carcinogenesis.
In this study, we first used high-performance liquid chromatography (HPLC) to investigate the level of MC-LR in the local water of a region with high liver cancer incidence and we analyzed the relationship of MC-LR concentrations with HBV infection, redox index, and liver diseases in local residents. Then, we performed a series of cell experiments in the hepatoma cell line HepG2 to explore the effects of MC-LR and Ct-HBX on cell redox balance, viability, invasion, migration and apoptosis. In addition, we examined the expression levels of 9 redox-related genes and the proteins they encode and conducted a preliminary analysis of the mechanism of MC-LR combined with Ct-HBX on hepatocyte carcinogenesis.
Materials and Methods
Water Sample Collection and Determination of MC-LR Concentration
A total of 168 water samples, including well water (n=72), river water (n=84) and reservoir water (n=12), were collected from sampling sites in the high liver cancer incidence area. Each bottle of water sample was 500mL. After collection, the water sample was stored and precipitated at 4°C for 24 h, filtered through a 0.45 μm filter membrane, extracted with a solid phase extraction column, and finally concentrated to 1 mL with 100% methanol, ultra-pure water and 0.05% trifluoroacetic acid. The concentration of MC-LR was tested by HPLC (LC-20A; Shimadzu, Kyoto, Kyoto, Prefecture, Japan) according to one of our previous studies.39 The details of the water sample collection and detection methods are shown in Supplementary Material 1.
Investigation of Health Status in the Residents of Areas with High Liver Cancer Incidence
A total of 177 local residents (40~65 years old, 98 males and 79 females) were randomly selected from the three types of water sample sites abovementioned in the area with high incidence of liver cancer. The residents who lived around the same water sample collection site were all from the same village, where the living habits of the local villagers and the weather conditions are generally consistent, and the water samples we collected was derived from the main source of their daily drinking. The demographic characteristics of the subjects, the history of hepatitis and clonorchiasis, as well as the family history of liver cancer, were investigated by questionnaire. Blood samples were collected from the subjects, and serum HBsAg and glutamic pyruvic transaminase (GPT) were analyzed with an enzyme-linked immunosorbent assay (ELISA). The redox indexes, including superoxide dismutase (SOD), glutathione (GSH) and malondialdehyde (MDA), in serum were also measured with ELISA. Finally, the relationship between liver disease and drinking water was analyzed. The synergistic effects of drinking water and HBV infection on the serum redox index measurements of the residents were analyzed simultaneously.
Construction of HBX Transfection Cell Lines and MC-LR Exposure
The human hepatocellular carcinoma cell line HepG2 was purchased from Shanghai Shenggong Bioengineering Co., Ltd., China. The cell genetic quality identification report is detailed in Supplementary Material 2. The cells were cultured with Dulbecco’s modified Eagle medium (DMEM; Gibco, USA) containing 10% fetal bovine serum (FBS; Gibco, USA), 100 μg/mL streptomycin (HyClone, USA), and 100 U/mL penicillin (HyClone, USA) in a 5% CO2 incubator at 37 °C. The construction of the HBXΔ32, HBXΔ4 and HBX eukaryotic expression vectors and the packaging of the virus were performed and confirmed by Shenggong Bioengineering Co., Ltd. (Shanghai, China). The packaged lentivirus was transfected into HepG2 cells, and the cell lines stably expressing the vector genes were selected and named the HBXΔ32, HBXΔ4 and HBX transfection groups, which were used in the follow-up cell experiments together with the negative control group (NC group) which represents a lentiviral vector with an empty plasmid. The HepG2 transfection map can be seen in Supplementary Material 3. MC-LR (purity > 95%) was purchased from Beijing Express Technology Co., Ltd., dissolved in DMEM to a concentration of 1 mg/mL and frozen at −20 °C for later use.
Cell Activity Assay
First, 100 μL of complete medium containing 0, 10, 20, 30, 50, or 100 μM MC-LR was added to the well plate and incubated with HepG2 cells in the logarithmic growth phase of the HBXΔ32, HBXΔ4, HBX and NC groups. After 12 h, 24 h, 36 h and 48 h of culture, 10 μL of Cell-Counting Kit 8 (CCK8) solution was added to each well and the cells were incubated in the cell incubator for 2 h following the CCK8 manufacturer’s protocol (Dojindo, Japan). Then, the optical density (OD) value was tested at 450 nm by using an enzyme labeling instrument to assess the cell activity after MC-LR coculture.
Determination of Total Intracellular ROS Activity
HepG2 cells in the logarithmic growth phase of the HBXΔ32, HBXΔ4, HBX and NC groups were digested with trypsin and seeded in 96-well plates at a density of approximately 30,000 cells/100 μL/well in two replicate wells. The plates were wrapped with aluminum foil paper in the dark, placed in an incubator for 12 h, and then replenished with complete medium containing 0, 5, 10, 15, or 20 μM MC-LR. After 12 h, 24 h, 36 h and 48 h of culture, the intracellular ROS level was measured according to the instructions of a total intracellular ROS activity detection kit (AAT Bioquest, USA).
Detection of Intracellular SOD, GSH and MDA
HepG2 cells in the logarithmic growth phase of the HBXΔ32, HBXΔ4, HBX and NC groups were digested with trypsin and seeded in 6-well plates at a density of 3×10⁵ cells/mL. The cells were cultured at 37 °C for 24 h and then replenished with complete medium containing 0, 5, 10, 15 and 20 μM MC-LR for 12 h, 24 h, 36 h and 48 h, respectively. Then, the cells were treated with SOD, GSH and MDA detection kits (all purchased from Biyuntian Biological Co., Ltd.; Shanghai, China) according to the manufacturer’s instructions, and the supernatant was taken to determine the OD value with the enzyme labeling instrument to assess the levels of intracellular SOD, GSH and MDA.
Scratch Assay
HepG2 cells in the logarithmic growth phase of the HBXΔ32, HBXΔ4, HBX and NC groups were digested by using trypsin and were inoculated into 6-well plates. Serum-free culture medium with final concentrations of 0 μM and 20 μM MC-LR was added (according to the results of the above two experiments). The scratches at 0 h and after 24 h of incubation were imaged with a microscope (X 100 magnification, Leica DM4000B; Leica Microsystems, Wetzlar, Germany) to assess the cell migration distances.
Transwell Assay
Cell invasion and migration were assessed by using a transwell assay. The transwell chambers (8-μm well, Corning, NY, USA) were coated with or without 50 μL Matrigel (FBS-free medium diluted 1:6, Corning, NY, USA) and then dried at 37°C for 4 h. The cells were suspended in FBS-free medium at a density of 2×10⁵ cells/mL. Then, 100 μL of HepG2 cell suspension of HBXΔ32, HBXΔ4, HBX and NC groups were inoculated into the upper chamber, and 600 μL medium containing 20 μM MC-LR was added to the lower chamber. After 48 h of culture, the chamber was removed, and the upper chamber and Matrigel were wiped with cotton swabs, fixed with methanol for 20 minutes, stained with 0.1% crystal violet for 10 minutes, and washed twice with PBS. Images were obtained by using an optical microscope (X 200 magnification, Olympus Corporation, Tokyo, Japan) according to the instructions of the manufacturer.
Flow Cytometry
HepG2 cells in the logarithmic growth phase of the HBXΔ32, HBXΔ4, HBX and NC groups were inoculated in 6-well plates after trypsin digestion. After treatment with 0 and 20 μM MC-LR for 48 h, cell apoptosis was detected by an APC-Annexin V and 7-AAD apoptosis detection kit (BD Bioscience, Bedford, NY, USA) according to the instructions.
Quantitative Reverse Transcription-Polymerase Chain Reaction (qRT‒PCR)
HepG2 cells in the HBXΔ32, HBXΔ4 and HBX groups were cultured for 48 h after adding MC-LR (20 μM), and total RNA was extracted with a MiniBEST Universal RNA Extraction Kit (Takara, Japan). A reverse transcriptase kit (Takara, Kusatsu, Japan) was used to prepare cDNA, and the cDNA was used as a template to detect the mRNA expression levels of 9 common genes related to ROS regulation, including GSR, NQO1, MAOA, UCP2, NOS3, GPX1, SOD2, SOD1 and GCLC. The corresponding primers are shown in Table 1 and were synthesized by Guangzhou IGE Biotechnology Co., Ltd. Finally, with GAPDH as the internal control, the relative expression levels of the target gene mRNAs were calculated by the 2−ΔΔCT method.
 |
Table 1 Internal Reference and Primer Sequence of the Target Gene |
Western Blot
HepG2 cells in the HBXΔ32, HBXΔ4 and HBX groups were cultured for 48 h after adding MC-LR (20 μM), and the total protein of the HepG2 cells was extracted with radio immunoprecipitation assay (RIPA) buffer containing 0.1% protease inhibitor (Solarbio, Beijing, China; Lot No. P1260). We used a preformed Biofuraw precast gel (Tianneng, Guangzhou, China; Lot No. 180–8001H) for Western blotting (WB), which is applicable for proteins with molecular weights from 10 to 180 kDa, equivalent to gel concentrations ranging from 4 to 20%. The immunoreactive bands were visualized using an enhanced chemiluminescence (ECL) WB detection reagent (Solarbio, Beijing, China) and then scanned using a Bio-Rad Universal Hood III (Bio-Rad, Hercules, CA, United States). The results were analyzed with ImageJ software (National Institutes of Health, USA). The relative expression of redox status-related proteins MAOA, GPX1 and UCP2 was evaluated with the ratio of the target proteins’ gray value and GAPDH. The antibodies used in this experiment included GAPDH antibody (CST, Lot No. 2118), MAOA (Abcam, Lot No. ab126751), GPX1 (Abcam, Lot No. ab108427) and UCP2 (Abcam, Lot No. ab97931).
Statistical Analysis
SPSS 24.0 statistical analysis software was used to process the data. The median MC-LR concentration in the water samples represented the level of MC-LR, which was compared by the rank-sum test in the difference groups. The chi-square test was used to analyze the correlation between the drinking water and the health status of the liver. Two-way ANOVA was used to analyze the synergistic effects of drinking water and HBV infection on the serum redox index measurements. The cytology experiments were repeated at least three times, and the results are shown as the mean ± standard deviation. The data derived from the cytology experiments were analyzed with one-way ANOVA. The difference was statistically significant when P < 0.05.
Results
MC-LR in Different Drinking Water Sources in Areas with High Incidence of Liver Cancer
The average concentrations of MC-LR in well water, river water and reservoir water were 57.55 ng/L, 76.74 ng/L and 132.86 ng/L, respectively. The differences in MC-LR concentrations between these three kinds of drinking water were statistically significant (P < 0.05). The MC-LR levels of drinking water in areas with high incidence of liver cancer did not exceed the World Health Organization (WHO) recommended criterion (1 μg/L).
The Relationship Between Drinking Water and the Liver Health Status of Residents in Areas with High Incidence of Liver Cancer
As shown in Table 2, 87 (49.2%) of the 177 subjects drank water from wells, 59 (33.30%) from rivers and 31 (17.5%) from reservoirs. Drinking water was correlated with liver health status, including hepatitis, clonorchiasis, GPT abnormalities and HBsAg carriage (all P values < 0.05). We further performed the stratified analyses by the age and gender of the subjects, and the results still showed the correlations of the liver diseases with three water types (Data shown in Supplementary Material 4). Furthermore, we explored the synergistic effects of drinking water and HBV infection on the serum redox index measurements, including those for SOD, GSH and MDA, and the results are shown in Table 3. The serum MDA increased in subjects who drank reservoir water and were infected with HBV (P < 0.05), but the difference in serum SOD was not statistically significant (P > 0.05). The GSH results were not analyzed in this study because the vast majority of subjects had serum GSH levels below the detection limit.
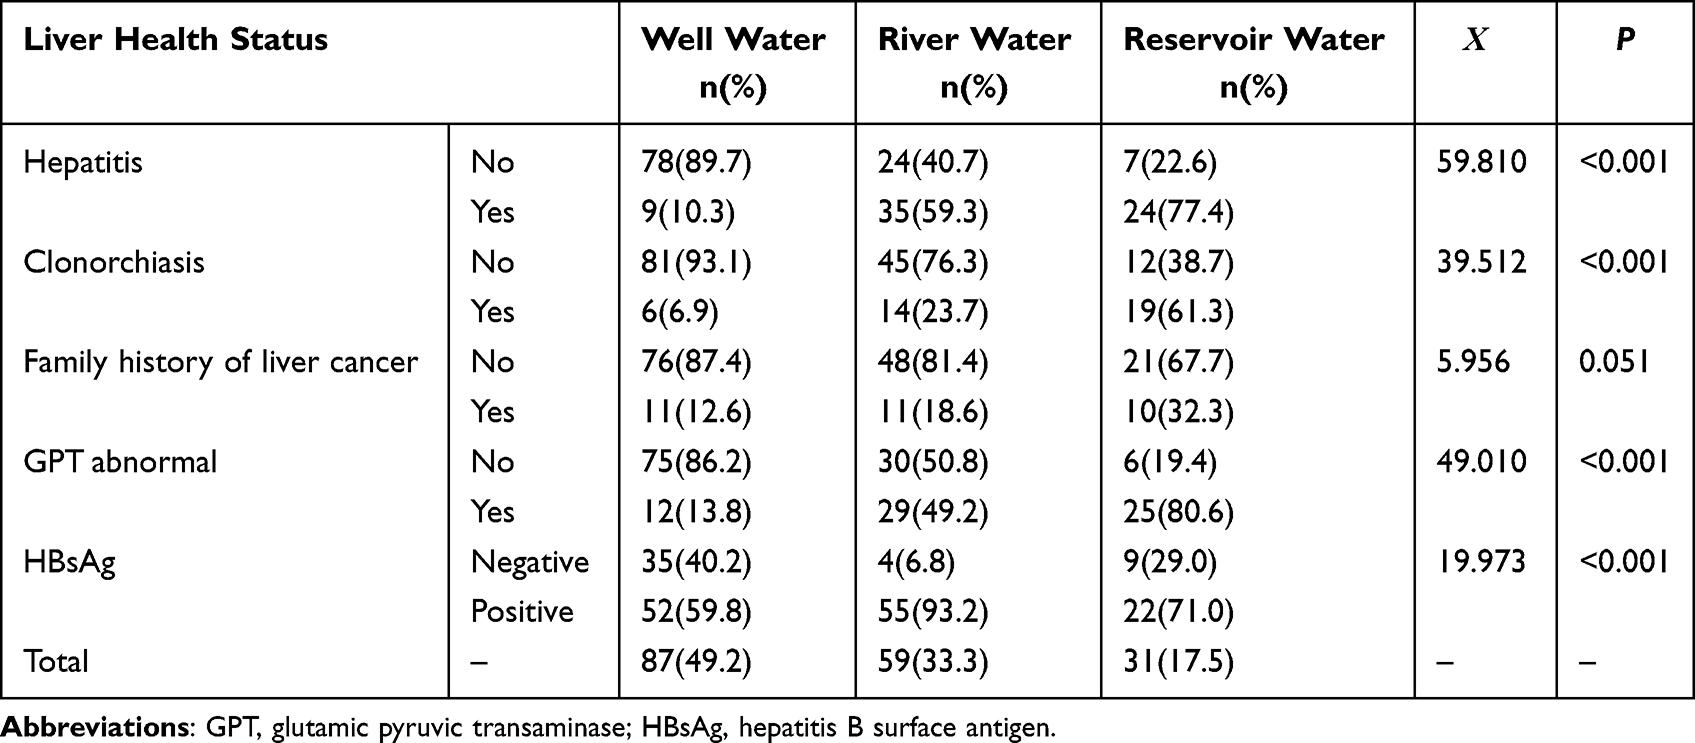 |
Table 2 The Relationship Between Drinking Water and the Liver Health Status of the Residents in Areas with High Incidence of Liver Cancer |
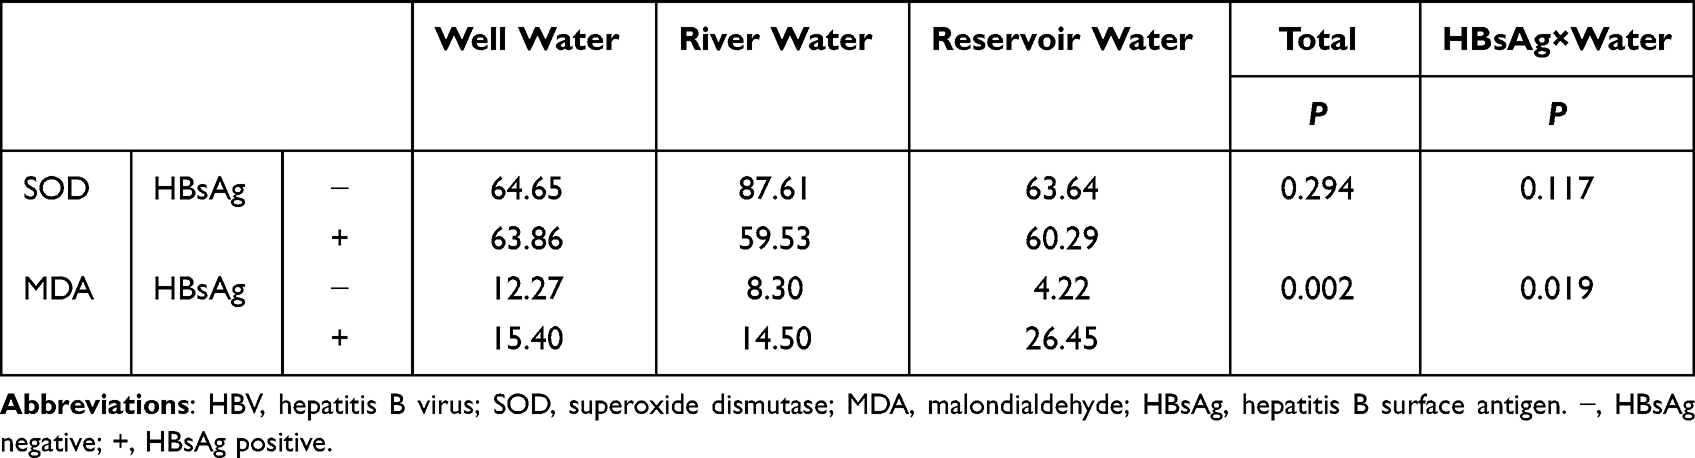 |
Table 3 The Synergistic Effect of Drinking Water and HBV Infection on Serum SOD(U/mL) and MDA(µM) of the Residents in Areas with High Incidence of Liver Cancer |
Effects of MC-LR and Ct-HBX on the Viability of HepG2 Cells
As shown in Figure 1, when incubated with MC-LR ≤ 20 μM from 0 h to 48 h, there was no significant difference in HepG2 cell viability in the HBXΔ32, HBXΔ4 and HBX group comparing with the NC group (All of P > 0.05). When MC-LR ≥ 30 μM, HepG2 cell viability decreased with increasing incubation time, and the declines were particularly significant in the HBXΔ32 and HBXΔ4 groups. These results suggested that when the intervention concentration of MC-LR was 20 μM or less, the HCC cell viability were not affected within 48 hours.
 |
Figure 1 The variation in cell viability in HepG2 cells after MC-LR exposure. There was no significant effect in the cell viability when MC-LR ≤ 20 µM and the exposure time ≤ 48 h in the (A) HBXΔ32, (B) HBXΔ4 and (C) HBX group comparing with the NC group, while the cell viability began to decrease when MC-LR ≥ 30 µM and the time ≥ 24 h. Data are presented as the percentage; *P < 0.05, **P < 0.01. Abbreviations: MC-LR, Microcystins-LR; HBXΔ32, the 32 amino acid deletions in the C-terminus of HBX; HBXΔ4, the 4 amino acid deletions in the C-terminus of HBX; HBX, Hepatitis B virus X gene; NC, negative control that represents a lentiviral vector with an empty plasmid. |
Effects of MC-LR and Ct-HBX on ROS Levels in HepG2 Cells
Figure 2 shows that the intracellular ROS levels in the HBXΔ32, HBXΔ4 and HBX groups began to increase when MC-LR ≥10 µM and the exposure time ≥ 12 h in a concentration-time-dependent manner and peaked at MC-LR =20 µM and the exposure time = 48 h, and were significantly higher than the NC group (All of P < 0.05), suggesting that the ROS activity in HCC cells was the highest when cocultured with 20 µM MC-LR for 48h.
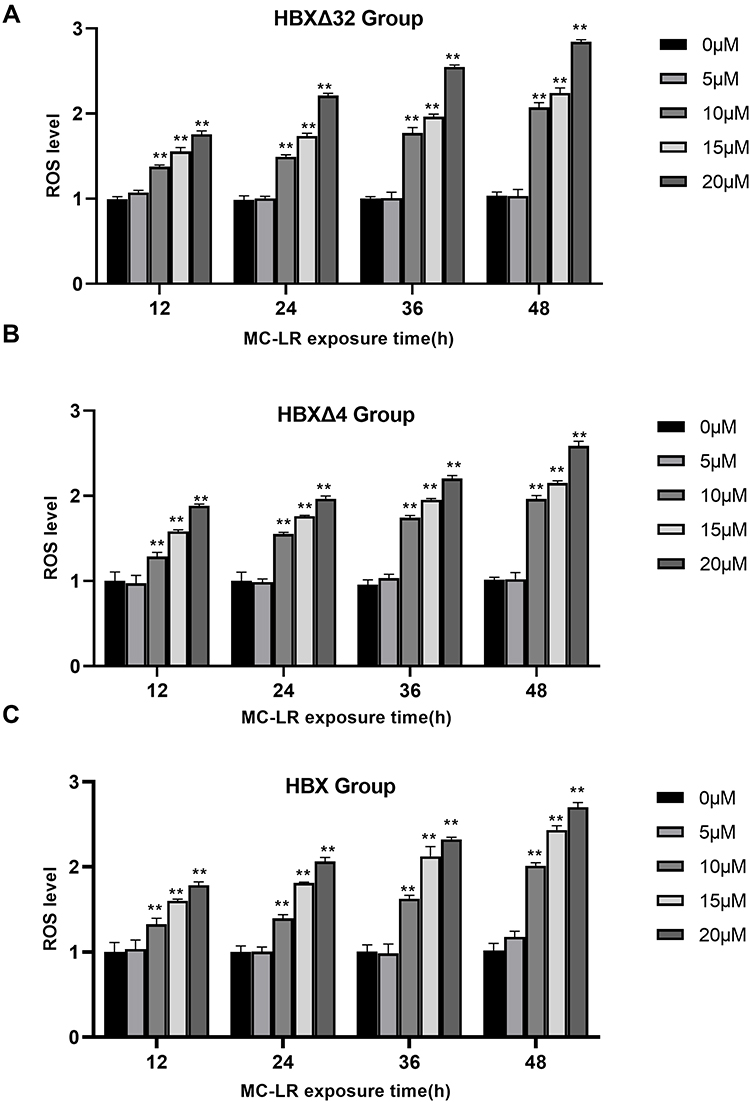 |
Figure 2 The variation in ROS levels in HepG2 cells after MC-LR exposure. The intracellular ROS levels in the (A) HBXΔ32, (B) HBXΔ4 and (C) HBX groups began to increase when MC-LR ≥ 10 µM and the exposure time ≥ 12 h in a concentration-time-dependent manner and peaked at MC-LR =20 µM and the exposure time = 48 h, and were significantly higher than the NC group. Data are presented as the ratio; *P < 0.05, **P < 0.01. Abbreviations: ROS, reactive Oxygen Species; MC-LR, Microcystins-LR; HBXΔ32, the 32 amino acid deletions in the C-terminus of HBX; HBXΔ4, the 4 amino acid deletions in the C-terminus of HBX; HBX, Hepatitis B virus X gene; NC, negative control that represents a lentiviral vector with an empty plasmid. |
Synergistic Effects of MC-LR and Ct-HBX on SOD, MDA and GSH in HepG2 Cells
Figure 3A and B show that the SOD activity and GSH concentration were negatively correlated with MC-LR in a concentration-dependent manner and reached the lowest point when MC-LR = 20 µM, whether in the HBXΔ32, HBXΔ4, HBX group or NC group (All of P > 0.05); Figure 3C shows the MDA concentration was positively correlated with MC-LR in a concentration-dependent manner in each group and peaked at MC-LR = 20 µM (All of P < 0.05). As shown in Figure 3D–F, When MC-LR = 0 µM, there were no statistically significant difference in the SOD activity, GSH and MDA concentration between the HBXΔ32, HBXΔ4, HBX group and NC group (All of P > 0.05); However, when cocultured with MC-LR = 5, 10, 15 or 20 µM, the SOD and GSH in the HBXΔ32, HBXΔ4, and HBX group were significantly higher than NC group, and the MDA was significantly lower, especially in the HBXΔ32 and HBXΔ4 group when MC-LR = 20 µM (All of P < 0.05). This suggested that the disturbance of the redox balance in HCC cells by Ct-HBX requires the existence of MC-LR.
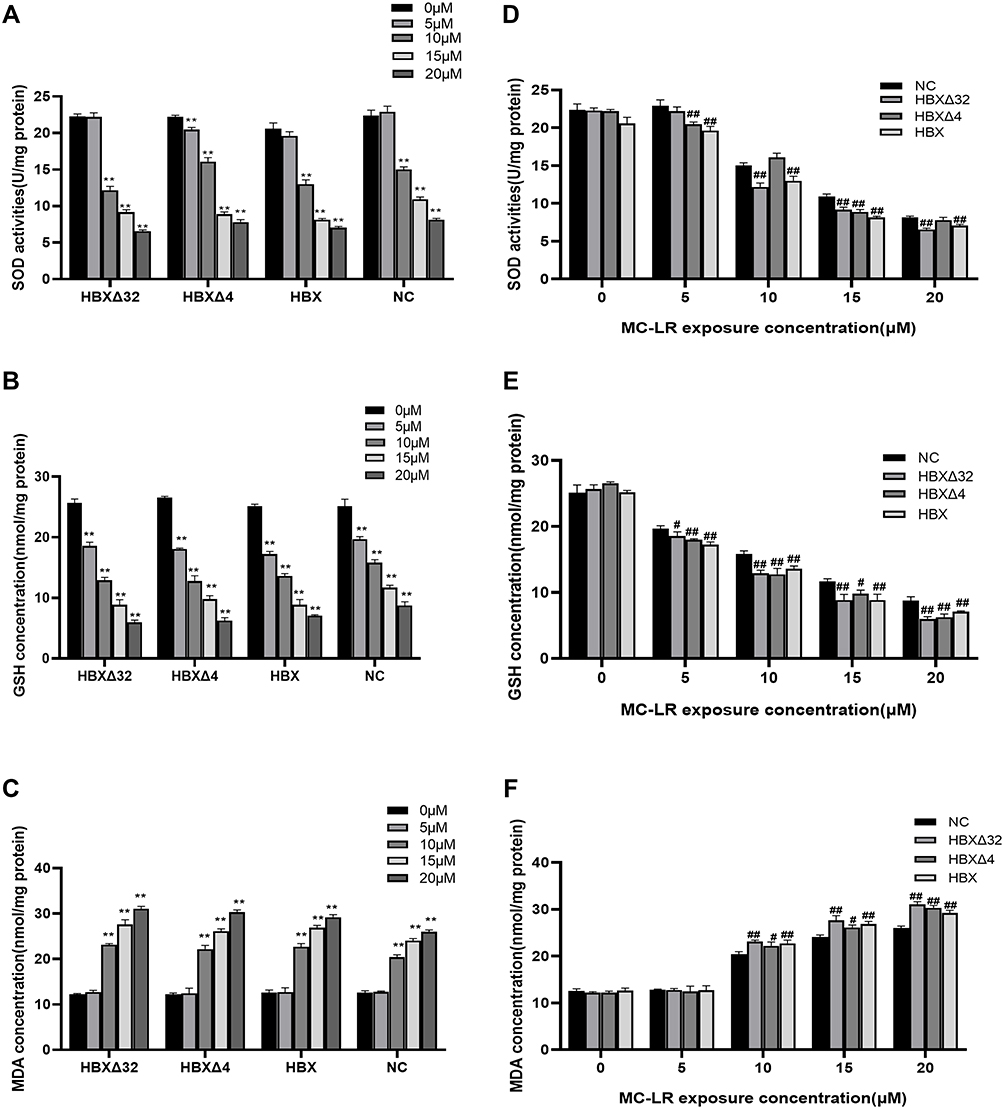 |
Figure 3 Synergistic effects of MC-LR and Ct-HBX on SOD, MDA and GSH in HepG2 cells. (A) The SOD activity and (B) GSH concentration were negatively correlated with MC-LR whether in the HBXΔ32, HBXΔ4 and HBX group or the NC group; (C) the MDA concentration was positively correlated with MC-LR in each group. (D–F) When MC-LR = 0 µM, there were no statistically significant difference in the SOD activity, GSH and MDA concentration between the HBXΔ32, HBXΔ4, HBX group and NC group; However, when cocultured with MC-LR = 5, 10, 15 or 20 µM, the SOD and GSH in the HBXΔ32, HBXΔ4, and HBX group were significantly higher than NC group, and the MDA was significantly lower. Data are presented as the mean ± SD; **P < 0.01 vs 0 µM MC-LR; #P < 0.05 and ##P < 0.01 vs NC group. Abbreviations: MC-LR, Microcystins-LR; HBXΔ32, the 32 amino acid deletions in the C-terminus of HBX; HBXΔ4, the 4 amino acid deletions in the C-terminus of HBX; HBX, Hepatitis B virus X gene; Ct-HBX, C-terminal truncated hepatitis B virus X; NC, negative control that represents a lentiviral vector with an empty plasmid; SOD, Superoxide dismutase; GSH, Glutathione; MDA, malondialdehyde. |
Synergistic Effects of MC-LR and Ct-HBX on the Migration and Invasion Ability of HepG2 Cells
A scratch test was used to observe the effects of MC-LR and Ct-HBX on the motor ability of HepG2 cells. The results showed that the migration tendency of HBXΔ32, HBXΔ4 and HBX treated with MC-LR was higher than that of the NC group treated with MC-LR (Figure 4). The effects of MC-LR and Ct-HBX on the migration (Figure 5A) and invasion (Figure 5B) of HepG2 cells were observed by Transwell assay. After 48 h of treatment, the migration and invasion abilities of HBXΔ32, HBXΔ4 and HBX treated with MC-LR (20 μM) were significantly higher than that of the NC group. In addition, the number of migratory and invasive cells in the MC-LR-treated HBXΔ32, HBXΔ4 and HBX groups was significantly higher than that in the MC-LR-untreated group. These results confirmed that MC-LR and Ct-HBX can synergistically promote the migration and invasion of HepG2 cells in vitro.
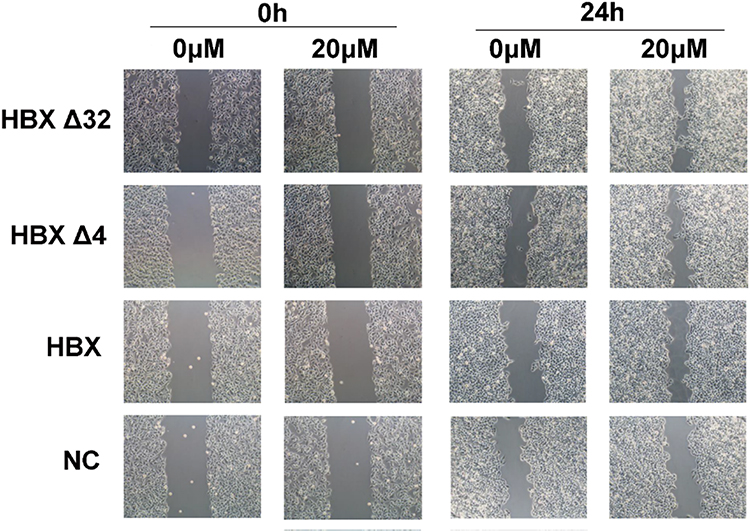 |
Figure 4 Synergistic effects of MC-LR and Ct-HBX on the migration ability of HepG2 cells. A scratch test was used to observe the effects of MC-LR and Ct-HBX on the motor ability of HepG2 cells. Images were captured with a microscope at 100X magnification. Abbreviations: MC-LR, Microcystins-LR; HBXΔ32, the 32 amino acid deletions in the C-terminus of HBX; HBXΔ4, the 4 amino acid deletions in the C-terminus of HBX; HBX, Hepatitis B virus X gene; Ct-HBX, C-terminal truncated hepatitis B virus X; NC, negative control that represents a lentiviral vector with an empty plasmid. |
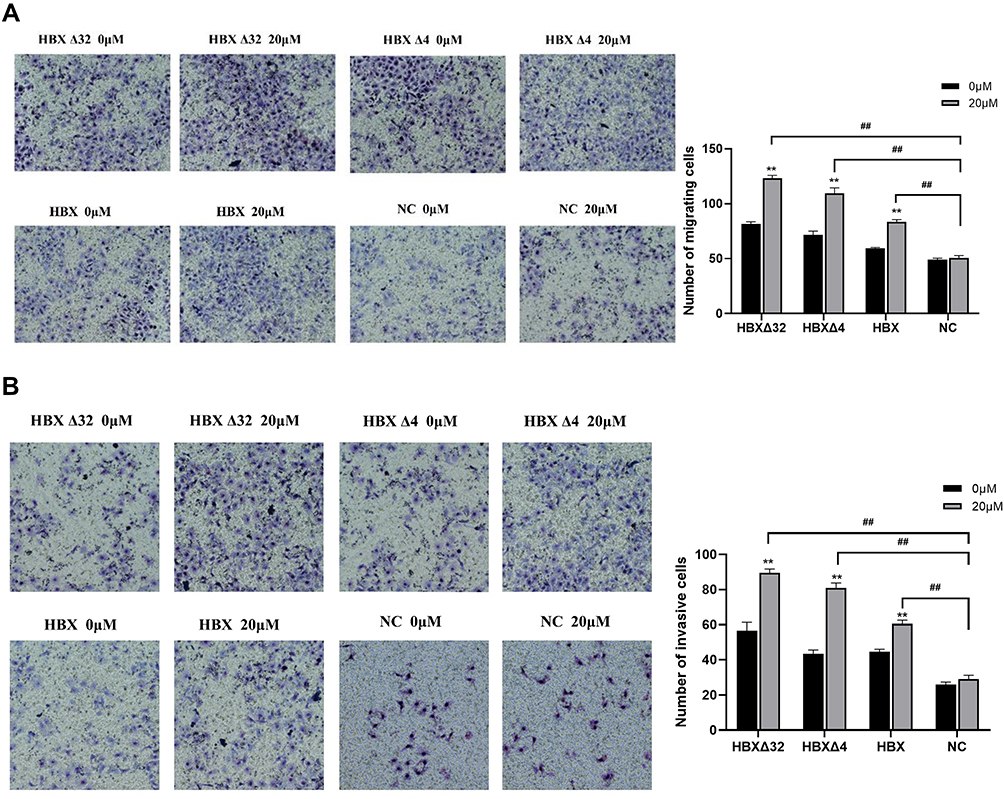 |
Figure 5 Synergistic effects of MC-LR and Ct-HBX on the migration and invasion ability of HepG2 cells. Images were captured with a microscope at 200X magnification. The effects of MC-LR and Ct-HBX on (A) the migration and (B) invasion of HepG2 cells were observed by Transwell assay. Data are presented as the mean ± SD; **P < 0.01 vs 0 µM MC-LR; ##P < 0.01 vs NC group. Abbreviations: MC-LR, Microcystins-LR; HBXΔ32, the 32 amino acid deletions in the C-terminus of HBX; HBXΔ4, the 4 amino acid deletions in the C-terminus of HBX; HBX, Hepatitis B virus X gene; Ct-HBX, C-terminal truncated hepatitis B virus X; NC, negative control that represents a lentiviral vector with an empty plasmid. |
Synergistic Effect of MC-LR and Ct-HBX on HepG2 Cell Apoptosis
The effect of MC-LR and Ct-HBX on the apoptosis of HepG2 cells was detected with flow cytometry. The results in Figure 6 showed that there was no significant difference in the apoptosis rate among the HBXΔ32, HBXΔ4, HBX and NC groups, whether the early nor the late apoptosis rates (P > 0.05).
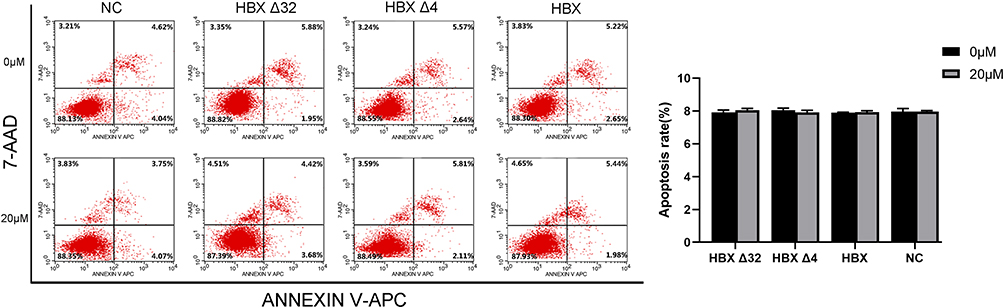 |
Figure 6 Synergistic effect of MC-LR and Ct-HBX on HepG2 cell apoptosis. The effect of MC-LR and Ct-HBX on the apoptosis of HepG2 cells was detected by flow cytometry. Data are presented as the percentage; All of P > 0.05 vs 0 µM MC-LR and NC group. Abbreviations: MC-LR, Microcystins-LR; HBXΔ32, the 32 amino acid deletions in the C-terminus of HBX; HBXΔ4, the 4 amino acid deletions in the C-terminus of HBX; HBX, Hepatitis B virus X gene; Ct-HBX, C-terminal truncated hepatitis B virus X; NC, negative control that represents a lentiviral vector with an empty plasmid. |
The Expression of Redox Regulation Genes and Proteins in HepG2 Cells Treated with MC-LR and Ct-HBX
The effects of MC-LR on the expression of genes regulating redox status in the HBXΔ32, HBXΔ4 and HBX groups were measured with qRT‒PCR (Figure 7A). The results showed that the expression of the MAOA gene in the HBXΔ32 group was upregulated and that the GPX1, NQO1, SOD2 and UCP2 genes were downregulated (Figure 7B). In the HBXΔ4 group, the MAOA and GCLC genes were upregulated, and the GPX1, SOD2 and UCP2 genes were downregulated (Figure 7C). In the HBX group, the MAOA gene was upregulated, and the GPX1, SOD1 and UCP2 genes were downregulated (Figure 7D). The expression levels of the MAOA, GPX1 and UCP2 genes in HBXΔ32, HBXΔ4 and HBX changed consistently. In addition, the protein expression levels of MAOA, GPX1 and UCP2 in these three groups were measured with Western blotting. The results showed that the expression levels of these three proteins changed consistently with those of the genes. The expression of MAOA protein was upregulated, while the expression of GPX1 and UCP2 protein was downregulated (Figure 8).
 |
Figure 7 The expression of redox regulation genes in HepG2 cells treated with MC-LR and Ct-HBX. The effects of MC-LR on the expression of genes regulating redox status were measured by qRT‒PCR. (A) The qRT‒PCR dissolution curves of 9 redox regulation genes, including GSR, NQO1, MAOA, UCP2, NOS3, GPX1, SOD2, SOD1 and GCLC. (B) In the HBXΔ32 group, the expression of the MAOA gene was upregulated and that the GPX1, NQO1, SOD2 and UCP2 genes were downregulated. (C) In the HBXΔ4 group, MAOA and GCLC genes were upregulated, and GPX1, SOD2 and UCP2 genes were downregulated. (D) In the HBX group, the MAOA gene was upregulated, and the GPX1, SOD1 and UCP2 genes were downregulated. ** P < 0.01. Abbreviations: MC-LR, Microcystins-LR; HBXΔ32, the 32 amino acid deletions in the C-terminus of HBX; HBXΔ4, the 4 amino acid deletions in the C-terminus of HBX; HBX, Hepatitis B virus X gene; Ct-HBX, C-terminal truncated hepatitis B virus X. |
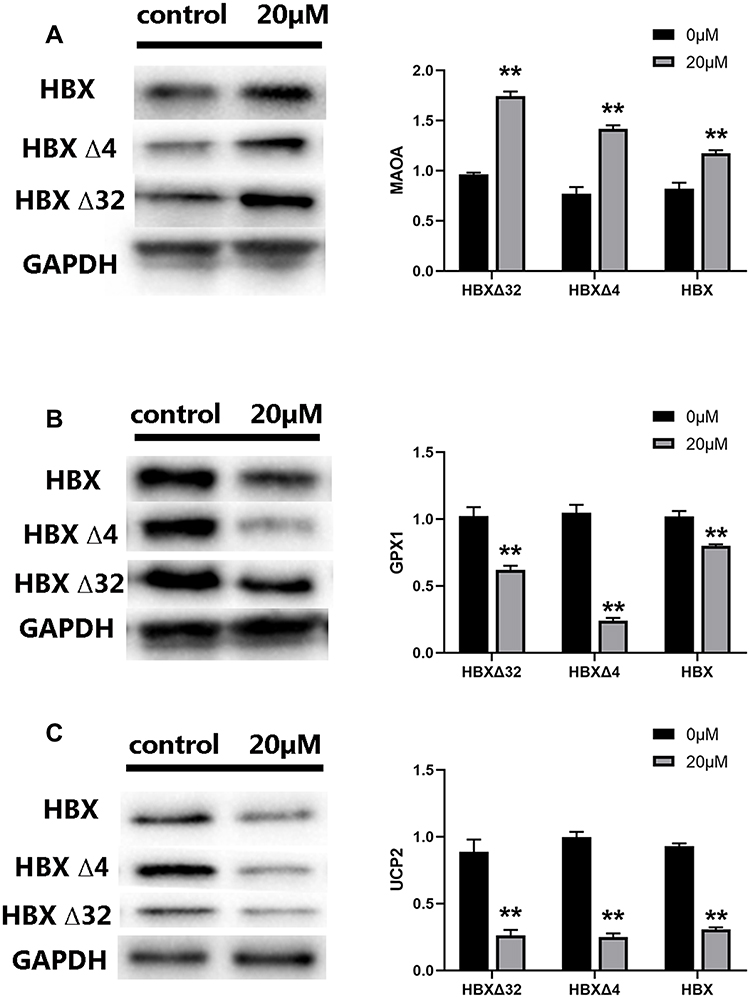 |
Figure 8 The expression of redox regulation proteins in HepG2 cells treated with MC-LR and Ct-HBX. The protein expression levels of (A) MAOA, (B) GPX1 and (C) UCP2 were measured by Western blotting. The expression of MAOA protein was upregulated, while the expression of GPX1 and UCP2 protein was downregulated in each group. ** P < 0.01. Abbreviations: MC-LR, Microcystins-LR; HBXΔ32, the 32 amino acid deletions in the C-terminus of HBX; HBXΔ4, the 4 amino acid deletions in the C-terminus of HBX; HBX, Hepatitis B virus X gene; Ct-HBX, C-terminal truncated hepatitis B virus X. |
Discussion
By assessing the MC-LR levels in areas with high incidence of liver cancer, we found that in these areas MC-LR could be detected in drinking water sources, including well water, river water and reservoir water. Although the average MC-LR concentration did not exceed the WHO criterion of 1 μg/L, researchers have found that the serum MC-LR level in healthy people in areas with high incidence of liver cancer was higher than that of people in low incidence areas, which indicates an accumulation effect of MC-LR in the human body, and suggests that the risk of long-term exposure to low-dose MC-LR should not be ignored.40 In this study, by investigating the health status of local residents, we also found that the concentration of MC-LR in drinking water was significantly related to hepatitis, clonorchiasis, GPT abnormalities and HBsAg carriage in the local population, suggesting that long-term low-dose MC-LR exposure combined with HBV infection and other liver damage factors may increase the risk of liver disease. In addition, we found that drinking high levels of MC-LR polluted water and infection with HBV increased the serum MDA, an index of oxidative damage of the cytomembrane. Considering the close relationship between these risk factors and HCC, as well as the high morbidity and mortality rates of liver cancer in these areas, further exploration of the synergistic effect and specific mechanism of MC-LR and HBV on hepatocarcinoma genesis through the regulation of redox balance was warranted.
Thus, we constructed a cell model in which Ct-HBX was transfected into HepG2 cells to further explore the effects of HBX integration and MC-LR on cell ROS levels and the redox system, according to the common HBX integration fragments found in areas with high incidence of liver cancer.28,34 Given that MC-LR plays dual roles in the biology of redox signaling and oxidative stress—where redox signaling refers to low levels of ROS that activate signaling pathways to initiate biological processes, while oxidative stress denotes high levels of ROS that damage DNA, proteins or lipids41 we needed to determine an appropriate concentration and duration of MC-LR intervention in vitro to avoid the toxic and lethal effects of MC-LR on cells and to ensure that the biological processes induced by MC-LR could be observed under the condition of cell survival. The results showed that when the intervention concentration of MC-LR was 20 μM or less, the cell viability of the HBXΔ32, HBXΔ4 and HBX transfection groups was not affected for 48 h, while the ROS activity was at its highest. This is basically consistent with the findings of other researchers.22,42 Therefore, we chose 20 μM as the intervention concentration of MC-LR to carry out the follow-up experiments.
In the cell experiments in this study, we detected the SOD activity and GSH and MDA levels in HepG2 cells in the HBXΔ32, HBXΔ4 and HBX transfection groups after treatment with MC-LR. The antioxidant enzyme SOD, as the first line of defense against ROS, maintains the dynamic balance between the production and clearance of ROS and protects cells from oxidative stress.43 MDA is the product of peroxidation of polyunsaturated fatty acids and is typically used as an indicator of oxidative damage to the cell membrane.44 The results of our study showed that SOD and GSH decreased in a concentration-dependent manner after MC-LR intervention, and that the degree of decline in the NC group was slower than that in the MC-LR treatment groups. These results were basically consistent with those of other studies and indicated that MC-LR and HBX could play a role in regulating redox status by interfering with SOD and GSH.45–47 At the same time, we found that the concentration of MDA began to increase in a concentration-dependent manner after MC-LR intervention, and that the degree of increase in the NC group was slower than that in the MC-LR treatment groups, indicating that MC-LR combined with Ct-HBX caused obvious oxidative damage to the HepG2 cell membrane. We also found that the disturbance of the redox balance in HCC cells by Ct-HBX requires the existence of MC-LR; and an increase in serum MDA in local residents who drank water with higher MC-LR levels and who were infected with HBV. These results confirmed our previous suspicion that MC-LR and Ct-HBX might induce excessive ROS and cause disturbance in redox status, which may be one of the major pathogenic mechanisms of hepatoma. Other studies have reported that MC-LR exposure can lead to the disturbance of intracellular redox status.48,49 The level of HBX protein can increase significantly with the accumulation of intracellular ROS, which aggravates the progression of liver disease.50
We further analyzed the effects of MC-LR and Ct-HBX on the migration and invasion ability of HepG2 cells. The results showed that the migration and invasion abilities of the HBXΔ32, HBXΔ4 and HBX groups treated with MC-LR were significantly higher than those of the control group. This finding was consistent with the results of other studies showing that HBX can promote the invasion and metastasis of hepatocellular carcinoma by upregulating thioredoxin interacting protein, which is the key medium of intracellular ROS;51 MC-LR has been shown to promote liver oxidative damage caused by large amounts of ROS produced in mouse liver cells23,24 and to stimulate cancer cell migration and invasion.52–54 The findings of these studies suggest that MC-LR and Ct-HBX may promote the migration and invasion of HepG2 cells through ROS. With regard to the effect of MC-LR combined with Ct-HBX on apoptosis, we found that there was no significant difference in apoptosis rates between the experimental group and the control group under the conditions of 20 μM MC-LR. However, other researchers have found that 30 μM and 50 μM MC-LR can significantly upregulate the exogenous apoptosis regulatory genes Fas and FasL to induce apoptosis in HepG2 cells,22 and that the apoptosis of mouse liver cells increased significantly in response to 3.125 μg/(kg d) MC-LR treatment compared with mouse liver cells under negative control conditions.55 In this study, we did not observe an effect of MC-LR and Ct-HBX on apoptosis of hepatocellular carcinoma cells, which may be related to the fact that the concentration and duration of MC-LR intervention did not create conditions sufficient for reaching the level of apoptosis.
The common genes and proteins that regulate redox status include GSR, NQO1, MAOA, UCP2, NOS3, GPX1, SOD2, SOD1 and GCLC, which are directly related to ROS levels. Studies have shown that MC-LR can induce the production of ROS by misregulating the expression and activity of the pro-oxidants SOD1, MAOA and NOX4 and the antioxidant GPX1.56 In this study, to understand the relationship between ROS production and redox regulation genes, HepG2 cells transfected with Ct-HBX were treated with 20 μM MC-LR for 48 h, and the mRNA expression levels of oxidative stress-related genes were measured. The results showed that the MAOA gene was upregulated, while the GPX1 and UCP2 genes were downregulated. MAOA produces H2O2 in the metabolism of 5-hydroxytryptamine and catecholamine, which is an important source of oxidative stress.57 Therefore, the upregulation of the MAOA gene promotes the production of ROS. GPX1 is an antioxidant enzyme in mammals that can degrade intracellular ROS into water or alcohol with GSH or other related mercaptan as cofactors.58 We found that GPX1 gene downregulation may reduce the degradation of ROS, and that ultimately, excessive ROS accumulation leads to downstream redox biological processes or oxidative stress. According to the latest evidence, UCP2 is an antioxidant protein that can participate in mitochondrial uncoupling, that limits the formation of reactive oxygen species and that is closely related to oxidative stress.59,60 In this study, the expression of the UCP2 gene was downregulated, which would lead to a limiting effect on the inhibition of the production of ROS, resulting in an increase in the production of ROS being increased. Similar to our results, Xiong et al showed that ROS can regulate the activity of antioxidant enzymes and affect their transcriptional changes by regulating the level of mRNA, thus promoting oxidative stress in cells.61 Further detection of the protein expression level of related genes also revealed that the protein level of MAOA was upregulated, while the protein levels of GPX1 and UCP2 were downregulated. According to these results, we surmised that the upregulated expression of MAOA oxidation genes and the downregulated expression of GPX1 and UCP2 antioxidant genes can disturb the process of ROS production and degradation and can disrupt the dynamic redox balance, which might be associated with the abnormal proliferation of hepatocytes.
Besides MC-LR in water source and HBV infection concerned in this study, there are other risk factors are contributors to the development of liver cancer, including the genetics and ethnicity, age, gender, lifestyle, behavioral and environmental risk factors, as well as the underlying liver disease and metabolic disorders such as fatty liver disease, obesity and insulin resistance. Hepatocellular carcinoma-related mortality can be prevented by avoiding these risk factors.62,63
Conclusion
MC-LR can be detected in drinking water in areas with a high incidence of liver cancer, and it is related to the occurrence of liver diseases in local residents. MC-LR and Ct-HBX can synergistically induce ROS production in hepatocytes to cause redox disturbance and to become a potential pathogenic factor in the occurrence of hepatocellular carcinoma. However, there are still several limitations to this study. First, the monitoring of MC-LR in water samples has a certain practical significance, but we need to increase the quantity of monitoring time points and sampling sites to enable a full evaluation of the risk of exposure to MC-LR. Moreover, we need to develop a convenient and sensitive detection method to monitor the exposure level of MC-LR in vivo to evaluate the harm of MCs to the human body more intuitively. Because the cytological experiment in this study only used a single cell line in vitro to explore the synergistic effect of MC-LR and Ct-HBX from the perspective of redox status regulation, the results of this study need to be more comprehensively and thoroughly verified in other hepatocyte lines and in animal experiments, and the specific synergistic carcinogenic mechanism of MC-LR and Ct-HBX needs to be further studied.
Ethical Statement
This research was conducted according to the ethical guidelines of the 1975 Declaration of Helsinki. This study was reviewed and approved by The Ethics Committee of Guangxi Medical University Cancer Hospital (LW2022091). All of the subjects provided their written informed consent to participate in this study.
Author Contributions
All of the authors made a significant contribution to the work reported, whether that is in the conception, study design, execution, acquisition of data, analysis and interpretation, or in all these areas; took part in drafting, revising or critically reviewing the article; gave final approval of the version to be published; have agreed on the journal to which the article has been submitted; and agree to be accountable for all aspects of the work.
Funding
This study was supported by grants from the National Natural Science Foundation of China (No. 82160638 and 81660561); The Guangxi Natural Science Foundation (No. 2021GXNSFAA220094 and No. 2019GXNSFDA245001); 2018 Guangxi One Thousand Young and Middle-aged College and University Backbone Teachers Cultivation Program (To Wei Deng).
Disclosure
The authors report no conflicts of interest in this work.
References
1. Ye FS, Mo CC, Luo S, Henderson BE, Tong MJ, Yu MC. A serological case-control study of primary hepatocellular carcinoma in Guangxi, China. Cancer Res. 1985;45(2):872–873.
2. Wang JS, Huang TR, Su JJ, et al. Hepatocellular carcinoma and aflatoxin exposure in Zhuqing Village, Fusui County, People’s Republic of China. Cancer Epidemiol Biomarkers Prev. 2001;10(2):143–146.
3. Zhang ZQ, Huang TR, Liu ZH, et al. Drinking water quality and the risk of liver cancer. China Cancer. 1996;5(10):18–19.
4. Xia GL, Liu CB, Cao H, et al. Prevalence of hepatitis B and C virus infections in the general Chinese population. Results from a nationwide cross-sectional seroepidemiologic study of hepatitis A, B, C, D, and E virus infections in China, 1992. Int Hepatol Commun. 1996;5(1):62–73. doi:10.1016/S0928-4346(96)82012-3
5. Liu J, Liang WN, Jing WZ, Liu M. Countdown to 2030: eliminating hepatitis B disease, China. Bull World Health Organ. 2019;97(3):230–238. doi:10.2471/blt.18.219469
6. Shi MM, Liang J, Zhang P, Zhong YX, Jiang YY. Dietary exposure assessment of aflatoxins of residents in Guangxi. Chin J Food Hyg. 2020;32(04):432–436. doi:10.13590/j.cjfh.2020.04.016
7. Liu Y, Chang CC, Marsh GM, Wu F. Population attributable risk of aflatoxin-related liver cancer: systematic review and meta-analysis. Eur J Cancer. 2012;48(14):2125–2136. doi:10.1016/j.ejca.2012.02.009
8. Groopman JD, Kensler TW, Wild CP. Protective interventions to prevent aflatoxin-induced carcinogenesis in developing countries. Annu Rev Public Health. 2008;29:187–203. doi:10.1146/annurev.publhealth.29.020907.090859
9. Wan X, Steinman AD, Gu YR, et al. Occurrence and risk assessment of microcystin and its relationship with environmental factors in lakes of the eastern plain ecoregion, China. Environ Sci Pollut Res Int. 2020;27(36):45095–45107. doi:10.1007/s11356-020-10384-0
10. An L, Zeng HM, Zheng RS, et al. Liver cancer epidemiology in China, 2015. Zhonghua zhong liu za zhi. 2019;41(10):721–727. doi:10.3760/cma.j.issn.0253-3766.2019.10.001
11. Li QL, Cao J, Rong MH, et al. Analysis of incidence and mortality of liver cancer in cancer registration areas in Guangxi,2010—2016. Chin J Oncol Prev Treat. 2021;13(2):138–143. doi:10.3969/j.issn.1674-5671.2021.02.05
12. Tang BJ. Study on HBV infection of the cancer prevention screening population in the primary liver cancer high incidence area of Guangxi. Guangxi Med J. 2006;12:1857–1859.
13. Zheng B, Deng W, Huang TR, He Y, Gao YX. Distribution characteristics of HBV genotypes in South and North of Guangxi. J Appl Prev Med. 2016;22(02):138–140.
14. Gao YX, Li XL, Huang TR, Deng W, Zheng D, Li ZF. Establishment of consensus sequences of Pre-S, S, Pre-C /BCP gene of hepatitis B virus prevailing in areas with high hepatocellular carcinoma incidence in Fusui county of Guangxi. Chin J Public Health. 2016;32(05):687–690.
15. Li KZ, Deng W, Li YX, et al. Microcystin content of different water sources in a region of Guangxi showing high incidence of liver cancer. Chin J Oncol Prev Treat. 2016;8(6):387–390. doi:10.3969/j.issn.1674-5671.2016.06.11
16. Liu JH, Wang BL, Huang P, et al. Microcystin-LR promotes cell proliferation in the mice liver by activating Akt and p38/ERK/JNK cascades. Chemosphere. 2016;163:14–21. doi:10.1016/j.chemosphere.2016.08.002
17. Zhang X, Xie P, Zhang XZ, et al. Toxic effects of microcystin-LR on the HepG2 cell line under hypoxic and normoxic conditions. J Appl Toxicol. 2013;33(10):1180–1186. doi:10.1002/jat.2749
18. Chen HQ, Zhao J, Li Y, et al. Epigenetic inactivation of LHX6 mediated microcystin-LR induced hepatocarcinogenesis via the Wnt/β-catenin and P53 signaling pathways. Environ Pollut. 2019;252(Pt A):216–226. doi:10.1016/j.envpol.2019.05.049
19. He LX, Huang YJ, Guo QN, et al. Chronic Microcystin-LR Exposure Induces Hepatocarcinogenesis via Increased Gankyrin in Vitro and in Vivo. Cell Physiol Biochem. 2018;49(4):1420–1430. doi:10.1159/000493446
20. Krishnan A, Koski G, Mou XZ. Characterization of microcystin-induced apoptosis in HepG2 hepatoma cells. Toxicon. 2020;173:20–26. doi:10.1016/j.toxicon.2019.11.003
21. Feng Y, Chen X, Ding W, Ma J, Zhang B, Li X. MicroRNA-16 participates in the cell cycle alteration of HepG2 cells induced by MC-LR. Ecotoxicol Environ Saf. 2020;192:110295. doi:10.1016/j.ecoenv.2020.110295
22. Ma JG, Li YY, Duan HY, Sivakumar R, Li XY. Chronic exposure of nanomolar MC-LR caused oxidative stress and inflammatory responses in HepG2 cells. Chemosphere. 2018;192:305–317. doi:10.1016/j.chemosphere.2017.10.158
23. Weng D, Lu Y, Wei YN, Liu Y, Shen P. The role of ROS in microcystin-LR-induced hepatocyte apoptosis and liver injury in mice. Toxicology. 2007;232(1–2):15–23. doi:10.1016/j.tox.2006.12.010
24. Wei YN, Weng D, Li F, et al. Involvement of JNK regulation in oxidative stress-mediated murine liver injury by microcystin-LR. Apoptosis. 2008;13(8):1031–1042. doi:10.1007/s10495-008-0237-2
25. Svircev Z, Baltic V, Gantar M, Jukovic M, Stojanovic D, Baltic M. Molecular aspects of microcystin-induced hepatotoxicity and hepatocarcinogenesis. J Environ Sci Health C Environ Carcinog Ecotoxicol Rev. 2010;28(1):39–59. doi:10.1080/10590500903585382
26. Hai H, Tamori A, Kawada N. Role of hepatitis B virus DNA integration in human hepatocarcinogenesis. World J Gastroenterol. 2014;20(20):6236–6243. doi:10.3748/wjg.v20.i20.6236
27. Ringelhan M, Heikenwalder M, Protzer U. Direct effects of hepatitis B virus-encoded proteins and chronic infection in liver cancer development. Dig Dis. 2013;31(1):138–151. doi:10.1159/000347209
28. Lucifora J, Arzberger S, Durantel D, et al. Hepatitis B virus X protein is essential to initiate and maintain virus replication after infection. J Hepatol. 2011;55(5):996–1003. doi:10.1016/j.jhep.2011.02.015
29. Wang Y, Lau SH, Sham JS, Wu MC, Wang T, Guan XY. Characterization of HBV integrants in 14 hepatocellular carcinomas: association of truncated X gene and hepatocellular carcinogenesis. Oncogene. 2004;23(1):142–148. doi:10.1038/sj.onc.1206889
30. Toh ST, Jin Y, Liu LZ, et al. Deep sequencing of the hepatitis B virus in hepatocellular carcinoma patients reveals enriched integration events, structural alterations and sequence variations. Carcinogenesis. 2013;34(4):787–798. doi:10.1093/carcin/bgs406
31. Lizzano RA, Yang B, Clippinger AJ, Bouchard MJ. The C-terminal region of the hepatitis B virus X protein is essential for its stability and function. Virus Res. 2011;155(1):231–239. doi:10.1016/j.virusres.2010.10.013
32. Zheng D, Deng W, Huang TR, Li XL, Li ZF. Relationship between hepatitis B virus genotype, BCP/Pre-C region mutations and risk of hepatocellular carcinoma in Guangxi Zhuang Autonomous Region. Zhonghua Liu Xing Bing Xue Za Zhi. 2015;36(7):725–729.
33. He Y, Huang TR, Deng W, et al. Prevalence of hepatitis b virus genotype I in Fusui, China. Int J Clin Exp Pathol. 2017;10(4):4633–4639.
34. Fang X, Wu HH, Ren JJ, et al. Associations between serum HBX quasispecies and their integration in hepatocellular carcinoma. Int J Clin Exp Pathol. 2017;10(12):11857–11866.
35. Yu DY. Relevance of reactive oxygen species in liver disease observed in transgenic mice expressing the hepatitis B virus X protein. Lab Anim Res. 2020;36:6. doi:10.1186/s42826-020-00037-1
36. Waris G, Huh KW, Siddiqui A. Mitochondrially associated hepatitis B virus X protein constitutively activates transcription factors STAT-3 and NF-kappa B via oxidative stress. Mol Cell Biol. 2001;21(22):7721–7730. doi:10.1128/mcb.21.22.7721-7730.2001
37. Shirakata Y, Koike K. Hepatitis B virus X protein induces cell death by causing loss of mitochondrial membrane potential. J Biol Chem. 2003;278(24):22071–22078. doi:10.1074/jbc.M301606200
38. Jung SY, Kim YJ. C-terminal region of HBx is crucial for mitochondrial DNA damage. Cancer Lett. 2013;331(1):76–83. doi:10.1016/j.canlet.2012.12.004
39. Xiao CC, Chen MJ, Mei FB, et al. Influencing factors and health risk assessment of microcystins in the Yongjiang river (China) by Monte Carlo simulation. PeerJ. 2018;6:e5955. doi:10.7717/peerj.5955
40. Liao J, Nong QQ, Hu XM, et al. Serum microcystin-LR level and influencing factors in local residents of a high risk area of hepatocellular carcinoma in Guangxi. J Environ Health. 2016;33(11):1003–1006. doi:10.16241/j.cnki.1001-5914.2016.11.017
41. Schieber M, Chandel NS. ROS function in redox signaling and oxidative stress. Curr Biol. 2014;24(10):R453–R462. doi:10.1016/j.cub.2014.03.034
42. Nong QQ, Lan YB, Zhu NH, Zhang ZY, He M. MC-LR induce oxidative DNA damage as determined by different methods. Chin Trop Med. 2008;9:1505–1506.
43. Morales AE, Pérez-Jiménez A, Hidalgo MC, Abellán E, Cardenete G. Oxidative stress and antioxidant defenses after prolonged starvation in Dentex dentex liver. Comp Biochem Phys Toxicol Pharmacol. 2004;139(1–3):153–161. doi:10.1016/j.cca.2004.10.008
44. Ma JG, Liu Y, Niu DC, Li XY. Effects of chlorpyrifos on the transcription of CYP3A cDNA, activity of acetylcholinesterase, and oxidative stress response of goldfish (Carassius auratus). Environ Toxicol. 2015;30(4):422–429. doi:10.1002/tox.21918
45. Ma JG, Li YY, Wu ML, Li XY. Oxidative stress-mediated p53/p21(WAF1/CIP1) pathway may be involved in microcystin-LR-induced cytotoxicity in HepG2 cells. Chemosphere. 2018;194:773–783. doi:10.1016/j.chemosphere.2017.12.051
46. Ding WX, Shen HM, Ong CN; Ding WX, Shen HM, Ong CN. Microcystic cyanobacteria extract induces cytoskeletal disruption and intracellular glutathione alteration in hepatocytes. Environ Health Perspect. 2000;108(7):605–609. doi:10.1289/ehp.00108605
47. Takenaka S. Covalent glutathione conjugation to cyanobacterial hepatotoxin microcystin LR by F344 rat cytosolic and microsomal glutathione S-transferases. Environ Toxicol Pharmacol. 2001;9(4):135–139. doi:10.1016/s1382-6689(00)00049-1
48. Puerto M, Pichardo S, Jos A, et al. Differential oxidative stress responses to pure Microcystin-LR and Microcystin-containing and non-containing cyanobacterial crude extracts on Caco-2 cells. Toxicon. 2010;55(2–3):514–522. doi:10.1016/j.toxicon.2009.10.003
49. Li Y, Han XD. Microcystin-LR causes cytotoxicity effects in rat testicular Sertoli cells. Environ Toxicol Pharmacol. 2012;33(2):318–326. doi:10.1016/j.etap.2011.12.015
50. Wang JH, Yun C, Kim S, et al. Reactive oxygen species modulates the intracellular level of HBx viral oncoprotein. Biochem Biophys Res Commun. 2003;310(1):32–39. doi:10.1016/j.bbrc.2003.08.113
51. He ZL, Yu YJ, Nong YH, et al. Hepatitis B virus X protein promotes hepatocellular carcinoma invasion and metastasis via upregulating thioredoxin interacting protein. Oncol Lett. 2017;14(2):1323–1332. doi:10.3892/ol.2017.6296
52. Zhang ZY, Zhang XX, Qin WD, et al. Effects of microcystin-LR exposure on matrix metalloproteinase-2/-9 expression and cancer cell migration. Ecotoxicol Environ Saf. 2012;77:88–93. doi:10.1016/j.ecoenv.2011.10.022
53. Zhang Q, Wang GH, Xie YF, et al. Mechanical changes and microfilament reorganization involved in microcystin-lr-promoted cell invasion in DU145 and WPMY cells. Front Pharmacol. 2020;11:89. doi:10.3389/fphar.2020.00089
54. Zhang XX, Zhang ZY, Fu ZY, et al. Stimulation effect of microcystin-LR on matrix metalloproteinase-2/-9 expression in mouse liver. Toxicol Lett. 2010;199(3):377–382. doi:10.1016/j.toxlet.2010.10.001
55. Huang XN. Biomarkers of Exposure to Microcystin-LR and Apoptotic Effects Induced by the Toxin in Mice. Wuhan: Huangzhong University of Science and Technology; 2013.
56. Wu YL, He Y, Shi JJ, Zheng TX, Lin XJ, Lin X. Microcystin-LR promotes necroptosis in primary mouse hepatocytes by overproducing reactive oxygen species. Toxicol Appl Pharmacol. 2019;377:114626. doi:10.1016/j.taap.2019.114626
57. Santin Y, Sicard P, Vigneron F, et al. Oxidative stress by monoamine oxidase-A impairs transcription factor EB activation and autophagosome clearance, leading to cardiomyocyte necrosis and heart failure. Antioxid Redox Signal. 2016;25(1):10–27. doi:10.1089/ars.2015.6522
58. Gehringer MM, Shephard EG, Downing TG, Wiegand C, Neilan BA; Gehringer MM, Shephard EG, Downing TG, Wiegand C, Neilan BA. An investigation into the detoxification of microcystin-LR by the glutathione pathway in Balb/c mice. Int J Biochem Cell Biol. 2004;36(5):931–941. doi:10.1016/j.biocel.2003.10.012
59. Hass DT, Barnstable CJ. Uncoupling proteins in the mitochondrial defense against oxidative stress. Prog Retin Eye Res. 2021;83:100941. doi:10.1016/j.preteyeres.2021.100941
60. Ding Y, Zheng Y, Huang J; Ding Y, Zheng YJ, Huang JD, et al. UCP2 ameliorates mitochondrial dysfunction, inflammation, and oxidative stress in lipopolysaccharide-induced acute kidney injury. Int Immunopharmacol. 2019;71:336–349. doi:10.1016/j.intimp.2019.03.043
61. Xiong Q, Xie P, Li HY, et al. Acute effects of microcystins exposure on the transcription of antioxidant enzyme genes in three organs (liver, kidney, and testis) of male Wistar rats. J Biochem Mol Toxicol. 2010;24(6):361–367. doi:10.1002/jbt.20347
62. Forner A, Reig M, Bruix J. Hepatocellular carcinoma. Lancet. 2018;391(10127):1301–1314. doi:10.1016/s0140-6736(18)30010-2
63. Wallace MC, Preen D, Jeffrey GP, Adams LA. The evolving epidemiology of hepatocellular carcinoma: a global perspective. Expert Rev Gastroenterol Hepatol. 2015;9(6):765–779. doi:10.1586/17474124.2015.1028363
 © 2022 The Author(s). This work is published and licensed by Dove Medical Press Limited. The
full terms of this license are available at https://www.dovepress.com/terms
and incorporate the Creative Commons Attribution
- Non Commercial (unported, 3.0) License.
By accessing the work you hereby accept the Terms. Non-commercial uses of the work are permitted
without any further permission from Dove Medical Press Limited, provided the work is properly
attributed. For permission for commercial use of this work, please see paragraphs 4.2 and 5 of our Terms.
© 2022 The Author(s). This work is published and licensed by Dove Medical Press Limited. The
full terms of this license are available at https://www.dovepress.com/terms
and incorporate the Creative Commons Attribution
- Non Commercial (unported, 3.0) License.
By accessing the work you hereby accept the Terms. Non-commercial uses of the work are permitted
without any further permission from Dove Medical Press Limited, provided the work is properly
attributed. For permission for commercial use of this work, please see paragraphs 4.2 and 5 of our Terms.
Recommended articles
Toxic Effects of Synthesized Bismuth Oxide/Reduced Graphene Oxide (Bi2O3/RGO) Nanocomposites in Two Distinct Mammalian Cell Lines: Role Oxidative Stress and Apoptosis

Lateef R, Ahmad I, Mahdi AA, Lohia N, Alhadlaq HA, Akhtar MJ, Ahamed M
International Journal of Nanomedicine 2024, 19:12655-12674
Published Date: 26 November 2024