Back to Journals » OncoTargets and Therapy » Volume 14
Targeting Endoglin Expressing Cells in the Tumor Microenvironment Does Not Inhibit Tumor Growth in a Pancreatic Cancer Mouse Model
Authors Schoonderwoerd MJ, Hakuno SK, Sassen M ![]() , Kuhlemaijer EB, Paauwe M, Slingerland M, Fransen MF, Hawinkels LJ
, Kuhlemaijer EB, Paauwe M, Slingerland M, Fransen MF, Hawinkels LJ ![]()
Received 1 June 2021
Accepted for publication 30 September 2021
Published 29 October 2021 Volume 2021:14 Pages 5205—5220
DOI https://doi.org/10.2147/OTT.S322276
Checked for plagiarism Yes
Review by Single anonymous peer review
Peer reviewer comments 5
Editor who approved publication: Dr Arseniy Yuzhalin
Mark JA Schoonderwoerd,1,* Sarah K Hakuno,1,* Martijn Sassen,1 Eleonore B Kuhlemaijer,1 Madelon Paauwe,1 Marije Slingerland,2 Marieke F Fransen,3 Lukas JAC Hawinkels1
1Department of Gastroenterology-Hepatology, Leiden University Medical Center, Leiden, the Netherlands; 2Department of Medical Oncology, Leiden University Medical Center, Leiden, the Netherlands; 3Department of Immunohematology and Blood Transfusion, Leiden University Medical Center, Leiden, the Netherlands
*These authors contributed equally to this work
Correspondence: Lukas JAC Hawinkels Tel +31 71 526 6736
Email [email protected]
Background: Pancreatic ductal adenocarcinoma (PDAC) is one of the most lethal forms of cancer and is known to have low immunogenicity and an immunosuppressive microenvironment. It is also characterized by high accumulation of dense stroma, composed of mostly cancer-associated fibroblasts (CAFs). Multiple subsets of CAFs are described, with one of them expressing the transforming growth factor (TGF)-β co-receptor endoglin. In previous work, we and others have shown that endoglin-expressing CAFs stimulate tumor progression and metastasis. Therefore, in this study, we set out to investigate the role of endoglin-expressing CAFs in pancreatic cancer progression.
Methods: First, we investigated the expression of endoglin on CAFs in both human tissues as well as a mouse model for PDAC. Since CAF-specific endoglin expression was high, we targeted endoglin by using the endoglin neutralizing antibody TRC105 in the murine KPC model for PDAC.
Results: Although some signs of immune activation were observed, TRC105 did not affect tumor growth. Since 90% of the CD8+ T-cells expressed the immune checkpoint PD-1, we investigated the combination with a PD1 checkpoint inhibitor, which did not enhance therapeutic responses. Finally, genetic deletion of endoglin from collagen 1a1 expressing cells also did not affect the growth of the mouse KPC tumors.
Conclusion: Our results show that although endoglin is highly expressed on PDAC-CAFs and signaling is efficiently inhibited by TRC105, this does not result in decreased tumor growth in the KPC model for pancreatic cancer.
Keywords: endoglin, PDAC, cancer-associated fibroblasts, TRC105, stroma, KPC
Background
Pancreatic ductal adenocarcinoma (PDAC) is one of the most lethal forms of cancer with a 5-year survival rate of only 7%. The most common mutations are activating mutations in KRAS (95%), loss of P53 (75%) and/or Smad4 (55%). This type of cancer is known to have low immunogenicity and to display an immunosuppressive microenvironment. This has resulted in the fact that immunotherapy through checkpoint inhibition has shown limited clinical success. The immune system has a crucial role in cancer progression and PDAC is capable of using various mechanisms for immune evasion, such as recruitment of regulatory immune cells, the secretion of immunosuppressive chemokines and the expression of cell-surface proteins, such as programmed death-ligand 1 (PD-L1), cytotoxic T-lymphocyte associated protein 4 (CTLA4) and colony-stimulating factor (CSF)-1.1 Next to the immune component of the tumor microenvironment (TME), PDAC is typically characterized by high accumulation of non-tumor cells together called the tumor stroma, which has been correlated to the poor survival of PDAC patients,2 but also of various other solid tumors like breast-,3 and colorectal cancer.4 Cancer-associated fibroblasts (CAFs) are the most abundant cell type in the tumor stroma and exhibit diverse functions, including extracellular matrix deposition and remodeling.5 CAFs can influence tumor progression and metastasis, for example via interactions with cancer cells and infiltrating immune cells.6 Therefore, CAFs have been proposed as a potential target for therapeutic interventions in PDAC.7
More recent work has, however, revealed that multiple subsets of CAFs exist in PDAC,8,9 which can stimulate or inhibit tumor progression. This was further emphasized by showing that the depletion of all α-SMA expressing cells in a murine model for PDAC can increase tumor aggressiveness.10
Our recent work in colorectal cancer revealed a subset of α-SMA positive CAFs that express the Transforming Growth Factor (TGF)-β co-receptor endoglin. The abundance of endoglin-expressing CAFs was related to invasive behavior and increased risk of metastasis in colorectal cancer and in a murine model for prostate cancer.11,12 Endoglin is a transmembrane co-receptor for TGF-β ligands (mainly bone morphogenetic protein (BMP)-9) and originally described for its crucial role in angiogenesis. Later work revealed a significant role of endoglin beyond the endothelial cell.13 TRC105 (Carotuximab, Tracon Pharmaceuticals, Inc) is a human endoglin neutralizing antibody, blocking endoglin-BMP9 interactions. We and others have shown in multiple pre-clinical models that TRC105 inhibits angiogenesis,14,15 tumor growth,16 and metastasis,11,17 and induces antibody-dependent cellular cytotoxicity (ADCC) in mice.18
Based on our previous findings that TRC105, next to targeting endothelial cells, also targets endoglin-expressing CAFs and regulatory T-cells (Tregs), we explored whether endoglin could serve as a potential target to improve PDAC outcomes.
In this study, we investigated the expression of endoglin on CAFs in samples from patients with PDAC. Next, we evaluated the therapeutic and immune-modulating effects of the endoglin neutralizing antibody TRC105 in the murine-derived KrasG12D/+ LSL-Trp53R172H/+ Pdx-1-Cre (KPC) syngeneic transplantation model for pancreatic cancer.19 Our results show that although endoglin is highly expressed on PDAC-CAFs and signaling is efficiently inhibited by TRC105, this does not result in decreased tumor growth in the KPC model.
Methods
Cell Culture
The mouse PDAC cell line KPC-3 (KrasG12D/+ LSL-Trp53R172H/+ Pdx-1-Cre),19 (kindly supplied by the department of Immunology, LUMC) with a targeted insertion of codon-optimized Luc-2 (pGL4.10) [luc2] (Promega Leiden, the Netherlands), mouse MC38 cells (kindly supplied by the department of Immunology, LUMC) and primary fibroblasts were all cultured in DMEM/F12 glutamax medium (Invitrogen, Landsmeer, the Netherlands), with 10% fetal bovine serum (FBS) (Gibco, Bleiswijk, the Netherlands), 0.01 M HEPES, 0.1 µg/mL Gentamycin, 40U/mL Penicillin and 40 µg/mL Streptomycin (all Invitrogen Landsmeer, the Netherlands) at 37°C and 5% CO2. Mouse endothelial 2H11 cells (kindly supplied by Dr. Sanchez-Duffhues, department of Cell and Chemical Biology) and human PDAC cell lines MIA PaCa-2 and PANC-1 (both cell lines obtained from ATCC, Manassas, VA, USA) were cultured in DMEM medium with 10% FBS, Penicillin and 40 µg/mL Streptomycin at 37°C and 5% CO2. The human PDAC cell line BxPC-3 (ATCC) in RPMI-1640 (Invitrogen, Landsmeer, the Netherlands), with 10% FBS, Penicillin and 40 µg/mL Streptomycin at 37°C and 5% CO2. Human endothelial (ECRF) cells (kindly supplied by Dr. Fontein, AMC Amsterdam) were cultured as described before.20 Both primary human and mouse-derived fibroblasts were isolated by mechanically dissociating the tumor and culturing the tumor pieces using the culture medium described above. Fibroblasts grew from the tissue fragments and were used between passage 4 and 10. Fibroblasts were characterized by qPCR for expression of α-SMA and vimentin and the absence of CD31, CD45 and cytokeratin. Primary cells were characterized as indicated above. All cells were tested monthly and directly before in vivo use for mycoplasma contamination by PCR. The MC38 cell line was authenticated by STR profiling.
Western Blot
Fibroblasts were lysed in RIPA buffer (150 mM NaCl, 1% NP-40, 0.25% deoxycholate, 0.1% SDS, 50 mM Tris (pH 8.0), 2 mM EDTA, 1 mM NaVO4, 10 mM NaF and 1 mM sodium orthovanadate (BDH Laboratory, Poole Dorset, UK)). Protein content was determined by DC protein assay according to the manufacturer’s protocol (BioRad Hercules, USA). Western blot analysis was performed as described before.14 Membranes were incubated overnight with primary antibodies against endoglin (R&D systems, Abington, UK), phosphorylated Smad1/5/8 (both Cell Signaling Technologies, Leiden the Netherlands). Blots were stripped and reprobed with an antibody against actin (Millipore, Amsterdam, the Netherlands) antibody as a loading control.
Animal Experiments
All performed animal procedures were approved by the Central Authority for Scientific Procedures on Animals (CCD). For all experiments, female C57/Bl6 jico mice (Jackson) were used, which were allowed to acclimatize for 7 days before the start of the experiment. Both genders were used. Thirty minutes before the surgery, the mice received a subcutaneous injection of 0.1 mg/kg buprenorphine (Indivior North Chesterfield, USA). Mice were sedated using isoflurane (Pharmachemie B.V. Haarlem, the Netherlands) and an incision of 1 cm was made in the skin and peritoneal wall separately, after which the pancreas was elevated. 10.000 KPC-3-Luc2 cells in 50 ul PBS were injected in the tail of the pancreas. Afterwards, the pancreas was carefully placed back, and the peritoneal wall and skin were closed separately. Mice were randomized to treatment groups and treatment was given intraperitoneally (i.p.) twice a week with either 15 mg/kg bodyweight TRC105 (TRACON Pharmaceuticals, San Diego, USA) or human IgG control (BioXcell, West Lebanon, USA). For the combination therapy, mice were injected with anti-endoglin as described above and twice a week with either anti-PD-1 (clone J43, 10 mg/kg bodyweight, i.p. injection) or hamster IgG (both BioXcell, West Lebanon, USA). Mice were monitored twice a week using bioluminescent imaging. Mice were sacrificed 28 days after tumor cell transplantation. The tumor was taken out and measured using a caliper. Researchers were blinded to treatment groups when analyzing tumors. The tumor was divided for histology, flow cytometry analysis and snap-frozen for RNA and protein isolation.
Inducible Fibroblast-Specific Endoglin Knock-Out
To obtain tamoxifen inducible, fibroblast-specific endoglin knock-out mice, mice, in which exon 5–6 of the endoglin gene are flanked by LoxP sides,21 were crossbred with mice expressing cre-recombinase under control of the Collagen 1a1 promoter (Tg(Col1a1-cre/ERT2)1Crm (Jackson Laboratory, Bar Harbor, USA) to obtain a Col1a1eng-/-. Genotyping (Supplementary Figure 1) was performed for the presence of endoglin floxed sides as described,21 and for CRE using the protocol 19078 (Jackson laboratories). To induce recombination, mice received 50 µL of a 100 mg/mL tamoxifen (Sigma-Aldrich, Zwijndrecht, the Netherlands) solution in sunflower oil through oral gavage on three sequential days. Control mice received sunflower oil. One day after the last Tamoxifen dose KPC tumor cells were injected orthotopically as described above.
Immunohistochemistry
Tissue was fixed, dehydrated, and processed to paraffin as described previously.18 Five μm sections wereimmunohistochemically stained using primary antibodies; goat anti-human endoglin (BAF 1097, R&D systems, Abington, UK) and goat anti-mouse endoglin (BAF 1320, R&D systems, Abington, UK), mouse anti-α-SMA (clone: 1A4/ASM-1, Progen, Heidelberg, Germany) mouse anti-pan-cytokeratin (clone: PKC-26, Sigma-Aldrich, Zwijndrecht, the Netherlands) and rabbit anti-vimentin (clone: D21H3, Cell Signaling Technologies, Leiden, the Netherlands). In short, sections were deparaffined and endogenous peroxidase was blocked using 0.3% H2O2 in methanol, rehydrated followed by the antigen retrieval by boiling sections in 0.1M sodium citrate (pH 6.0) buffer. Next, the sections were washed (1%BSA/PBS) and stained with primary antibodies overnight. The next day the slides were washed and incubated with biotinylated secondary antibodies (DAKO, Carpinteria, USA), washed and incubated with vectastain complex (Vectorlabs, Peterborough, UK). The color was developed using 3,3ʹDiaminobenzidine (Dako, Carpinteria, USA). Nuclear staining was performed using Hematoxylin (EMD Millipore Corporation, Amsterdam, the Netherlands). Slides were dehydrated and mounted using entellan (Merck, Darmstadt, Germany). Representative pictures were taken with an Olympus BX51TF microscope (Olympus Life Science Solutions, Zoeterwoude, the Netherlands). Image quantification was performed using ImageJ software (NIH, Bethesda, MD, USA),11 and researchers analyzing the tissues were blinded to treatment groups. To quantify the number of blood vessels 10x magnification of the endoglin staining was used and the number of vessels in 3–5 fields of view (FOV) were counted. For other stainings, the relative stained area was calculated in 3–5 fields per tumor. For human pancreatic tumors, CAF-specific endoglin expression was scored on a scale of 1 to 4 (1: 0–10%; 2: 10–25%; 3: 25–50%, and 4: >50% endoglin positive CAFs vs total amount of CAFs) in a blinded manner by two independent observers (LH and MP).
Immunofluorescent staining was performed as described before.11 In short, sections were deparaffined and antigen retrieval was performed as described above. Slides were incubated with the primary antibodies followed by incubation with goat anti mouse Alexa-488 (Thermo Fisher Scientific, Landsmeer, the Netherlands) and streptavidin PE (BioLegend San Diego, USA) for α-SMA and endoglin stainings, respectively, for 30 minutes. Next, slides were washed and mounted with prolong gold (Thermo Fisher Scientific, Landsmeer, the Netherlands). Pictures were taken using a Confocal microscope, LICA SP8 Lightning was used and pictures were processed using LICA LAS-X software.
Flow Cytometry
Tumors were disrupted with scissors and incubated in 375 µg/mL Liberase TL solution (Sigma-Aldrich, Zwijndrecht, the Netherlands) dissolved in DMEM/F12 containing 10% FCS for 30 minutes at 37°C. To obtain single cells, the suspension was filtered through Falcon™ Cell Strainers with 70 µm pore size (Thermo Fisher Scientific, Landsmeer, the Netherlands) and washed in FACS buffer (0.5% bovine serum albumin (BSA), 0.02% NaN3 in PBS). Cells were stained with antibodies described in Supplementary Table 1 for 45 minutes at room temperature, washed 2x with FACS buffer, and measured on the BD LSRII (BD bioscience, Vianen, the Netherlands) as described before.18 Flow cytometry data analysis was performed using Flowjo 10 software (BD bioscience, Vianen, the Netherlands).
RT-qPCR
Samples were homogenized using a TissueLyser according to manufacturers’ protocol (Qiagen, Hilden, Germany). RNA was isolated from the tissue lysate using Nucleospin RNA kit (Bioké, Leiden, the Netherlands), according to manufacturers’ instructions. RNA concentration was determined using the nanodrop 3300 (Thermo Scientific, Breda, the Netherlands). Next, complementary DNA synthesis was performed using 1 µg RNA using the RevertAid First Strand cDNA synthesis kit, according to manufacturers’ instructions (Thermo Scientific Breda, the Netherlands). Quantitative PCR analyses were performed as described before,18 using primers as described in Supplementary Table 2 (Invitrogen Landsmeer, the Netherlands). All values were normalized for GAPDH expression.
ELISA
Part of the tumor (10–20 mg) was lysed with RIPA buffer as described above, supplemented with a proteinase inhibitor cocktail (Roche, Indianapolis, USA). Subsequently, the tissues were disrupted and homogenized with the TissueLyser and centrifuged for 10 minutes at 11.000 rcf. Protein concentrations were determined with the DC Protein Assay. To investigate tissue TGF-β1 and TRC105 concentrations, enzyme-linked immunosorbent assays (ELISA) were performed. The TGF-β1 ELISA was performed as described before.22 For the TRC105 ELISA Maxisorp flat bottom 96 well plates (NuncTM, Thermo Scientific, Breda, the Netherlands) were coated with 0.1ug/well recombinant human endoglin (R&D systems, Abington, UK) in 0.2M carbonate-bicarbonate pH 9.4 overnight at 4°C. Next, (and after each step) the plate was washed with PBS/0.05% Tween20 (PBST, Merck, Darmstadt, Germany). Subsequently, plates were blocked with assay diluent (1% BSA in PBST) for 1 hour and incubated with the samples for 2 hours and washed. Thereafter, 0.01667ug/mL goat anti-human IgG conjugated HRP antibody (Bethyl Laboratories Montgomery, USA) was added for 60 minutes. After washing, the plate was incubated with substrate TMB (Thermo Fisher Scientific, Landsmeer, the Netherlands) buffer for 12 minutes in dark. 2N H2SO4 was added to stop the reaction and the absorbance was read at 450 nm using the cytation-5 plate Reader (Biotek, Winooski, USA).
Statistical Analysis
Data indicate mean ± standard deviation (SD). Differences between groups were calculated using Students’ t-test, Mann–Whitney analysis, or ANOVA where appropriate using GraphPad Prism 8 software. P values ≤0.05 were considered statistically significant.
Results
Endoglin is Highly Expressed on CAFs in Human and Mouse Pancreatic Tumors
To investigate endoglin expression on CAFs, 25 non-pretreated human pancreatic tumors and normal human pancreatic tissue were immunohistochemically stained for endoglin, α-SMA (a marker for activated fibroblasts), cytokeratin (a marker for epithelial cells) and vimentin (a stromal marker). High accumulation of α-SMA-expressing cells with an elongated phenotype was observed in pancreatic tumors (Figure 1A). Endoglin expression was seen on both α-SMA positive cells as vimentin positive cells and was absent in cytokeratin-expressing cells, suggesting a substantial endoglin positive subset of CAFs in pancreatic tumors (Figure 1A), next to the highly positive endothelial cells. In normal pancreatic tissue mostly endothelial endoglin expression with limited positive fibroblasts were observed (Figure 1A, lower panel). No difference in distribution of CAF-specific endoglin expression was observed when tumor borders were compared to tumor cores (Supplementary figure 2A and B). Colocalisation of endoglin and α-SMA was confirmed by immunofluorescent double staining (Figure 1B). Next, CAF-specific endoglin expression was scored on a scale of 1 to 4 in a cohort of PDAC patients. The majority of the tumors analyzed (20/25 tumors were evaluable) were scored 3 or 4 indicating high CAF-specific endoglin expression (Supplementary figure 3).
 |
Figure 1 Endoglin is highly expressed on CAFs in human pancreatic tumors. (A) Representative images of human pancreatic cancer (representative from n = 25 PDAC patients) and normal pancreas stained for α-SMA, endoglin, cytokeratin, and vimentin. Endothelial cells (black arrow) and endoglin expressing CAFs (white arrow). (B) Immunofluorescent double staining for α-SMA and endoglin in human PDAC tumors. (C) Endoglin mRNA expression by human cells; ECRF endothelial cells, MIA PaCa-2, PANC-1 and BxPC-3 PDAC cells and 8 patient derived primary pancreatic CAFs. (D) Endoglin protein expression on human pancreatic fibroblasts. Basal and BMP9-induced downstream signaling (pSMAD1) was inhibited with TRC105 (full-length blot shown in Supplementary figure 4A–C). |
Next, we investigated the presence of endoglin-expressing CAFs in a murine model for pancreatic cancer and in normal murine pancreas tissue. KPC-3 cells were injected orthotopically, once tumors were 5x5x5 mm mice were sacrificed and tumors were stained for cellular markers. KPC tumors were characterized by significant stromal accumulation (Figure 2A), as described before.19 Next to expression of endoglin on endothelial cells, endoglin staining was present on elongated, spindle-like cells colocalized with the α-SMA and vimentin staining. In normal murine pancreas tissue mostly endothelial endoglin expression was observed (Figure 2A, lower panel). Colocalisation of endoglin and α-SMA was confirmed by immunofluorescent double staining (Figure 2B). Isotype controls show no aspecific staining of the antibodies on human and mouse tissues (Supplementary figure 2C and D). These data indicate endoglin expression on CAFs in human and mouse PDAC tissues, rendering mouse models a suitable tool to study the role of endoglin-expressing CAFs in pancreatic cancer.
 |
Figure 2 Endoglin is highly expressed on CAFs in mouse pancreatic tumors. (A) Representative images of mouse pancreatic tumors (KPC) (representative from n = 5) and normal pancreas stained for α-SMA, endoglin, cytokeratin, and vimentin. Endothelial cells (black arrow) and endoglin expressing CAFs (white arrow). (B) Immunofluorescent double staining for α-SMA and endoglin in mouse KPC tumors. (C) Endoglin mRNA expression by mouse cells; 2H11 endothelial cells, MC38 colorectal cancer, and KPC-3 pancreatic cancer cells, CAFs isolated from colorectal and pancreatic tumors. |
To further investigate endoglin expression on CAFs, human and mouse primary pancreatic tumors were cultured to isolate CAFs. Fibroblasts were confirmed to be positive for vimentin and α-SMA and negative for CD31 (endothelial marker), CD45 (leukocyte marker) and EpCAM (epithelial marker) by qPCR. CAFs cultured from both mouse and human primary tumors showed high endoglin mRNA expression (Figures 1C and 2C). Furthermore, endoglin expression was not detected on mouse KPC as well as MC38 colorectal tumor cells. Low but detectable endoglin expression was detected on MIA PaCa-2 and PANC-1 (both harboring a KRAS mutation) pancreatic cancer cells while low endoglin expression was detected on BxPC-3 cells (wildtype KRAS). Next to the epithelial tumor cells, analysis of eight patient-derived CAFs showed detectable expression of endoglin in vitro. Absolute mRNA levels of endoglin varied among the isolated CAF subsets. These data show that endoglin is expressed on CAFs in human and mouse pancreatic tumors and in vitro on pancreatic cancer derived CAFs, while being absent on epithelial tumor cells.
TRC105 Inhibits BMP-9 Induced Signaling in vitro
Since endoglin can bind BMP-9 and induce downstream signaling, we investigated if the endoglin neutralizing antibody TRC105 was able to inhibit endoglin signaling in pancreatic fibroblasts. High basal phosphorylation of SMAD1, a downstream target of endoglin signaling, was observed, which could be partially inhibited by TRC105 (Figure 1D, Supplementary figure 4A-C). Stimulation with BMP9 strongly increased SMAD1 phosphorylation, which could be inhibited by TRC105, signifying that indeed TRC105 can bind endoglin on fibroblasts and inhibit BMP-9-induced endoglin-mediated downstream signaling in vitro.
TRC105 Does Not Affect Tumor Growth in a Murine Model for Pancreatic Cancer
To investigate the therapeutic potential of anti-endoglin therapy in PDAC we injected murine KPC cells orthotopically in mice. After 14 days mice were treated with TRC105 as described and sacrificed 28 days post tumor implantation. The data revealed that there were no significant differences in either tumor volume (Figure 3A) or tumor weight (Figure 3B) upon TRC105 treatment. Since TRC105 acts, next to inhibiting ligand binding, via immune dependent mechanisms, we assessed immune cell infiltration by flow cytometric analysis on these tumors. Tumors were characterized by low CD45+ immune cell infiltration (4% of the live cell population in IgG control mice), which was hardly affected by TRC105 treatment (5%) (Figure 3C). Although the total percentage of CD45+ infiltrating immune cells did not change, we observed a significant increase in the percentage CD8+ cytotoxic T-cells in tumors from TRC105 treated mice (Figure 3D), which, are instrumental in the therapeutic effects of TRC105.16,18
 |
Figure 3 TRC105 does not affect tumor growth in a murine KPC-3 model for pancreatic cancer. (A) Tumor volume in mm3 and (B) tumor weight upon 13 days of therapy (28 days after tumor inoculation, n = 7 animals per group). (C) Percentage of intratumoral CD45+ cells (gated from live gate) by using flow cytometry. (D) Percentage of CD8+ T-cells (from CD45 gate, n = 6-7 mice per group. (E) Representative histological images and quantifications of endoglin (F), vimentin (G) and α-SMA (H) (n = 7 animals per group). (I) Intratumoral TRC105 levels in tumor lysates determined by ELISA (n = 5 control, n = 3 TRC105). All graphs represent mean ± SD. Student’s T-test was performed to calculate differences indicated in the graphs *p = <0.05 **p = <0.01. |
Since endoglin is highly expressed on endothelial cells and previous research showed decreased blood vessel formation upon TRC105 treatment,16,17 we investigated the number of tumor blood vessels. No differences were observed in the number of endoglin-expressing blood vessels upon TRC105 therapy (Figure 3E and F). Next, the total stromal content of the tumors was analyzed using vimentin staining. These results revealed that total vimentin levels were slightly increased in the KPC tumors treated with TRC105, although not significantly (p = 0.087, Figure 3E and G). This could imply that fibroblast proliferation or immune infiltration is increased by TRC105. However, probably due to the high biological variation, this did not reach statistical significance. Finally, we determined the number of α-SMA expressing CAFs in the tumors, which did not differ between control and TRC105 treated mice (Figure 3E and H).
Pancreatic tumors are known for their high intratumoral pressure and low penetrance of therapeutic compounds.23 To investigate whether therapeutic TRC105 levels are reached in the tumor, we determined intratumoral TRC105 concentrations by ELISA. High intratumoral accumulation of TRC105 (Figure 3I) was observed, indicating that therapeutic levels of TRC105 are present in the tumor. Taken together, these data show that TRC105 penetrates mouse PDAC tumors, increases the percentage of CD8+ cytotoxic T-cells, but does not inhibit tumor growth or affect CAF density.
Combining TRC105 with Anti-PD1 Does Not Increase Therapeutic Responses
Previously, we have shown that the therapeutic effects of TRC105 are dependent on infiltrating immune cells.18 Given the low percentage of CD45+ cells in the KPC tumors, this might hamper therapeutic responses. Therefore, we generated luciferase expressing KPC-3 tumor cells (KPC-luc2), enabling bioluminescent visualization and increasing immunogenicity of the tumor. In a pilot study, KPC-luc2 tumors showed reduced tumor growth, accompanied by an increased number of immune cells, of which a fraction expressed the T-cell activation markers LAG3, TIM3, and PD-1, and altered expression of cytokines compared to non-luciferase expressing KPC tumors (Supplementary figure 5A–E).
Since 80–90% of the T-cells expressed PD-1 (Supplementary figure 5D) and we have previously shown that combined TRC105/PD1 therapy shows increased therapeutic efficiency,13 we investigated the combination in this model. KPC-luc2 cells were injected orthotopically and 14 days after tumor inoculation mice were randomized based on bioluminescent signal from the tumor cells (Supplementary figure 5F), after which therapy was started. Tumor growth was followed by bioluminescent imaging. This was shown not to be representative due to de novo pigment formation on the shaved mouse skin, blocking bioluminescent signal (Supplementary figure 5G). Therefore, the bioluminescent signal did not correlate to the tumor volume in this experiment (Supplementary figure 5H). At the end of the experiment, mice were sacrificed and tumor volume was determined by caliper. No significant differences were detected between the treatment groups (Figure 4A). Although no differences were detected in tumor volume, there was a clear accumulation of TRC105 in the tumor as measured by ELISA (Figure 4B), while no correlation was observed between the TRC105 levels and the tumor volume (Supplementary figure 5I).
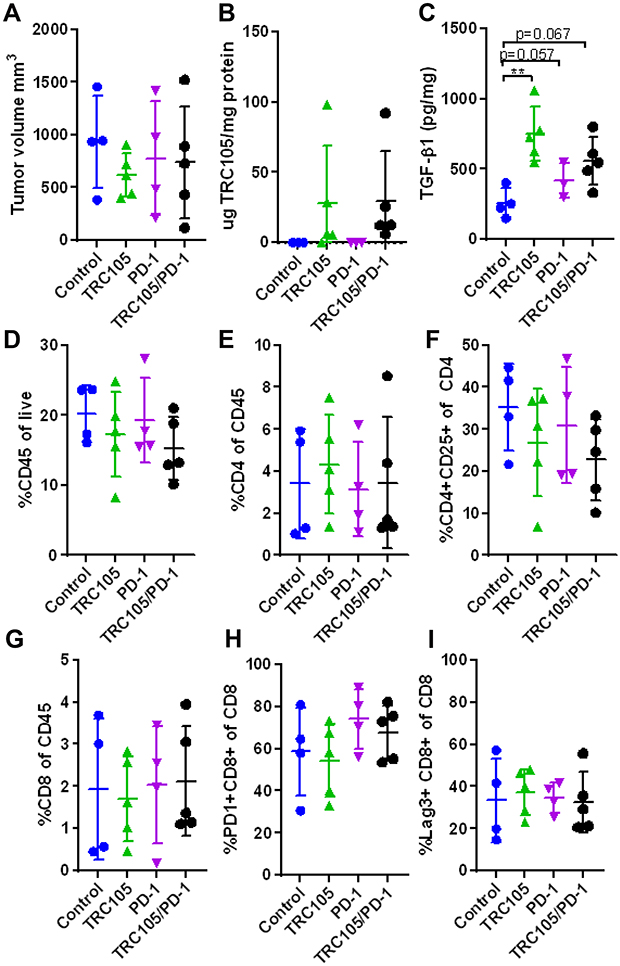 |
Figure 4 Combining TRC105 with anti-PD1 does not increase therapeutic responses in KPC-3luc2 tumors. (A) Tumor volume in mm3 upon 13 days of therapy and 28 days after tumor inoculation (n = 4-5 mice per group). (B) Intratumoral levels of TRC105 and (C) TGF-β1 determined by ELISA (n = 3-5 per group due to limited amount of sample). (D) Total percentage of infiltrating CD45+ immune cells, (E) percentage of CD4+ T-cells out of CD45+ gate and (F) CD4+ CD25+ Treg-like cells out of the CD4+ gate. (G) Percentage of CD8+ T-cells and expression of PD-1 (H) and LAG3 (I) on CD8+ cells (n = 4-5 mice per group). All graphs represent mean ± SD. One-way ANOVA was used to calculate differences. |
Next, the tumor immune infiltrate was examined by flow cytometry. Although most cell populations did not differ between groups (Figure 4D–I), a slightly decreased percentage of CD4+ CD25+ cells (Treg-like cells) was detected in TRC105 treated groups (Figure 4F), albeit not statistically significant. Since Tregs are one of the major producers of TGF-β in pancreatic tumors,24 we investigated tumor TGF-β1 levels by ELISA. Surprisingly, increased tumor TGF-β1 levels were detected in the TRC105 and TRC105/PD1 treated mice (Figure 4C).
Early Treatment with TRC105 After Tumor Inoculation Changes the Tumor Microenvironment without Affecting Tumor Growth
Since the growth speed of KPC tumors is very high, this might limit the opportunities for therapeutic interventions. To investigate if an earlier start of treatment could enhance therapeutic benefits, TRC105, PD1, or combination therapy was initiated 1 day after tumor transplantation and continued twice per week for 28 days. At the end of the experiment, no significant differences in tumor volume were observed between all groups (Figure 5A). Although tumor volumes did not differ, some changes were observed in the immune composition of the tumors. No differences were detected in the total immune infiltrate (Figure 5B), but a non-significantly increased (p = 0.08) percentage of CD3+ T-cells was observed in the TRC105 group (Figure 5C), composed of both the CD4+ and CD8+ population (p = 0.19 and p = 0.06 respectively, Figure 5D and E). A trend towards similar changes was also visible in the TRC105/PD1 combination therapy group. Although the number of total CD4+ T-cells was increased, the percentage of CD25+ CD4+ Tregs cells was slightly decreased upon TRC105 monotherapy (p = 0.087, Figure 5F). Due to the altered presence of immune cells, we analyzed cytokine levels by qPCR. mRNA expression analysis revealed altered cytokine expression (IL-1β, IL-2, IL-6, IL-10, TNFα, INFγ, Granzyme B) in tumor homogenates (Figure 5G) upon combination therapy. Interestingly, especially increased granzyme B mRNA expression was observed upon TRC105/PD1 therapy, as we previously have seen in colorectal cancer models.18 Finally, we investigated the stroma composition by immunohistochemistry. No differences were observed in the abundance of α-SMA, endoglin, vimentin and cytokeratin expressing cells (Figure 5H). These data indicate that treatment with TRC105 or a combination with PD-1 elicits increased cytokine expression and immune cell infiltration, but this is not sufficient to induce therapeutic responses.
 |
Figure 5 Early treatment with TRC105 does not affect tumor growth but changes the tumor microenvironment. (A) Tumor volume in mm3 upon 27 days of therapy and 28 days after tumor inoculation (n = 5-8 mice per group). (B) Percentage of infiltrating immune cells (CD45+). (C) CD3+, (D) CD8+ and (E) CD4+ cells out of CD45 gate. (F) Intratumoral CD4+ CD25+ Treg-like cells out of CD4 gate (n = 5-8 mice per group). (G) Heatmap summarizing qPCR data normalized to the control group of different cytokines, growth factors and stromal markers (n = 5-8 mice per group). (H) Representative histological pictures of α-SMA, endoglin, cytokeratin and vimentin staining (n = 5-8 mice per group). All graphs represent mean ± SD. One-way ANOVA was used to calculate statistical differences. *p = <0.05. |
Col1a1-Specific Endoglin Deletion Alters Immune Cell Composition without Affecting Tumor Growth
To further investigate the effects of endoglin expression on fibroblasts in pancreatic tumors we generated an inducible, Collagen 1a1 driven endoglin knock-out mouse (Col1a1Eng-/-). CRE-mediated recombination was induced by three consecutive days of tamoxifen administration, after which KPC-luc2 tumor cells were injected orthotopically. The Col1a1 driven endoglin deletion did not affect endothelial endoglin expression (Supplementary figure 6). After 28 days, mice were sacrificed and tumor volumes were measured. No differences in tumor volume were observed between wildtype and Col1a1Eng-/- mice (Figure 6A). Additionally, the abundance of α-SMA and endoglin expressing cells did not differ between the groups (Figure 6B). Next, we analyzed the effects of Col1a1-specific endoglin deletion on recruitment of tumor infiltrating immune cells by flow cytometry. The presence of CD45+ immune cells was similar between the controls and the Col1a1eng-/- mice (Figure 6C). Although no significant differences were found in the percentage of the total number of CD3+ T-cells (Figure 6D), the percentage of CD8+ T-cells decreased, with a concomitant increase in the percentage of CD4+ T-cells (Figure 6E and F). The activation markers LAG-3 and PD-1 on the CD8+ T-cells did not differ between the two groups (Figure 6G and H). Finally, mRNA expression analysis for a range of cytokines revealed no differences between Col1a1-specific endoglin knock-out mice and controls (Figure 6I). These data show that Col1a1 driven deletion of endoglin increases the percentage of CD4+ T-cells, without affecting KPC-luc2 tumor growth in vivo.
 |
Figure 6 Col1a1 specific endoglin knock-out does not affect tumor growth but alters immune cell composition. (A) Tumor volume in mm3 after 28 days of tumor inoculation (n = 7 mice per group). (B) Representative pictures of histological samples stained with α-SMA and endoglin (n = 6 mice per group). (C) CD45+ immune infiltrate and (D) CD3 + T-cells (from CD45+ gate). (E) CD8+ and (F) CD4+ cells from (from CD3+ gate). (G) Percentage CD8+ PD1+ cells (from CD8+ gate). (H) Percentage of CD8+ LAG-3+ cells (from CD8+ gate) (n = 6 mice per group). (I) Heatmap summarizing qPCR data normalized to the control group of different cytokines growth factors and stromal markers (n = 6 mice per group) ND in the graph indicates not-detectable. All graphs represent mean ± SD. Student’s T-test was performed to calculate significances indicated in the graphs **p = <0.01. |
Discussion
In this study, we evaluated endoglin as a potential target for the treatment of pancreatic cancer. Although endoglin was highly expressed on both human- and mouse CAFs in pancreatic tumors, no changes in tumor volume were observed when targeting endoglin by TRC105 or genetically deleting endoglin from Col1a1 expressing cells, although some changes in the immune infiltrate were observed.
Although previous data on colorectal cancer mouse models showed that endoglin in combination with PD-1 was very effective in reducing tumor growth,18 this could not be achieved in the KPC model for pancreatic cancer. Pancreatic cancer is characterized by high stromal accumulation, which is thought to limit the success rates of many current treatment options which are effective in other solid cancers. This might be due to forming a physical stromal barrier limiting the number of immune cells or drugs that can enter the tumor.25 Therefore, targeting CAFs might result in a degradation of this physical barrier, thereby increasing therapeutic efficacy. In this study, we showed that although a dense stroma was present, TRC105 accumulated within the tumor and induced changes in immune cell composition- and activation upon TRC105 and combination therapies. Surprisingly, this did not lead to therapeutic effects. An explanation might lie in the presence of different CAF subsets.
It has become clear that CAFs are a very diverse population of cells with multiple CAF subtypes and functions.26,27 Attempts to classify CAFs have led to proposed subsets of inflammatory CAFs (iCAFs) and myofibroblastic CAFs (myCAFs) in PDAC.28 iCAFs are characterized by low expression of α-SMA and high expression of IL-6, whereas myCAFs are characterized by high expression of α-SMA and low expression of IL-6. ICAFs have been shown to promote PDAC progression, whereas myCAFs restrict tumor progression.29 In our experiments, decreased α-SMA and increased IL-6 mRNA levels in the mice treated with TRC105 were detected (Figure 5G and Supplementary figure 7). Interestingly, increased IL-6 protein levels were also seen in the serum of patients treated with TRC105,30 which might suggest an increase of iCAFs upon TRC105 therapy. Although IL-6 is not only produced by CAFs, IL-6 can promote tumor growth, angiogenesis,31 and invasion.32–34 Interestingly, PD-L1 blocking in combination with anti-IL-6 therapy reduced tumor progression in murine pancreatic cancer.35 Since increased IL-6 has been observed in both mice and humans treated with TRC105, a combination of TRC105 with anti-IL-6 might thus be relevant to study.
Next to the suggested myCAFs and iCAF subsets, multiple other subsets of CAFs were described, including the endoglin-expressing CAF subset in prostate- and colorectal cancer.11,12 In breast cancer, we could show decreased α-SMA-expressing CAFs upon endoglin targeting with TRC105 in vivo.14 Endoglin has also been described to play a role in liver fibrosis and cardiac fibrosis.36,37 Surprisingly, targeting endoglin with TRC105 or by means of Col1a1 driven deletion of endoglin did not affect the number α-SMA expressing cells, indicating alternative mechanisms in PDAC.
CAFs in PDAC and KPC tumors have been reported to reduce the migration of cytotoxic (CD8+) T-cells.38 Interestingly, Col1a1 driven endoglin deletion promoted the infiltration of CD4+ T-cells in the tumor and decreased CD8+ T-cells. In contrast, increased CD8+ T-cells were found upon TRC105 therapy, suggesting that TRC105 enables the migration and activation of CD8+ T-cells. This might be due to altering the tumor microenvironment by the targeting of endoglin positive blood or lymphatic vessels or endoglin expressing Tregs.18,39 This was not observed in the Col1a1 driven endoglin knockout mice, confirming that TRC105 was instrumental in increasing the intratumoral CD8+ T-cell count. Although TRC105 was not able to reduce the α-SMA expressing cells in the KPC tumors, other therapies like Focal Adhesion Kinase (FAK) targeting reduced fibrosis in KPC tumors making them susceptible to anti-PD-1 therapy,40 stressing the importance of combining therapies targeting multiple components of the tumor microenvironment.
Next to targeting CAFs, our recent work showed specific targeting of endoglin expressing Tregs by TRC105,18 a phenomenon which was also observed in patients treated with TRC105.41 Interestingly, in this study, we also observed a trend towards a decreased percentage of CD4+CD25+ Tregs upon TRC105 treatment (p = 0.087), which, however, did not affect tumor growth (Figure 5A). In pancreatic cancer, it was recently described that a complete depletion of FoxP3-expressing Tregs increases carcinogenesis by reducing intratumoral TGF-β1 levels.24 However, our data show an increase in intratumoral TGF-β1 levels, which might be due to many cells in the tumor microenvironment producing TGF-β1. Although the role of Tregs in PDAC is yet unclear, recent work showed that disrupting the homing of Tregs via CCR5 or targeting Tregs using anti-OX40 resulted in sustained anti-tumor responses in PDAC.42,43 Interestingly, both CCR5 and OX40 are described to promote fibrosis.44,45 Moreover, targeting OX40 blocks tissue fibrosis, which is induced by activated fibroblasts.45,46 These findings highlight the importance and successes of targeting CAF subsets within the pancreatic tumors, opening new opportunities for PDAC.
Conclusions
In conclusion, while high endoglin expression was observed on CAFs in pancreatic cancer, targeting endoglin by TRC105 as monotherapy, in combination with PD1 checkpoint inhibitors, or by genetic deletion of endoglin from Col1a1 expressing cells did not inhibit tumor growth in the KPC model for pancreatic cancer. Interesting changes in immune cell infiltration might open up opportunities to explore the role of endoglin further. Additional studies will be required to investigate the delicate balances and effects of changes in the tumor microenvironment driving pancreatic tumor progression.
Abbreviations
PDAC, pancreatic ductal adenocarcinoma; CAFs, cancer-associated fibroblasts; TGF, transforming growth factor; BMP, bone morphogenetic protein; ADCC, antibody-dependent cellular cytotoxicity; Tregs, regulatory T-cells; KPC, KrasG12D/+ LSL-Trp53R172H/+ Pdx-1-Cre; FBS, fetal bovine serum; FOV, fields of view; BSA, bovine serum albumin; ELISA, enzyme-linked immunosorbent assays; SD, standard deviation; KPC-luc2 tumor cells, luciferase expressing KPC-3 tumor cells; Col1a1Eng-/- mouse, collagen 1a1 driven endoglin knock-out mouse; iCAFs, inflammatory CAFs; myCAFs, myofibroblastic CAFs; FAK, focal adhesion kinase.
Data Sharing Statement
All data and used materials are available upon request from the corresponding author.
Ethics Approval and Consent to Participate
All experiments using human material were performed according to the guidelines of the Medical Ethical Committee of the LUMC, and conducted in accordance to the Declaration of Helsinki and the Code of Conduct for responsible use of Human Tissue and Medical Research, as drawn up by the Federation of Dutch Medical Societies in 2011. This code permits the further use of coded residual (historical) tissue and data from the diagnostic process for scientific purposes. Permission is granted by implementing an opt-out procedure for the patients, written informed consent is in that case not needed. All experimental protocols were approved by the Medical Ethical Committee of Leiden-Den Haag-Delft (METC-LDD). The use of the aforementioned primary cells was approved by the Medical Ethical Committee of Leiden-Den Haag-Delft (METC-LDD). Human cadaveric donor pancreata were procured through a multiorgan donor program. Pancreatic tissue was used in our study if the pancreas could not be used for clinical pancreas or islet transplantation, according to national laws, and if research consent was present. All animal experiments were executed in accordance with responsible science with animals (2021) and reviewed by the animal welfare body Leiden. The license was issued by the Central Authority for Scientific Procedures on Animals (CCD) based on a positive advice by the Animal Ethics Committee Leiden (AVD116002017858 and AVD11600201571). All animals were housed and cared for in accordance with the Experiments on Animals Act (Wod, 2014). All experiments were performed and are reported according to the ARRIVE guidelines and the code of practice cancer research.
Acknowledgments
The authors would like to thank the Animal facility of the Leiden University Medical Center for facilitating the mouse experiments, Helen Artur for providing us with the endoglin floxed mice, Sjef Verbeek generating the KPC-3-luc2 cells, Prof.dr. E.J.P. de Koning, Dr Carlotti and Dr de Miranda, all LUMC, Leiden for providing us with the human normal pancreatic tissue and Tracon Pharmaceuticals for supplying TRC105. Furthermore, technical support from Marij Mieremet-Ooms, Johan van der Reijden, Amelia Basuki and Rick Angela is highly appreciated.
Author Contributions
All authors made substantial contributions to conception and design, acquisition of data, or analysis and interpretation of data; took part in drafting the article or revising it critically for important intellectual content; agreed to submit to the current journal; gave final approval of the version to be published; and agree to be accountable for all aspects of the work.
Funding
This research was supported by a sponsored research grant from Tracon Pharmaceuticals to LH.
Disclosure
Ms Sarah K Hakuno is employed by InnoSer België NV, outside the submitted work. Dr Lukas JAC Hawinkels reports grants from TRACON Pharmaceuticals, during the conduct of the study. In addition, Dr Lukas JAC Hawinkels has a patent Combination of TRC105-PD1 therapy issued to TRACON. The authors report no other conflicts of interest in this work.
References
1. Karamitopoulou E. Tumour microenvironment of pancreatic cancer: immune landscape is dictated by molecular and histopathological features. Br J Cancer. 2019;121(1):5–14. doi:10.1038/s41416-019-0479-5
2. Erkan M, Michalski CW, Rieder S, et al. The activated stroma index is a novel and independent prognostic marker in pancreatic ductal adenocarcinoma. Clin Gastroenterol Hepatol. 2008;6(10):1155–1161. doi:10.1016/j.cgh.2008.05.006
3. Roeke T, Sobral-Leite M, Dekker TJA, et al. The prognostic value of the tumour-stroma ratio in primary operable invasive cancer of the breast: a validation study. Breast Cancer Res Treat. 2017;166(2):435–445. doi:10.1007/s10549-017-4445-8
4. Sandberg TP, Stuart M, Oosting J, Tollenaar R, Sier CFM, Mesker WE. Increased expression of cancer-associated fibroblast markers at the invasive front and its association with tumor-stroma ratio in colorectal cancer. BMC Cancer. 2019;19(1):284. doi:10.1186/s12885-019-5462-2
5. Awaji M, Singh RK. Cancer-associated fibroblasts’ functional heterogeneity in pancreatic ductal adenocarcinoma. Cancers (Basel). 2019;11:3. doi:10.3390/cancers11030290
6. Erdogan B, Webb DJ. Cancer-associated fibroblasts modulate growth factor signaling and extracellular matrix remodeling to regulate tumor metastasis. Biochem Soc Trans. 2017;45(1):229–236. doi:10.1042/BST20160387
7. Pereira BA, Vennin C, Papanicolaou M, et al. CAF subpopulations: a new reservoir of stromal targets in pancreatic cancer. Trends Cancer. 2019;5(11):724–741. doi:10.1016/j.trecan.2019.09.010
8. Elyada E, Bolisetty M, Laise P, et al. Cross-species single-cell analysis of pancreatic ductal adenocarcinoma reveals antigen-presenting cancer-associated fibroblasts. Cancer Discov. 2019;9(8):1102–1123. doi:10.1158/2159-8290.CD-19-0094
9. Helms E, Onate MK, Sherman MH. Fibroblast heterogeneity in the pancreatic tumor microenvironment. Cancer Discov. 2020;10(5):648–656. doi:10.1158/2159-8290.CD-19-1353
10. Ozdemir BC, Pentcheva-Hoang T, Carstens JL, et al. Depletion of carcinoma-associated fibroblasts and fibrosis induces immunosuppression and accelerates pancreas cancer with reduced survival. Cancer Cell. 2015;28(6):831–833. doi:10.1016/j.ccell.2015.11.002
11. Paauwe M, Schoonderwoerd MJA, Helderman R, et al. Endoglin expression on cancer-associated fibroblasts regulates invasion and stimulates colorectal cancer metastasis. Clin Cancer Res. 2018;24(24):6331–6344. doi:10.1158/1078-0432.CCR-18-0329
12. Romero D, O’Neill C, Terzic A, et al. Endoglin regulates cancer-stromal cell interactions in prostate tumors. Cancer Res. 2011;71(10):3482–3493. doi:10.1158/0008-5472.CAN-10-2665
13. Schoonderwoerd MJA, Goumans MTH, Hawinkels L. Endoglin: beyond the endothelium. Biomolecules. 2020;10:2. doi:10.3390/biom10020289
14. Paauwe M, Heijkants RC, Oudt CH, et al. Endoglin targeting inhibits tumor angiogenesis and metastatic spread in breast cancer. Oncogene. 2016;35(31):4069–4079. doi:10.1038/onc.2015.509
15. Seon BK, Matsuno F, Haruta Y, Kondo M, Barcos M. Long-lasting complete inhibition of human solid tumors in SCID mice by targeting endothelial cells of tumor vasculature with antihuman endoglin immunotoxin. Clin Cancer Res. 1997;3(7):1031–1044.
16. Tsujie M, Tsujie T, Toi H, et al. Anti-tumor activity of an anti-endoglin monoclonal antibody is enhanced in immunocompetent mice. Int J Cancer. 2008;122(10):2266–2273. doi:10.1002/ijc.23314
17. Uneda S, Toi H, Tsujie T, et al. Anti-endoglin monoclonal antibodies are effective for suppressing metastasis and the primary tumors by targeting tumor vasculature. Int J Cancer. 2009;125(6):1446–1453. doi:10.1002/ijc.24482
18. Schoonderwoerd MJA, Koops MFM, Angela RA, et al. Targeting endoglin-expressing regulatory T cells in the tumor microenvironment enhances the effect of PD1 checkpoint inhibitor immunotherapy. Clin Cancer Res. 2020;26(14):3831–3842. doi:10.1158/1078-0432.CCR-19-2889
19. Hingorani SR, Wang L, Multani AS, et al. Trp53R172H and KrasG12D cooperate to promote chromosomal instability and widely metastatic pancreatic ductal adenocarcinoma in mice. Cancer Cell. 2005;7(5):469–483. doi:10.1016/j.ccr.2005.04.023
20. Hawinkels LJ, Kuiper P, Wiercinska E, et al. Matrix metalloproteinase-14 (MT1-MMP)-mediated endoglin shedding inhibits tumor angiogenesis. Cancer Res. 2010;70(10):4141–4150. doi:10.1158/0008-5472.CAN-09-4466
21. Allinson KR, Carvalho RL, van den Brink S, Mummery CL, Arthur HM. Generation of a floxed allele of the mouse Endoglin gene. Genesis. 2007;45(6):391–395. doi:10.1002/dvg.20284
22. Hawinkels LJ, Verspaget HW, van Duijn W, et al. Tissue level, activation and cellular localisation of TGF-beta1 and association with survival in gastric cancer patients. Br J Cancer. 2007;97(3):398–404. doi:10.1038/sj.bjc.6603877
23. Nieskoski MD, Marra K, Gunn JR, et al. Collagen complexity spatially defines microregions of total tissue pressure in pancreatic cancer. Sci Rep. 2017;7(1):10093. doi:10.1038/s41598-017-10671-w
24. Zhang Y, Lazarus J, Steele NG, et al. Regulatory T-cell depletion alters the tumor microenvironment and accelerates pancreatic carcinogenesis. Cancer Discov. 2020;10(3):422–439. doi:10.1158/2159-8290.CD-19-0958
25. Huang H, Brekken RA. The next wave of stroma-targeting therapy in pancreatic cancer. Cancer Res. 2019;79(2):328–330. doi:10.1158/0008-5472.CAN-18-3751
26. Ligorio M, Sil S, Malagon-Lopez J, et al. Stromal microenvironment shapes the intratumoral architecture of pancreatic cancer. Cell. 2019;178(1):160–175e27. doi:10.1016/j.cell.2019.05.012
27. Harryvan TJ, Verdegaal EME, Hardwick JCH, Hawinkels L, van der Burg SH. Targeting of the cancer-associated fibroblast-T-cell axis in solid malignancies. J Clin Med. 2019;8:11. doi:10.3390/jcm8111989
28. Ohlund D, Handly-Santana A, Biffi G, et al. Distinct populations of inflammatory fibroblasts and myofibroblasts in pancreatic cancer. J Exp Med. 2017;214(3):579–596. doi:10.1084/jem.20162024
29. Sun Q, Zhang B, Hu Q, et al. The impact of cancer-associated fibroblasts on major hallmarks of pancreatic cancer. Theranostics. 2018;8(18):5072–5087. doi:10.7150/thno.26546
30. Liu Y, Starr MD, Brady JC, et al. Modulation of circulating protein biomarkers following TRC105 (anti-endoglin antibody) treatment in patients with advanced cancer. Cancer Med. 2014;3(3):580–591. doi:10.1002/cam4.207
31. Gopinathan G, Milagre C, Pearce OM, et al. Interleukin-6 stimulates defective angiogenesis. Cancer Res. 2015;75(15):3098–3107. doi:10.1158/0008-5472.CAN-15-1227
32. Zhang Y, Yan W, Collins MA, et al. Interleukin-6 is required for pancreatic cancer progression by promoting MAPK signaling activation and oxidative stress resistance. Cancer Res. 2013;73(20):6359–6374. doi:10.1158/0008-5472.CAN-13-1558-T
33. Razidlo GL, Burton KM, McNiven MA. Interleukin-6 promotes pancreatic cancer cell migration by rapidly activating the small GTPase CDC42. J Biol Chem. 2018;293(28):11143–11153. doi:10.1074/jbc.RA118.003276
34. Kumari N, Dwarakanath BS, Das A, Bhatt AN. Role of interleukin-6 in cancer progression and therapeutic resistance. Tumour Biol. 2016;37(9):11553–11572. doi:10.1007/s13277-016-5098-7
35. Mace TA, Shakya R, Pitarresi JR, et al. IL-6 and PD-L1 antibody blockade combination therapy reduces tumour progression in murine models of pancreatic cancer. Gut. 2018;67(2):320–332. doi:10.1136/gutjnl-2016-311585
36. Finnson KW, Philip A. Endoglin in liver fibrosis. J Cell Commun Signal. 2012;6(1):1–4. doi:10.1007/s12079-011-0154-y
37. Chen K, Mehta JL, Li D, Joseph L, Joseph J. Transforming growth factor beta receptor endoglin is expressed in cardiac fibroblasts and modulates profibrogenic actions of angiotensin II. Circ Res. 2004;95(12):1167–1173. doi:10.1161/01.RES.0000150369.68826.2f
38. Ene-Obong A, Clear AJ, Watt J, et al. Activated pancreatic stellate cells sequester CD8+ T cells to reduce their infiltration of the juxtatumoral compartment of pancreatic ductal adenocarcinoma. Gastroenterology. 2013;145(5):1121–1132. doi:10.1053/j.gastro.2013.07.025
39. Yoshitomi H, Kobayashi S, Ohtsuka M, et al. Specific expression of endoglin (CD105) in endothelial cells of intratumoral blood and lymphatic vessels in pancreatic cancer. Pancreas. 2008;37(3):275–281. doi:10.1097/mpa.0b013e3181690b97
40. Jiang H, Hegde S, Knolhoff BL, et al. Targeting focal adhesion kinase renders pancreatic cancers responsive to checkpoint immunotherapy. Nat Med. 2016;22(8):851–860. doi:10.1038/nm.4123
41. Karzai FH, Apolo AB, Cao L, et al. A Phase I study of TRC105 anti-endoglin (CD105) antibody in metastatic castration-resistant prostate cancer. BJU Int. 2015;116(4):546–555. doi:10.1111/bju.12986
42. Tan MC, Goedegebuure PS, Belt BA, et al. Disruption of CCR5-dependent homing of regulatory T cells inhibits tumor growth in a murine model of pancreatic cancer. J Immunol. 2009;182(3):1746–1755. doi:10.4049/jimmunol.182.3.1746
43. Ma Y, Li J, Wang H, et al. Combination of PD-1 inhibitor and OX40 agonist induces tumor rejection and immune memory in mouse models of pancreatic cancer. Gastroenterology. 2020;159(1):306–319.e12. doi:10.1053/j.gastro.2020.03.018
44. Seki E, De Minicis S, Gwak GY, et al. CCR1 and CCR5 promote hepatic fibrosis in mice. J Clin Invest. 2009;119(7):1858–1870.
45. Elhai M, Avouac J, Hoffmann-Vold AM, et al. OX40L blockade protects against inflammation-driven fibrosis. Proc Natl Acad Sci USA. 2016;113(27):E3901–10. doi:10.1073/pnas.1523512113
46. Collison J. Connective tissue diseases: OX40L inhibition blocks tissue fibrosis. Nat Rev Rheumatol. 2016;12(8):438. doi:10.1038/nrrheum.2016.110
 © 2021 The Author(s). This work is published and licensed by Dove Medical Press Limited. The
full terms of this license are available at https://www.dovepress.com/terms
and incorporate the Creative Commons Attribution
- Non Commercial (unported, 3.0) License.
By accessing the work you hereby accept the Terms. Non-commercial uses of the work are permitted
without any further permission from Dove Medical Press Limited, provided the work is properly
attributed. For permission for commercial use of this work, please see paragraphs 4.2 and 5 of our Terms.
© 2021 The Author(s). This work is published and licensed by Dove Medical Press Limited. The
full terms of this license are available at https://www.dovepress.com/terms
and incorporate the Creative Commons Attribution
- Non Commercial (unported, 3.0) License.
By accessing the work you hereby accept the Terms. Non-commercial uses of the work are permitted
without any further permission from Dove Medical Press Limited, provided the work is properly
attributed. For permission for commercial use of this work, please see paragraphs 4.2 and 5 of our Terms.