Back to Journals » Neuropsychiatric Disease and Treatment » Volume 19
Systematic Review on EEG Analysis to Diagnose and Treat Autism by Evaluating Functional Connectivity and Spectral Power
Authors Bogéa Ribeiro L, da Silva Filho M
Received 21 October 2022
Accepted for publication 5 January 2023
Published 22 February 2023 Volume 2023:19 Pages 415—424
DOI https://doi.org/10.2147/NDT.S394363
Checked for plagiarism Yes
Review by Single anonymous peer review
Peer reviewer comments 2
Editor who approved publication: Dr Roger Pinder
Louise Bogéa Ribeiro,* Manoel da Silva Filho*
Federal University of Pará, Assistive Prototyping Lab, Belém-PA, Brazil
*These authors contributed equally to this work
Correspondence: Louise Bogéa Ribeiro, Federal University of Pará, Assistive Prototyping Lab, Governador José Malcher Ave, 1423, Belém-PA, 66060230, Brazil, Tel +55 (91) 992341623, Email [email protected]
Abstract: An abnormality in neural connectivity is linked to autism spectrum disorder (ASD). There is no way to test the concept of neural connectivity empirically. According to recent network theory and time series analysis findings, electroencephalography (EEG) can assess neural network architecture, a sign of activity in the brain. This systematic review aims to evaluate functional connectivity and spectral power using EEG signals. EEG records the brain activity of an individual by displaying wavy lines that depict brain cells’ communication through electrical impulses. EEG can diagnose various brain disorders, including epilepsy and related seizure illness, brain dysfunction, tumors, and damage. We found 21 studies using two of the most common EEG analysis methods: functional connectivity and spectral power. ASD and non-ASD individuals were found to differ significantly in all selected papers. Due to high heterogeneity in the outcomes, generalizations cannot be drawn, and no single method is currently beneficial as a diagnostic tool. For ASD subtype delineation, the lack of research prevented the evaluation of these techniques as diagnostic tools. These findings confirm the presence of abnormalities in the EEG in ASD, but they are insufficient to diagnose. Our study suggests that EEG is useful in diagnosing ASD by evaluating entropy in the brain. Researchers may be able to develop new diagnostic methods for ASD which focuses on particular stimuli and brainwaves if they conduct more extensive studies with higher numbers and more rigorous study designs.
Keywords: autism spectrum disorder, neuroimaging, early diagnoses, multiscale entropy
Introduction
Many symptoms and functional limitations are associated with autism spectrum disorder (ASD), including mild and severe forms. ASD is a neurodevelopment disorder characterized by difficulties in social interactions, communication, and repetitive behaviors.1 ASD is a prevalent disorder, as one in fifty-four children is diagnosed with the neurodevelopmental condition.1 Some people with ASD are unaware that they have a disorder.2
Electroencephalographic (EEG) is a direct noninvasive measure used to examine the macroscopic neuronal circuit’s functionality and maturation, prompting an assessment of brain activities such as rhythms and dynamics.1 Hence, EEG can be used to indicate the presence of ASD among individuals by assessing the deviation in brain activities and circuitry. The lack of sensory responses and activities among participants can be used to indicate ASD.1 In this study, the EEG signals were used to identify and diagnose ASD among individuals). The functional connectivity of individuals at a high risk of ASD is lower than those with a low risk.3 The low functional connectivity can be manifested in language processing among three months old infants with a high ASD risk compared to healthy infants.3 Functional connectivity can be attributed to general underconnectivity, local overconnectivity, long-range underconnectivity, and reduced network segregation and integration.4 Additionally, children with ASD had a lower alpha spectral power than healthy children.5 In relation to the alpha spectral power, the EEG variables of interest can be influenced by the affective and cognitive state.5 As an indicator of brain connectivity, EEG coherence measures how well two EEG signals (measured on a frequency-by-frequency basis) stay in phase over time. EEG coherence can be used to compare two EEG channels. A high coherence value indicates a high degree of connectivity, while a low coherence value indicates a low level of connectivity.6 The power spectrum quantifies the local synchronization of the brain regions during the resting state, while the functional connectivity gauges the long-range interactions of the brain sections during the resting state.¹
A sine wave can be generated through the cross-spectrum of connectivity versus the volume conduction inside a sphere that contains sensors on its surface. The EEG coherence between two sections of the brain is associated with the distance between the electrodes in the two regions, which can be decreased at longer distances by the signal phase variation. In contrast, they are inflated at shorter distances by the effect of volume conduction. Coherence provides a quantifiable measurement of inter-electrode connectedness primarily invisible to the naked eye, thus becoming a significant advantage. This phenomenon has at least three reasonable interpretations. First, an EEG signal shows a complicated and concurrent combination of many sine waves, each with a distinct frequency.7 High coherence, on the other hand, signifies long-term stability in the phase relationship (or difference) between two sine waves with the same frequency.
Second, considering that many sine waves of various frequencies are present at once in typical EEG, the human eye has difficulty assessing the stability of phase shifts over time. Third, the stability of phase shifts varies widely depending on the spectral frequency.8 Long EEG segments are typically required for reliable and reproducible coherent measurements. These long iterations further complicate an electroencephalographer’s ability to accurately estimate the coherence between two EEG channels by visual inspection alone.
The rationale for selecting the EEG analysis to diagnose or treat ASD was based on four factors. The firstly was that the EEG analysis could be utilized to deduce anomalous neural connectivity associated with autism.9 Secondly, EEG analyses are used because they can detect atypical neural abnormalities correlated to behavioral and functional symptoms associated with ASD.9 Thirdly, the simplicity, reliability, and cost-effectiveness of the EEG devices that contain simple calibration that can provide essential biomarkers for early assessment of ASD and monitoring of the disorder’s progression were important in determining the use of the EEG analysis.9,10 Fourthly, EEG analysis is a novice technique that applies multiscale entropy to measure the scales compared to the traditional five frequency bands (gamma, beta, delta, theta, and alpha).9 EEG signals can diagnose ASD among individuals using two techniques; (a) comparison and (b) pattern recognition methods.11 The comparison technique is based on the recognition of the EEG signal traits that are typical to a person diagnosed with ASD, while the pattern method is based on diagnostic algorithms that classify in either class 1 (ASD individual) or class 2 (non-ASD).11
Materials and Methods
Search and Selection Strategy
PubMed, Embase, PsycInfo, and CINAHL were used to conduct the literature search alongside Medline. The most relevant studies were found using keyword searches: ASD, autism, EEG, encephalography, multiscale entropy, and functional issues (Supplementary Data 1).
Inclusion and Exclusion Criteria
The inclusion and exclusion criteria are based on several key factors (Supplementary Data 2). A detailed description has been provided using the PRISMA flow diagram (Figure 1).
 |
Figure 1 PRISMA flow diagram for further selecting some key journals. The inclusion and exclusion criteria were based on six factors; the year of publication, the country, language, subject, type of materials, and the population included. The studies were included if they were (a) published between 2007 to 2022 in any country worldwide, (b) written in English., (c) involved EEG signals in diagnosing ASD in children and adults with ASD disorder, and (d) peer-reviewed articles. The studies were also considered eligible if they included individuals with ASD diagnosed based on the Diagnostic and Manual of Mental Disorders, Fourth Edition (DSM-IV) and if the diagnosis was based on the individual’s age and intelligence quotient (IQ). Finally, the EEG signal analysis on functional connectivity and lower spectral power. Notes: PRISMA figure adapted from Page MJ, McKenzie JE, Bossuyt PM, et al. The PRISMA 2020 statement: An updated guideline for reporting systematic reviews. Syst Rev. 2021;10 (89). Creative Commons. |
A four-step vetting process was initiated to determine the eligibility of the articles included in the review. First, the titles of the studies were reviewed to determine if the information involved EEG analysis, ASD diagnosis, functional connectivity, and spectral power. The articles selected based on the title screening were included in the second step. The second step was the appraisal of the studies’ abstracts to establish the objectives, methods, and outcomes. In the third step, the full text is appraised to obtain more details on factors such as participant selection and the quality of the findings. Finally, the fourth step involved the independent review of the articles to ensure compliance with the eligibility criteria and the quality of the studies.
Results
Functional Connectivity
Our results based on 11 studies which focused on functional connectivity show that the prefrontal cortex and other brain regions tend to have fewer long-range interconnections in the alpha band (Table 1). Seven of the eleven studies examined alpha-band coherence, and four found evidence of underconnectivity. There were significant differences in alpha band connectivity between participants with ASD and controls, with fewer long-range connections, especially from the frontal areas, using a high-density EEG montage (containing 124 electrodes) in laid-back eyes-closed condition.12 The results might have been influenced by medicines that some of the populations were taking.12 People with ASD who performed two tasks requiring object recognition showed a general reduction in brain networks in the alpha band.13 Another recent study recreated the decrease in long-range alpha-band connectivity while participants watched video clips of either familiar or unfamiliar people prepping for stories.14 The brain’s connectivity is measured by calculating clustering in a fourth study that supports this theory. It is possible to demonstrate reduced whole-brain connectivity in toddlers, especially in the alpha band, using cluster analytic tools.15
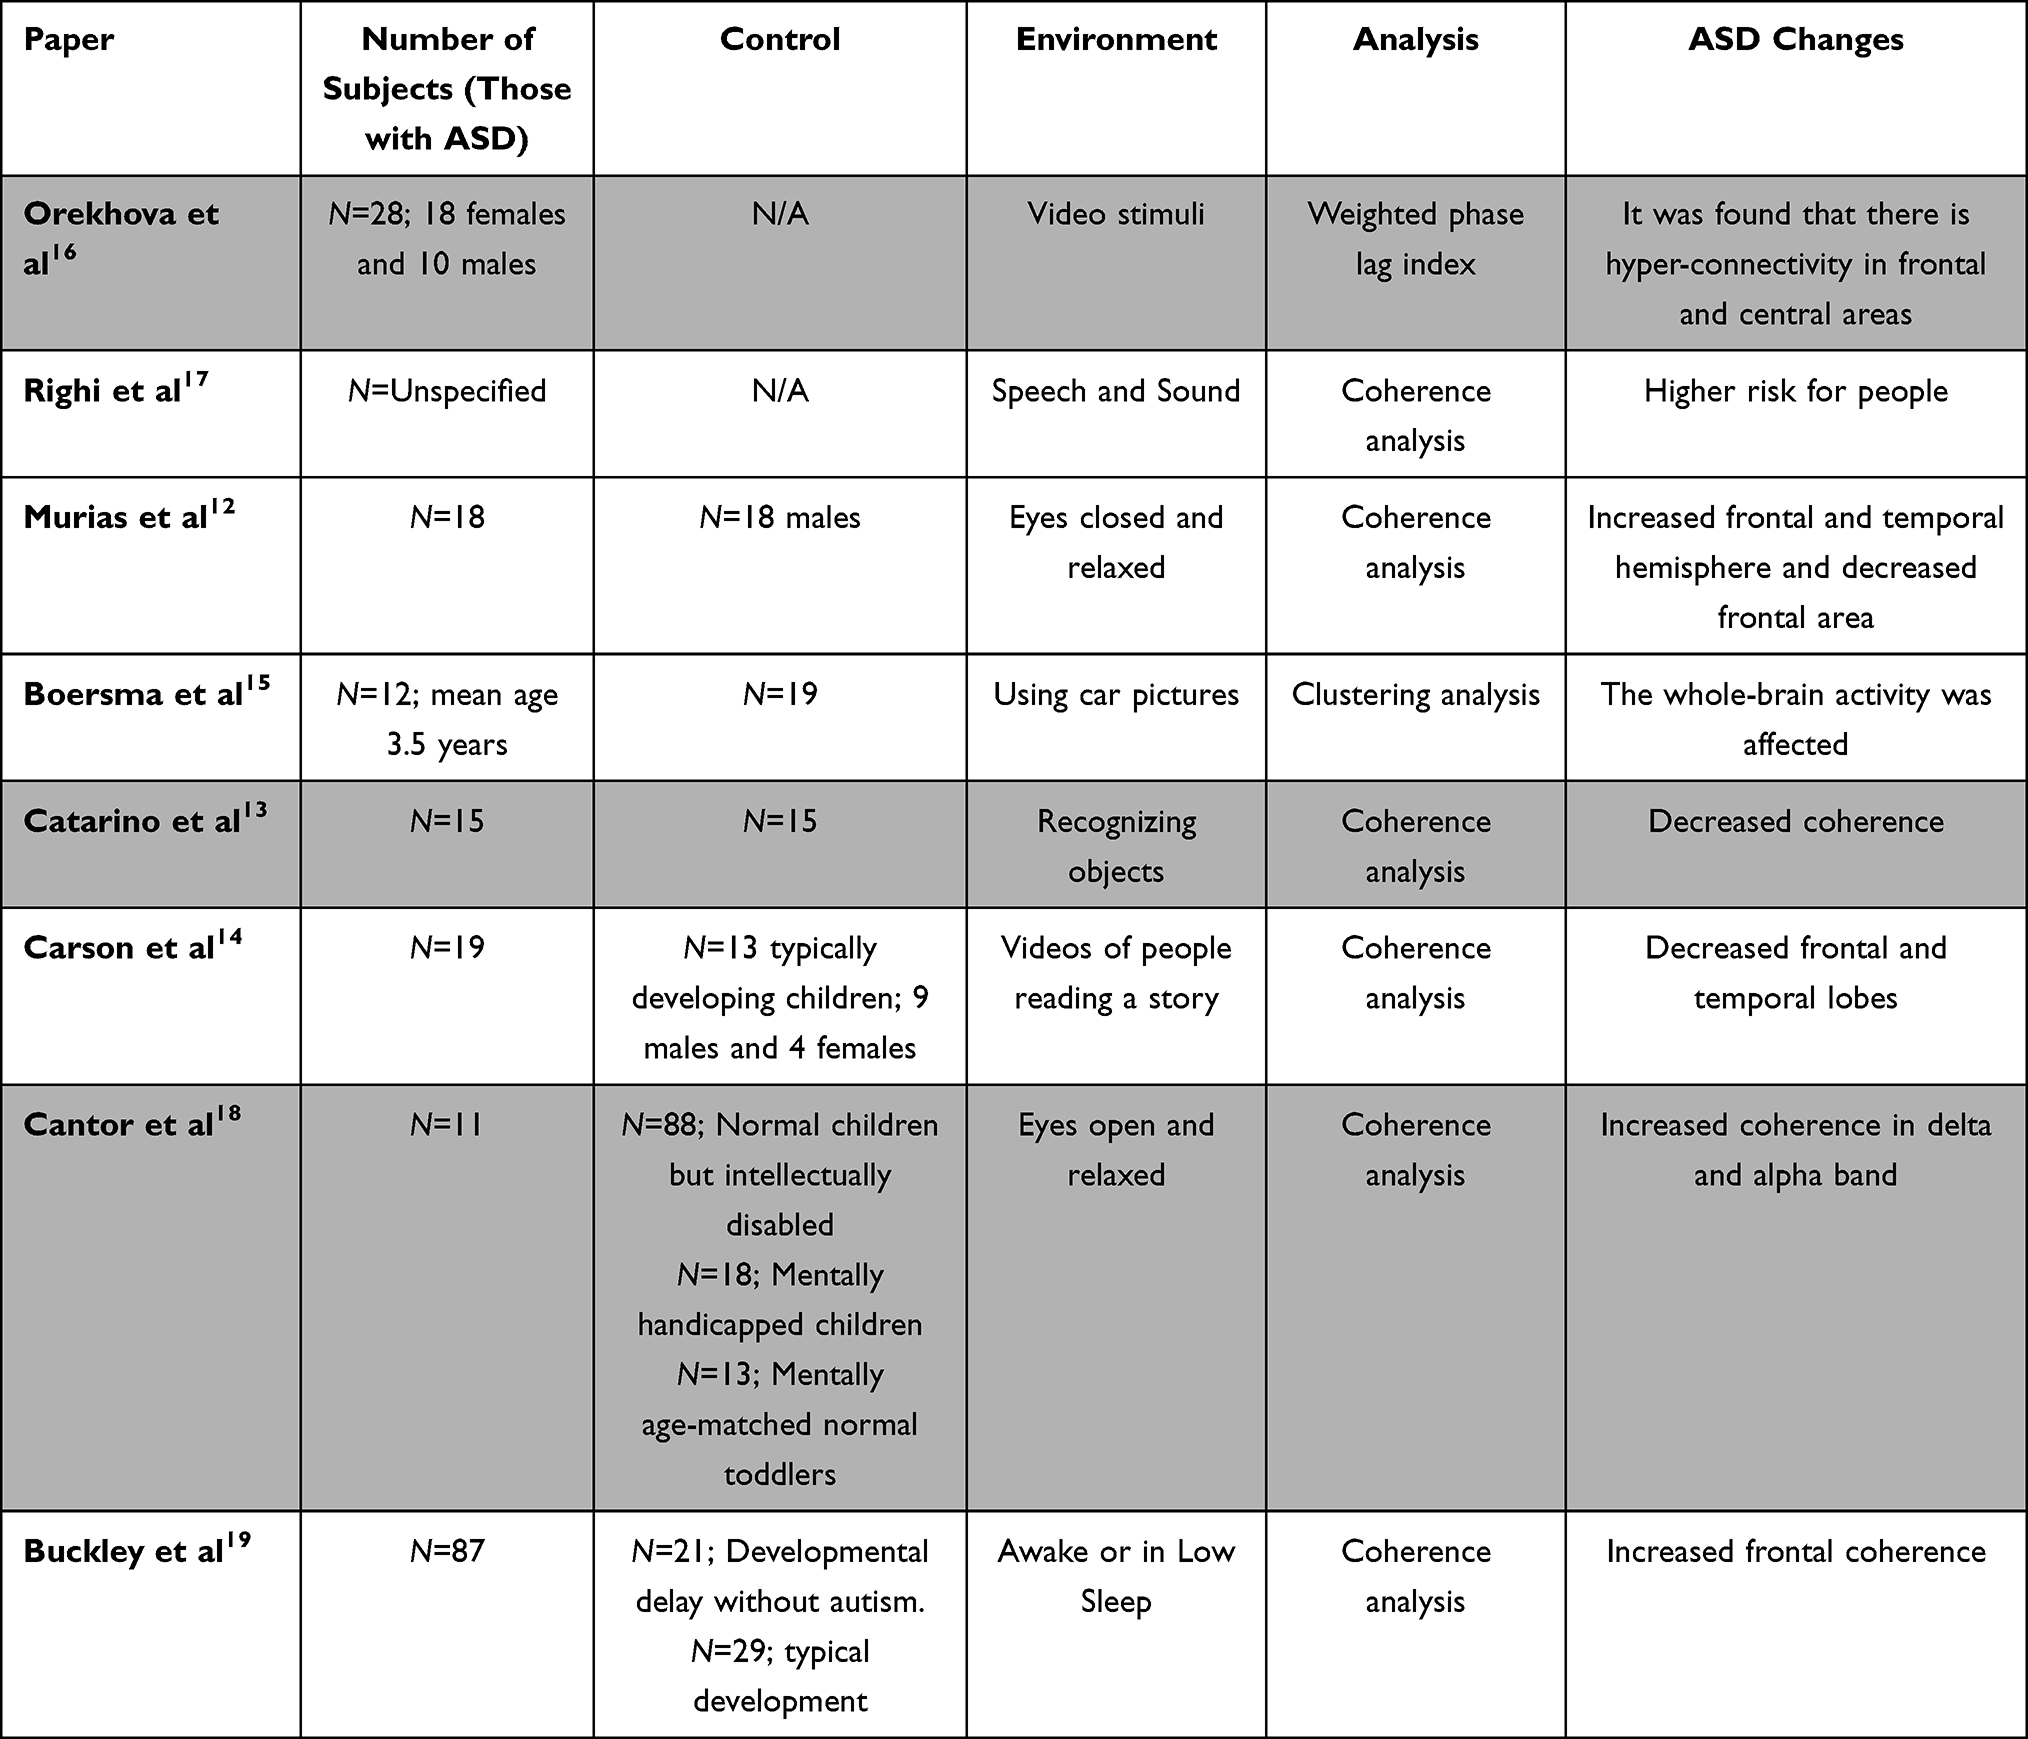 |
Table 1 Selected Studies Related to Functional Connectivity for an Overview of Relevant Advances in the Field |
Conversely, three of the six studies produced conflicting results. At 14 and 38 months, participants were tested at high and low risk of developing ASD.16 In this longitudinal study, participants with ASD were found to have hyper-connectivity in the alpha band between the anterior and focal regions of the brain. Researchers found evidence of a decrement in alpha connectedness within both hemispheres while testing participants with their eyes open and relaxed.18 Children aged 2–6 years old were tested in three different sleep states, and it was found that ASD participants’ long-range relationships in the precentral gyrus areas were more coherent than those of neurotypical individuals.19 Short-range, local over interconnection has also been shown in anatomical and functional studies, as evidenced by increases in short-range association fibers.20 Theta oscillations are also the driving force behind locally dominant procedures.21 Findings from three fMRI studies were backed up by three studies that did not substantiate over connectivity in this frequency spectrum.13,22
Researchers discovered a significant theta band over connectivity in the left hemisphere’s frontal and temporal regions.12 The occipital lobe’s visual area and other brain regions have increased long-range connectivity while studying respondents during rapid eye movement.22 Coherence in the theta band increased during an object-recognition task. Three studies have found the whole nervous system underconnectivity in the theta band, the first two using visual recognition activities. At the same time, evidenced interconnection in the frontal and temporal regions.
Only six of the 11 functional and structural studies however, found significant results with delta and beta bands. Contrary to what one might expect, it was found that long-range delta data transmission between the anterior and cortex regions was reduced. In contrast, the frontal region showed increased delta connectivity. In addition, the asleep study found that the long delta connectivity between the cortex area of the brain and the rest of the brain was significantly increased.22 The theta band also shows a decrease in anterior and sequential coherence, and, using the beta band, researchers have discovered a decrease in connectivity between neurons.15 Despite these results, 9 of the 11 publications did not find any significant distinction in the beta band. As a result of the different EEG recording conditions and age differences among the participants, generalization could not be drawn.
Spectral Analysis
Twenty of the studies included spectral analysis as a method of identifying ASD. At least one frequency band showed statistically significant differences between ASD and non-ASD individuals in spectral power across all studies. They looked at differences in spectral properties like amplitude and differences in absolute or relative spectral power. The signal was recorded with eyes open or shuttered during slumber, mental performance, or when paying attention to video or audio cues. Table 2 shows a summary of the most recent results.
 |
Table 2 Selected Studies Related to Spectral Power for an Overview of Relevant Advances in the Field |
Although some generalizations can be drawn from the spectral band research results, some discrepancies exist. To begin, substantial variations in the alpha band were observed in five studies conducted with open, relaxed eyes.18,21,23,24 The absolute spectral power of ASD was reduced in four studies in children of the same age, but the alpha power of adults was found to be elevated in another study.24 Because of the wide range of ages represented in the study, it is possible that the discrepancies arise from the fact that children with ASD have varying developmental paths. Compared to non-ASD controls, an increase in alpha power was found in participants with ASD while they were engaged in a cognitive task. However, not enough studies used the same conditions to draw reliable conclusions.25
In the analysis of spectral amplitudes across all frequency bands, the ASD population has significantly higher amplitudes. Discriminant function analyses also show high specificity (98.1%) and 77.8% accuracy in distinguishing ASD from non-ASD individuals based on beta amplitudes. For generalization, absolute gamma power is increased in the ASD population compared to non-ASD individuals.26 There was statistically relevant increased gamma power, particularly in the leisurely eyes open condition. Researchers found that gamma power increased in the apex, synovial membrane, and temporal regions when the eyes were open and wide open.27 A visual attention task was used to replicate this finding, and two cognitive studies supported it.28,29 The inconsistencies in the theta band made it impossible to authenticate any of the results. Three studies conducted during sleep, including two with relaxed eyes open and one while performing a cognitive task, found decreased power in theta band power during sleep and while performing the cognitive task.24,30,31 The inconsistent results may be due to the small datasets and wide age range of the participants.
Discussion
Notably, ASD features can occur as early as 12 months; however, it is hard to diagnose a child during the first year based only on behavioral aspects.32 The aim of introducing the EEG analysis techniques was to identify early biomarkers to help diagnose ASD. Studies conducted based on the EEG resting state have revealed evidence that selective alterations can be recognized in six months.32 Underconnectivity and poor communication between the brain regions result in a lack of functional integration within the system of an ASD individual.17,33–37
Sheikhani et al34 evaluated the effectiveness of Quantitative EEG as a neurophysiologic diagnostic tool among children with autism. The study involved 17 autistic children aged between 6 and 11 years. The findings showed that the alpha frequency band (8–13 Hz) had the best distinction level of 96.4% in the relaxed eye-opened state. The left cerebral hemisphere spectrogram criterion values for the ASD group were significantly lower (p<0.01) at the F3 and T3 electrodes and (p<0.05) at the FP1, F7, C3, Cz, and T5 electrodes. There are more abnormalities with greater connectivity of the temporal lobes with other lobes in the gamma frequency region, based on the coherence values at 171 pairs of EEG electrodes (36–44 Hz). The findings imply that ASD problems are associated with the coordination of larger brain regions.34
den Bakker et al35 examined retrospective waking and sleep EEGs from children with Angelman syndrome (AS) aged between 4 and 11 years and age-matched neurotypical controls. By measuring coherence across several frequencies while awake and asleep, the researchers evaluated both long- and short-range functional connectivity. Both automatic and manual methods were used to measure sleep spindles. Findings demonstrated that Children with AS exhibited improved long-range EEG coherence across a broad range of frequencies while awake and a higher long-range EEG coherence while sleeping, especially in the gamma band. Fewer and shorter-lasting sleep spindles were present in the EEGs of children with AS compared to neurotypical children.35
A different study also examined the risks of autism among children with siblings diagnosed with the condition.17 The researchers established that by 12 months, infants at risk of ASD had lower functional connectivity compared to their counterparts. Furthermore, compared to infants at low risk of the disease and newborns at high risk who were later not diagnosed with the disorder, by 12 months, infants, who were later diagnosed with ASD showed impaired functional connectivity. Significant variations in functional connectivity between high-risk and low-risk infants who did not go on to develop ASD were also discovered. These findings show that decreased functional connectivity can be linked to genetic susceptibility to ASD. Additionally, the results suggest that ASD is generally defined by variations in neuronal integration that appear within the first year of life.17
Khan et al36 measured task-related local functional connectivity in the fusiform face area (FFA) of individuals with ASD and typically developing individuals using magnetoencephalography. In the process, the participants’ neutral faces, emotional faces, and houses were also viewed. This task-related local functional connectivity was manifested by coupling between the phase of alpha oscillations and the amplitude of gamma oscillations. During the same paradigm, the researchers also evaluated task-related long-range functional connectivity between the FFA and cortex.36 It was established that people with ASD had a less local functional connection within the FFA, based on their appearances. Additionally, in both groups, the strength of local and long-range functional connection was inversely associated; as a result, the ASD group showed a proportionately greater reduction in both types of connectivity.36
Individuals with a positive diagnosis of ASD have reduced network entropy in the cerebellar cluster region compared to the non-ASD population.37 Also, individuals with ASD exhibit limited structural connectivity among several brain spheres compared to the non-ASD population, impacting the individual’s clinical symptoms and behavioral aspects.38 In ASD individuals, a U-shaped pattern was identified based on power abnormalities, improved power in the left brain region and underconnectivity within long ranges, and local overconnectivity. Reduced power of frequencies was present among infants who are at a high risk of obtaining ASD compared to those infants with a low-risk age of six months old.32
Isler et al39 investigated the hypothesis that interhemispheric functional connection during visual stimulation is less in autistic children compared to their counterparts through an examination of EEG synchrony between homologous early visual regions. The researchers found that interhemispheric synchronization in and below the theta band was 50% lower in autistic participants than in the controls. Although power was bilaterally increased in autistic participants, interhemispheric synchrony was diminished. Children with autism displayed a faster initial response to stimulus, a delayed recovery, and stronger modulation at longer latencies based on wavelet power.39
Okazaki et al40 conducted a clinical case study to evaluate EEG complexity to shed light on the neurophysiological mechanism of electroconvulsive therapy (ECT) in ASD. The frontal-central region demonstrated decreased EEG complexity in conjunction with ECT at higher temporal scales, whereas the occipital region showed intensification at lower temporal scales. The changes were connected to a rise in brain-derived neurotrophic factor, a molecular hypothesis of ECT that plays an important role in the pathophysiology of ASD and clinical improvement.40
Spectral analysis of internal entropy revealed consistently reduced long-range interconnection in the alpha band and short-range interconnection in the theta band in ASD participants. Functional and structural metrics for ASD detection may have useful utility based on these results, but further research is needed to confirm this. The interpretation of activation patterns between substratum or scalp regions presents methodological challenges. The synchronization between time series can be defined in more than six ways.30
Various methods for determining the degree of connectedness between sensor locations use terms like coherence, correlation, and synchronization. It is important to note that EEG recordings typically require more complex electrode arrangements and advanced computational power for this type of data analysis. These prerequisites may not necessitate simple, lightweight, and portable devices that non-specialists can operate. The technical difficulties involved in performing such an analysis are not to be overlooked. Due to the lack of uniformity in the data produced by this method, further research should consider this. According to a slew of study design concerns, future research should avoid relying too heavily on individuals with chronic conditions like epilepsy or those taking medication.
Our results show that EEG signal analysis does not have the sensitivity or specificity needed to make a clinical diagnosis of ASD in children today. Research limitations also need to be considered. Studies with young ASD children exhibit widely divergent experimental conditions, such as the absence of an accurate description of the children’s behavioral state, making it difficult to conclude whether participants’ traits or their states influence EEG differences.28 Participants also have wide age ranges, which can be an issue in ASD where the absolute values of specific functional areas differ from normal and the pattern of age-related changes. Averaging values over a broad age range can result in inaccurate patterns of deviations (ibid). Studies also address ASD etiologies, which may lead to different EEG deviances even in similar behavioural phenotypes.9,37–39
EEG can be used with infants as a tool for exploratory research. Various methods could be used for evaluating brainwave overload when diagnosing ASD. These include Quantitative electroencephalography (qEEG), LORETA, and Multiscale Entropy (MSE).13,40,41 MSE and qEEG are the most complex methods of analyzing the data from EEG tests. They can also be used to evaluate the level of internal entropy related to specific frequency levels, including alpha, beta, and delta functions and their deviation from the norm. In the long run, developing a diagnostic mechanism that targets the particular brainwaves in diagnosing ASD will improve how the treatment of the same is implemented in children and adults.42–44
Children with ASD present higher levels of delta waves. Delta brainwaves appear to be dominant at all times in individuals diagnosed with ASD.28,43,44 Delta waves have been connected to deep states of unconsciousness because they are among the primary ways of measuring brain plasticity in general.45 The waves are also used for researching more specific issues such as seizures46 and potential links between them and ASD.47–49 By detecting delta waves, it is possible to measure and compare them based on age, sleep states such as REM or sleepwalking. More recent research also showed how delta brainwaves could be controlled with sound.50–54 Sonified signals contributed significantly to reducing delta brainwaves. Future research should focus on particular stimuli when diagnosing and treating ASD, considering how the limitations of the method and experimental approach can be controlled. It should be possible to alleviate ASD symptoms and design interventions focused on correcting the accurately observed deviations. Alternatively, this will improve how ASD medications are manufactured because they do not play any principal role in improving the cognitive well-being of the individual.
Conclusion
Research on algorithms for diagnosing ASD based on EEG analysis could be divided into two categories: comparison-based analysis and pattern-based analysis. Utilizing statistical techniques, comparison-based analysis can ascertain the EEG properties that differentiate ASD individuals from non-ASD. The outcomes of these analysis studies suggest that they have high utility in characterizing the condition and may be a crucial addition to other currently available technologies. In the future, using EEG to measure brain development may indicate that a child needs additional evaluation. Many electrophysiological characteristics of utmost importance and significant research gaps are suggested in the current literature, which supports additional study and investigation. Age should be considered when designing an experiment for a child with ASD because it is a neurodevelopmental disorder. Aside from that, long-term studies could bolster key results and delineate the developmental stages of ASD. Sophisticated analysis techniques should be regarded and coupled with already established ones to achieve the overall goal of early diagnosis of evolving ASD, which might support the prevention and early intervention.
Acknowledgments
This study has been funded by the Federal University of Pará (UFPA/PROPESP-PAPQ). MSF is a research fellow of the National Council for Research and Development (CNPQ). The funding providers had no role in the study design, data collection, and analysis, decision to publish, or preparation of the paper. Funding provider’s websites: http://www.ufpa.br/, http://www.cnpq.br/.
Disclosure
The authors report no conflicts of interest in this work.
References
1. Garcés P, Baumeister S, Mason L, et al. Resting state EEG power spectrum and functional connectivity in autism: a cross-sectional analysis. Mol Autism. 2022;13(1). doi:10.1186/s13229-022-00500-x
2. Shephard E, Tye C, Ashwood KL, et al. Resting-State Neurophysiological Activity Patterns in Young People with ASD, ADHD, and ASD + ADHD. J Autism Dev Disord. 2017;48(1):110–122. doi:10.1007/s10803-017-3300-4
3. Tran XA, McDonald N, Dickinson A, et al. Functional connectivity during language processing in 3‐month‐old infants at familial risk for autism spectrum disorder. Eur J Neurosci. 2020;53(5):1621–1637. doi:10.1111/ejn.15005
4. Mash LE, Reiter MA, Linke AC, Townsend J, Müller R. Multimodal approaches to functional connectivity in autism spectrum disorders: an integrative perspective. Dev Neurobiol. 2017;78(5):456–473. doi:10.1002/dneu.22570
5. DiStefano C, Dickinson A, Baker E, Spurling Jeste S. EEG data collection in children with ASD: the role of state in data quality and spectral power. Res Autism Spectr Disord. 2019;57:132–144. doi:10.1016/j.rasd.2018.10.001
6. Godfrey M, Hepburn S, Fidler DJ, et al. Autism spectrum disorder (ASD) symptom profiles of children with comorbid Down syndrome (DS) and ASD: a comparison with children with DS-only and ASD-only. Res Dev Disabil. 2019;89:83–93. doi:10.1016/j.ridd.2019.03.003
7. Brikell I, Ghirardi L, Chang Z, D’Onofrio BM, Kuja-Halkola R, Larsson H. ADHD medications and the risk of epileptic seizures: a pharmacoepidemiological study using nationwide register data. Eur Neuropsychopharmacol. 2017;27:S1113–S1114. doi:10.1016/s0924-977x(17
8. Cañigueral R, Palmer J, Ashwood KL, et al. Alpha oscillatory activity during attentional control in children with Autism Spectrum Disorder (ASD), Attention‐Deficit/Hyperactivity Disorder (ADHD), and ASD+ADHD. J Child Psychol Psychiatry. 2021;63(7):745–761. doi:10.1111/jcpp.13514
9. Gurau O, Bosl WJ, Newton CR. How Useful Is Electroencephalography in the Diagnosis of Autism Spectrum Disorders and the Delineation of Subtypes: a Systematic Review. Front Psychiatry. 2017;8. doi:10.3389/fpsyt.2017.00121
10. Billeci L, Sicca F, Maharatna K, et al. On the Application of Quantitative EEG for Characterizing Autistic Brain: a Systematic Review. Front Hum Neurosci. 2013;7. doi:10.3389/fnhum.2013.00442
11. Hashemian M, Pourghassem H. Diagnosing Autism Spectrum Disorders Based on EEG Analysis: a Survey. Neurophysiology. 2014;46(2):183–195. doi:10.1007/s11062-014-9427-4
12. Murias M, Webb SJ, Greenson J, Dawson G. Resting State Cortical Connectivity Reflected in EEG Coherence in Individuals with Autism. Biol Psychiatry. 2007;62(3):270–273. doi:10.1016/j.biopsych.2006.11.012
13. Catarino A, Andrade A, Churches O, Wagner AP, Baron-Cohen S, Ring H. Task-related functional connectivity in autism spectrum conditions: an EEG study using wavelet transform coherence. Mol Autism. 2013;4(1):1. doi:10.1186/2040-2392-4-1
14. Carson AM, Salowitz NMG, Scheidt RA, Dolan BK, Van Hecke AV. Electroencephalogram Coherence in Children with and Without Autism Spectrum Disorders: decreased Interhemispheric Connectivity in Autism. Autism Res. 2014;7(3):334–343. doi:10.1002/aur.1367
15. Boersma M, Kemner C, de Reus MA, et al. Disrupted Functional Brain Networks in Autistic Toddlers. Brain Connect. 2013;3(1):41–49. doi:10.1089/brain.2012.0127
16. Orekhova EV, Elsabbagh M, Jones EJ, Dawson G, Charman T, Johnson MH. EEG hyper-connectivity in high-risk infants is associated with later autism. J Neurodev Disord. 2014;6(1). doi:10.1186/1866-1955-6-40
17. Righi G, Tierney AL, Tager-Flusberg H, Nelson CA. Functional Connectivity in the First Year of Life in Infants at Risk for Autism Spectrum Disorder: an EEG Study. PLoS One. 2014;9(8):e105176. doi:10.1371/journal.pone.0105176
18. Cantor DS, Thatcher RW, Hrybyk M, Kaye H. Computerized EEG analyses of autistic children. J Autism Dev Disord. 1986;16(2):169–187. doi:10.1007/bf01531728
19. Buckley AW, Scott R, Tyler A, et al. State-Dependent Differences in Functional Connectivity in Young Children with Autism Spectrum Disorder. E Bio Med. 2015;2(12):1905–1915. doi:10.1016/j.ebiom.2015.11.004
20. Herbert MR, Ziegler DA, Makris N, et al. Localization of white matter volume increase in autism and developmental language disorder. Ann Neurol. 2004;55(4):530–540. doi:10.1002/ana.20032
21. Matlis S, Boric K, Chu CJ, Kramer MA. Robust disruptions in electroencephalogram cortical oscillations and large-scale functional networks in autism. BioMed Central Neurol. 2015;15(1):548. doi:10.1186/s12883-015-0355-8
22. Léveillé C, Barbeau EB, Bolduc C, et al. Enhanced connectivity between visual cortex and other regions of the brain in autism: a REM sleep EEG coherence study. Autism Res. 2010;3(5):280–285. doi:10.1002/aur.155
23. Mathewson KJ, Jetha MK, Drmic IE, Bryson SE, Goldberg JO, Schmidt LA. Regional EEG alpha power, coherence, and behavioral symptomatology in autism spectrum disorder. Clin Neurophysiol. 2012;123(9):1798–1809. doi:10.1016/j.clinph.2012.02.061
24. Machado C, Estévez M, Leisman G, et al. QEEG Spectral and Coherence Assessment of Autistic Children in Three Different Experimental Conditions. J Autism Dev Disord. 2013;45(2):406–424. doi:10.1007/s10803-013-1909-5
25. Yang HH, Savostyanov AN, Tsai AC, Liou M. Face recognition in Asperger syndrome: a study on EEG spectral power changes. Neurosci Lett. 2011;492(2):84–88. doi:10.1016/j.neulet.2011.01.061
26. Sheikhani A, Behnam H, Noroozian M, Mohammadi MR, Mohammadi M. Abnormalities of quantitative electroencephalography in children with Asperger disorder in various conditions. Res Autism Spectr Disord. 2009;3(2):538–546. doi:10.1016/j.rasd.2008.11.002
27. van Diessen E, Senders J, Jansen FE, Boersma M, Bruining H. Increased power of resting-state gamma oscillations in autism spectrum disorder detected by routine electroencephalography. Eur Arch Psychiatry Clin Neurosci. 2014;265(6):537–540. doi:10.1007/s00406-014-0527-3
28. Stroganova TA, Nygren G, Tsetlin MM, et al. Abnormal EEG lateralization in boys with autism. Clin Neurophysiol. 2007;118(8):1842–1854. doi:10.1016/j.clinph.2007.05.005
29. Lushchekina EA, Podreznaya ED, Lushchekin VS, Novototskii-Vlasov V, Strelets VB. Comparative Studies of EEG Theta and Gamma Rhythms in Normal Children and Children with Early Childhood Autism. Neurosci Behav Physiol. 2014;44(8):902–908. doi:10.1007/s11055-014-9999-x
30. Elhabashy H, Raafat O, Afifi L, Raafat H, Abdullah K. Quantitative EEG in autistic children. Egypt J Neurol Psychiatry Neurosurgery. 2015;52(3):176. doi:10.4103/1110-1083.162031
31. Eldridge J, Lane AE, Belkin M, Dennis S. Robust features for the automatic identification of autism spectrum disorder in children. J Neurodev Disord. 2014;6(1). doi:10.1186/1866-1955-6-12
32. Wang J, Barstein J, Ethridge LE, Mosconi MW, Takarae Y, Sweeney JA. Resting state EEG abnormalities in autism spectrum disorders. J Neurodev Disord. 2013;5(1):326. doi:10.1186/1866-1955-5-24
33. Jones S. Autism Spectrum Disorders Through the Life SpanAutism Spectrum Disorders Through the Life Span. Nursing Standard. 2013;27(24):28. doi:10.7748/ns2013.02.27.24.28.b1468
34. Sheikhani A, Behnam H, Mohammadi MR, Noroozian M, Mohammadi M. Detection of Abnormalities for Diagnosing of Children with Autism Disorders Using of Quantitative Electroencephalography Analysis. J Med Syst. 2010;36(2):957–963. doi:10.1007/s10916-010-9560-6
35. den Bakker H, Sidorov MS, Fan Z, et al. Abnormal coherence and sleep composition in children with Angelman syndrome: a retrospective EEG study. Mol Autism. 2018;9(1). doi:10.1186/s13229-018-0214-8
36. Khan S, Gramfort A, Shetty NR, et al. Local and long-range functional connectivity is reduced in concert in autism spectrum disorders. Proce National Acad Sci. 2013;110(8):3107–3112. doi:10.1073/pnas.1214533110
37. Sato JR, Vidal M, de Siqueira Santos S, Massirer KB, Fujita A. Complex network measures in autism spectrum disorders. IEEE/ACM Trans Comput Biol Bioinform. 2015;15(2):581–587. doi:10.1109/TCBB.2015.2476787
38. Takahashi T. Complexity of spontaneous brain activity in mental disorders. Prog Neuropsychopharmacol Biol Psychiatry. 2013;45:258–266. doi:10.1016/j.pnpbp.2012.05.001
39. Isler JR, Martien KM, Grieve PG, Stark RI, Herbert MR. Reduced functional connectivity in visual evoked potentials in children with autism spectrum disorder. Clin Neurophysiol. 2010;121(12):2035–2043. doi:10.1016/j.clinph.2010.05.004
40. Okazaki R, Takahashi T, Ueno K, et al. Changes in EEG Complexity with Electroconvulsive Therapy in a Patient with Autism Spectrum Disorders: a Multiscale Entropy Approach. Front Hum Neurosci. 2015;9. doi:10.3389/fnhum.2015.00106
41. Han J, Zeng K, Kang J, et al. Development of Brain Network in Children with Autism from Early Childhood to Late Childhood. Neuroscience. 2017;367:134–146. doi:10.1016/j.neuroscience.2017.10.015
42. O’Neill M, Shear T. EEG for Diagnosis of Autism Spectrum Disorder. Pediatric Neurology Briefs. 2018;32:13. doi:10.15844/pedneurbriefs-32-13
43. Thompson L, Thompson M, Reid A. Functional Neuroanatomy and the Rationale for Using EEG Biofeedback for Clients with Asperger’s Syndrome. Appl Psychophysiol Biofeedback. 2009;35(1):39–61. doi:10.1007/s10484-009-9095-0
44. Finnigan S, Wong A, Read S. Defining abnormal slow EEG activity in acute ischaemic stroke: delta/alpha ratio as an optimal QEEG index. Clin Neurophysiol. 2016;127(2):1452–1459. doi:10.1016/j.clinph.2015.07.014
45. Itoh T, Sumiyoshi T, Higuchi Y, Suzuki M, Kawasaki Y. LORETA analysis of three-dimensional distribution of delta band activity in schizophrenia: relation to negative symptoms. Neurosci Res. 2011;70(4):442–448. doi:10.1016/j.neures.2011.05.003
46. Riggins T, Scott LS. P300 development from infancy to adolescence. Psychophysiology. 2019;57(7):e13346. doi:10.1111/psyp.13346
47. Cornew L, Roberts TPL, Blaskey L, Edgar JC. Resting-State Oscillatory Activity in Autism Spectrum Disorders. J Autism Dev Disord. 2011;42(9):1884–1894. doi:10.1007/s10803-011-1431-6
48. Attard Trevisan A, Portable Sonified A. Neurofeedback Therapy for Autism Spectrum Disorder Patients-An Initial Evaluation. J Neurol Disorders. 2013;1(4). doi:10.4172/2329-6895.1000133
49. Pase MP, Seshadri S. Author response: prolonged sleep duration as a marker of early neurodegeneration predicting incident dementia. Neurology. 2017;89(14):1532.3–1533. doi:10.1212/wnl.0000000000004550
50. Park Y, Luo L, Parhi KK, Netoff T. Seizure prediction with spectral power of EEG using cost-sensitive support vector machines. Epilepsia. 2011;52(10):1761–1770. doi:10.1111/j.1528-1167.2011.03138.x
51. Assenza G, Di Lazzaro V. A useful electroencephalography (EEG) marker of brain plasticity: delta waves. Neural Regeneration Res. 2015;10(8):1216–1217. doi:10.4103/1673-5374.162698
52. Sih GC, Tang KK. On–off switching of theta–delta brain waves related to falling asleep and awakening. Theoretical Appl Fracture Mechanics. 2013;63-64:1–17. doi:10.1016/j.tafmec.2013.03.001
53. Pilon M, Zadra A, Joncas S, Montplaisir J. Hypersynchronous Delta Waves and Somnambulism: brain Topography and Effect of Sleep Deprivation. Sleep. 2006;29(1):77–84. doi:10.1093/sleep/29.1.77
54. Jirakittayakorn N, Wongsawat Y, Novel A. Insight of Effects of a 3-Hz Binaural Beat on Sleep Stages During Sleep. Front Hum Neurosci. 2018;12. doi:10.3389/fnhum.2018.00387
 © 2023 The Author(s). This work is published and licensed by Dove Medical Press Limited. The
full terms of this license are available at https://www.dovepress.com/terms
and incorporate the Creative Commons Attribution
- Non Commercial (unported, 3.0) License.
By accessing the work you hereby accept the Terms. Non-commercial uses of the work are permitted
without any further permission from Dove Medical Press Limited, provided the work is properly
attributed. For permission for commercial use of this work, please see paragraphs 4.2 and 5 of our Terms.
© 2023 The Author(s). This work is published and licensed by Dove Medical Press Limited. The
full terms of this license are available at https://www.dovepress.com/terms
and incorporate the Creative Commons Attribution
- Non Commercial (unported, 3.0) License.
By accessing the work you hereby accept the Terms. Non-commercial uses of the work are permitted
without any further permission from Dove Medical Press Limited, provided the work is properly
attributed. For permission for commercial use of this work, please see paragraphs 4.2 and 5 of our Terms.