Back to Journals » Cancer Management and Research » Volume 13
Supervised Learning Based Systemic Inflammatory Markers Enable Accurate Additional Surgery for pT1NxM0 Colorectal Cancer: A Comparative Analysis of Two Practical Prediction Models for Lymph Node Metastasis
Authors Jin J ![]() , Zhou H, Sun S, Tian Z, Ren H, Feng J
, Zhou H, Sun S, Tian Z, Ren H, Feng J
Received 8 September 2021
Accepted for publication 22 November 2021
Published 1 December 2021 Volume 2021:13 Pages 8967—8977
DOI https://doi.org/10.2147/CMAR.S337516
Checked for plagiarism Yes
Review by Single anonymous peer review
Peer reviewer comments 3
Editor who approved publication: Dr Chien-Feng Li
Jinlian Jin, Haiyan Zhou, Shulin Sun, Zhe Tian, Haibing Ren, Jinwu Feng
Department of Gastroenterology, The Third Clinical Medical College of China Three Gorges University, Gezhouba Central Hospital of Sinopharm, Yichang, Hubei, 443002, People’s Republic of China
Correspondence: Jinlian Jin
Department of Gastroenterology, The Third Clinical Medical College of China Three Gorges University, Gezhouba Central Hospital of Sinopharm, No. 60, Qiaohu 1st Road, Xiling District, Yichang, Hubei, 443002, People’s Republic of China
Tel +8613986746553
Email [email protected]
Purpose: Predicting lymph node metastasis (LNM) after endoscopic resection is crucial in determining whether patients with pT1NxM0 colorectal cancer (CRC) should undergo additional surgery. This study was aimed to develop a predictive model that can be used to reduce the current likelihood of overtreatment.
Patients and Methods: We recruited a total of 1194 consecutive CRC patients with pT1NxM0 who underwent endoscopic or surgical resection at the Gezhouba Central Hospital of Sinopharm between January 1, 2006, and August 31, 2021. The random forest classifier (RFC) and generalized linear algorithm (GLM) were used to screen out the variables that greatly affected the LNM prediction, respectively. The area under the curve (AUC) and decision curve analysis (DCA) were applied to assess the accuracy of predictive models.
Results: Analysis identified the top 10 candidate factors including depth of submucosal invasion, neutrophil-lymphocyte ratio (NLR), platelet lymphocyte ratio (PLR), platelet-to-neutrophil ratio(PNR), venous invasion, poorly differentiated clusters, tumor budding, grade, lymphatic vascular invasion, and background adenoma. The performance of the GLM achieved the highest AUC of 0.79 (95% confidence interval [CI]: 0.30 to 1.28) in the training cohort and robust AUC of 0.80 (95% confidence interval [CI]: 0.36 to 1.24) in the validation cohort. Meanwhile, the RFC exhibited a robust AUC of 0.84 (95% confidence interval [CI]: 0.40 to 1.28) in the training cohort and a high AUC of 0.85 (95% CI: 0.41 to 1.29) in the validation cohort. DCAs also showed that the RFC had superior predictive ability.
Conclusion: Our supervised learning-based model incorporating histopathologic parameters and inflammatory markers showed a more accurate predictive performance compared to the GLM. This newly supervised learning-based predictive model can be used to determine an individually tailored treatment strategy.
Keywords: colorectal cancer, pT1NxM0, lymph nodes metastasis, prediction model, machine learning, random forest classifier, generalized linear model
Introduction
CRC is the third most common malignant tumor, leading to extremely high rates of mortality.1,2 Metastasis is the main cause of cancer-related death.3 According to the current literature reports, even CRC patients diagnosed with pT1NxM0 have an estimated risk of LNM, which has been estimated to occur in 10%~15%.4,5 Colonoscopy remains the gold standard for detecting and resecting precancerous colorectal lesions, but it is unable to provide the status of the regional lymph nodes.
Nowadays, endoscopic resection is accepted as a curative therapy for colorectal cancer because of its minimal invasiveness to the diagnosis and treatment of CRC.6,7 Additional surgical resection after endoscopic resection in patients with CRC can achieve complete staging and reduce the recurrence rate.8 However, endoscopic resection of pT1NxM0 CRC should be used selectively because of the high risk of LNM.9 Therefore, the remaining two-thirds of patients may increase the risk of surgical resection and related postoperative mortality.10 In addition, unnecessary surgical resection will not bring clinical benefits. Due to the lack of preoperative prediction of LNM, it is difficult to determine additional surgery after endoscopic resection of pT1NxM0 CRC. Given this situation, there is now a pressing need to develop methods to determine whether pT1NxM0 CRC patients should undergo additional surgery.
Supervised learning(SL) is a branch of artificial intelligence, which encapsulates statistical and iterative algorithms to make fact query and complex decision-making possible.11,12 In addition, SL analysis is more effective than the traditional logistic linear regression (LLR) statistical method and can optimize variable screening.13 Therefore, combinatory uses of SL practical analysis and medical records for LNM prediction in the early monitoring of patients with pT1NxM0 CRC are worth exploring.
In this study, we aimed to develop an LNM risk prediction model for pT1NxM0 CRC that utilizes clinical medical data to stratify patients by LNM risk after endoscopic resection. The capability of enabling expeditious and accurate LNM risk stratification of pT1NxM0 CRC may facilitate more timely interventions that are conducive to high-risk LNM management via early identification, and ensuring instant intervention as well as additional surgery, thus, hopefully assisting to strengthen the oncological monitoring during the early-stage.
Patients and Methods
Patients
Between January 1, 2006, and August 31, 2021, we prospectively collated data from consecutive patients who had been diagnosed with CRC at the Gezhouba Central Hospital of Sinopharm. This study was approved by the Institutional Ethics Committee of Gezhouba Central Hospital of Sinopharm (Reference No. 2020–006) and complies with the Declaration of Helsinki. Before any treatment, the written informed consent of all participants was obtained. All patient information is anonymous. The selection criteria are as follows: (1) Pathologically diagnosed as pT1NxM0 stage; (2) Lymph node status can be fully assessed (imaging and/or pathological specimen); (3) Patient medical records are complete and can be traced and consulted. The exclusion criteria are as follows: (1) patients with familial adenomatous polyposis, inflammatory bowel disease, and concurrent advanced colorectal cancer; (2) patients receiving radiotherapy and chemotherapy before surgery; (3) patients with multiple primary colorectal cancers lesions. In the beginning, 1194 patients who underwent endoscopic or surgical resection were included. Postoperative histopathological examination confirmed that they were all pT1NxM0 stage CRC. We divided the patients into two groups based on the data. Among them, the data of 835 patients were used for the machine learning of the artificial intelligence model, and the remaining 359 patients were used for model verification. In addition, 717 patients from another tertiary medical center served as a cohort for external validation of the model. The research flowchart is shown in Figure 1.
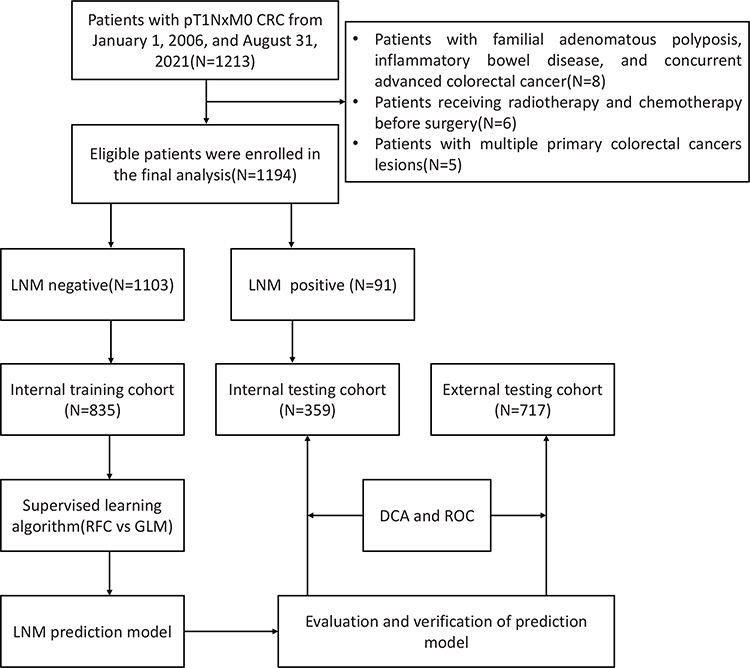 |
Figure 1 Flow chart of this study. |
Evaluate Evidence of LNM Presence
The status of LNM after endoscopic resection was determined according to the patient follow-up and the pathological results of additional surgery. It is worth considering that because it is impossible to prove that some patients have already had LNM during the initial endoscopic surgery, or that LNM appeared in a local area after endoscopic surgery, in patients with potential risk, if they were diagnosed as LNM during rescue surgery negative patients were considered negative for LNM, while patients diagnosed as positive for LNM during additional surgery were excluded. In addition, for recurrent patients with multiple metastases without salvage surgery, lymph nodes that may have jumping metastases (the presence of discontinuous LNM) were also excluded.
Data Preparation
The clinical-pathological data of the patient, including the operation method, postoperative pathological examination, tumor length, tumor pathological type, tumor differentiation, depth of submucosal invasion, nerve vascular invasion, and the number of intraoperative lymph nodes dissections. Factors related to lymph node metastasis, including age, gender, preoperative CEA, preoperative CA19-9, treatment method, tumor location, tumor length, tumor pathological type, tumor differentiation, depth of submucosal invasion, vascular invasion, and The number of lymph node dissections. Blood samples (3–5 mL of whole blood) were collected from each patient on an empty stomach on the morning of the day before endoscopy. We also collected preoperative routine laboratory measurement results, including neutrophil count, lymphocyte count, platelet count, and monocyte count. Meanwhile, among the 24 original variables, we eliminated the repeated variables through correlation matrix analysis and solved the bias caused by multicollinearity. This study is in line with the research statement of TRIPOD to develop a prediction model for LNM in patients with pT1NxM0 CRC.14
Statistical Analysis and Evaluation of Models
Categorical variables are expressed in numbers (%) or interquartile ranges. Continuity variables are expressed as median and interquartile ranges. Bonferroni corrected probability values are used to compare qualitative data.15 Wilcoxon rank-sum test or chi-square test was used to compare the differences between different groups. RFC is a collection of various decision tree models.16 In the process of selecting variables, each node is divided by using the best subset of randomly selected explanatory variables or features, and the class prediction values generated by each tree are collected. Finally, the candidate variables of the prediction model, namely the Gini index, are determined according to the weight. The GLM estimation algorithm based on β coefficients has coarsening covariates and multiple collinearity problems. Therefore, this study adopts the Akaike information criterion(AIC), stepwise regression, and screening variables to obtain the optimal subset.17 Compared with the GLM, the performance of the RFC model is through receiver operating characteristic curve(ROC), network reclassification improvement(NRI), and decision curve analysis(DCA). NRI specifies the net proportion of patients who are redefined as high-risk and low-risk events of interest and non-interest events, respectively. All data analysis is performed using the Python programming language (version 3.9.2, Python Software Foundation, https://www.python.org/) and R Statistical Computing Project (version 4.0.5, http://www.r-project.org/). A P value less than 0.05 is considered statistically significant.
Results
Patient Epidemiology and Characteristics
According to the established inclusion and exclusion criteria, 1194 pT1NxM0 CRC patients who received surgery or salvage surgery after endoscopic resection treatment from January 1, 2006, and August 31, 2021, in our center were included and randomly divided into a training set (n=835) and internal validation set (n =359). The demographic and clinical characteristics of the total population, training and validation cohorts were shown in Table 1. The details of the external verification queue were summarized in Supplementary Table 1. In pT1NxM0 CRC patients, the final pathological examination in the entire cohort was 7.62%, while in the training and validation cohorts, the incidence of LNM was 7.54% and 7.80%, respectively. The incidence of LNM in the external cohort was 7.67%, which was consistent with the results of the internal cohort. We speculated that the potential variables that may be related to LNM were included in the heatmap matrix for analysis. As shown in Supplementary Figure 1, a total of 24 variables constituted the correlation state with LNM, while the depth of submucosal invasion, NLR, PLR, PNR, venous invasion, poorly differentiated clusters, tumor budding, grade, lymphatic vascular invasion, and background adenoma showed a positive correlation with LNM, suggesting that the above indicators may be used as potential effective variables of LNM prediction model.
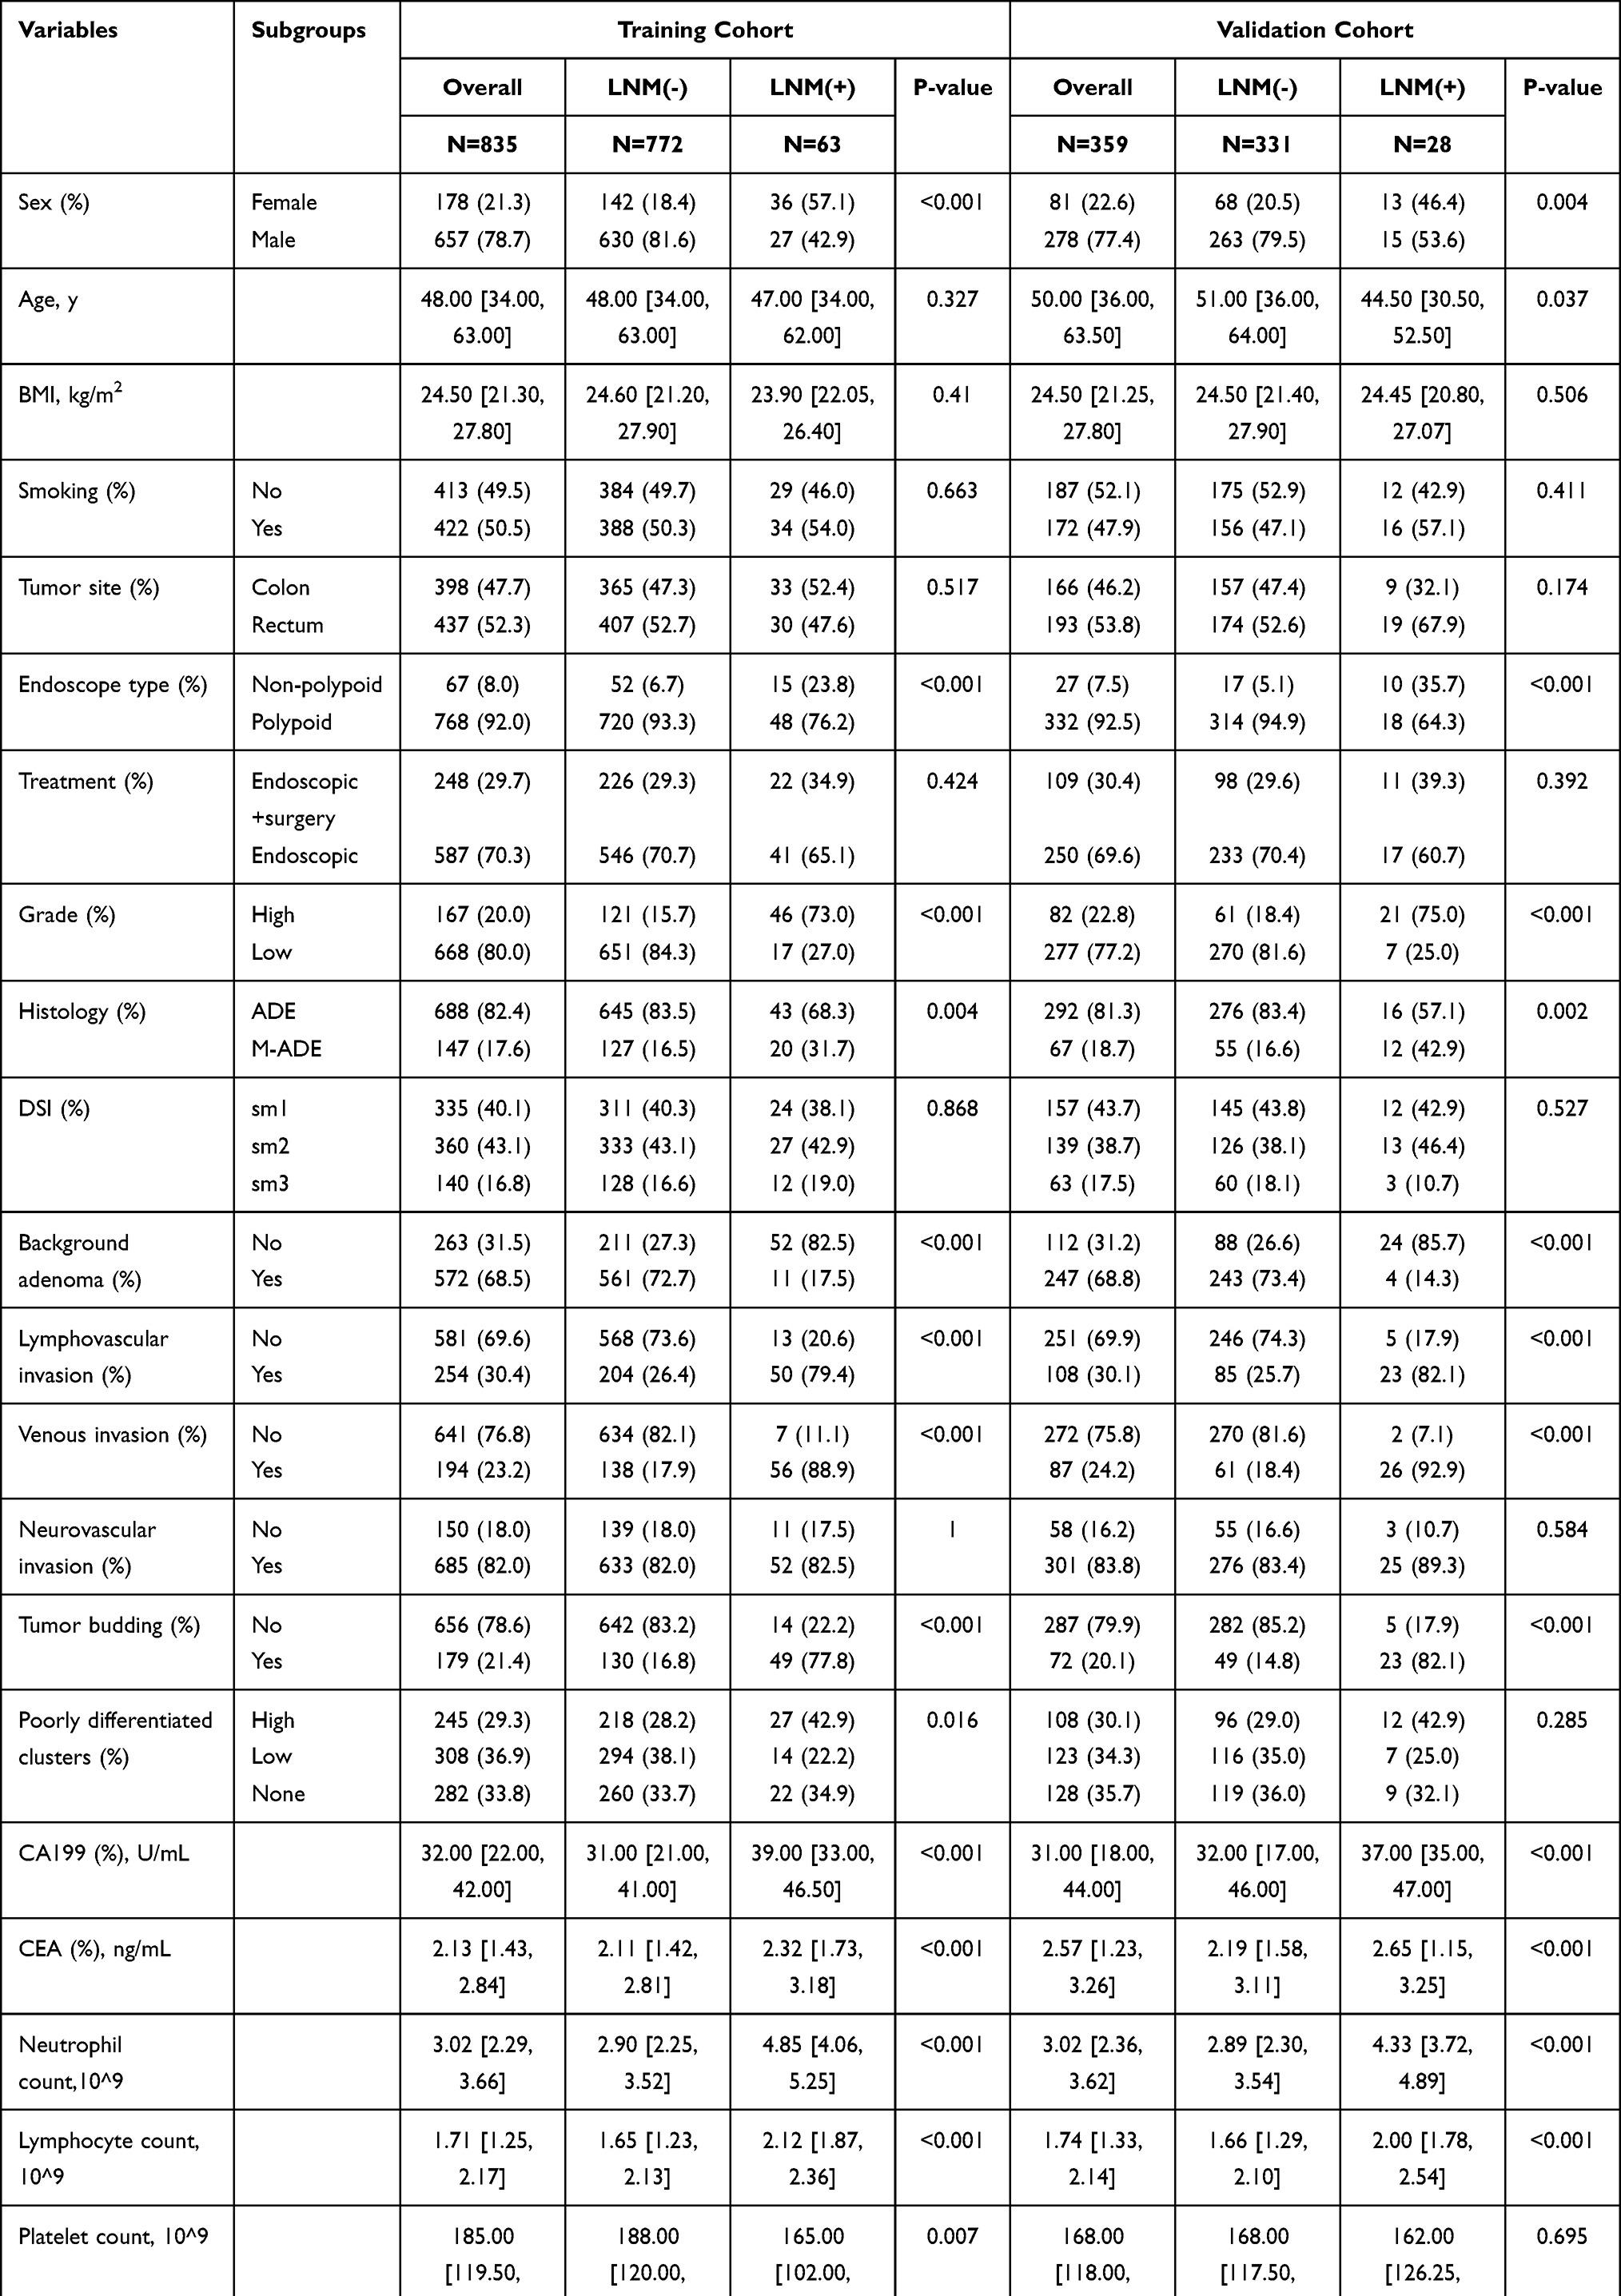 |
Table 1 Baseline Demographic and Clinical Characteristics of the Study Cohort |
Variables Selection and Construction of RFC Model
A total of 835 patients in the training set were used to fit the random forest algorithm. The samples were randomly allocated to non-overlapping training samples, and the RFC prediction model was established after ten-fold cross-validation. Finally, as shown in Figure 2A, there were a total of 19 variables sorted by weight and included in this RFC model. The detailed Gini index for each variable is shown in Supplementary Table 2. As shown in the gravel diagram in Figure 2B, the robustness of the RFC model constructed with the above variables was relatively satisfactory. In addition, the risk stratification of patients by RFC was also very obvious (Figure 2C). Taken together, our study demonstrated that the RFC model absorbed the advantages of robustness and accuracy in predicting LNM.
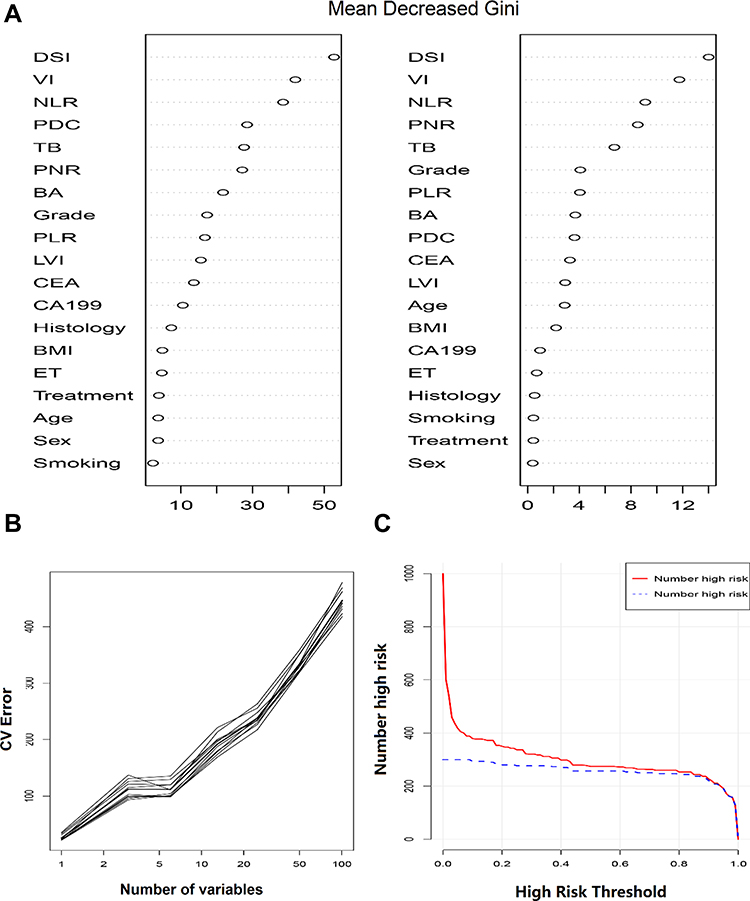 |
Figure 2 Development and verification of the RFC model. (A) The influencing factors of LNM were ordered according to the mean decreased Gini index. (B) Ten-fold cross-validation of the performance of the prediction model. (C) Clinical impact curve for the evaluation of RFC model. Abbreviations: BA, background adenoma; PNR, platelet-to-neutrophil ratio; PLR, platelet-to-lymphocyte ratio; DSI, depth of submucosal invasion; BMI, body mass index; NLR, neutrophil-to-lymphocyte ratio; CA199, carbohydrate antigen199; PDC, poorly differentiated clusters; ET, endoscope type; CEA, carcinoembryonic antigen; VI, venous invasion; LVI, lymphatic vascular invasion; TB, tumor budding. |
Construction of GLM and Variable Iteration
The model depends on the parameters estimated using observations, and the best model must be determined based on the available observations.17 Therefore, we chose the AIC variable screening mode, and finally obtained the following meaningful variables to participate in the construction of GLM, which were poorly differentiated clusters, NLR, background adenoma, PLR, tumor budding, venous invasion, and depth of submucosal invasion. The C-index and Brier score of each model predicted based on AIC were summarized in Supplementary Table 3. As shown in Figure 3A, according to the filtering effect of AIC, the stability and potential practicability of model1 have been confirmed for GLM construction. The results of the constructed nomogram demonstrated that its predictive performance and actual observation performance were relatively satisfactory but slightly inferior to the RFC model (Figure 3B and C).
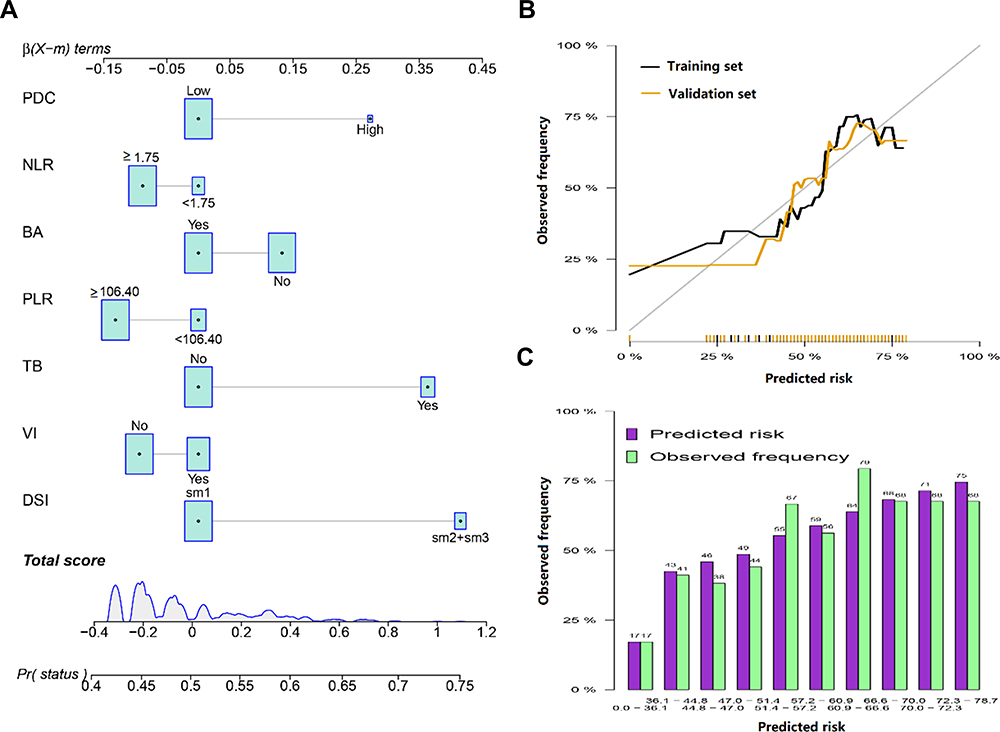 |
Figure 3 Nomogram to estimate the risk of LNM. (A) Nomogram used to predict LNM risk, showing the proportion of parameters included in the scoring table (%). (B) Calibration curves for internal validation of the nomogram. (C) Predicted risk histogram comparing predicted risk of the nomogram with the observed frequency. Abbreviations: BA, background adenoma; PLR, platelet-to-lymphocyte ratio; DSI, depth of submucosal invasion; NLR, neutrophil-to-lymphocyte ratio; PDC, poorly differentiated clusters; VI, venous invasion; TB, tumor budding. |
Comparison of the Effectiveness of Two Predictive Models
The AUC of the two prediction models was shown in Figure 4. Compared with GLM, the RFC yielded the highest AUCs in the training set and the validation set, which were 0.84 and 0.85 respectively. In addition, the performance of the RFC in the external cohort was also consistent with the internal data set. In DCA analysis, which depicted the prediction of LNM, the use of RFC also resulted in the highest net benefit, as compared with GLM (Figure 5). Collectively, the performance of RFC showed a more accurate predictive performance compared to the GLM model in predicting LNM in patients with pT1NxM0 CRC.
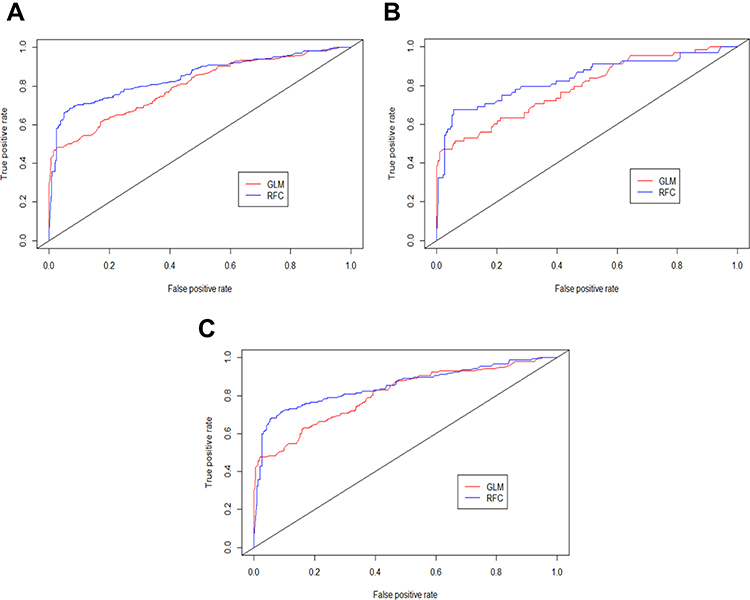 |
Figure 4 The ROC curve analyses for models in the study cohort. (A) Internal training set. (B) Internal testing set. (C) External validation set. |
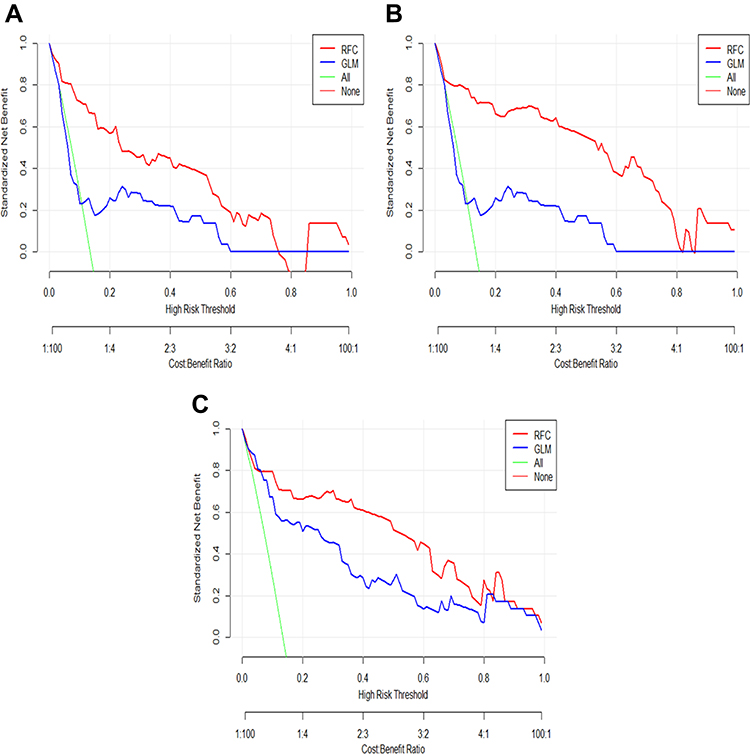 |
Figure 5 Decision curve analysis compares the net benefits associated with predicting LNM using RFC and GLM models. (A) Internal training set. (B) Internal testing set. (C) External validation set. |
Discussion
With the extensive development of population-based CRC screening programs and the latest progress of endoscopic diagnosis, the number of endoscopic resections in patients with pT1NxM0 CRC is increasing.10 Previous studies have shown that endoscopic resection before surgical resection of pT1NxM0 CRC has no adverse effect on the prognosis.10,18,19 In short, provided that endoscopy will not lead to tumor diffusion or tumor resection can be carried out directly with the help of endoscopy, the patient can avoid extra surgery and gain many benefits, such as reducing incidence rate, shortening recovery period, and improving the quality of life.20 However, it is difficult to determine the appropriate indication for deciding whether to perform additional surgery or not, because clinicians should not only consider the probability of LNM but also consider surgical complications, postoperative quality of life, and patient’s personal choices.
According to existing guidelines, the tumor indications for endoscopic resection of pT1NxM0 CRC mainly depend on the probability of occurrence of LNM.21,22 Although a more accurate LNM prediction system is needed to guide subsequent treatment, the risk stratification of LNM remains controversial. Previous studies have been conducted on the histopathological predictors of LNM in pT1NxM0 CRC, and various risk factors have been identified.10,20,23,24 Jung R.O et al reported that vascular invasion, high-grade histology, submucosal invasion, budding, and background adenoma were independent risk factors for LNM.20 Cracco N et al reported that the width and the area of submucosal invasion were both reliable prognostic factors for LNM in pT1NxM0 CRC.24 Mou S et al examined the strength of evidence that well-differentiated nonpedunculated pT1NxM0 CRC invasive into the submucosa ≤1000 μm, without lymphovascular involvement or tumor budding, has the lowest risk of nodal metastasis.25 Previous studies have shown that inflammation plays an important role in the occurrence and development of colorectal cancer.26 Especially for NLR, may be more reliable than neutrophil count, lymphocyte count, or platelet count alone, because the individual count is vulnerable to many factors.27 In addition, new evidence provides a link between inflammation and cancer development.28 It is not surprising that cancer inherent or cancer-induced inflammation can be triggered by cancer initiation mutations and can promote malignant progression through the recruitment and activation of inflammatory cells.29,30 Both exogenous and endogenous inflammation can lead to immunosuppression, which provides an ideal background for the occurrence of tumors.31 Consistent with previous research reports, our study also identified several candidate factors, including depth of submucosal invasion, NLR, PLR, PNR, venous invasion, poorly differentiated clusters, tumor budding, grade, lymphatic vascular invasion, and background adenoma that were associated with LNM, combining these candidate variables, the purpose of this study is to develop and validate a better model for predicting LNM in pT1NxM0 CRC.
In this study, we successfully determined the rank order of risk factors for LNM prediction. Nowadays, machine learning classification is the most important computer development in recent years to meet the main needs of clinicians for automatic early diagnosis. As an important branch of supervised learning, the RFC model has been successfully applied to high-dimensional multi-source data reduction in many scientific fields.32 Mature supervised learning classifiers, including support vector machines, random forests, convolutional neural networks, and decision trees, have been gradually applied in clinical practice. Consistent with the results of previous research reports, for feature selection and classification, we found that the RFC model has more advantages than the traditional linear regression model.
The RFC is a classification tree analysis that can model potentially complex relationships, including nonlinearities and interactions in the data, but rarely provides information about the prediction process.33 The RFC allows the calculation of the risk level based on all the variables collected from the medical records. Herein, we adopted the “bagging” procedure in RFC for the selection of observations and variables. In other words, an RFC is a combination of tree predictors, so that each tree depends on independently sampled random vector values, and has the same distribution for all trees in the forest.34 Based on the latent variables obtained by multi-layer iteration, we construct the LNM prediction model. The algorithm is more accurate, thereby improving the predictive performance of diagnosis. Interestingly, the variables obtained by the RFC screening are almost the same as those obtained by the regression algorithm, but the potential predictive performance is quite different. Taken together, we have obtained a robust model of LNM prediction based on two different algorithms. This model can predict the risk of LNM in patients with pT1NxM0 CRC in time, to better obtain clinical shunt guidance.
In this study, we hope to use this model to predict whether patients with a specific set of characteristics have a high chance of LNM. Therefore, testing should be considered and patients are advised to take any preventive measures to reduce their risk. We separately evaluated the two outputs of the risk prediction model to determine their performance and determine possible improvements to the algorithm. According to the model predictive performance evaluation rules, when the AUC is greater than 0.75, the predictive model is considered to have good recognition ability.35 Meanwhile, the DCA was used to evaluate the utility of decision models.36 Compared with the predicted results of the nomogram, the AUC and DCA of RFC were relatively high, which mirrors RFC is a new supervised learning algorithm, at least could be evaluated as lymph node stage and take on a better role than GLM.
We acknowledged that this study has some limitations. First, this is a retrospective cohort study based on clinical records, these findings inevitably take into account the inherent selection bias. Second, this study was based on data from two tertiary treatment centers, it is necessary to conduct repeated validation using data from other more clinical medical centers. Third, both these models were based on clinical collectable variables, there will still be screening and exploration of concentrated molecular markers, such as immunological diagnosis biomarkers and genetical analysis. Collectively, other potential biomarkers need to be explored to use different methods to improve predictability.
Conclusion
The RFC model developed in this study was shown to be a potentially useful tool in determining the percentage risk and predicting the possibility of LNM in patients with pT1NxM0 CRC. As such, it may be useful for clinicians to use in combination with other biomarkers to determine which patients need additional surgery to avoid progression, as well as to avoid the additional risks of surgery.
Acknowledgments
The authors sincerely thank all patients and researchers who participated in this study. Meanwhile, the authors also thank the mother tongue polishing team for providing professional manuscript polishing services.
Funding
This research was supported by the Natural Science Foundation of Hubei Province (No.2019CFB643).
Disclosure
None of the authors have any conflicts of interest to declare.
References
1. Brenner H, Kloor M, Pox CP. Colorectal cancer. Lancet. 2014;383(9927):1490–1502. doi:10.1016/S0140-6736(13)61649-9
2. Simon K. Colorectal cancer development and advances in screening. Clin Interv Aging. 2016;11:967–976. doi:10.2147/CIA.S109285
3. Wen XQ, Qian XL, Sun HK, et al. MicroRNAs: multifaceted regulators of colorectal cancer metastasis and clinical applications. Onco Targets Ther. 2020;13:10851–10866. doi:10.2147/OTT.S265580
4. Muto T, Oya M. Recent advances in diagnosis and treatment of colorectal T1 carcinoma. Dis Colon Rectum. 2003;46(10 Suppl):S89–93. doi:10.1097/01.DCR.0000083525.97708.B5
5. Nascimbeni R, Burgart LJ, Nivatvongs S, Larson DR. Risk of lymph node metastasis in T1 carcinoma of the colon and rectum. Dis Colon Rectum. 2002;45(2):200–206. doi:10.1007/s10350-004-6147-7
6. Glynne-Jones R, Wyrwicz L, Tiret E, et al. Rectal cancer: ESMO Clinical Practice Guidelines for diagnosis, treatment and follow-up. Ann Oncol. 2017;28(suppl_4):iv22–iv40.
7. Brenner H, Hoffmeister M, Arndt V, Stegmaier C, Altenhofen L, Haug U. Protection from right- and left-sided colorectal neoplasms after colonoscopy: population-based study. J Natl Cancer Inst. 2010;102(2):89–95. doi:10.1093/jnci/djp436
8. Tian Y, Rong L, Ma Y. Surgical resection after endoscopic resection in patients with T1 colorectal cancer: a meta-analysis. Int J Colorectal Dis. 2021;36(3):457–466. doi:10.1007/s00384-020-03752-2
9. Suh JH, Han KS, Kim BC, et al. Predictors for lymph node metastasis in T1 colorectal cancer. Endoscopy. 2012;44(6):590–595. doi:10.1055/s-0031-1291665
10. Ichimasa K, Kudo SE, Miyachi H, Kouyama Y, Misawa M, Mori Y. Risk Stratification of T1 Colorectal Cancer Metastasis to Lymph Nodes: current Status and Perspective. Gut Liver. 2020;2:548.
11. Jiang T, Gradus JL, Rosellini AJ. Supervised Machine Learning: a Brief Primer. Behav Ther. 2020;51(5):675–687. doi:10.1016/j.beth.2020.05.002
12. Ichimasa K, Kudo SE, Mori Y, et al. Artificial intelligence may help in predicting the need for additional surgery after endoscopic resection of T1 colorectal cancer. Endoscopy. 2018;50(3):230–240. doi:10.1055/s-0043-122385
13. Rashidi HH, Tran NK, Betts EV, Howell LP, Green R. Artificial Intelligence and Machine Learning in Pathology: the Present Landscape of Supervised Methods. Acad Pathol. 2019;6:2374289519873088. doi:10.1177/2374289519873088
14. Collins GS, Reitsma JB, Altman DG, Moons KG. Transparent reporting of a multivariable prediction model for individual prognosis or diagnosis (TRIPOD): the TRIPOD statement. BMJ. 2015;350:g7594. doi:10.1136/bmj.g7594
15. Armstrong RA. When to use the Bonferroni correction. Ophthalmic Physiol Optics. 2014;34(5):502–508. doi:10.1111/opo.12131
16. Buri M, Hothorn T. Model-based random forests for ordinal regression. Int J Biostat. 2020;16(2). doi:10.1515/ijb-2019-0063
17. Portet S. A primer on model selection using the Akaike Information Criterion. Infect Dis Modelling. 2020;5:111–128. doi:10.1016/j.idm.2019.12.010
18. Saitoh Y, Inaba Y, Sasaki T, Sugiyama R, Sukegawa R, Fujiya M. Management of colorectal T1 carcinoma treated by endoscopic resection. Digestive Endoscopy. 2016;28(3):324–329. doi:10.1111/den.12503
19. Pedersen TB, Kildsig J, Serup-Hansen E, Gocht-Jensen P, Klein MF. Outcome following local excision of T1 anal cancers-A systematic review. Int J Colorectal Dis. 2020;35(9):1663–1671. doi:10.1007/s00384-020-03687-8
20. Oh JR, Park B, Lee S, et al. Nomogram Development and External Validation for Predicting the Risk of Lymph Node Metastasis in T1 Colorectal Cancer. Cancer Res Treatment. 2019;51(4):1275–1284. doi:10.4143/crt.2018.569
21. Park EY, Baek DH, Lee MW, Kim GH, Park DY, Song GA. Long-Term Outcomes of T1 Colorectal Cancer after Endoscopic Resection. J Clin Med. 2020;9(8):2451. doi:10.3390/jcm9082451
22. Asayama N, Oka S, Tanaka S, et al. Long-term outcomes after treatment for T1 colorectal carcinoma. Int J Colorectal Dis. 2016;31(3):571–578. doi:10.1007/s00384-015-2473-6
23. Wada H, Shiozawa M, Katayama K, et al. Systematic review and meta-analysis of histopathological predictive factors for lymph node metastasis in T1 colorectal cancer. J Gastroenterol. 2015;50(7):727–734. doi:10.1007/s00535-015-1057-0
24. Cracco N, Todaro V, Pedrazzi G, Del Rio P, Haboubi N, Zinicola R. The risk of lymph node metastasis in T1 colorectal cancer: new parameters to assess the degree of submucosal invasion. Int J Colorectal Dis. 2021;36(1):41–45. doi:10.1007/s00384-020-03738-0
25. Mou S, Soetikno R, Shimoda T, Rouse R, Kaltenbach T. Pathologic predictive factors for lymph node metastasis in submucosal invasive (T1) colorectal cancer: a systematic review and meta-analysis. Surg Endosc. 2013;27(8):2692–2703. doi:10.1007/s00464-013-2835-5
26. Jia J, Zheng X, Chen Y, et al. Stage-dependent changes of preoperative neutrophil to lymphocyte ratio and platelet to lymphocyte ratio in colorectal cancer. Tumour Biol. 2015;36(12):9319–9325.
27. Stojkovic Lalosevic M, Pavlovic Markovic A, Stankovic S, et al. Combined Diagnostic Efficacy of Neutrophil-to-Lymphocyte Ratio (NLR), Platelet-to-Lymphocyte Ratio (PLR), and Mean Platelet Volume (MPV) as Biomarkers of Systemic Inflammation in the Diagnosis of Colorectal Cancer. Dis Markers. 2019;2019:6036979. doi:10.1155/2019/6036979
28. Singh N, Baby D, Rajguru JP, Patil PB, Thakkannavar SS, Pujari VB. Inflammation and cancer. Ann Afr Med. 2019;18(3):121–126. doi:10.4103/aam.aam_56_18
29. Coussens LM, Werb Z. Inflammation and cancer. Nature. 2002;420(6917):860–867. doi:10.1038/nature01322
30. Mantovani A, Allavena P, Sica A, Balkwill F. Cancer-related inflammation. Nature. 2008;454(7203):436–444. doi:10.1038/nature07205
31. Colotta F, Allavena P, Sica A, Garlanda C, Mantovani A. Cancer-related inflammation, the seventh hallmark of cancer: links to genetic instability. Carcinogenesis. 2009;30(7):1073–1081. doi:10.1093/carcin/bgp127
32. Doupe P, Faghmous J, Basu S. Machine Learning for Health Services Researchers. Value Health. 2019;22(7):808–815. doi:10.1016/j.jval.2019.02.012
33. Chen J, de Hoogh K, Gulliver J, et al. Development of Europe-Wide Models for Particle Elemental Composition Using Supervised Linear Regression and Random Forest. Environ Sci Technol. 2020;54(24):15698–15709. doi:10.1021/acs.est.0c06595
34. Breiman L. Random Forests. Mach Learn. 2001;45(1):5–32. doi:10.1023/A:1010933404324
35. Lendrem BC, Lendrem DW, Pratt AG, et al. Between a ROC and a hard place: teaching prevalence plots to understand real world biomarker performance in the clinic. Pharm Stat. 2019;18(6):632–635. doi:10.1002/pst.1963
36. Sande SZ, Li J, D’Agostino R, Yin Wong T, Cheng CY. Statistical inference for decision curve analysis, with applications to cataract diagnosis. Stat Med. 2020;39(22):2980–3002. doi:10.1002/sim.8588
 © 2021 The Author(s). This work is published and licensed by Dove Medical Press Limited. The
full terms of this license are available at https://www.dovepress.com/terms
and incorporate the Creative Commons Attribution
- Non Commercial (unported, 3.0) License.
By accessing the work you hereby accept the Terms. Non-commercial uses of the work are permitted
without any further permission from Dove Medical Press Limited, provided the work is properly
attributed. For permission for commercial use of this work, please see paragraphs 4.2 and 5 of our Terms.
© 2021 The Author(s). This work is published and licensed by Dove Medical Press Limited. The
full terms of this license are available at https://www.dovepress.com/terms
and incorporate the Creative Commons Attribution
- Non Commercial (unported, 3.0) License.
By accessing the work you hereby accept the Terms. Non-commercial uses of the work are permitted
without any further permission from Dove Medical Press Limited, provided the work is properly
attributed. For permission for commercial use of this work, please see paragraphs 4.2 and 5 of our Terms.