Back to Journals » Nature and Science of Sleep » Volume 15
Subjective Sleep Quality, Caffeine, and Dieting Behaviors Among University-Attending Young Adults
Authors Claydon EA ![]() , Kahwash JM
, Kahwash JM ![]() , Lilly CL, Alamir Y, Zullig KJ
, Lilly CL, Alamir Y, Zullig KJ
Received 14 June 2023
Accepted for publication 12 September 2023
Published 22 September 2023 Volume 2023:15 Pages 737—747
DOI https://doi.org/10.2147/NSS.S420568
Checked for plagiarism Yes
Review by Single anonymous peer review
Peer reviewer comments 2
Editor who approved publication: Prof. Dr. Ahmed BaHammam
Elizabeth A Claydon,1 Jenna M Kahwash,1 Christa L Lilly,2 Yahya Alamir,3 Keith J Zullig1
1Department of Social and Behavioral Sciences, West Virginia University School of Public Health, Morgantown, WV, USA; 2Department of Epidemiology and Biostatistics, West Virginia University School of Public Health, Morgantown, WV, USA; 3Department of Health Education & Promotion, Faculty of Public Health & Tropical Medicine, Jazan University, Jazan, Saudi Arabia
Correspondence: Elizabeth A Claydon, West Virginia University School of Public Health, 64 Medical Center Drive, P.O. Box 9190, Morgantown, WV, 26505, USA, Email [email protected]
Background: Research has shown that university students engage in behaviors that are associated with poor sleep quality, such as higher caffeine and alcohol intake. Yet studies exploring eating habits and weight loss mechanisms related to sleep quality have generally been inconclusive. This study explored total daily caffeine consumption (along with different sources of caffeine) as well as dieting and exercising to lose weight in the last 30 days as risk factors for poor sleep quality among an undergraduate university population.
Methods: Full-time undergraduate students (n = 400) participated in an anonymous online survey about various health behaviors at a large, mid-Atlantic university. Multivariable linear regressions were run to consider subjective sleep quality in relation to caffeine consumption and dieting behavior along with other covariates. A sensitivity analysis was run to explore how different types of caffeinated beverages were associated with sleep quality as well. All analyses were conducted using SAS JMP Version 16.
Results: A stepwise multivariable linear regression controlling for alcohol use, grade point average, biological sex, and stress showed significant increases in sleep quality scores (indicating worsening sleep quality). Total caffeine consumption remained significant through the models until psychosocial factors were added (B = 0.003, p = 0.0035). The sensitivity analysis indicated that total caffeine consumption from soda remained significant across all models, significantly increasing sleep quality scores (B = 0.01; p = 0.0054).
Discussion: Higher amounts of caffeine from sodas were associated with more significant decreases in sleep quality than other types of caffeine, including energy drinks, coffee, and tea. Dieting or exercising to lose weight was not significantly associated with sleep quality. The results of this study can help to refine intervention efforts designed to improve sleep quality among undergraduate university students. Behavioral interventions specific to reducing caffeine intake, specifically from caffeinated sodas, may prove to be beneficial with this population.
Plain Language Summary: In college, students face risks for worse sleep quality, like consuming more caffeine and feeling more stressed. When scientists studied how eating habits affect sleep, the results were mixed. This study was conducted to see how much caffeine and weight-loss methods affect sleep quality for college students.
Researchers used a survey to ask college students about their sleep, caffeine, weight-loss methods, and other behaviors. This study found that drinking more soda was associated with worse sleep quality when compared to drinking coffee, tea, or energy drinks. Drinking alcohol and being stressed also was connected with poorer sleep quality worse. However, researchers did not find a link between weight-loss methods and sleep quality.
For college students to have better sleep, interventions should try to lower caffeine intake (especially from soda), alcohol intake, and stress levels.
Keywords: caffeine, sleep quality, university students, disordered eating
Introduction
Sleep is a basic human necessity, vital for overall health and wellbeing. Sleep quality is a complex concept with no consensus definition but can be generally understood as sleep satisfaction, based on both objective and subjective components of sleep.1 The Pittsburgh Sleep Quality Index (PSQI) comprises seven sleep components: subjective sleep quality, sleep latency, sleep duration, habitual sleep efficiency, sleep disturbances, use of sleeping medication, and daytime dysfunction over a 1-month interval.2 Poor sleep quality is indicated by higher PSQI scores and has been linked to many chronic conditions, including type 2 diabetes, heart disease, obesity and depression, as well as injury and disability associated with vehicle accidents and occupational errors.3 As a result of these associations, poor sleep quality contributes significantly to the global burden of disease, indicating an opportunity for public health intervention. Sleep duration is a frequently studied component of sleep quality, with a recommended minimum threshold of seven hours a night to support optimal health in adults between the ages of 18 and 60.4 However, current estimates show that one-third of US adults typically sleep on average less than the recommended seven hours.3
University-attending students traditionally experience poor sleep quality, given their heightened stress, caffeine intake, and irregular sleep-wake patterns.5 These students with poor sleep quality are also at risk of experiencing detrimental consequences such as reduced academic performance and mental health problems.6–8
Many college students leaving their home for the first time must learn to balance the challenges of early adulthood with academics. This transition can result in higher levels of stress, which can affect sleep quality outcomes.5 In a 2021 American College Health Association report,9 the majority of undergraduates surveyed reported experiencing moderate or high levels of stress in the past 30 days. This same report found that stress and sleep difficulties, among other variables, were negatively associated with students’ academic performance. Recent studies suggest that both sleep quality and quantity are associated with academic performance indicators, such as grade point average (GPA) and that higher sleep quality and quantity for a consistent time period is associated with better grades.6,10 Assessing causes of stress, as well as the coping mechanisms utilized to combat stress, can help define more targeted risk factors for sleep quality. Addressing the university population will help nurture better sleep quality for more favorable health outcomes in future generations.
Caffeine intake, in general, is a known determinant of poor sleep quality.5 However, the variations in caffeine consumption among different studies, age groups, and locations are drastic. Caffeine is a staple in the daily routines of many individuals, with 85% of the US population consuming at least one caffeinated beverage per day with mean caffeine intake from all beverages approximately 165 ± 1 mg per day, with coffee as the primary contributor overall.11 Among college students, a recent study found a mean caffeine intake of 159 mg per day among both reported consumers of caffeine and non-consumers of caffeine, with coffee also reported as the primary source.12
Another contemporary study among American undergraduate students found poor sleep consistency between weekdays and weekends (which they refer to as social jet lag) and problems with sleep quality to be associated with lower intuitive eating, greater emotional eating, and greater loss of control over eating.13 Intuitive eating refers to the practice of prioritizing one’s physical hunger to create a healthy relationship with food and body image and is associated with positive health outcomes.14 However, emotional eating is theorized to occur independently of one’s physical hunger and is rather influenced by emotional state.15 Loss of control over eating is the subjective inability to stop eating, or to limit the amount of food consumed, and it is also a primary component of a binge eating episode.16 Further exploration is needed to understand the potential relationship between disordered eating behaviors and lower sleep quality among the undergraduate population.
The young adult population is also especially vulnerable to disordered eating behaviors, with a 2019 nationwide (US) study revealing that 95% of diagnosed first-time cases of an eating disorder occurred by the age of 25.17 Eating habits during college years have also been previously studied in association with sleep quality, but according to a 2021 literature review, the studies are limited, and results have been generally inconclusive.5 For example, one study assessed three sleep variables in association with certain dietary patterns and found that increased energy drink and sports drink consumption, as well as skipping breakfast, were associated with lower sleep quality.18 However, sleep quality was only reported through a single self-reported survey question. Thus, there remains a gap for deeper consideration of all the aspects that make up sleep quality. Moreover, there is a dearth of literature exploring the potential differentiation between various forms of caffeine consumption and sleep quality.
Weight loss due to diet and exercise may also be associated with improved sleep quality. Inversely, poor sleep has been studied as a potential hindrance on one’s attempts to lose weight.19 Exercise types (including both high-intensity interval training and following World Health Organization physical activity levels) have been associated with improved sleep quality.20 Nutrition factors, including the diet quality, are also associated with sleep quality. A systematic review indicated healthier foods are associated with improved sleep quality, whereas highly processed and sugary foods are associated with poorer sleep quality.21 Additionally, eating disorders specifically (which often comprise dieting and/or exercising to lose weight) have been significantly associated with insomnia, daytime dysfunction, sleep quality, and sleep apnea.22 Most of these studies, however, have investigated adults rather than college students specifically.
Current literature suggests the importance of examining sleep quality using several sleep indicators (duration, consistency, perceived quality) along with associations with other variables such as dietary behaviors, caffeine intake, and stress or other mental health indicators.5 Additionally, available studies examining this topic may not control for lifestyle factors, such as alcohol use, which may be more prevalent in the university student population when compared to other persons in the same age group.23
This study’s purpose is to investigate the association between total caffeine consumption among university students, diet, and exercise to lose weight, and subjective sleep quality (measured by the PSQI), while also controlling for select covariates deemed to be important from the literature. Our first hypothesis was that higher caffeine consumption would be associated with poorer sleep quality (or higher PSQI scores). Our second hypothesis was that reporting dieting or exercising to lose weight in the last month would also be inversely associated with sleep quality scores. A second, exploratory aim was to understand varying contributions of different types of caffeinated beverages (including caffeinated soda, coffee, tea, and energy drinks) to the models. We hypothesized that beverages with higher caffeine content would be more strongly associated with poor sleep quality. Covariates considered for all aims included total alcohol use, biological sex, grade point average (GPA), and perceived stress. Knowledge gained from this study could inform interventions and campaigns designed to better inform students and improve sleep quality in college campuses.
Methods
Participants and Procedure
Full-time undergraduate university students between 18 and 24 were eligible for survey participation in the main study, which considered theoretical models and has been previously published.24 This study utilized variables not used in that previous publication, specifically caffeine and other psychosocial risk factors. Enrollment occurred in 2016 at a Mid-Atlantic university with 22,563 undergraduate students. Stratified random sampling was used to select representative students (n = 2200) from the total undergraduate population (comprised of freshmen 36.1%, sophomores 26.6%, juniors 20.5%, and seniors 16.8%). These identified students were then invited by email to participate. The survey was sent five days after the initial email and participants were entered into a drawing for one of 50 $10 gift cards. The survey was distributed and managed through Qualtrics (Provo, UT) and upon consent, students completed the survey. Those who had not responded were sent three email reminders, with the survey active for a total of 30 days. A total of 494 surveys were completed, satisfying power estimates. The 22.5% response rate was consistent with other higher education online surveys.25 Additional methods for this study have been published previously.24 Institutional Review Board approval was obtained from West Virginia University (Protocol #1603066826).
Measures
Pittsburgh Sleep Quality Index (PSQI)
The PSQI was used to measure sleep quality, assessing sleep and disturbances over 30 days. The scale includes 19 self-report Likert items across seven components: subjective sleep quality, sleep latency, sleep duration, habitual sleep efficiency, sleep disturbances, use of sleeping medication, and daytime dysfunction. A global score is created from the subscales and ranges from 0 to 21, with higher scores indicating worse sleep quality.2
The PSQI has displayed adequate internal consistency with coefficient alphas of 0.83 and demonstrated stability over time.2,26 Global PSQI scores greater than 5 have sensitivity of 89% and specificity of 85% for indicating poor sleep quality (Kappa = 0.75, p < 0.001).2 In this sample, the PSQI demonstrated an overall internal consistency estimate of 0.78.
Total Caffeine Consumption
Caffeine consumption was measured in total milligrams of caffeine consumed on an average per day across reported average daily consumption of caffeinated coffee, soda, tea, and energy drinks. Questions to assess caffeine consumption in this way have been validated in several publications with large, nationally representative samples.27 To determine the total mg of caffeine consumed, weights based on average amount of caffeine in an 8 oz drink were applied to the number of caffeinated drinks per day. Coffee was given a weight of 96, energy drinks 71.9, and caffeinated soda were given 22 based on estimates by the Mayo Clinic.28 Since tea was not defined as caffeinated or decaffeinated in the question asked to participants, caffeinated and decaffeinated tea milligrams were averaged to get a weight of 13.25 which was applied to daily average tea drinks in the last 7 days.28
Dieting & Exercising to Lose Weight
Diet and exercise were assessed by two questions: “Within the last 30 days, did you do any of the following”: “exercise to lose weight” or “diet to lose weight”. Answers were dichotomous (yes/no). These questions were adapted from the national Youth Risk Behavior Survey and showed moderate reliability (exercising to lose weight kappa = 53.2; dieting to lose weight kappa = 57.6).29,30 These two variables were combined to create one categorical variable for analysis with four levels: 1: none; 2: diet, but not exercise; 3: exercise, but not diet; 4: and exercise and diet.
Total Alcohol Drinks
Alcohol consumption was created by multiplying participant response of the number of days per week of alcohol use by the number of drinks per day. The original questions for number of drinks per day were adapted from the National College Health Assessment.9 The resulting continuous response provided the number of total alcohol drinks per week participants self-reported.
GPA
For GPA, students were asked “What is your current overall Grade Point Average”?. Participants were directed to write their response using a 4.0 scale, providing a continuous variable for analysis.
Stress
Stress was measured by a single question from the National College Health Assessment:9 “Within the last 12 months, how would you rate the overall level of stress you have experienced”? Participants could respond with a 5-point Likert scale ranging from “No stress” to “Tremendous stress”. This question has demonstrated very good reliability (kappa = 0.801).31
Demographic Variables
Several demographic variables were included as covariates in the model. Biological sex was measured as a dichotomous variable (male/female) and race was assessed with the question: “How do you usually describe yourself”? Responses included White, Black or African American, American Indian or Alaska Native, Asian, Native Hawaiian or Pacific Islander, or Other. These were then created into separate dichotomous variables for ease of analysis (eg: white: yes/no).
Biological sex was included in the model given evidence indicating that although females sleep longer than males, they experience poorer sleep quality.32–35 Research also suggests that women might have heightened daytime sleepiness, which could indicate a greater impact of chronic sleep loss on females.36,37 Additionally, sleep problems are prevalent among college students with similar findings of females reporting longer sleep periods, but more awakenings and poorer sleep quality than male college students.35,38 Race was also included in the model owing to evidence suggesting poor sleep is more common in the Black population compared with White Americans.39,40
Data Analyses
Descriptive statistics were conducted and reported with both means and standard deviations for continuous variables as well as frequencies and valid percentages for categorical variables. Bivariate Pearson correlations were run between risk factors (total caffeine consumption and dieting/exercising to lose weight in the last 30 days), controlling factors (biological sex, alcohol consumption, GPA, perceived stress, and race), and PSQI scores. Regression model assumptions were checked prior to running models. After examining bivariate associations between covariates and the outcome variable (dieting/exercising to lose weight in the last 30 days), race was removed due to lack of bivariate statistical significance. All other model assumptions were satisfied. Standard selection multivariable linear regression models were run with risk factors of sleep quality (PSQI scores) in a set of three models. The initial model (Model 1) was run with the risk factors of interest: total caffeine consumption (in mg) and dieting/exercising to lose weight in the last 30 days. The second model (Model 2) included the primary risk factors as well as demographic and behavioral factors, including biological sex, GPA, and total alcohol drinks per day. The final model (Model 3) included all previous variables, as well as an additional psychosocial factor: stress. A sensitivity analysis was also conducted with one full model containing caffeine mg from different types of caffeine sources: coffee, energy drinks, caffeinated soda, and tea. This was run to understand if the source of caffeine might be differentially associated with sleep quality. Model results reported included model fit, model R square, unstandardized beta weights and accompanying standard error, and accompanying p-values. Alpha was set to 0.05 for all analyses, and all analyses were conducted with JMP 16.0®.
Results
Demographic Characteristics
The total sample (N = 494) was reduced to n = 400 based upon completion of the outcome variable. Over the last month, students reported an average of 6.7 hours (SD=1.33) of sleep per night. The mean sleep quality score was 7.5 (SD=3.5), with the global cut-off (>5) indicating that 69% of the population experienced poor sleep quality. A majority of the sample was female (61.9%) and White (87.3%) with a mean age of 20.2 ± 5.7. Average caffeine consumption per day was 192 ± 188.60 mg, with an interquartile range of 57.25–263.98 and a median of 131.25. For full demographics see Table 1. Additionally, bivariate correlations between the variables can be found in Table 2.
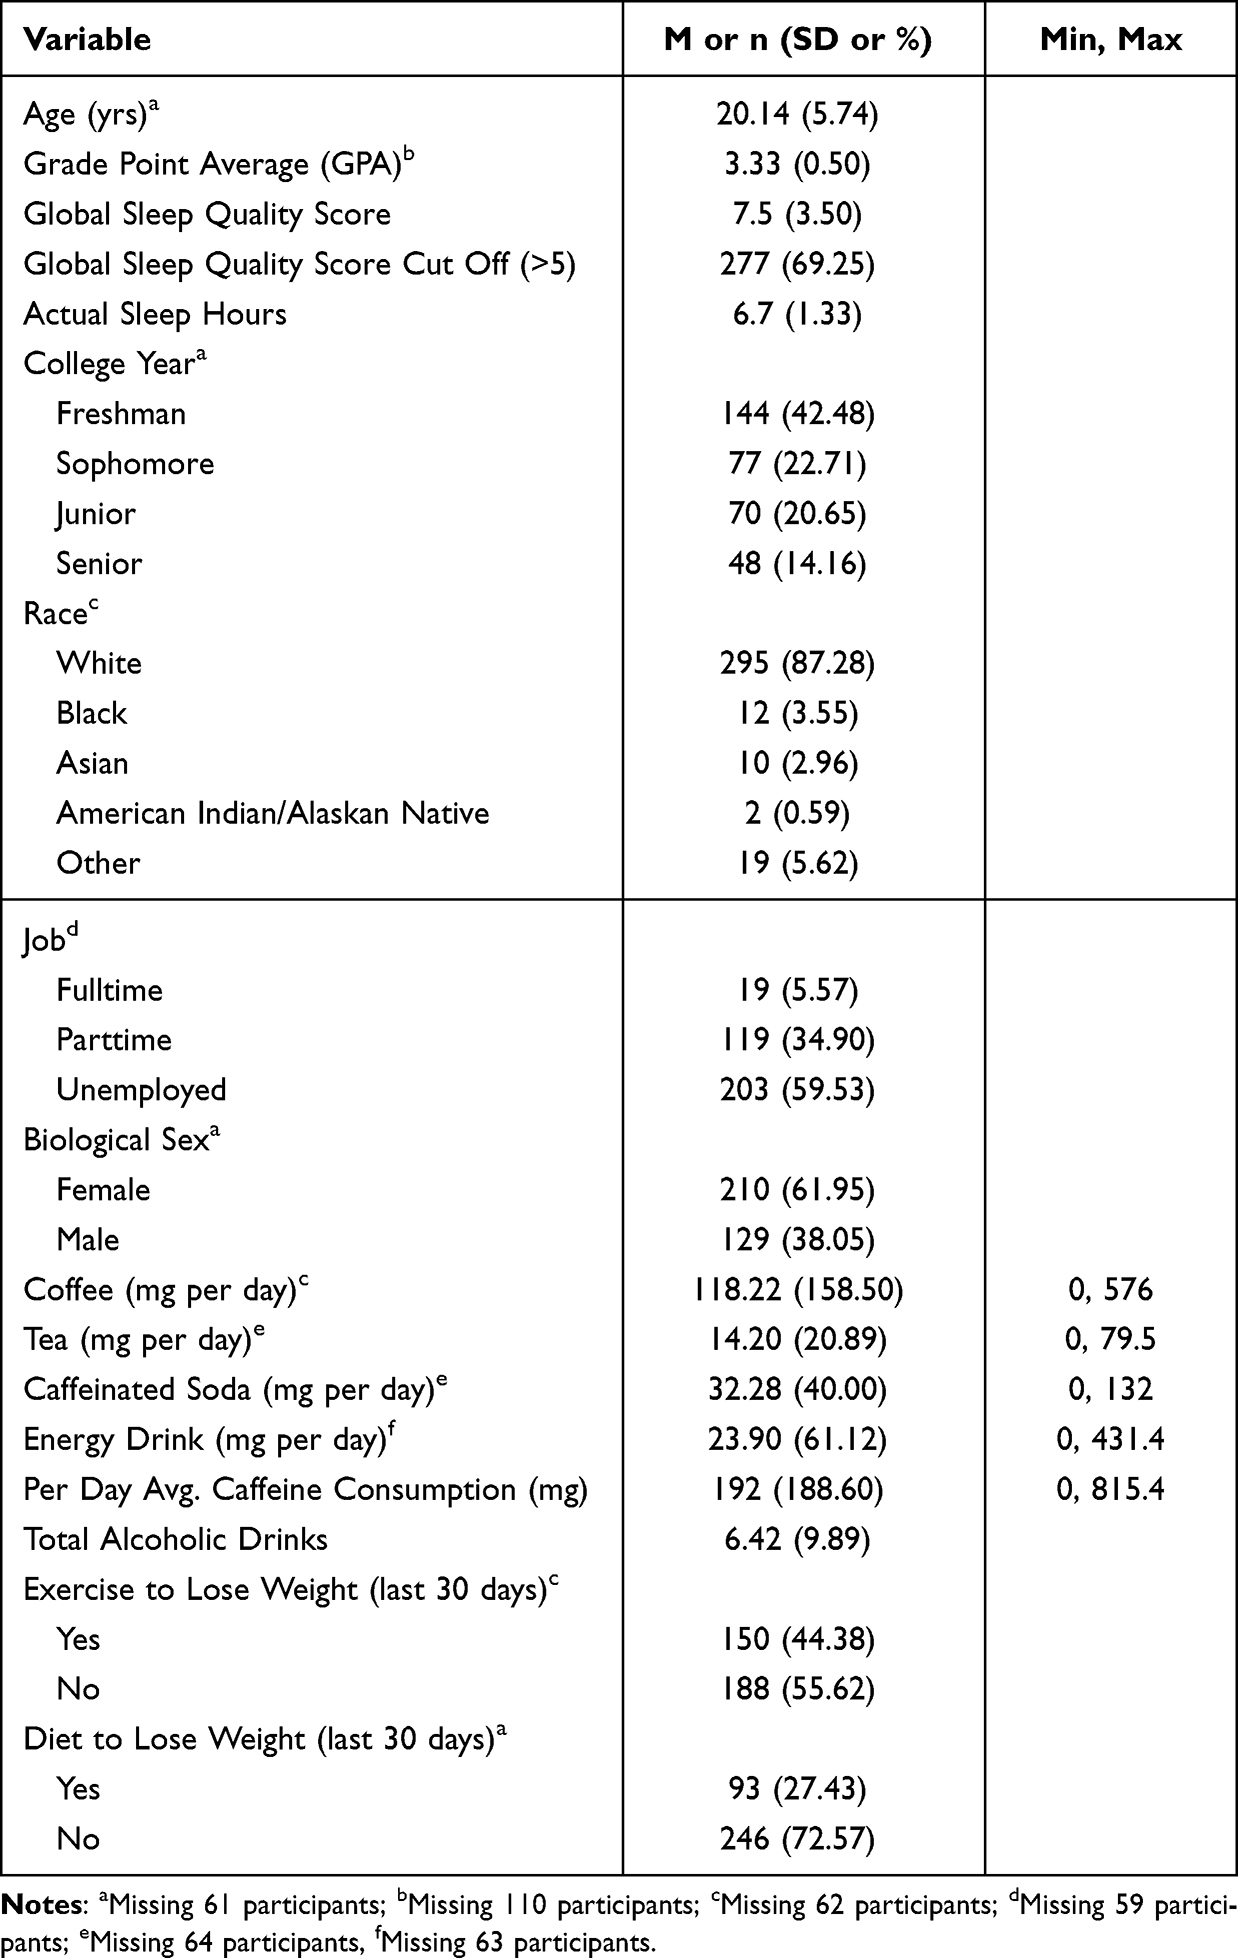 |
Table 1 Demographics and Descriptive Statistics for Participants (N = 400) |
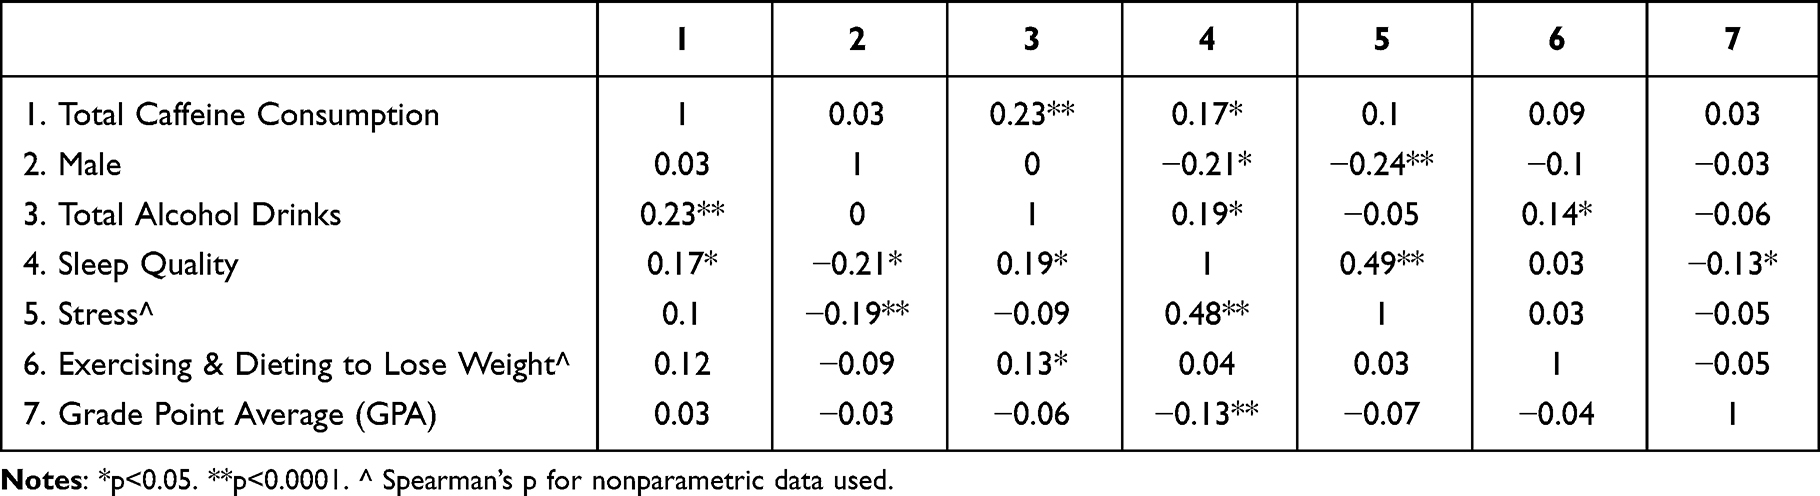 |
Table 2 Correlations |
Stepwise Multivariable Linear Regression
Model 1 explained 2.9% of the variance in PSQI scores [F (4, 400) = 2.44), p = 0.047, R2 = 0.029]. Total caffeine consumption was associated with significantly increased PSQI scores (B = 0.003±0.001, p = 0.0035), but not dieting to lose weight (p = 0.3765), exercising to lose weight (p = 0.6435), or dieting or exercising to lose weight (p = 0.7520). Model 2 added demographic and behavioral factors into the model, namely biological sex, and total alcohol drinks. Model 2 explained 11% of the variance in PSQI scores [F (7, 400) = 4.96), p < 0.0001, R2 = 0.11]. Total caffeine consumption was still significantly associated with increased PSQI scores (B = 0.003, SE = 0.001, p = 0.0110), as did total alcohol drinks (B = 0.05 ± 0.02, p = 0.0106). However, identifying as male and a higher reported GPA was associated with decreased PSQI scores. Dieting to lose weight (p = 0.2459), exercising to lose weight (p = 0.5200), and dieting or exercising to lose weight (p = 0.4093) remained statistically non-significant. Model 3 explained the most variability of the three models, with 29% of the variability in PSQI scores [F (11, 400) = 9.90), p < 0.0001, R2 = 0.29]. However, total caffeine consumption was no longer significant (p = 0.151). Total alcohol drinks were still significantly associated with increased PSQI scores, as was tremendous stress, and more than average stress. Identifying as male was associated with significantly decreased PSQI scores, as was less than average reported stress. Dieting and exercising to lose weight were not significant, nor was average stress (See Table 3).
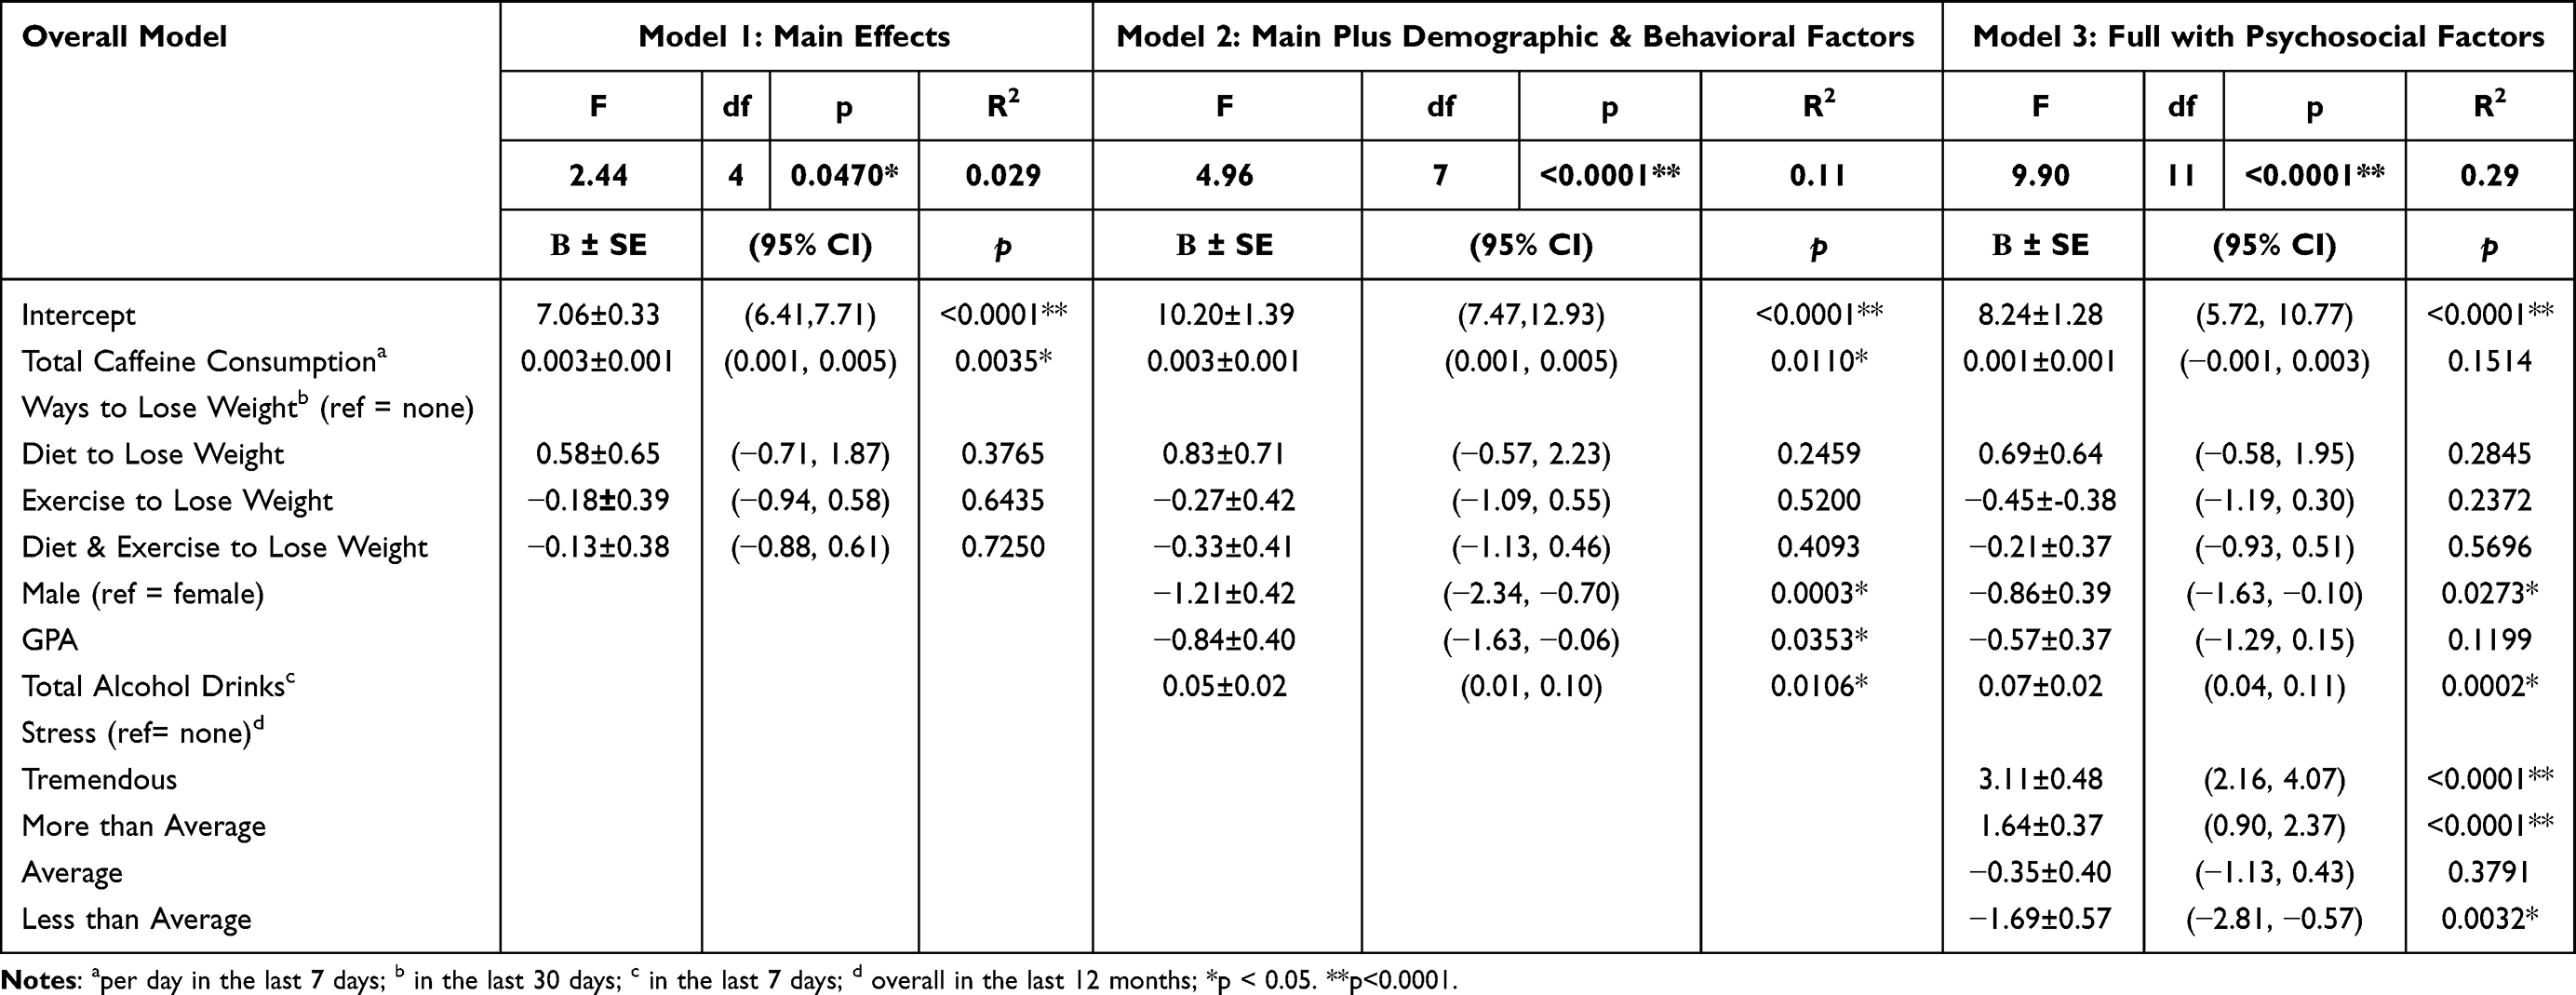 |
Table 3 Stepwise Multivariable Linear Regression Models Examining Total Caffeine Consumption as Predictor of Sleep Quality (N = 400) |
Sensitivity Analysis
In addition to the total caffeine consumption model, the full model was run with PSQI and individual risk factors of total caffeine milligrams for coffee, caffeinated soda, energy drinks, and tea, respectively, to assess whether certain forms of caffeine consumption were more highly associated with increasing PSQI scores.
The full model including all sources of caffeine was significant, explaining 28% of the variance in PSQI scores. Within that model, the only statistically significant caffeine source was caffeinated sodas (p = 0.0141). See Supplementary Table 1. Additionally, based on the standard beta weight, the strongest independent variable in the model was caffeine from soda (ß=0.13), after controlling for the other variables.
In summary, this sensitivity analysis generally replicated total caffeine consumption but with some additional information: caffeinated soda retained its significance with PSQI score in the full model, whereas the other types of caffeinated beverages did not.
Discussion
To summarize, the findings of this study indicate relatively poor sleep quality among university-attending young adults. This poor sleep quality is associated with total caffeine consumption, but not with dieting or exercising to lose weight in the past 30 days. Additionally, the strongest association for caffeine type and reduced sleep quality was caffeinated sodas.
First, students reported less than the recommended 7–8 hours of sleep per night (6.7 hours) over the past month.3,41 Based on the global cut-off score, 69% (n = 277) of students in our sample were classified as poor-quality sleepers, consistent with previous reports indicating more than 60% of college students had poor quality sleep.35,42 We also found that females in our sample reported poorer sleep quality, consistent with prior research.35,43
Our finding that soda caffeine consumption is most significantly associated with poor sleep quality has some support in other literature. Although studies focused exclusively on soda consumption are relatively rare, available evidence suggests a relationship in elementary and middle school students who sleep less than 10 hours per night and consume more soda.44 Franckle et al44 specifically examined the number of times soda was consumed up to 3 times per day, which may not have captured all the caffeinated soda consumed. Our study provides details about how much soda was consumed with estimates of caffeine from that soda. This association between soda consumption and poor sleep quality in our sample may be due to university students drinking more soda (which is highly available) at night to stay awake. Alternatively, it may be due to having less awareness about soda serving sizes and caffeine amount, therefore, students may be more likely to consume it later in the day. Whatever the case, our findings support research demonstrating an association between increased intake of sugar-sweetened beverages (SSBs) and short sleep duration among adolescents and adults.45–47 Sugar-sweetened beverages, including soda, are also associated with weight gain48,49 and overall poorer diet.46 This study teases out caffeinated sodas as distinctive from other types of SSBs, including coffee, and provides a strong association of poor sleep quality with caffeinated sweetened soda. However, future studies should also consider the time of day of caffeine consumption to understand whether timing of caffeine intake changes the relationship with poor sleep quality.
Our other primary variable of interest, dieting and exercising to lose weight, was not significantly associated with sleep quality, although this could be due to a lack of greater specificity with the questions. Dieting and exercising to lose weight could involve individuals approaching these mechanisms in either healthy (moderation) or unhealthy (disordered eating and excessive exercise) ways. Positive associations with improved sleep quality have primarily been shown with increased exercise20 and improved nutrition.21 However, poor sleep quality has been associated with eating disorders.22 Therefore, having specific distinctions with additional questions to assess exercise, diet quality, and disordered eating symptoms/diagnoses would be helpful to better tease out this relationship among university students.
In relation to caffeine, the average reported consumption of caffeine per day in milligrams was 192 mg (SD = 188.60), which is higher than previous studies.11,12 Similar to Mahoney et al,12 we found that the majority of caffeine consumption in milligrams was due to coffee consumption in our sample (119 mg). Increased caffeine intake had poorer sleep quality in models 1 and 2. With the beta coefficient for total caffeine consumption of 0.003 in model 1 and 2 (See Table 2), a 1-point increase in caffeine mg would correspond to a 0.003 increase in PSQI score (or worsening sleep quality). Although this effect size is small, when measured by the amount of caffeine someone is drinking, considering the mean of 192 mg/day of caffeine, this would correspond to a half point increase (0.576) in PSQI scores, or one-sixteenth of a standard deviation in PSQI scores.
Strengths and Limitations
There are several limitations to note for this study. First, the data are cross-sectional, which limits our ability to draw conclusions about the causality between sleep quality and caffeine. Second, the survey was self-reported, which may present both recall and social desirability biases. Third, this sample was only from one Mid-Atlantic university, which reduces the ability to generalize findings to other undergraduate students. A large majority of the sample identified as White, limiting applicability to other universities with more racially diverse populations. Also, the survey did not distinguish between gender and biological sex, providing only “female” and “male” as options for the variable of gender, perpetuating the sex/gender binary and limiting applicability to trans or gender-diverse people. Additionally, questions assessing diet and exercise might have resulted in responses that conflated healthy diet changes and increased exercise with restrictive dieting and/or eating disorder symptoms. Finally, the PSQI is a more subjective measure of sleep quality, rather than an objective one such as polysomnography or wearable technology, which can provide a more detailed picture of sleep.
Despite these limitations, our study has multiple strengths. For example, this study comprehensively examines multiple demographic, behavioral, and psychosocial factors with sleep quality among a large sample of college students in the Appalachian region. The sample was diverse in levels of undergraduate students, with freshman, sophomore, junior, and senior representation. Additionally, we have specificity in the understanding of the distinct association of different types of caffeine with sleep quality among this population, as well as their total caffeine intake from each source. The PSQI has been validated and used in many other sleep studies, adding to the ability to generalize these findings.
Conclusions
The study’s findings indicate that poor sleep quality is associated with increased caffeine intake, but not with dieting or exercising to lose weight. However, when stress was considered, it outweighed the influence of caffeine. Of the different sources of caffeine that were assessed, soda had the most significant association with poor sleep quality, when controlling for psychosocial and behavioral factors that affect sleep in college students. Specifically, tremendous and more than average stress are significantly related to poor sleep quality, whereas less than average stress was significantly associated with improved sleep quality. This indicates the need for considering different sources of caffeine, particularly soda when creating interventions or messaging for improving sleep quality. Additionally, since both increased alcohol and stress were strongly associated with poor sleep quality, we need to account for and mitigate other areas of a college student’s life that may affect sleep. Further research is also needed in this population to determine the difference between positive lifestyle changes in diet and exercise compared with disordered eating patterns.
Data Sharing Statement
Data can be requested from the corresponding author.
Ethical Approval – Human Subjects
This study was approved by West Virginia University’s Institutional Review Board (#1603066826). The study complies with all requirements of the Declaration of Helsinki.
Informed Consent
All participants received informed consent and consented to be part of the study.
Author Contributions
All authors made a significant contribution to the work reported, whether that is in the conception, study design, execution, acquisition of data, analysis and interpretation, or in all these areas; took part in drafting, revising or critically reviewing the article; gave final approval of the version to be published; have agreed on the journal to which the article has been submitted; and agree to be accountable for all aspects of the work.
Disclosure
The authors report no conflicts of interest in this work.
References
1. Nelson KL, Davis JE, Corbett CF. Sleep quality: an evolutionary concept analysis. Nurs Forum. 2022;57(1):144–151. doi:10.1111/nuf.12659
2. Buysse DJ, Reynolds CF 3rd, Monk TH, Berman SR, Kupfer DJ. The Pittsburgh Sleep Quality Index: a new instrument for psychiatric practice and research. Psychiatry Res. 1989;28(2):193–213. doi:10.1016/0165-1781(89)90047-4
3. Control CfD. Sleep and Sleep Disorders. CDC; 2022. Available from: https://www.cdc.gov/sleep/index.html.
4. Consensus Conference P, Watson NF, Badr MS, et al. Joint Consensus Statement of the American Academy of Sleep Medicine and Sleep Research Society on the Recommended Amount of Sleep for a Healthy Adult: methodology and Discussion. J Clin Sleep Med. 2015;11(8):931–952. doi:10.5664/jcsm.4950
5. Wang F, Biro E. Determinants of sleep quality in college students: a literature review. Explore. 2021;17(2):170–177. doi:10.1016/j.explore.2020.11.003
6. Bono TJ, Hill PL. Sleep quantity and variability during the first semester at university: implications for well-being and academic performance. Psychol Health Med. 2022;27(4):931–936. doi:10.1080/13548506.2021.1971724
7. Saruhanjan K, Zarski AC, Bauer T, et al. Psychological interventions to improve sleep in college students: a meta-analysis of randomized controlled trials. J Sleep Res. 2021;30(1):e13097. doi:10.1111/jsr.13097
8. Chen WL, Chen JH. Consequences of inadequate sleep during the college years: sleep deprivation, grade point average, and college graduation. Prev Med. 2019;124:23–28. doi:10.1016/j.ypmed.2019.04.017
9. Association ACH. American College Health Association-National College Health Assessment III: undergraduate Student Executive Summary Fall 2021; 2022. Available from: https://www.acha.org/NCHA/ACHA-NCHA_Data/Publications_and_Reports/NCHA/Data/Reports_ACHA-NCHAIII.aspx.
10. Okano K, Kaczmarzyk JR, Dave N, Gabrieli JDE, Grossman JC. Sleep quality, duration, and consistency are associated with better academic performance in college students. Npj Sci Learning. 2019;4(1):16. doi:10.1038/s41539-019-0055-z
11. Mitchell DC, Knight CA, Hockenberry J, Teplansky R, Hartman TJ. Beverage caffeine intakes in the U.S. Food Chem Toxicol. 2014;63:136–142. doi:10.1016/j.fct.2013.10.042
12. Mahoney CR, Giles GE, Marriott BP, et al. Intake of caffeine from all sources and reasons for use by college students. Clin Nutr. 2019;38(2):668–675. doi:10.1016/j.clnu.2018.04.004
13. Vrabec A, Yuhas M, Deyo A, Kidwell K. Social jet lag and eating styles in young adults. Chronobiol Int. 2022;39(9):1277–1284. doi:10.1080/07420528.2022.2097090
14. Tribole E, Resch E. Intuitive Eating.
15. Barcın-Güzeldere HK, Devrim-Lanpir A. The Association Between Body Mass Index, Emotional Eating and Perceived Stress during COVID-19 Partial Quarantine in Healthy Adults. Public Health Nutr. 2022;25(1):43–50. doi:10.1017/s1368980021002974
16. Reed GM, First MB, Kogan CS, et al. Innovations and changes in the ICD-11 classification of mental, behavioural and neurodevelopmental disorders. World Psychiatry. 2019;18(1):3–19. doi:10.1002/wps.20611
17. Ward ZJ, Rodriguez P, Wright DR, Austin SB, Long MW. Estimation of Eating Disorders Prevalence by Age and Associations With Mortality in a Simulated Nationally Representative US Cohort. JAMA Netw Open. 2019;2(10):e1912925. doi:10.1001/jamanetworkopen.2019.12925
18. Ogilvie RP, Lutsey PL, Widome R, Laska MN, Larson N, Neumark-Sztainer D. Sleep indices and eating behaviours in young adults: findings from Project EAT. Public Health Nutr. 2018;21(4):689–701. doi:10.1017/s1368980017003536
19. Thomson CA, Morrow KL, Flatt SW, et al. Relationship between sleep quality and quantity and weight loss in women participating in a weight-loss intervention trial. Obesity. 2012;20(7):1419–1425. doi:10.1038/oby.2012.62
20. Jurado-Fasoli L, Mochon-Benguigui S, Castillo MJ, Amaro-Gahete FJ. Association between sleep quality and time with energy metabolism in sedentary adults. Sci Rep. 2020;10(1):4598. doi:10.1038/s41598-020-61493-2
21. Godos J, Grosso G, Castellano S, Galvano F, Caraci F, Ferri R. Association between diet and sleep quality: a systematic review. Sleep Med Rev. 2021;57:101430. doi:10.1016/j.smrv.2021.101430
22. Tromp MD, Donners AA, Garssen J, Verster JC. Sleep, eating disorder symptoms, and daytime functioning. Nat Sci Sleep. 2016;8:35–40. doi:10.2147/NSS.S97574
23. Administration SAa MHS. 2019 National Survey on Drug Use and Health; Table 6.21B – types of Illicit Drug, Tobacco Product, and Alcohol Use in Past Month among Persons Aged 18 to 22, by College Enrollment Status and Gender: percentages, 2018 and 2019. Substance Abuse and Mental Health Service Administration. Available from: https://www.samhsa.gov/data/release/2019-national-survey-drug-use-and-health-nsduh-releases.
24. Alamir YA, Zullig KJ, Kristjansson AL, Wen S, Misra R, Montgomery-Downs H. A theoretical model of college students’ sleep quality and health-related quality of life. J Behav Med. 2022;45(6):925–934. doi:10.1007/s10865-022-00348-9
25. Sax LJ, Gilmartin SK, Bryant AN. Assessing Response Rates and Nonresponse Bias in Web and Paper Surveys. Res High Educ. 2003;44(4):409–432. doi:10.1023/A:1024232915870
26. Yi H, Shin K, Shin C. Development of the sleep quality scale. J Sleep Res. 2006;15(3):309–316. doi:10.1111/j.1365-2869.2006.00544.x
27. Kristjansson AL, Mann MJ, Smith ML, Kogan SM, Lilly CL, James JE. Caffeine consumption and onset of alcohol use among early adolescents. Prev Med. 2022;163:107208. doi:10.1016/j.ypmed.2022.107208
28. Mayo Clinic. Caffeine content for tea, soda, and more. Mayo Clinic; 2022. Available from: https://www.mayoclinic.org/healthy-lifestyle/nutrition-and-healthy-eating/in-depth/caffeine/art-20049372.
29. Eaton DK, Kann L, Kinchen S, et al. Youth risk behavior surveillance--United States, 2007. MMWR Surveill Summ. 2008;57(4):1–131.
30. Brener ND, Kann L, McManus T, Kinchen SA, Sundberg EC, Ross JG. Reliability of the 1999 Youth Risk Behavior Survey Questionnaire. J Adolescent Health. 2002;31(4):336–342. doi:10.1016/S1054-139X(02)00339-7
31. Rahn R. A Comprehensive Critique of the American College Health Association’s National College Health Assessment Survey Instrument. Texas A&M University; 2014.
32. Mallampalli MP, Carter CL. Exploring sex and gender differences in sleep health: a Society for Women’s Health Research Report. J Womens Health. 2014;23(7):553–562. doi:10.1089/jwh.2014.4816
33. Burgard SA, Ailshire JA. Gender and Time for Sleep among U.S. Adults. Am Sociol Rev. 2013;78(1):51–69. doi:10.1177/0003122412472048
34. Natal CL, Lourenco TJ, Silva LA, et al. Gender differences in the sleep habits of 11-13 year olds. Braz J Psychiatry. 2009;31(4):358–361. doi:10.1590/s1516-44462009000400013
35. Tsai LL, Li SP. Sleep patterns in college students: gender and grade differences. J Psychosom Res. 2004;56(2):231–237. doi:10.1016/S0022-3999(03)00507-5
36. Oginska H, Pokorski J. Fatigue and mood correlates of sleep length in three age-social groups: school children, students, and employees. Chronobiol Int. 2006;23(6):1317–1328. doi:10.1080/07420520601089349
37. Wuertz C, Chia Y, Lee J. Relationship of Body Mass Index and Activity Level with Sleep Quality Among College Women. Georgia State Honors College Undergraduate Res J. 2012;1(1):56.
38. Sweileh WM, Ali I, Sawalha AF, Abu-Tah AS, Zyoud S, Al-Jabi SW. Gender differences in sleep habits and sleep-related problems in Arab Palestinian university students. Int J Disability Human Dev. 2012;11(3):289–293. doi:10.1515/ijdhd-2012-0041
39. Carnethon MR, De Chavez PJ, Zee PC, et al. Disparities in sleep characteristics by race/ethnicity in a population-based sample: Chicago Area Sleep Study. Sleep Med. 2016;18:50–55. doi:10.1016/j.sleep.2015.07.005
40. Ruiter ME, Decoster J, Jacobs L, Lichstein KL. Normal sleep in African-Americans and Caucasian-Americans: a meta-analysis. Sleep Med. 2011;12(3):209–214. doi:10.1016/j.sleep.2010.12.010
41. National Institute of Health. How Much Sleep is Enough? Sleep Deprivation and Deficiency. Available from: https://www.nhlbi.nih.gov/health/health-topics/topics/sdd/howmuch.
42. Lund HG, Reider BD, Whiting AB, Prichard JR. Sleep patterns and predictors of disturbed sleep in a large population of college students. J Adolesc Health. 2010;46(2):124–132. doi:10.1016/j.jadohealth.2009.06.016
43. Fatima Y, Doi SA, Najman JM, Mamun AA. Exploring Gender Difference in Sleep Quality of Young Adults: findings from a Large Population Study. Clin Med Res. 2016;14(3–4):138–144. doi:10.3121/cmr.2016.1338
44. Franckle RL, Falbe J, Gortmaker S, et al. Insufficient sleep among elementary and middle school students is linked with elevated soda consumption and other unhealthy dietary behaviors. Prev Med. 2015;74:36–41. doi:10.1016/j.ypmed.2015.02.007
45. Kjeldsen JS, Hjorth MF, Andersen R, et al. Short sleep duration and large variability in sleep duration are independently associated with dietary risk factors for obesity in Danish school children. Int J Obes. 2014;38(1):32–39. doi:10.1038/ijo.2013.147
46. Tatone-Tokuda F, Dubois L, Ramsay T, et al. Sex differences in the association between sleep duration, diet and body mass index: a birth cohort study. J Sleep Res. 2012;21(4):448–460. doi:10.1111/j.1365-2869.2011.00989.x
47. Prather AA, Leung CW, Adler NE, Ritchie L, Laraia B, Epel ES. Short and sweet: associations between self-reported sleep duration and sugar-sweetened beverage consumption among adults in the United States. Sleep Health. 2016;2(4):272–276. doi:10.1016/j.sleh.2016.09.007
48. Ebbeling CB, Feldman HA, Chomitz VR, et al. A Randomized Trial of Sugar-Sweetened Beverages and Adolescent Body Weight. N Eng J Med. 2012;367(15):1407–1416. doi:10.1056/NEJMoa1203388
49. Malik VS, Pan A, Willett WC, Hu FB. Sugar-sweetened beverages and weight gain in children and adults: a systematic review and meta-analysis. Am J Clin Nutr. 2013;98(4):1084–1102. doi:10.3945/ajcn.113.058362
 © 2023 The Author(s). This work is published and licensed by Dove Medical Press Limited. The
full terms of this license are available at https://www.dovepress.com/terms
and incorporate the Creative Commons Attribution
- Non Commercial (unported, 3.0) License.
By accessing the work you hereby accept the Terms. Non-commercial uses of the work are permitted
without any further permission from Dove Medical Press Limited, provided the work is properly
attributed. For permission for commercial use of this work, please see paragraphs 4.2 and 5 of our Terms.
© 2023 The Author(s). This work is published and licensed by Dove Medical Press Limited. The
full terms of this license are available at https://www.dovepress.com/terms
and incorporate the Creative Commons Attribution
- Non Commercial (unported, 3.0) License.
By accessing the work you hereby accept the Terms. Non-commercial uses of the work are permitted
without any further permission from Dove Medical Press Limited, provided the work is properly
attributed. For permission for commercial use of this work, please see paragraphs 4.2 and 5 of our Terms.
Recommended articles
Prevalence of Dry Eye Disease Among Medical Students and Its Association with Sleep Habits, Use of Electronic Devices and Caffeine Consumption: A Cross-Sectional Questionnaire
Abu-Ismail L, Abuawwad MT, Taha MJ, Khamees A, Abu Ismail DY, Sanwar M, Al-Bustanji Y, Nashwan A, Alameri OH, Alrawashdeh HM, Abu Serhan H, Abu-Ismail J
Clinical Ophthalmology 2023, 17:1013-1023
Published Date: 3 April 2023
Sleep Quality and Sleep Hygiene Behaviours Among University Students in Qatar
Ali RM, Zolezzi M, Awaisu A, Eltorki Y
International Journal of General Medicine 2023, 16:2427-2439
Published Date: 13 June 2023