Back to Journals » Nature and Science of Sleep » Volume 14
Stress Susceptibility Moderates the Relationship Between Eveningness Preference and Poor Sleep Quality in Non-Acute Mood Disorder Patients and Healthy Controls
Authors Chen CH, Huang MC, Chiu YH, Chen IM ![]() , Chen CH, Lu ML
, Chen CH, Lu ML ![]() , Wang TY, Chen HC
, Wang TY, Chen HC ![]() , Kuo PH
, Kuo PH ![]()
Received 17 September 2021
Accepted for publication 8 April 2022
Published 15 April 2022 Volume 2022:14 Pages 711—723
DOI https://doi.org/10.2147/NSS.S339898
Checked for plagiarism Yes
Review by Single anonymous peer review
Peer reviewer comments 3
Editor who approved publication: Dr Sarah L Appleton
Chun-Hao Chen,1 Ming-Chyi Huang,2 Yi-Hang Chiu,3 I-Ming Chen,1,4 Chun-Hsin Chen,3,5 Mong-Liang Lu,3,5 Tsung-Yang Wang,1 Hsi-Chung Chen,1,6 Po-Hsiu Kuo1,7
1Department of Psychiatry, National Taiwan University Hospital, Taipei, Taiwan; 2Department of Psychiatry, Taipei City Hospital, Songde Branch, Taipei, Taiwan; 3Department of Psychiatry, Wan-Fang Hospital, Taipei, Taiwan; 4Institute of Health Policy and Management, National Taiwan University, Taipei, Taiwan; 5Department of Psychiatry, School of Medicine, College of Medicine, Taipei Medical University, Taipei, Taiwan; 6Center of Sleep Disorders, National Taiwan University Hospital, Taipei, Taiwan; 7Graduate Institute of Epidemiology and Preventive Medicine, College of Public Health, National Taiwan University, Taipei, Taiwan
Correspondence: Hsi-Chung Chen, Department of Psychiatry, National Taiwan University Hospital, No. 7 Chung San South Road, Taipei, 10002, Taiwan, Tel +886-2-2312-3456 ext. 66787, Fax +886-2-2381-3208, Email [email protected]
Objective: This study aimed to investigate the relationship between eveningness preference and poor sleep quality and eventually examine the moderation effect of stress susceptibility.
Methods: Individuals with non-acute major depressive disorder or bipolar affective disorder and healthy participants were recruited. The Composite Scale of Morningness (CSM) and the Pittsburgh Sleep Quality Index (PSQI) were used to evaluate chronotype and sleep quality, respectively. Eysenck Personality Questionnaire, Tridimensional Personality Questionnaire, Perceived Stress Scale, and Beck Anxiety Inventory were used to formulate stress susceptibility and as indicator variables for empirical clustering by latent class analysis (LCA). Linear regression models were used to examine the relationship between chronotype preference and sleep quality. The interaction terms of CSM and stress susceptibility were examined for the moderation effect.
Results: A total of 887 individuals were enrolled in this study, with 68.2% female and 44.1% healthy participants. Three subgroups were derived from LCA and designated as low stresssusceptibility (40.2%), moderate stress susceptibility (40.9%), and high stress susceptibility (18.8%) groups. After controlling for covariates, the CSM scores inversely correlated with PSQI scores [b (se)=− 0.02 (0.01), p=0.01], suggesting that individuals with eveningness preferences tend to have poor sleep quality. Moreover, stress susceptibility moderated the relationship between CSM and PSQI scores (p for interaction term = 0.04). Specifically, the inverse association between CSM and PSQI was more robust in the high stress susceptibility group than that in the low stress susceptibility group.
Conclusion: Eveningness preference was associated with poor sleep quality, and this relationship was moderated by stress susceptibility.
Keywords: chronotype, empirical clustering, moderation effect, stress susceptibility, sleep quality
Introduction
Approximately one-third of the general population has various forms of sleep-wake related disturbances, such as nocturnal insomnia, daytime sleepiness, and poor sleep quality.1,2 Subjective poor sleep quality has been recognized as one of the most significant sleep-wake related parameters for predicting adverse physical and mental outcomes.3 Thus, in terms of personalized medicine, it is clinically imperative to identify the risk indicators for poor sleep quality and synergic factors that may further exacerbate their adverse impact on poor sleep quality.
Chronotype refers to a spectrum of individuals’ differences in circadian preference and is commonly categorized as morningness, intermediate, and eveningness preference.4 Chronotype preference is known to be associated with sleep quality.5–7 Individuals with eveningness preference are more likely to have poor sleep quality than individuals with morningness preference5 and are more susceptible to mental4–6 and physical morbidities.8 However, the mechanisms that underlie eveningness preference and adverse health outcomes remain unclear. Some individuals with eveningness preference have sleep patterns and social function comparable to those with morningness preference.9 Furthermore, those with the eveningness preference may have better flexibility in re-entraining the circadian rhythm than those with the morningness preference.9 Specifically, evening-type workers were able to adapt themselves to a fixed night shift.10 Besides, evening-type shift workers also had better sleep quality with less impact on night shift than morning-type individuals.11 These unexpected findings may be derived from the heterogeneous sleep characteristics of eveningness preference, residual confounding, and moderation effect existing in the association between chronotype preference and sleep quality. Thus, before delivering specific interventions that mitigate the adverse impact of eveningness preference on sleep, it is vital to re-examine the relationship between chronotype and sleep quality using rigorously specified confounders and identify potential effect moderators.
In the literature, in addition to genetic substrates, stress-related characters and maladaptive coping styles have also been found to be the determinants of chronotype.12 Eveningness preference has been associated with trait anxiety;13 novelty seeking; impulsivity; low persistence; low emotional stability; and low capacity for inhibiting, interrupting, and adapting current behaviors.14 In parallel, these features were also associated with poor sleep quality.15 Thus, the core components of stress reaction could be important candidates that confound or moderate the relationship between chronotype and sleep quality. The development of stress reaction comprises multiplex and interlocked core components.16 According to stress-related theories, stress reaction is a dynamic and transactional process, which includes the individuals’ internal reactions to a situation in terms of physiological arousal, subjective emotional response, cognition and appraisal to stress, and their behavioral reaction.16,17 After interacting with the individuals’ specific personality traits, the encountered stressor leads to perceived stress, ensued by respective stress responses. Eventually, the resultant stress response is heterogeneous among individuals due to numerous combinations of core components embedded in the process of stress reaction,17 namely, different personalities, various perceived stress, and differential stress response. If we could tackle the complexity of the interlocked stress-related core components and disentangle the heterogeneity of stress reaction, we may be able to recognize and target the high-risk group.
However, the heterogeneous phenotype of stress reaction constitutes several gaps that hinder us from examining the independent association between chronotype and sleep quality and further identifying high-risk group that warrants specific interventions. First, it is insufficient to evaluate stress reaction comprehensively with a single instrument. Besides, when we attempt to specify statistical models to partial out the effects of stress reaction that may confound the relationship between chronotype preference and sleep quality, the interrelated features of the core components of stress reaction also raise concerns about statistical collinearity. Third, when examining the moderation effect of stress reaction with heterogeneous profiles, numerous interaction terms have to be examined. In addition to the risk of inflated beta errors, the findings would be difficult to interpret intuitively and are not feasible for identifying high-risk groups. At present, latent class analysis (LCA) provides a solution to disentangle heterogeneity.18 By designating components of the process of stress reaction as indicator variables, LCA is capable of empirically clustering a heterogeneous group into several subgroups with distinct clinical features. As a result, we are able to control for the effects of all stress-related measurements with a single and categorized, LCA-derived subgroup variable. Moreover, instead of illustrating “variable-centered” relationships that are achieved in traditional regression modeling, LCA provides “person-centered” subgroups that are more feasible in terms of personalized medicine. Consequently, the issues of heterogeneity and collinearity are resolved simultaneously. To the best of our knowledge, there is no such an approach to tackle the gaps mentioned above, by LCA, in the literature.
Thus, this study aimed to examine the independent relationship between chronotype preference and sleep quality in a model that was rigorously controlled for core elements of the process of stress reaction. LCA, with a comprehensive set of stress-related measurement as indicator variables, was used to tackle the heterogeneity of stress reaction. A new categorical variable, stress susceptibility, was conceptualized to reflect the distinct features of LCA-derived subgroups. In this study, the “stress susceptibility” was defined by the core components of stress reaction and by its temporal order, namely personality, perceived stress, and then the stress response. In addition to the confounding effect of stress susceptibility, its moderation effect on the association between chronotype and sleep quality was also examined. We predicted that various chronotype preferences would correlate differentially with poor sleep quality. We further hypothesized that stress susceptibility would moderate the relationship between chronotype preference and sleep quality. Specifically, the relationship between chronotype preference and sleep quality would differ in heterogeneous stress susceptibility subgroups.
Materials and Methods
Participants
The participants of this study were recruited between 2013 and 2018. Among the participants, psychiatric patients with non-acute major depressive disorder or bipolar affective disorder were recruited from two medical centers and a psychiatric hospital in Taiwan. In order to expand the data variation of the stress-related variables, healthy individuals were enrolled from physical examination centers and the community. Participants with non-acute mood disorders were eligible and referred to this study by psychiatrists, using the inclusion criteria of (a) age between 18 and 65 years, (b) diagnosed with major depressive disorder (MDD) or bipolar affective disorder (BAD) according to the Diagnostic and Statistical Manual of Mental Disorders–IV (DSM-IV), and (c) non-acute condition, defined as a score of <17 points on the Hamilton Depression Rating Scale19 and <20 points on the Young Mania Rating Scale.20 The psychiatric diagnoses of the healthy participants were confirmed using the Chinese version of the Schedule for Affective Disorder and Schizophrenia-Lifetime (SADS-L).21 Any individuals with comorbid schizophrenia, organic brain syndrome, intellectual disability, or mood disorder related to substance use were excluded from the present study. Finally, a total of 887 individuals were included. Basic sociodemographic characteristics (sex, age, marital status, education, employment, and income), lifestyles-related variables (body mass index, habit of exercise, and tobacco or alcohol use), history of physical illness, and variables related to mental health were collected by trained investigators by face-to-face interview. All participants provided written informed consent. This study was approved by the Institutional Review Board of the National Taiwan University Hospital (N0. 201212134RINB, 201512086RIND, and 202007094RINA). The study was conducted in accordance with the Helsinki Declaration of 1975, as revised in 2008.
Sleep-Related Measurement
Sleep quality was evaluated using the Pittsburgh Sleep Quality Index (PSQI).22 The PSQI measures the global sleep quality in the past one month by using 19 items that evaluate seven components of sleep quality. The subscores of each component range from 0 to 3, resulting in a maximum global score of 21. The Chinese version of the PSQI has been validated.23 Chronotype preference was assessed using the Composite Scale of Morningness (CSM).24 The Smith et al version of the CSM is a 13-item self-reported composite scale and a total score between 13 and 55, where the lower the score, the stronger the preference for eveningness. The CSM is highly correlated with other measurements of chronotype preference, suggesting that the CSM has a good concurrent validity. The validity and reliability of the Chinese version of the CSM have been established.25 The CSM scores were converted to t-scores in all analyses of this study.
Conceptualization and Measurement of Stress Susceptibility
This study conceptualized stress susceptibility using three core components of stress reaction according to stress-related theories, namely personality, perceived stress, and stress response. We identified four corresponding stress-related measurements for each component of stress reaction. Subsequently, these four measures were used as indicator variables for LCA to yield feature-based subgroups under the context of stress susceptibility.
Personality
Eysenck Personality Questionnaire-revised (EPQ-R) and Tridimensional Personality Questionnaire (TPQ) were used to evaluate the personality of participants. The Chinese versions of both questionnaires have been validated.26,27 The EPQ-R includes E scale (Extraversion), N scale (Neuroticism), and P scale (Psychoticism), with 12 items for each scale, and each dichotomous item was scored 0 or 1, where a higher score indicates a more prominent trait of the personality. The TPQ evaluates three components of personality, including novelty seeking (NS), harm avoidance (HA), and reward dependence (RD). The original scores of E scale and N scale of the EPQ-R and the dimensions of NS and HA of the TPQ were assigned as indicator variables for LCA to inclusively reflect personality traits.
Subjective Perceived Stress
Subjective perceived stress was measured by the Chinese version of the Perceived Stress Scale (PSS), which has been validated.28 The PPS is a self-reported questionnaire that evaluates the degree to which individuals believe their life has been unpredictable, uncontrollable, and overloaded during the past 1 month. The PSS includes 10 items, with each item score ranging from 0 (Never) to 4 (Very often) of each. The original score of the PSS was assigned as indicator variable for LCA.
Stress Response
The Beck Anxiety Inventory (BAI) was used to evaluate the participants’ stress response. The Chinese version of the BAI has been validated.29 The BAI comprises 21 items and the severity levels are defined by the total score of the scale. The original score of BAI was assigned as an indicator variable for LCA to represent stressful response.
Other Variables
In previous studies, individuals tend to have better sleep quality before the age of 30 years and it deteriorates soon after the age of 45 years.30 Therefore, this study categorized the age of the participants into <30, 30–44, and ≥45 years. History of physical illnesses, including cardiovascular, endocrine, metabolic, gastrointestinal, urinary, hematological, infectious, neurological/musculoskeletal, and immune/asthma/allergic diseases, was confirmed by the participants’ self-report. The Chinese version of Beck Depression Inventory-II (BDI-II), whose validity and reliability have been established, was used to assess the severity of depressive symptoms.31
Statistical Analyses
All statistical analyses were performed using SPSS for Windows, version 17.0 (SPSS, Chicago, IL), and LCA was performed using M plus, version 7 (Muthen & Muthen).32 Univariate analyses were conducted using the χ2 test or analysis of variance (ANOVA), and the correlations between continuous variables were examined using Pearson correlation analysis. Multiple linear regression analyses were then performed to examine the independent correlations between chronotype preference and sleep quality. The variables that were simultaneously and significantly correlated with chronotype preference and sleep quality in the univariate analysis were then included into the multiple linear regression analyses along with sex and age as covariates to control for confounding effects. In addition, to investigate the moderation effect of stress susceptibility on the relationship between chronotype preference and sleep quality, the interaction terms of CSM and stress susceptibility (CSM × stress susceptibility) were also specified into the full multiple linear regression model that examined the relationship between chronotype preference and sleep quality. A p-value <0.05 was considered statistically significant.
In the present study, LCA was performed for empirical subgrouping of the participants based on stress susceptibility. The E scale and N scale of the EPQ-R, the HA and the NS of the TPQ, the PSS, and the BAI were used as indicator variables for LCA. We used five fitness indices to determine the optimal number of subgroups. A small Akaike’s information criterion (AIC)33 or sample-size adjusted Bayesian’s information criterion (sBIC) indicates superior model fit. A value close to 1 in Entropy indicates a clear classification. Lo–Mendell–Rubin adjusted likelihood ratio test and parametric bootstrapped likelihood ratio test were performed to compare fitness between adjacent classes. A significant p-value of the k class model suggests a superior fit to k-1 class. The profile of indicator variables of the subgroups was illustrated in a radar chart. The scores for all indicator variables were transformed into t-scores in the radar chart.
Results
A total of 887 individuals were included in this study. The sociodemographic characteristics, lifestyle, and clinical data of the participants are summarized in Table 1. Among the participants, 68.2% were female, 43.3% were aged over 45 years old. A total of 28.2% of the participants were diagnosed with MDD (n = 250), 27.7%, with BAD (n = 246), and 44.1% were healthy (n = 391). The characteristics of each diagnostic group are detailed in Table S1 (see Supplementary Table S1).
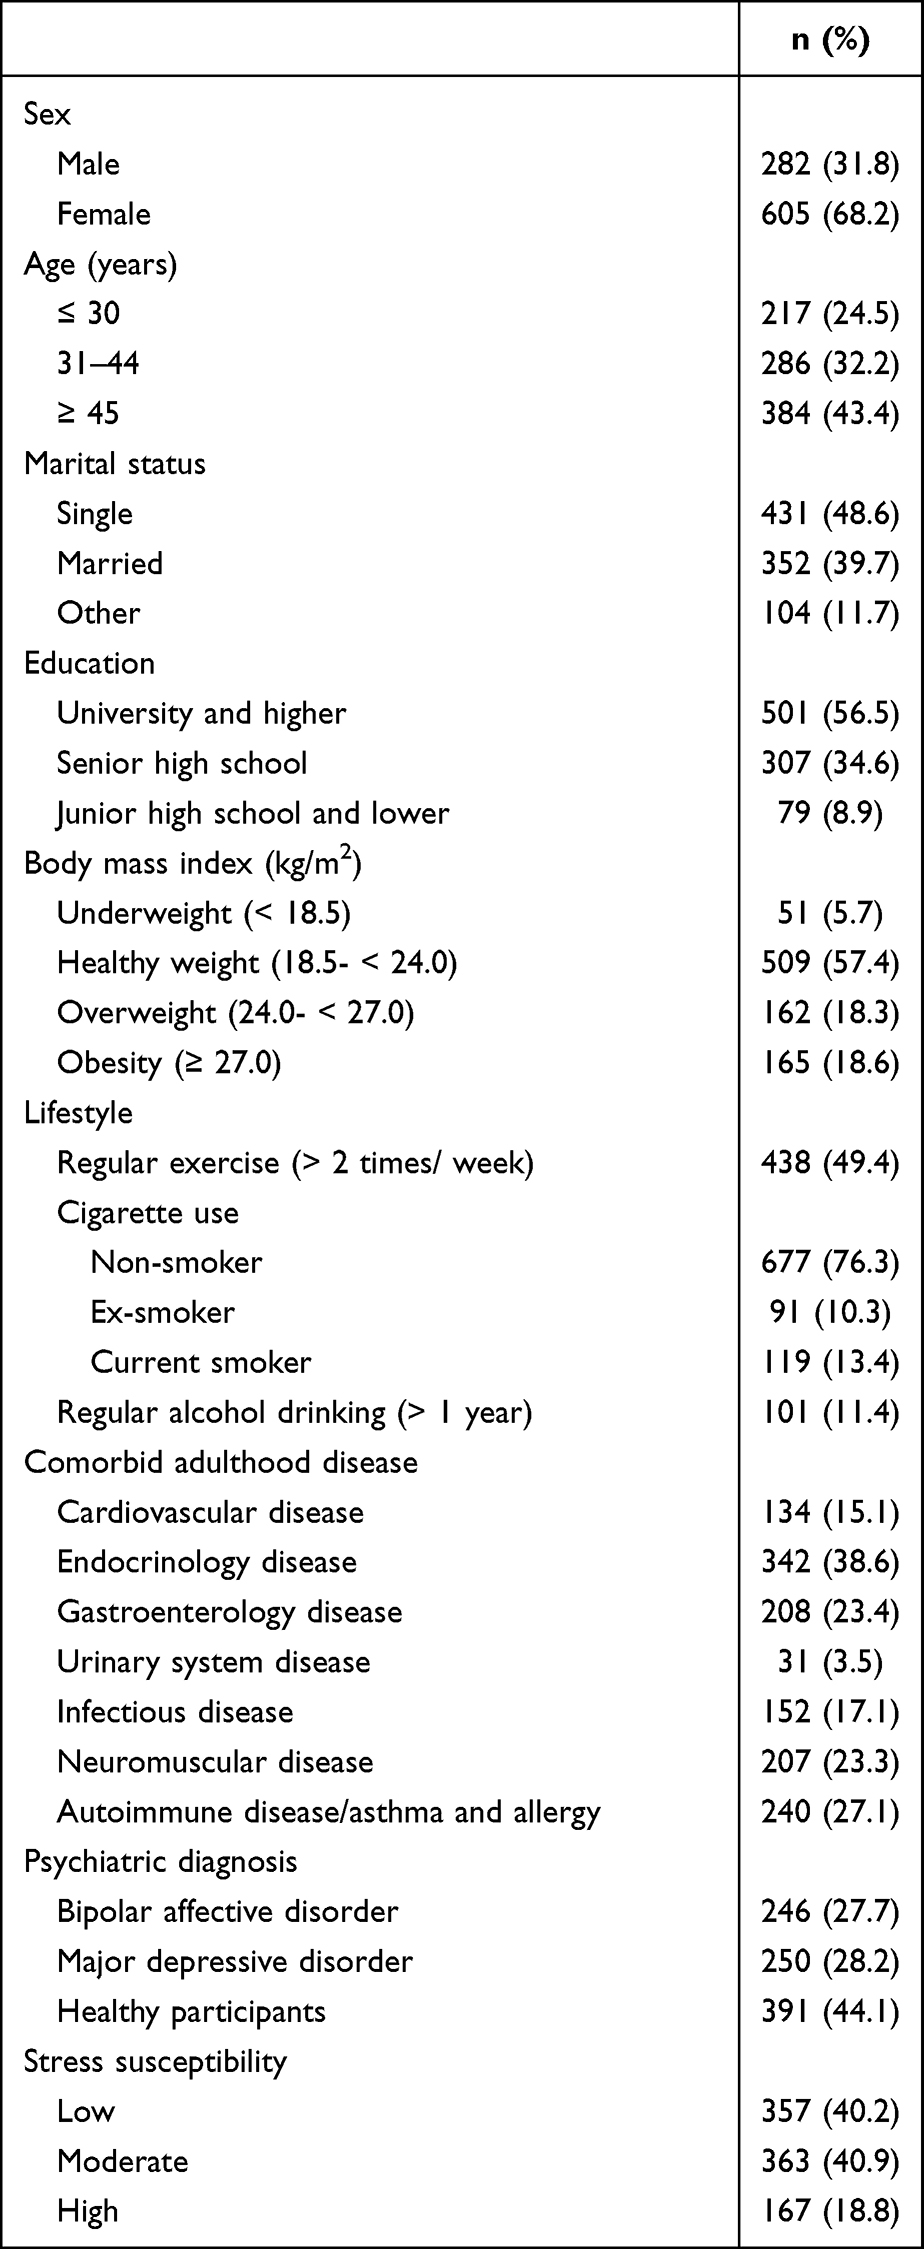 |
Table 1 Sociodemographic and Clinical Characteristics of Participants (n = 887) |
Table 2 illustrates the five fitness indices used in the LCA model. The results of AIC and sBIC suggest that many clusters have good model fitness. However, a large number of classes compromised the clinical interpretability and applicability. When further considering entropy, a two-class or three-class model would be favorable. According to the Lo–Mendell–Rubin adjusted likelihood ratio test and parametric bootstrapped likelihood ratio test, the three-class model was superior to two-class model. Therefore, on the premise of interpretability and clinical utility, the three-class model was selected as the most optimal model. The three classes were designated according to their patterns of score distribution over the four indicator variables, including low stress susceptibility (LSS, n = 357, 40.2%), moderate stress susceptibility (MSS, n = 363, 40.9%), and high stress susceptibility (HSS, n = 167, 18.8%) (Table 1). The scoring pattern of four indicator variables in these three subgroups was profiled, as shown in the Supplementary Figure S1. The between-group comparisons of various characteristics and indicator variables among empirically derived subgroups of stress susceptibility are presented in Tables S1 and S2, respectively (see Supplementary Tables S1 and S2).
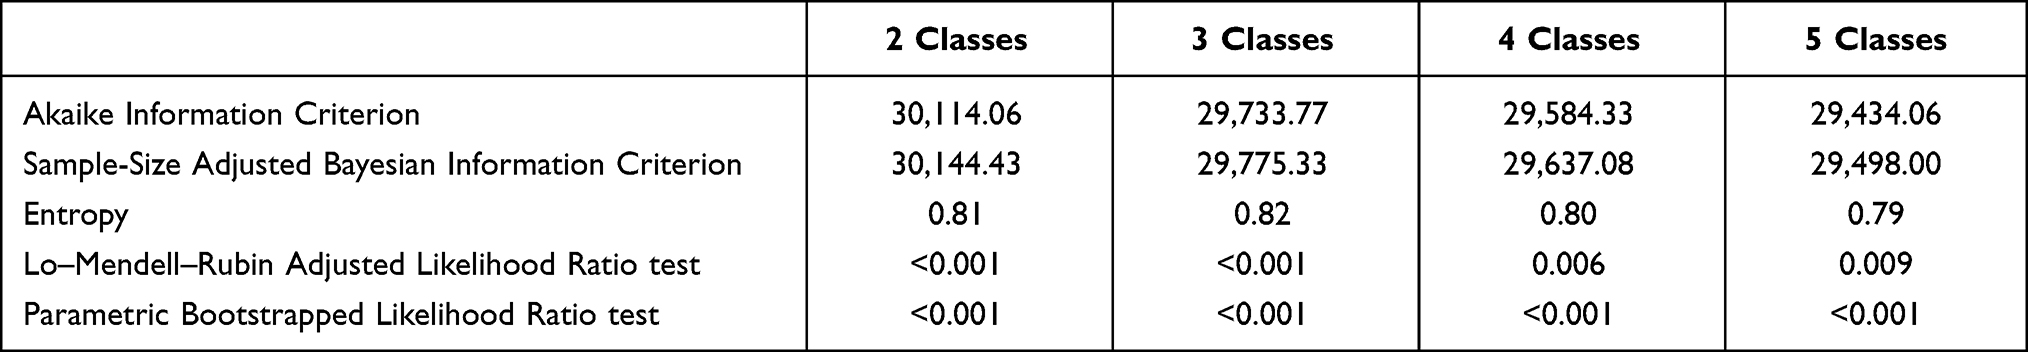 |
Table 2 Model Fitting Results for Two to Five Class Solutions in the Latent Class Analysis (n = 887) |
Table S3 summarizes the univariate analysis results for the associations between categorical variables and PSQI and CSM scores. The PSQI and CSM scores did not differ in terms of sociodemographic characteristics, lifestyle, and physical comorbidities. Psychiatric diagnosis was significantly correlated with PSQI and CSM scores (all ps < 0.001). Patients with non-acute MDD had the worst sleep quality (9.34 ± 3.86) while healthy individuals had the best (6.21 ± 2.39). Patients with non-acute MDD had the highest eveningness preference (44.47 ± 13.20), while healthy individuals had the lowest (50.06 ± 10.02). Similarly, the PSQI and CSM scores were significantly different in the three subgroups of stress susceptibility (all ps<0.001). The HSS group had the worst sleep quality (9.94 ± 3.77); while the LSS group had the best (6.21 ± 2.73). The HSS group had the highest preference for eveningness (40.07 ± 12.62); while the LSS group had the lowest (51.16 ± 10.49) (see Supplementary Table S3).
Table 3 presents the correlation analyses between PSQI, CSM, and BDI-II scores and the indicator variables for LCA. The result showed significant inverse correlations between CSM and PSQI (r=−0.22, p<0.01) and between CSM and BDI-II (r=−0.24, p<0.01). Besides, there was a significant correlation between BDI-II and PSQI (r=0.50, p<0.01). Most of the indicator variables for LCA significantly correlated with PSQI and CSM, except for those between novelty seeking and PSQI, as well as extraversion and CSM. Most of the indicator variables were significantly correlated with each other, with the correlation coefficients ranging from 0.08 to 0.66, except a non-significant correlation was noted between novelty seeking and BAI.
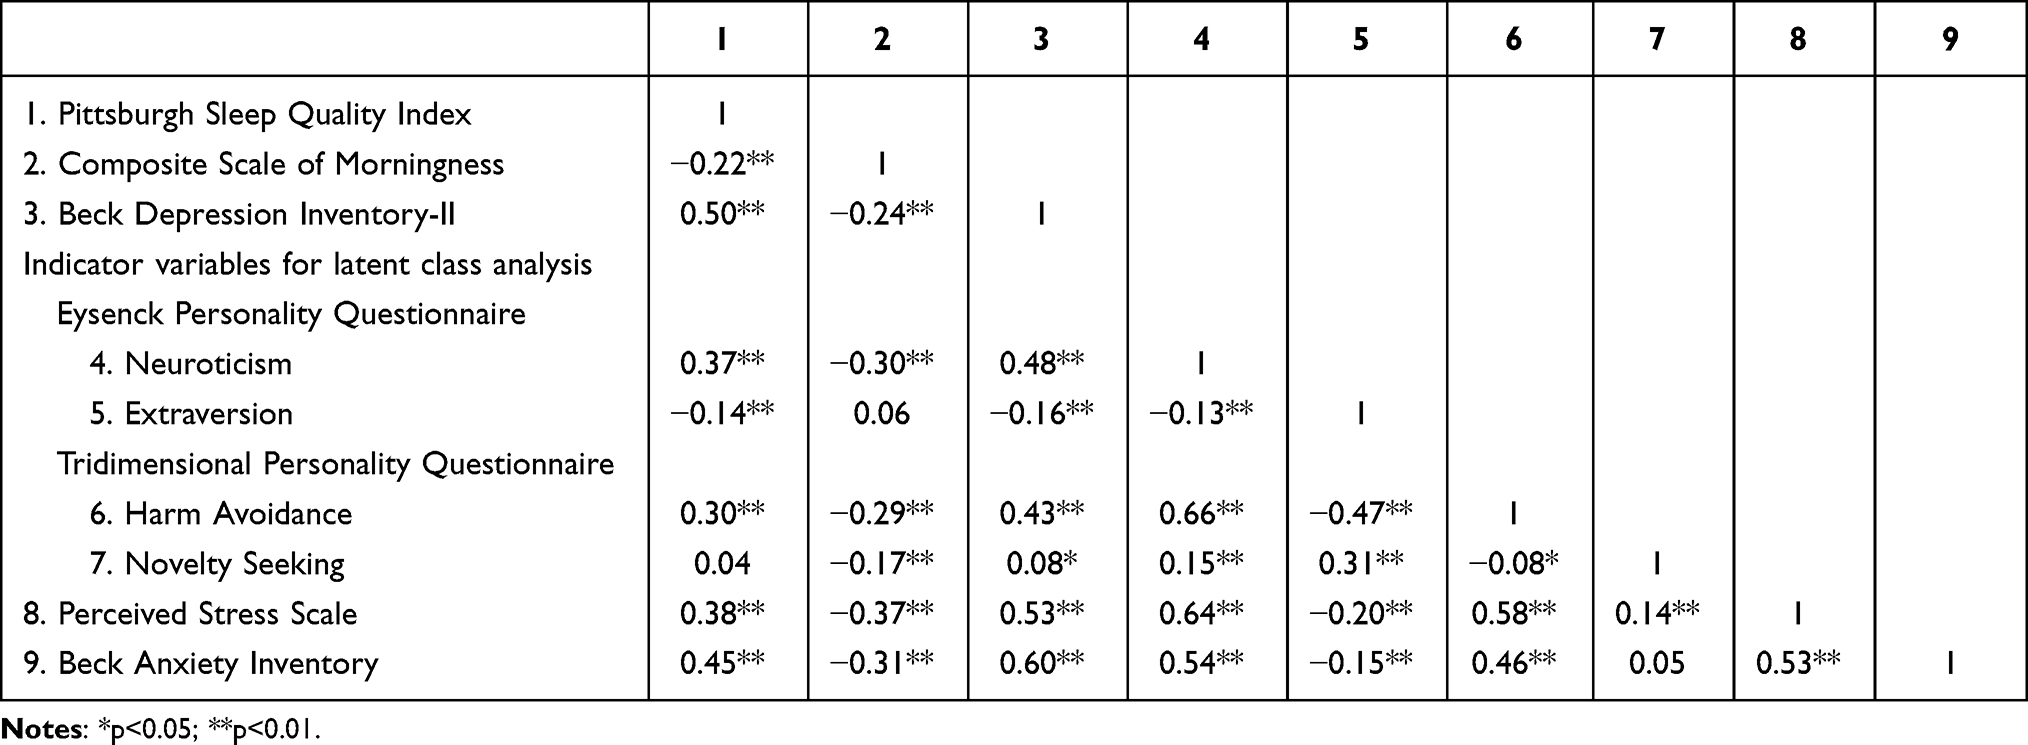 |
Table 3 Correlation Matrix Between Pittsburgh Sleep Quality Index, Composite Scale of Morningness, Beck Depression Inventory-II, and Indicator Variables for Latent Class Analysis |
Based on univariate analysis, BDI-II scores, psychiatric diagnosis, and stress susceptibility were simultaneously correlated with CSM and PSQI. Thus, along with age and sex, they were added to the multiple linear regression analyses as covariates to examine the independent relationship between chronotype and sleep quality (Table 4). After controlling for the confounding effects, the CSM scores remained inversely correlated with PSQI scores [b (se)=−0.02 (0.01), p=0.01]. With regard to the relationship between stress susceptibility and sleep quality, the MSS group achieved higher PSQI scores than the LSS group [b(se)=0.53 (0.24), p=0.03]. However, the PSQI scores did not differ between the HSS and LSS groups [b (se)=0.53 (0.36), p=0.14]. To inspect the relationship among stress susceptibility, CSM, and PSQI, we further excluded CSM from the full model and examined the changes in the relationship between stress susceptibility and PSQI (see Supplementary Table S4). In the reduced model, both the HSS [b (se)=0.73 (0.35), p=0.04] and the MSS groups [b (se)=0.59 (0.24), p=0.01] achieved higher PSQI scores than the LSS group. This finding suggests that the effect of stress susceptibility on sleep quality in the HSS group may be mediated by eveningness preference, which also explained the non-significant difference of the PSQI between the HSS and LSS groups in the full model.
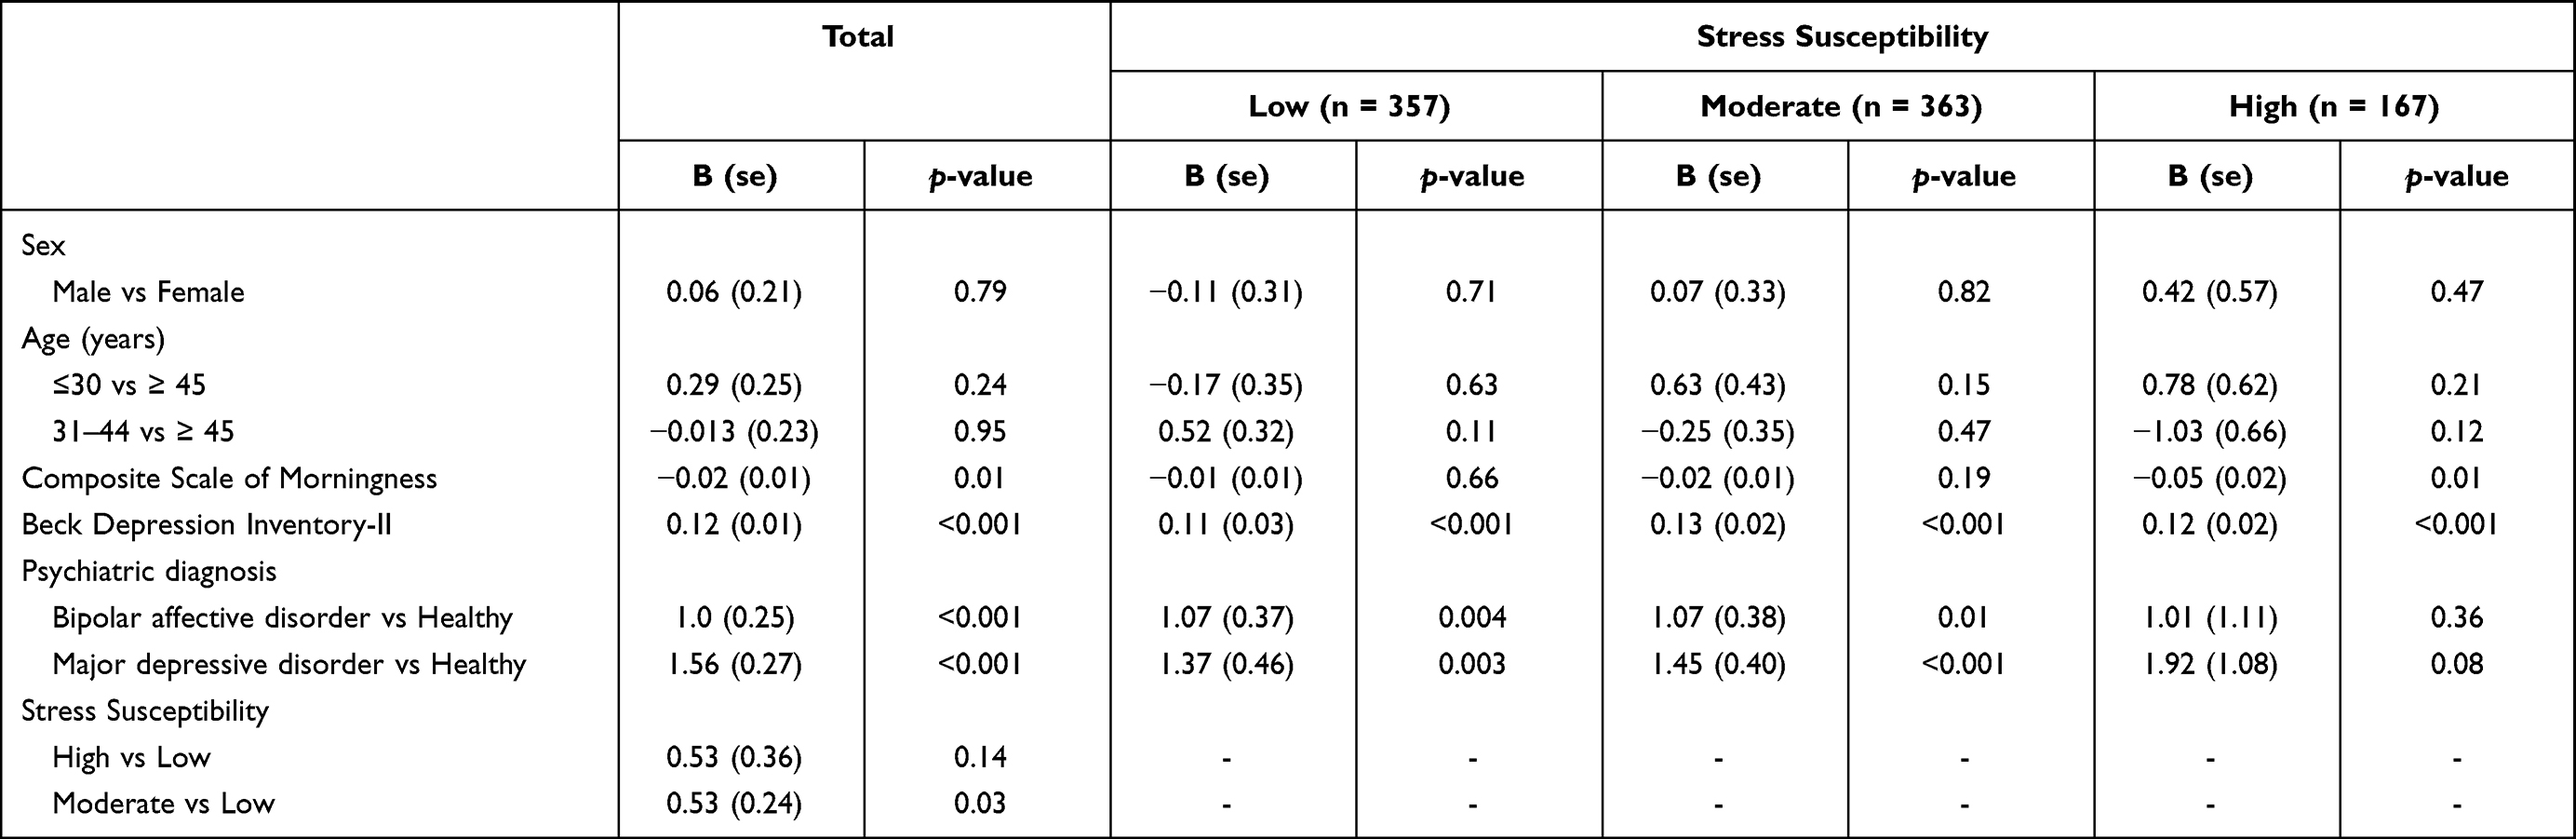 |
Table 4 Multiple Linear Regression Analyses for Factors Associated with Pittsburgh Sleep Quality Index Stratified by Stress Susceptibility (n = 887) |
Finally, the moderation effect of stress susceptibility on the relationship between CSM and PSQI was examined by adding the interaction terms into the original full multiple linear models. When treating the LSS group as the referent, the interaction was significant for [(HSS vs LSS) × CSM] [b (se)=−0.05 (0.02), p=0.04], but not for [(MSS vs LSS) × CSM] (p=0.45). In contrast, when specifying the MSS group as a referent, no interaction term turned out to be significant. This finding suggests that the magnitude of inverse correlation between CSM and PSQI in the HSS [b (se)=−0.05 (0.02), p=0.01] group was significantly greater than that in the LSS group [b(se)=−0.01 (0.01), p=0.66] (Table 4).
Discussion
By involving diagnosed and healthy participants, conceptualizing stress susceptibility, and tackling its heterogeneity, the present study examined the independent association between chronotype preference and sleep quality. Furthermore, the influence of clustered stress susceptibility exerted on the abovementioned relationship was also investigated. We found that a strong preference for eveningness was associated with poor sleep quality, and this relationship was moderated by stress susceptibility. Specifically, the effect size of the relationship between eveningness preference and poor sleep quality was greater in the HSS group than in the LSS group. As a result, these findings were consistent with our hypotheses.
Although the relationship between stress, chronotype, and sleep quality had been investigated in the literature, the participants in previous studies were mostly recruited from communities or were diagnosed with acute mood disorders. In contrast, the participants in the present study had non-acute mood disorders or were healthy; thus, we not only echoed previous findings but also expanded the generalizability. In addition, LCA was applied to disentangle the heterogeneity of numerous stress-related measurements and issues of statistical collinearity. These features make this study stand out.
The Relationship Between Eveningness Preference and Poor Sleep Quality
An inverse association between scores of CSM and PSQI was found in this study, indicating that a strong preference for eveningness is likely to result in poor sleep quality. This main finding is consistent with those of previous studies.5,6 Because the participants of this study differed from those in the previous research that mostly focused on shift workers, students, and patients with acute mood disorders,6 the clinical utility of this study can be generalized. In addition, even after important confounders were rigorously controlled for, such as stress susceptibility and depression, the association between chronotype and sleep quality remained, suggesting the robustness of this main finding.
Despite our findings, the mechanisms underlying the relationship between eveningness preference and poor sleep quality remain unclear. In this study, sleep quality was defined using PSQI scores, which contains several components of sleep quality. In addition to subjective sleep quality, the PSQI also evaluates other sleep-wake related components, such as sleep onset latency, sleep duration, hypnotics use, and daytime dysfunction.22 The impairment of each component could be attributed to the behavioral outcomes that are secondary to eveningness preference. For instance, evening-type people may intentionally advance bedtime to accommodate themselves to social rhythm, resulting in difficult sleep initiation and the use of hypnotics. Individuals with evening chronotype may stay up late working or studying and then experience circadian misalignment, which leads to sleep insufficiency, social jetlag and consequently daytime sleepiness or emotional dysregulation.9 Moreover, eveningness preference is related to night eating, which may also further delay bedtime and impair subjective sleep quality.34 Although all of these behavior-related sleep-wake problems could be speculated to mediate the relationship between increased eveningness preference and high PSQI scores, the genuine mechanism needs further investigation.
Stress Susceptibility Moderates the Relationship Between Eveningness Preference and Poor Sleep Quality
Our results revealed that the relationship between eveningness preference and poor sleep quality was stronger in the HSS group than in the LSS group. The potential underlying mechanism for this moderating role of stress susceptibility is noteworthy. In fact, some individuals with eveningness preference may be self-afflicted bedtime procrastinators. Bedtime procrastinators are known to also engage in general procrastination of other activities, tend to have low levels of self-control and self-efficacy, and are likely to have eveningness preference and poor sleep quality.35 Bedtime procrastinators tend to relieve stress by delaying bedtime intentionally and using maladaptive coping behaviors, such as spending more time on leisure activities and eating before bedtime.36 Thus, bedtime procrastination could be regarded as a maladaptive behavioral response to stress reaction.36 As a result, the moderation effect of stress susceptibility may come from the maladaptive stress-coping style in the HSS group, such as bedtime procrastination. This kind of pre-sleep behavior may cause an epiphenomenon of eveningness preference and directly lead to poor sleep quality. In the sub-analysis, we found that eveningness preference may mediate the difference in sleep quality between the HSS and the LSS group. This finding further lends support to our argument about eveningness preference as a kind of maladaptive behavioral response to stress. However, bedtime procrastination was not measured in this study and our argument needs to be examined in future studies.
The Strategy to Define Stress Susceptibility
Because stress reaction involves a wide range of elements, a generally acceptable definition or a single measurement for stress reaction is still lacking. Among the currently available measurement instruments, some comprise constructs that involve parts of the stress reaction, such as the State-Trait Anxiety Inventory (STAI).37 However, in the STAI, situational anxiety items are used to assess the current anxiety state, but the timeframe is short. Meanwhile, the trait anxiety items of the STAI include a few assessments for characteristics but are not comprehensive. Accordingly, we conceptualized a novel categorical variable, ie, stress susceptibility, to represent the complex process of stress reaction. According to the stress theories, the stress-related measurements were classified a priori, corresponding to three consecutive elements: personality, perceived stress, and stress response in this study.38 The interrelated pattern between these stress-related measurements revealed in this study also illustrated how elements of stress reaction interacted with each other. As a result, we conducted LCA to utilize information from several theory-based and stress-related measurements and to derive subgroups that represent heterogeneous stress susceptibility. In this study, LCA assisted in disentangling and categorizing a complex and interrelated group of variables, thus allowing us to investigate the role of stress susceptibility in the relationship between eveningness preference and poor sleep quality. Although this is the first attempt, to the best of our knowledge, in the literature, this approach also raised concerns regarding the justification for indicator variables that defined stress susceptibility.
In this study, compared with neuroticism and harm avoidance, the inclusion of extraversion and novelty seeking as indicator variables that defined stress susceptibility warrants further discussion. “Activity”, one facet of the Regulatory Theory of Temperament (RTT),39 had been found to negatively correlate with eveningness preference.40 Although they may not be directly comparable, activity in the RTT correlated with extraversion in the Five-Factor Model of Personality (FFM)41 and novelty seeking in the Psychobiological Model of Personality (PMP).42 In this study, extraversion had a very low agreement with neuroticism (r=−0.13), and either the novelty seeking with the harm avoidance (r=−0.08). This finding simply reflected the original conceptual framework of FFM43 and PMP.44 Furthermore, the extraversion with scores of PSQI (r=−0.14) and novelty seeking with scores of CSM (r=−0.17) were significantly inversely correlated. These evidences theoretically and empirically suggested extraversion and novelty seeking, apart from neuroticism and harm avoidance, may also confound the relationship between chronotype preferences and sleep quality. Furthermore, various dimensions of personality traits, such as neuroticism and conscientiousness from the FFM;45 briskness and emotional reactivity in the RTT40 have been found to amplify or mitigate the magnitude of association between eveningness and depressive mood. These studies suggested that independent dimensions of various personality theories may exert opposite impact on the association between chronotype preference and adverse mental conditions. Specifically, contrary to neuroticism, extraversion was associated with active, social, and optimistic ways of dealing with stressful situations and was a predictor of active coping styles.46 Meanwhile, dissimilar to harm avoidance, novelty seeking was associated with creativity47 and permitted individuals to have the cognitive flexibility to modify their behaviors.48 Accordingly, we justified including extraversion and novelty seeking as indicator variables for stress susceptibility and examined its confounding and moderation effect in this study. Notably, although stress susceptibility in this study was operationalized by various indicator variables, it may still be in line with other established substantive higher-order factors such as the general factor of personality.49 The general factor of personality indicates social effectiveness, which shares similar concept with emotional intelligence, ideal employee factor, and impression management.50
Clinical Implications
Poor sleep quality is not only related to adverse physical and mental outcomes but also increased recurrent risk of remitted mood disorders.51 In this study, even when controlling for diagnoses of mood disorders, depressive symptoms, and anxiety symptoms (embedded in the construct of stress susceptibility), the association between evening preference and poor sleep quality remained robust. This finding implicates that not only in healthy people but also in those with non-acute status of mood disorders, the chronotype is still an independent risk indicator for poor sleep quality, regardless of residual depressive and anxiety symptoms. Thus, by identifying and returning unfavorable chronotypes, we could improve sleep quality and consequently promote health. Besides, high stress susceptibility may not compromise sleep quality by itself, but could synergize the adverse impact of unfavorable chronotype preference on sleep quality. Therefore, people with high stress susceptibility are the ultra high-risk group and may be benefited to a large extent from further detecting and modifying their maladaptive sleep-preventing behaviors. These non-pharmacological interventions could be integrated into programs of stress management for healthy people and non-acute patients with mood disorders as primary prevention and secondary prevention strategies.
Limitations
This study is subject to several limitations. First, this is a cross-sectional study, and determining the causal inference was not possible. Second, the results of this study may be biased by residual confounders, such as the use of psychotropics and primary sleep disorders. However, due to the possible bidirectional relationships between poor sleep quality with stress-related measurements and depressive symptoms,52 adding stress susceptibility and BDI-II to the statistical models may raise concerns of over-adjustment. However, even if this is the case, the result is likely to be biased toward the null. Third, the definition of stress susceptibility used in this study lacked consensus. Assigning different sets of indicator variables might yield different feature-based clusters; hence, the existence of the moderation effect may be questionable. Fourth, compared with the total sample, the number of participants in each subgroup was less in the stratified analysis due to stress susceptibility, which may compromise the statistical power to illustrate a significant within-group association between eveningness type and poor sleep quality. However, the examination of moderation effect in this study has illustrated the existence of between-group difference of effect sizes (HSS vs LSS) regarding the association between CSM and PSQI. Thus, from a statistical perspective, if given a large enough sample size in each subgroup, the non-significant effects within- or between-group would eventually turn significant, our main finding that indicates the between-group difference of effect remains valid. Finally, the present study adopted self-report psychometric instruments to evaluate chronotype and sleep quality. It is uncertain whether the relationship between chronotype and sleep quality remains the same if objective measurements are used. For example, measuring dim-light melatonin onset to anchor the inner biological rhythm and using polysomnography or actigraphy to collect sleep-wake parameters.
Conclusions
Our findings have community-level and clinical-level practicability because they can be applied to both the health promotion program for general population and relapse prevention programs for people with mood disorders. In the future, longitudinal studies are needed to elucidate the temporal relationship between chronotype and sleep quality. Meanwhile, randomized control trial is necessary to examine the effect of specific interventions.
Abbreviations
AIC, Akaike’s information criterion; ANOVA, analysis of variance; BAI, Beck Anxiety Inventory; BAD, bipolar affective disorder; BDI-II, Beck Depression Inventory-II; CSM, Composite Scale of Morningness; DSM-IV, the Statistical Manual of Mental Disorders–IV; EPQ-R, Eysenck Personality Questionnaire-revised; E scale, extraversion scale; FFM, five-factor model of personality; HA, harm avoidance; HSS, high stress susceptibility; LCA, latent class analysis; LSS, low stress susceptibility; MDD, major depressive disorder; MSS, moderate stress susceptibility; NA, novelty seeking; N scale, neuroticism scale; PMP, psychobiological model of personality; PSQI, Pittsburgh sleep quality index; P scale, psychoticism scale; PSS, perceived stress scale; RD, reward dependence; RTT, the Regulatory theory of temperament; SADL-S, the Schedule for Affective Disorder and Schizophrenia-Lifetime; sBIC, sample-size adjusted Bayesian’s information criterion; STAI, state-trait anxiety inventory; TPQ, Tridimensional Personality Questionnaire.
Data Sharing Statement
All data and materials related to the study can be obtained by contacting the corresponding author.
Acknowledgment
The authors acknowledge statistical assistance provided by the Center of Statistical Consultation and Research in the Department of Medical Research, National Taiwan University Hospital.
Author Contributions
All authors made a significant contribution to the work reported, whether that is in the conception, study design, execution, acquisition of data, analysis and interpretation, or in all these areas; took part in drafting, revising or critically reviewing the article; gave final approval of the version to be published; have agreed on the journal to which the article has been submitted; and agree to be accountable for all aspects of the work.
Funding
This study was supported by Taiwan Ministry of Science and Technology (MOST) grants (105-2628-B-002-028-MY3, 108-2314-B-002-136-MY3, and 110-2314-B-002-096-MY3), a grant from the National Health Research Institute (NHRI-EX108-10627NI), and a grant from the National Taiwan University Hospital (UN110-021). The sponsors had no role in any of the stages from study design to submission of the paper for publication.
Disclosure
The authors report no financial or non-financial conflicts of interest in this work.
References
1. LeBlanc M, Mérette C, Savard J, Ivers H, Baillargeon L, Morin CM. Incidence and risk factors of insomnia in a population-based sample. Sleep. 2009;32(8):1027–1037. doi:10.1093/sleep/32.8.1027
2. Grandner MA. Epidemiology of insufficient sleep and poor sleep quality. In: Grandner MA, editor. Sleep and Health. 1. United States: Academic Press; 2019:11–20.
3. Chien MY, Chen HC. Poor sleep quality is independently associated with physical disability in older adults. J Clin Sleep Med. 2015;11(3):225–232. doi:10.5664/jcsm.4532
4. Cox RC, Olatunji BO. Differential associations between chronotype, anxiety, and negative affect: a structural equation modeling approach. J Affect Disord. 2019;257:321–330. doi:10.1016/j.jad.2019.07.012
5. Selvi Y, Aydin A, Boysan M, Atli A, Agargun MY, Besiroglu L. Associations between chronotype, sleep quality, suicidality, and depressive symptoms in patients with major depression and healthy controls. Chronobiol Int. 2010;27(9–10):1813–1828. doi:10.3109/07420528.2010.516380
6. Selvi Y, Boysan M, Kandeger A, et al. Heterogeneity of sleep quality in relation to circadian preferences and depressive symptomatology among major depressive patients. J Affect Disord. 2018;235:242–249. doi:10.1016/j.jad.2018.02.018
7. Chen SY, Chen CH, Lo C, et al. Differential co-occurring patterns between depressive symptomatology and sleep-wake-related disturbances in mood disorders. Nat Sci Sleep. 2021;13:503–514. doi:10.2147/NSS.S301357
8. Almoosawi S, Vingeliene S, Gachon F, et al. Chronotype: implications for epidemiologic studies on chrono-nutrition and cardiometabolic health. Adv Nutr. 2018;10(1):30–42. doi:10.1093/advances/nmy070
9. Tavernier R, Willoughby T. Are all evening-types doomed? Latent class analyses of perceived morningness–eveningness, sleep and psychosocial functioning among emerging adults. Chronobiol Int. 2014;31(2):232–242. doi:10.3109/07420528.2013.843541
10. Juda M, Vetter C, Roenneberg T. Chronotype modulates sleep duration, sleep quality, and social jet lag in shift-workers. J Biol Rhythms. 2013;28(2):141–151. doi:10.1177/0748730412475042
11. Hilliker NA, Muehlbach MJ, Schweitzer PK, Walsh JK. Sleepiness/alertness on a simulated night shift schedule and morningness-eveningness tendency. Sleep. 1992;15(5):430–433. doi:10.1093/sleep/15.5.430
12. Hur YM, Burri A, Spector TD. The genetic and environmental structure of the covariation among the symptoms of insomnia, fatigue, and depression in adult females. Twin Res Hum Genet. 2012;15(6):720–726. doi:10.1017/thg.2012.60
13. Silva VM, Magalhaes JE, Duarte LL. Quality of sleep and anxiety are related to circadian preference in university students. PLoS One. 2020;15(9):e0238514. doi:10.1371/journal.pone.0238514
14. Caci H, Robert P, Boyer P. Novelty seekers and impulsive subjects are low in morningness. Eur Psychiatry. 2004;19(2):79–84. doi:10.1016/j.eurpsy.2003.09.007
15. Stephan Y, Sutin AR, Bayard S, Križan Z, Terracciano A. Personality and sleep quality: evidence from four prospective studies. Health Psychol Rev. 2018;37(3):271–281. doi:10.1037/hea0000577
16. Monroe SM, Simons AD. Diathesis-stress theories in the context of life stress research: implications for the depressive disorders. Psychol Bull. 1991;110(3):406–425. doi:10.1037/0033-2909.110.3.406
17. Lazarus RS, Folkman S. Transactional theory and research on emotions and coping. Eur J Pers. 1987;1(3):141–169. doi:10.1002/per.2410010304
18. Lanza ST, Rhoades BL. Latent class analysis: an alternative perspective on subgroup analysis in prevention and treatment. Prev Sci. 2013;14(2):157–168. doi:10.1007/s11121-011-0201-1
19. Zimmerman M, Martinez JH, Young D, Chelminski I, Dalrymple K. Severity classification on the Hamilton depression rating scale. J Affect Disord. 2013;150(2):384–388. doi:10.1016/j.jad.2013.04.028
20. Young RC, Biggs JT, Ziegler VE, Meyer DA. A rating scale for mania: reliability, validity and sensitivity. Br J Psychiatry. 1978;133(5):429–435. doi:10.1192/bjp.133.5.429
21. Endicott J, Spitzer RL. A diagnostic interview: the schedule for affective disorders and schizophrenia. Arch Gen Psychiatry. 1978;35(7):837–844. doi:10.1001/archpsyc.1978.01770310043002
22. Buysse DJ, Reynolds CF 3rd, Monk TH, Berman SR, Kupfer DJ. The Pittsburgh Sleep Quality Index: a new instrument for psychiatric practice and research. Psychiatry Res. 1989;28(2):193–213. doi:10.1016/0165-1781(89)90047-4
23. Tsai PS, Wang SY, Wang MY, et al. Psychometric evaluation of the Chinese version of the Pittsburgh Sleep Quality Index (CPSQI) in primary insomnia and control subjects. Qual Life Res. 2005;14(8):1943–1952. doi:10.1007/s11136-005-4346-x
24. Smith CS, Reilly C, Midkiff K. Evaluation of three circadian rhythm questionnaires with suggestions for an improved measure of morningness. J Appl Psychol. 1989;74(5):728–738. doi:10.1037/0021-9010.74.5.728
25. Gau SF, Soong WT, Lee YJ, Chiu YN. Reliability and validity of the Chinese version of the morningness/ eveningness scale. Taiwan J Psychiatry. 1998;12:98–109.
26. Lu L. University transition: major and minor life stressors, personality characteristics and mental health. Psychol Med. 1994;24(1):81–87. doi:10.1017/S0033291700026854
27. Chen WJ, Chen HM, Chen CC, Chen CC, Yu WY, Cheng AT. cloninger’s tridimensional personality questionnaire: psychometric properties and construct validity in Taiwanese adults. Compr Psychiatry. 2002;43(2):158–166. doi:10.1053/comp.2002.30797
28. Chen CH, Tseng Y, Wang S, Lee J. The prevalence and predictors of postpartum depression. J Nurs Res. 1994;2(3):263–274.
29. Che HH, Lu ML, Chen HC, Chang SW, Lee Y. Validation of the Chinese version of the beck anxiety inventory. Formos J Med Humanit. 2006;10(4):447–454.
30. Hinz A, Glaesmer H, Brähler E, et al. Sleep quality in the general population: psychometric properties of the Pittsburgh Sleep Quality Index, derived from a German community sample of 9284 people. Sleep Med. 2017;30:57–63. doi:10.1016/j.sleep.2016.03.008
31. Lu ML, Che HH, Chang SW, Shen WW. Reliability and validity of the Chinese version of the Beck Depression Inventory-II. Taiwan J Psychiatry. 2002;16(4):301–310.
32. Muthén LK, Muthén BO. Mplus User’s Guide.
33. Akaike H. Factor analysis and AIC. Psychometrika. 1987;52(3):317–332. doi:10.1007/BF02294359
34. Harb A, Levandovski R, Oliveira C, et al. Night eating patterns and chronotypes: a correlation with binge eating behaviors. Psychiatry Res. 2012;200(2–3):489–493. doi:10.1016/j.psychres.2012.07.004
35. Przepiórka A, Błachnio A, Siu NY-F. The relationships between self-efficacy, self-control, chronotype, procrastination and sleep problems in young adults. Chronobiol Int. 2019;36(8):1025–1035. doi:10.1080/07420528.2019.1607370
36. Chung SJ, An H, Suh S. What do people do before going to bed? A study of bedtime procrastination using time use surveys. Sleep. 2020;43(4):zsz267. doi:10.1093/sleep/zsz267
37. Spielberger C, Gorsuch R, Lushene R, Vagg P, Jacobs G. Manual for State-Trait Anxiety Inventory. Palo Alto (CA): Consulting Psychologists Press; 1970.
38. Lazarus RS, Option EM. The study of psychological stress: a summary of theoretical formulations and experimental findings. In: Spielberg CD, editor. Anxiety and Behavior. New York: Academic Press; 1966:225–262.
39. Strelau J. Temperament as a Regulator of Behavior: After Fifty Years of Research. Clinton Corners (NY): Eliot Werner Publications; 2008.
40. Gorgol J, Waleriańczyk W, Stolarski M, Cyniak-Cieciura M. Temperament moderates the association between chronotype and depressive symptoms: a regulative theory of temperament approach. Pers Individ Dif. 2021;185:111304. doi:10.1016/j.paid.2021.111304
41. McCrae RR, Zawadzki B, Toeplitz Z, Oniszczenko W, Cyniak-Cieciura M, Kaczmarek M. Jan Strelau: two perspectives. Pers Individ Dif. 2022;185:111252. doi:10.1016/j.paid.2021.111252
42. Hornowska E. Cloninger’s Psychobiological Model of Personality and Strelau’s Regulative Theory of Temperament - analysis of their associations in a Polish sample. Pol Psychol Bull. 2011;42(2):71–80. doi:10.2478/v10059-011-0011-0
43. McCrae RR, Costa PT. Updating Norman’s “adequacy taxonomy”: intelligence and personality dimensions in natural language and in questionnaires. J Pers Soc Psychol. 1985;49(3):710–721. doi:10.1037/0022-3514.49.3.710
44. Cloninger CR. A psychobiological model of temperament and character. Arch Gen Psychiatry. 1993;50:12. doi:10.1001/archpsyc.1993.01820240059008
45. Gorgol J, Waleriańczyk W, Stolarski M. The moderating role of personality traits in the relationship between chronotype and depressive symptoms. Chronobiol Int. 2021;39:1–11.
46. Gomez R, Holmberg K, Bounds J, Fullarton C, Gomez A. Neuroticism and extraversion as predictors of coping styles during early adolescence. Pers Individ Dif. 1999;27(1):3–17. doi:10.1016/S0191-8869(98)00224-4
47. Jagtap S. Design creativity: refined method for novelty assessment. Int J Des Creat Innov. 2019;7(1–2):99–115. doi:10.1080/21650349.2018.1463176
48. Haigh EAP, Moore MT, Kashdan TB, Fresco DM. Examination of the factor structure and concurrent validity of the langer mindfulness/mindlessness scale. Assessment. 2011;18(1):11–26. doi:10.1177/1073191110386342
49. Webb E. Character and Intelligence: An Attempt at an Exact Study of Character. University Press; 1915.
50. van der Linden D, Dunkel CS, Petrides K. The general factor of personality (GFP) as social effectiveness: review of the literature. Pers Individ Dif. 2016;101:98–105. doi:10.1016/j.paid.2016.05.020
51. Dombrovski AY, Cyranowski JM, Mulsant BH, et al. Which symptoms predict recurrence of depression in women treated with maintenance interpersonal psychotherapy? Depress Anxiety. 2008;25(12):1060–1066. doi:10.1002/da.20467
52. Fang H, Tu S, Sheng J, Shao A. Depression in sleep disturbance: a review on a bidirectional relationship, mechanisms and treatment. J Cell Mol Med. 2019;23(4):2324–2332. doi:10.1111/jcmm.14170
 © 2022 The Author(s). This work is published and licensed by Dove Medical Press Limited. The
full terms of this license are available at https://www.dovepress.com/terms
and incorporate the Creative Commons Attribution
- Non Commercial (unported, 3.0) License.
By accessing the work you hereby accept the Terms. Non-commercial uses of the work are permitted
without any further permission from Dove Medical Press Limited, provided the work is properly
attributed. For permission for commercial use of this work, please see paragraphs 4.2 and 5 of our Terms.
© 2022 The Author(s). This work is published and licensed by Dove Medical Press Limited. The
full terms of this license are available at https://www.dovepress.com/terms
and incorporate the Creative Commons Attribution
- Non Commercial (unported, 3.0) License.
By accessing the work you hereby accept the Terms. Non-commercial uses of the work are permitted
without any further permission from Dove Medical Press Limited, provided the work is properly
attributed. For permission for commercial use of this work, please see paragraphs 4.2 and 5 of our Terms.