")
Back to Journals » Journal of Pain Research » Volume 12
Stratification of patients with unclassified pain in the FabryScan database
Authors Forstenpointner J, Moeller P, Sendel M, Reimer M, Hüllemann P, Baron R
Received 21 February 2019
Accepted for publication 22 April 2019
Published 23 July 2019 Volume 2019:12 Pages 2223—2230
DOI https://doi.org/10.2147/JPR.S206223
Checked for plagiarism Yes
Review by Single anonymous peer review
Peer reviewer comments 2
Editor who approved publication: Dr Michael A Ueberall
Julia Forstenpointner,* Paul Moeller,* Manon Sendel, Maren Reimer, Philipp Hüllemann, Ralf Baron
Division of Neurological Pain Research and Therapy, Department of Neurology, University Hospital Schleswig-Holstein, Kiel 24105, Germany
*These authors contributed equally to this work
Purpose: Fabry disease belongs to lysosomal storage disorders and can be successfully treated today. On the contrary, the correct diagnostic classification of its symptoms can be challenging and most patients suffer from pain for years, until they are diagnosed correctly. The aim of this project was to characterize patients with unclassified extremity pain and to present a simple algorithm for a retrospective stratification approach.
Patients and methods: The FabryScan includes a bedside-test and a questionnaire, consisting of 10 symptom-orientated and anamnestic questions. For the stratification of patients according to the likelihood for Fabry disease two different approaches were conducted. First, a prospective subgrouping based on the previously invented FabryScan evaluation system was conducted. The second retrospective approach consisted of a factor analysis and a subsequent two-way cluster analysis. Further on, 4 patients diagnosed with Fabry disease were stratified according to both approaches.
Results: In total, 183 completed datasets were included in the statistical analysis. The first approach prospectively classified patients into 3 subgroups (n=40 [likely], n=96 [possible], n=47 [unlikely]) according to the FabryScan evaluation system. The second approach retrospectively stratified patients into 3 subgroups (n=47 [cluster 1], n=95 [cluster 2], n=41 [cluster 3]). Finally, the Fabry patients were sorted to the subgroups, indicative for the highest possibility of Fabry disease in both stratification approaches A and B.
Conclusion: Both stratification approaches sorted patients with confirmed Fabry disease to the subgroups, indicative for the highest likelihood for Fabry. These results indicate validity of the initially selected FabryScan outcome parameters.
Keywords: extremity pain, Fabry disease, classification, neuropathic pain
Introduction
M. Fabry, a rare disease which belongs to lysosomal storage disorders frequently adheres pain as an early disease feature. A dysfunctional processing of somatosensory information as well as 4 different types of pain (33% spontaneous pain attacks, 43% evoked pain, 12% neuropathic pain, 12% temperature-dependent pain) have been identified in Fabry disease.1,2 A possible pathomechanism involves the mutation in the X-chromosomal GLA-gen and a consecutive reduction of the alpha-galactosidase. This results in an insufficient reduction of globotriaosylceramide (GL3) and its accumulation in different organs such as the heart and the kidney as well as in blood vessels and nerve fiber tissue.3,4 However, pathophysiology of pain development is not entirely clear yet and various studies have pointed to different mechanisms of action. Many studies have demonstrated an impaired small fiber function which was quantified via neurophysiological methods (ie, pain-related evoked potentials), reduced nerve fiber density and Quantitative Sensory Testing.5,6 Recently, an in vivo morphometry and perfusion assessment of dorsal root ganglia indicated an enlargement as well as dysfunctional perfusion.7
In contrast, many other studies have pointed to a dysfunctional vascular perfusion due to increased intima-media thickness8,9 and an altered endothelial nitric oxide synthases.10,11 However, whether the accumulation of GL3 directly causes damage of nerve fiber tissue or a dysfunctional perfusion of vasa nervorum leads to a nerve fiber impairment remains unsolved yet. In fact, also a combination of both mechanisms seems possible in pain generation of Fabry disease.
Despite, these pathophysiological uncertainties, patients with Fabry disease often report previous misdiagnosis, which may account for the frequent time delays of >10 years.12,13 A previous study indicated that 25% of the patients were misdiagnosed initially.14 In fact, the high variance of symptoms includes a broad range of differential diagnosis. The Fabry outcome survey reported previous misdiagnosis such as rheumatological diseases/rheumatic fever (39%), arthritis (15%), neuropsychological disease (13%), fibromyalgia syndrome (7%), dermatomyositis (5%), erythromelalgia (5%), Osler’s disease (5%), Ménière’s disease (3%) and other diseases (49%).12 Moreover, multiple sclerosis was classified as an underestimated differential diagnosis of Fabry disease in numerous studies and case reports.15–18
In order to identify previously unrecognized patients, the FabryScan questionnaire, which includes a 10-item questionnaire as well as a bedside-test, was developed.19 In 2015 the FabryScan initiative was launched with the aim to raise disease awareness and to collect data of patients with unclassified extremity pain. Due to the complexity of treatment and diagnosis, patients with unclassified pain represent a continuous challenge in the clinical routine, with most unadjusted clinic visits and 88% reporting more than one type of chronic pain.20 Therefore, the presented data give the opportunity to systematically analyze epidemiological as well as sensory parameters of patients with unclassified extremity pain. Further on, a hypothesis-free stratification of patients was conducted in order to confirm feasibility of the chosen FabryScan parameters. The fact that the conception and validation of the FabryScan was conducted on a preselected patient cohort, consisting of polyneuropathy, osteoarthritis and Fabry patients may have caused a limited reproducibility in real-world data.
Therefore, the aims of the presented study were 1) to systematically analyze a patient cohort with unclassified extremity pain and 2) to reevaluate the FabryScan questionnaire parameters on real-world data.
Materials and methods
Patient data acquisition
During the FabryScan initiative, 586 forms were dispatched to the recruiting sites (408 clinics and 102 hospitals), which were responsible for the correct data acquisition. Patients with unclear extremity pain were examined by their physician between 2015 and 2018. Thereafter, the anonymized FabryScan examination forms were sent to the University Hospital Schleswig-Holstein, Campus Kiel and processed within the FabryScan project. Patients as well as physicians agreed on the protocol and gave their informed consent to the protocol. In compliance with the local Ethics Committee patients gave verbal-informed consent to the study. The study was approved by the Ethics Committee of the University Hospital of Kiel and conducted according to the Declaration of Helsinki.
The FabryScan
The FabryScan consists of a patient self-assessment part as well as a bedside-test, performed by a physician. The self-assessment part included epidemiological parameters assessing: sex, age and pain duration. Further on, patients had to rate the average pain (within the last 30 days) as well as the maximum pain (within the last 30 days) on a 11-point VAS, where 0 indicates no pain and 10 indicates maximum imaginable pain. The 10-item questionnaire had to be rated on a 4-point scale, indicative for the likelihood of the event (“absolutely correct,” “fairly true,” “not really true” and “definitely not true”). The questionnaire items (Q1, Q2, Q4, Q6, Q7, Q8) were classified as “absolutely correct” [3 points] > “definitely not true” [0 points].
In order to distinguish between different pain entities, 4 questionnaire items (Q3, Q5, Q9, Q10) were reversed scored (ie, “absolutely correct” [0 points] > “definitely not true” [3 points]).
The bedside-test consists of 3 tests, indicative for sensory nerve fiber function. The first test assesses thermal sensory function by applying a TipTherm© (Tip Therm Gesellschaft für neurologische Diagnostik mbH, Brüggen, Germany) to each foot.
The TipTherm© is a medical instrument with a cold (ie, metal) and a warm (ie, plastic) surface. The correct use of the TipTherm© encompasses the application of each surface (metal/plastic) for 4-times to each foot (patient recognized cold surface: ≥3-times [0 points], ≤3-times [1 point]). The second test assesses touch sensitivity by applying a 16 mN von-Frey-hair (MARSTOCKnervtest, Schriesheim, Germany) 4-times to each foot (patient-recognized touch: ≥5-times [1 point], ≤5-times [0 points]). The third test assesses vibration sensation by applying a tuning fork to the medial malleolus, 3-times to each foot (the mean vibration threshold was calculated: vibration threshold <6.66 [0 points], ≥6.66 [1 point]). For each bedside parameter (1–3) only one score was calculated based on the testing of both feet.
Stratification of patients
For the stratification of patients, two different approaches were utilized.
First, a prospective subgrouping based on the results of the initial study by Arning et al was conducted. In this study, the scoring of questionnaire items was based on the ideal separation effects between patients with Fabry disease, rheumatoid arthritis and polyneuropathy. According to the likelihood for Fabry disease, patients were classified into 3 subgroups: I. likely [0–9 points], II. possible [10–14 points], III. unlikely [15–33 points].
The second retrospective approach consisted of a principal component analysis (PCA), of the FabryScan questionnaire. Thereby, three factors were identified and the factor loading of each parameter was determined. Subsequently, the 7 questions with the highest loading were included in a two-way cluster analysis, which defined 3 subgroups. (This approach was further elaborated in section “Retrospective reevaluation of the FabryScan questionnaire parameters.”)
Statistical analysis
Variables were displayed as mean [±SD]. Differences between groups were calculated with the Mann–Whitney U test, an overall group comparison was conducted via Kruskal–Wallis test. The second stratification approach included a PCA, which was conducted on 10 items of the FabryScan questionnaire via orthogonal rotation method (varimax). Thereafter, a two-step cluster analysis was executed.
Statistical analysis was performed with SPSS (V. 23, IBM, Chicago, IL, USA).
Results
Prospective subgrouping and characterization of patients with unclassified extremity pain
In total, 183 completed FabryScan forms were received back, and included in the statistical analysis. The study population with unclassified pain consisted of 117/66 (female/male) participants with a mean [±STDV] age of 50.7 [±14.5] years. The patient stratification approach sorted 40 patients to the subgroup “likely,” 96 patients to the subgroup “possible” and 47 patients to the subgroup “unlikely.” All patients suffered from severe pain, the mean average pain intensity (within the last 30 days) was 4.1 [±2.8], the maximum pain intensity (within the last 30 days) reached 7.0 [±2.7]. The maximum and average pain intensity was not significantly different between subgroups. All questionnaire items differentiated significantly (P<0.001) between the subgroups Fabry “likely” vs Fabry “unlikely,” except for the items “Q9 [morning stiffnessR]” and “Q5 [joint swellingR].” The bedside testing did not distinguish between different subgroups, only the vibration threshold indicated a significantly reduced pallaesthesia in the Fabry “unlikely” subgroup as compared to the Fabry “likely” subgroup (P<0.001).
A detailed characterization of patients for epidemiological as well as sensory parameters is displayed in Table 1.
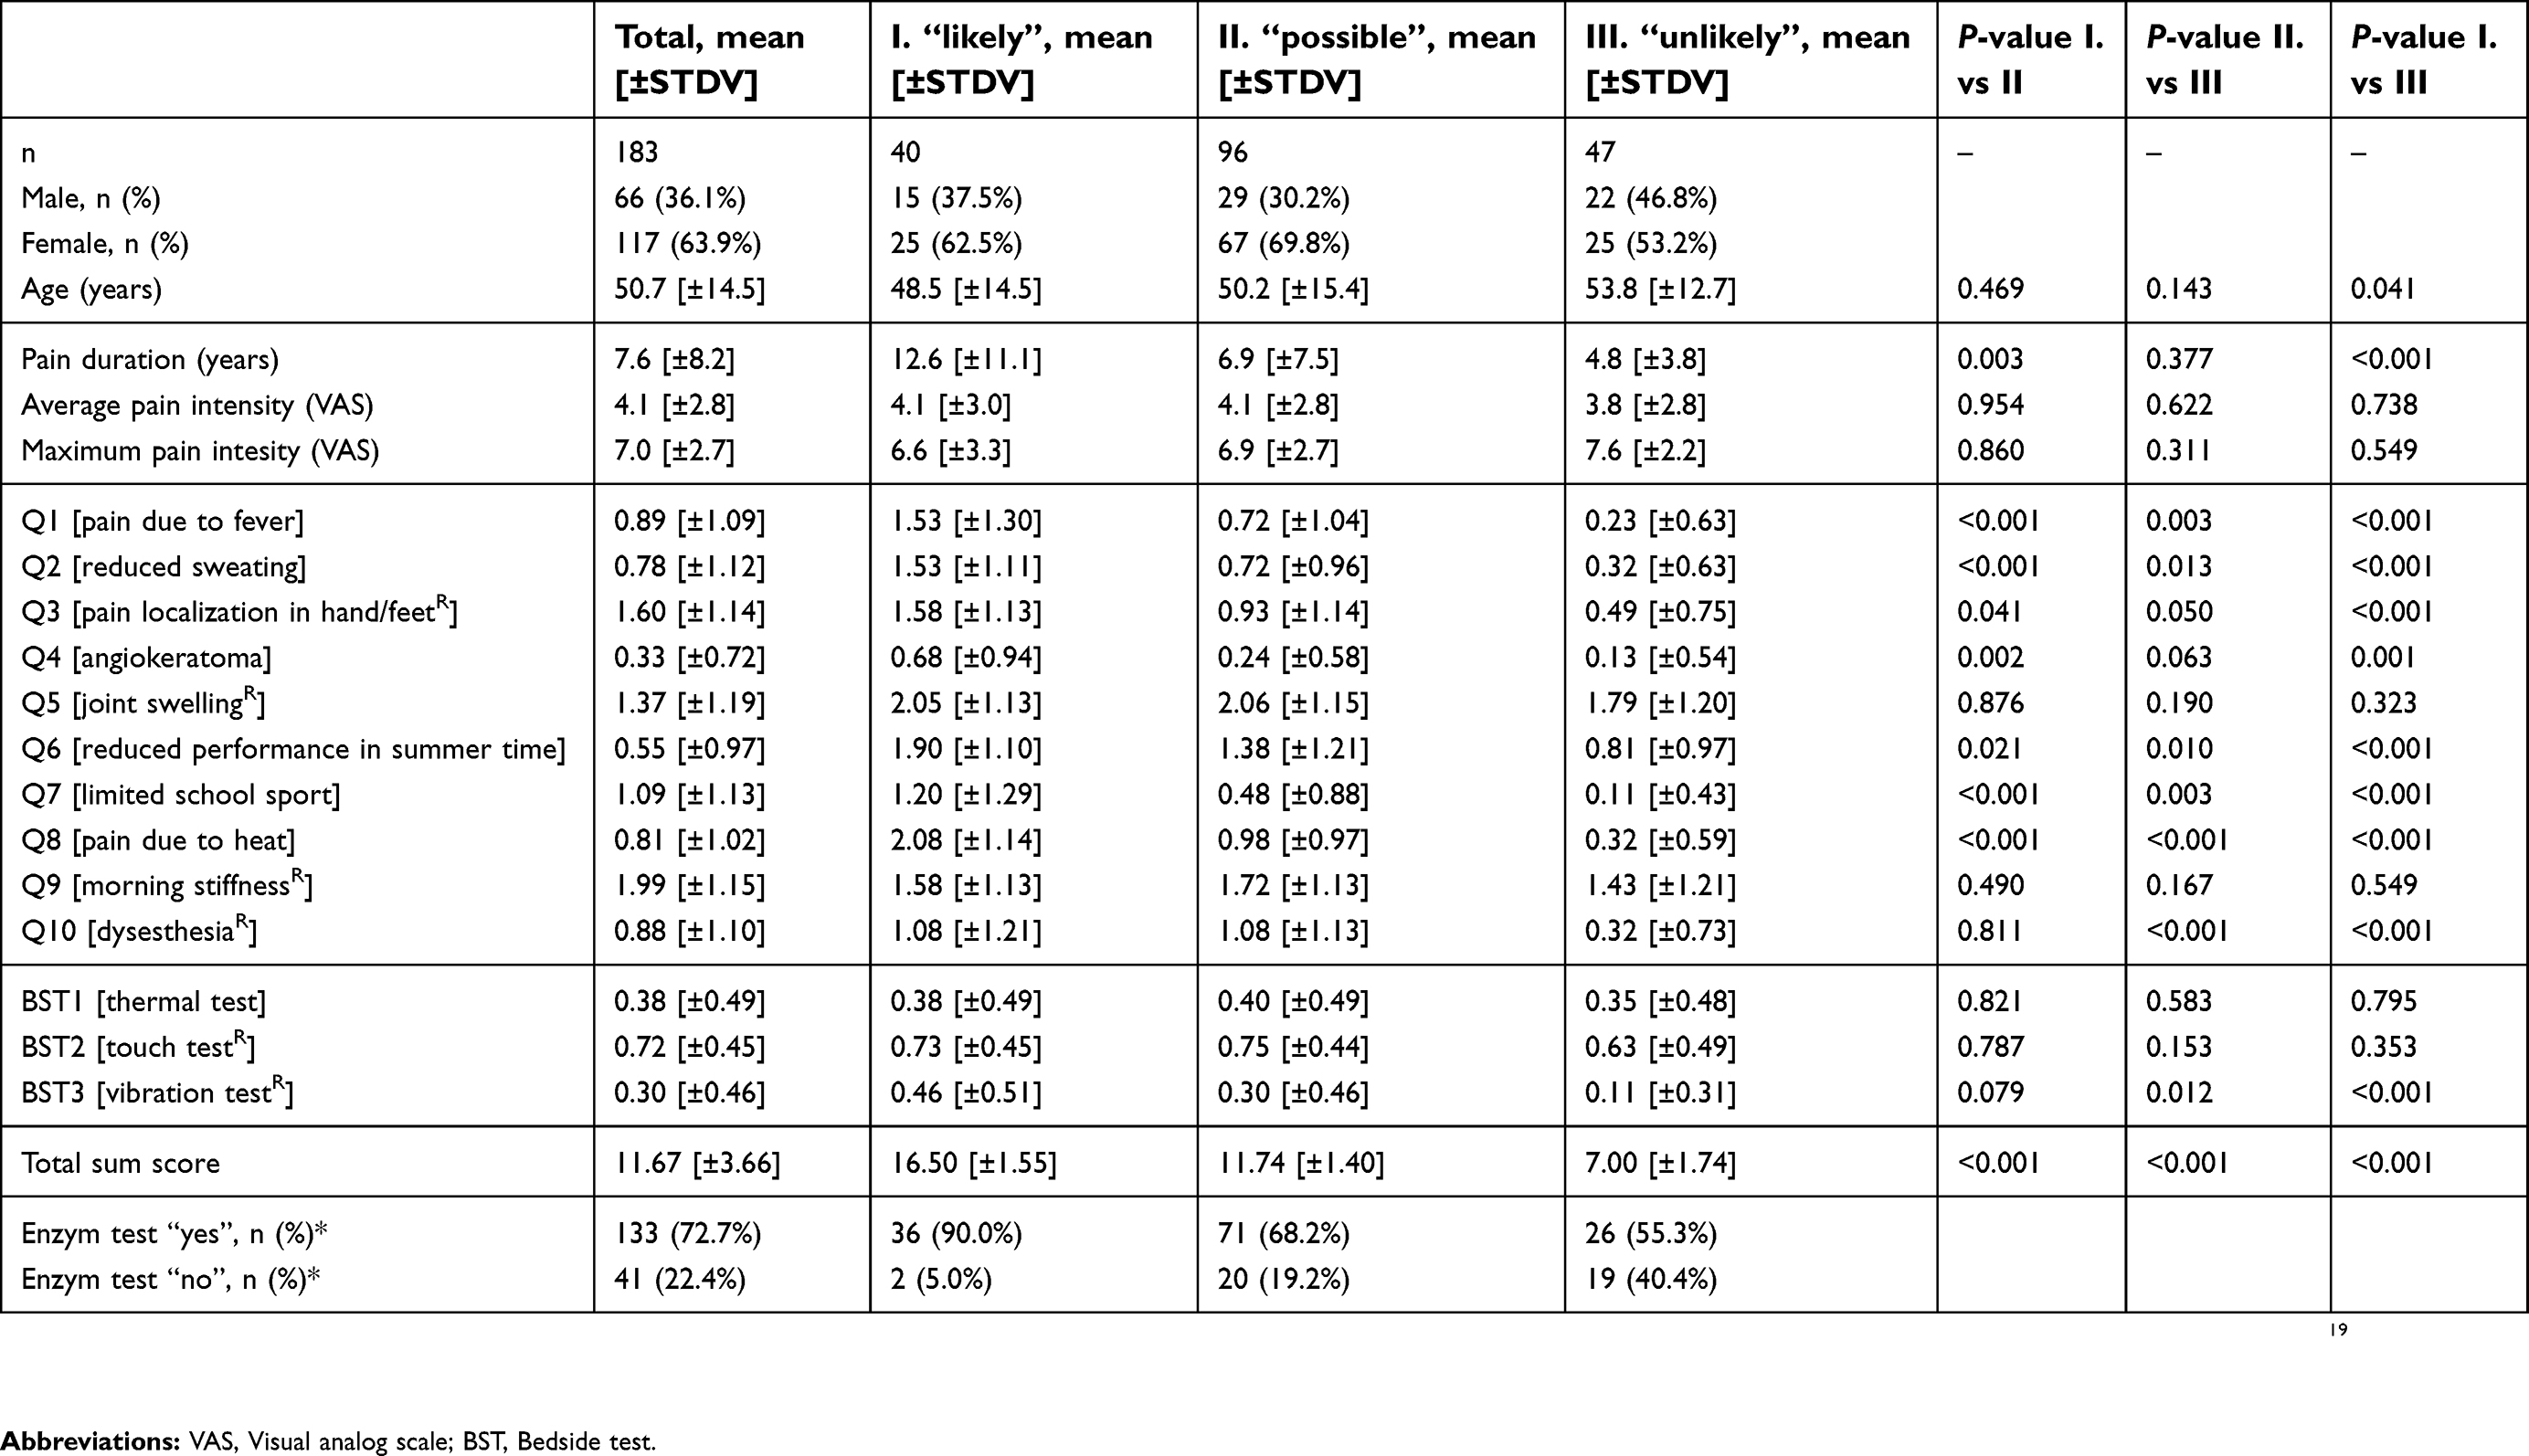 |
Table 1 Characterization of patients with unclassified extremity pain |
Retrospective reevaluation of the FabryScan questionnaire parameters
Principal component analysis (PCA)
A PCA was conducted on 10 items of the FabryScan questionnaire via orthogonal rotation method (varimax). A Kaiser–Meyer–Olkin (KMO) analysis confirmed a good composition of data, KMO=0.76,21 the individual KMO parameters were >0.63 (ie, above the minimum cut-off >0.522)
The Bartlett’s test of Sphericity χ2 (45)=373.534, P<0.001 indicated sufficient correlation between items to conduct a PCA.
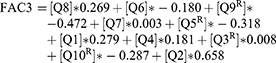
The first analysis determined Eigen-values for each questionnaire item. Three components had an Eigen-value above the Kaiser criterion of 1, in combination these parameters explained 55.3% of the variance. In Table 2, the factor loading of each value after rotation is indicated. Question items loading on factor 1 suggest “reaction to physical stress,” on factor 2 “reduced flexibility” and on factor 3 “extremity dysesthesia.” The PCA identified the following models for factors 1–3:


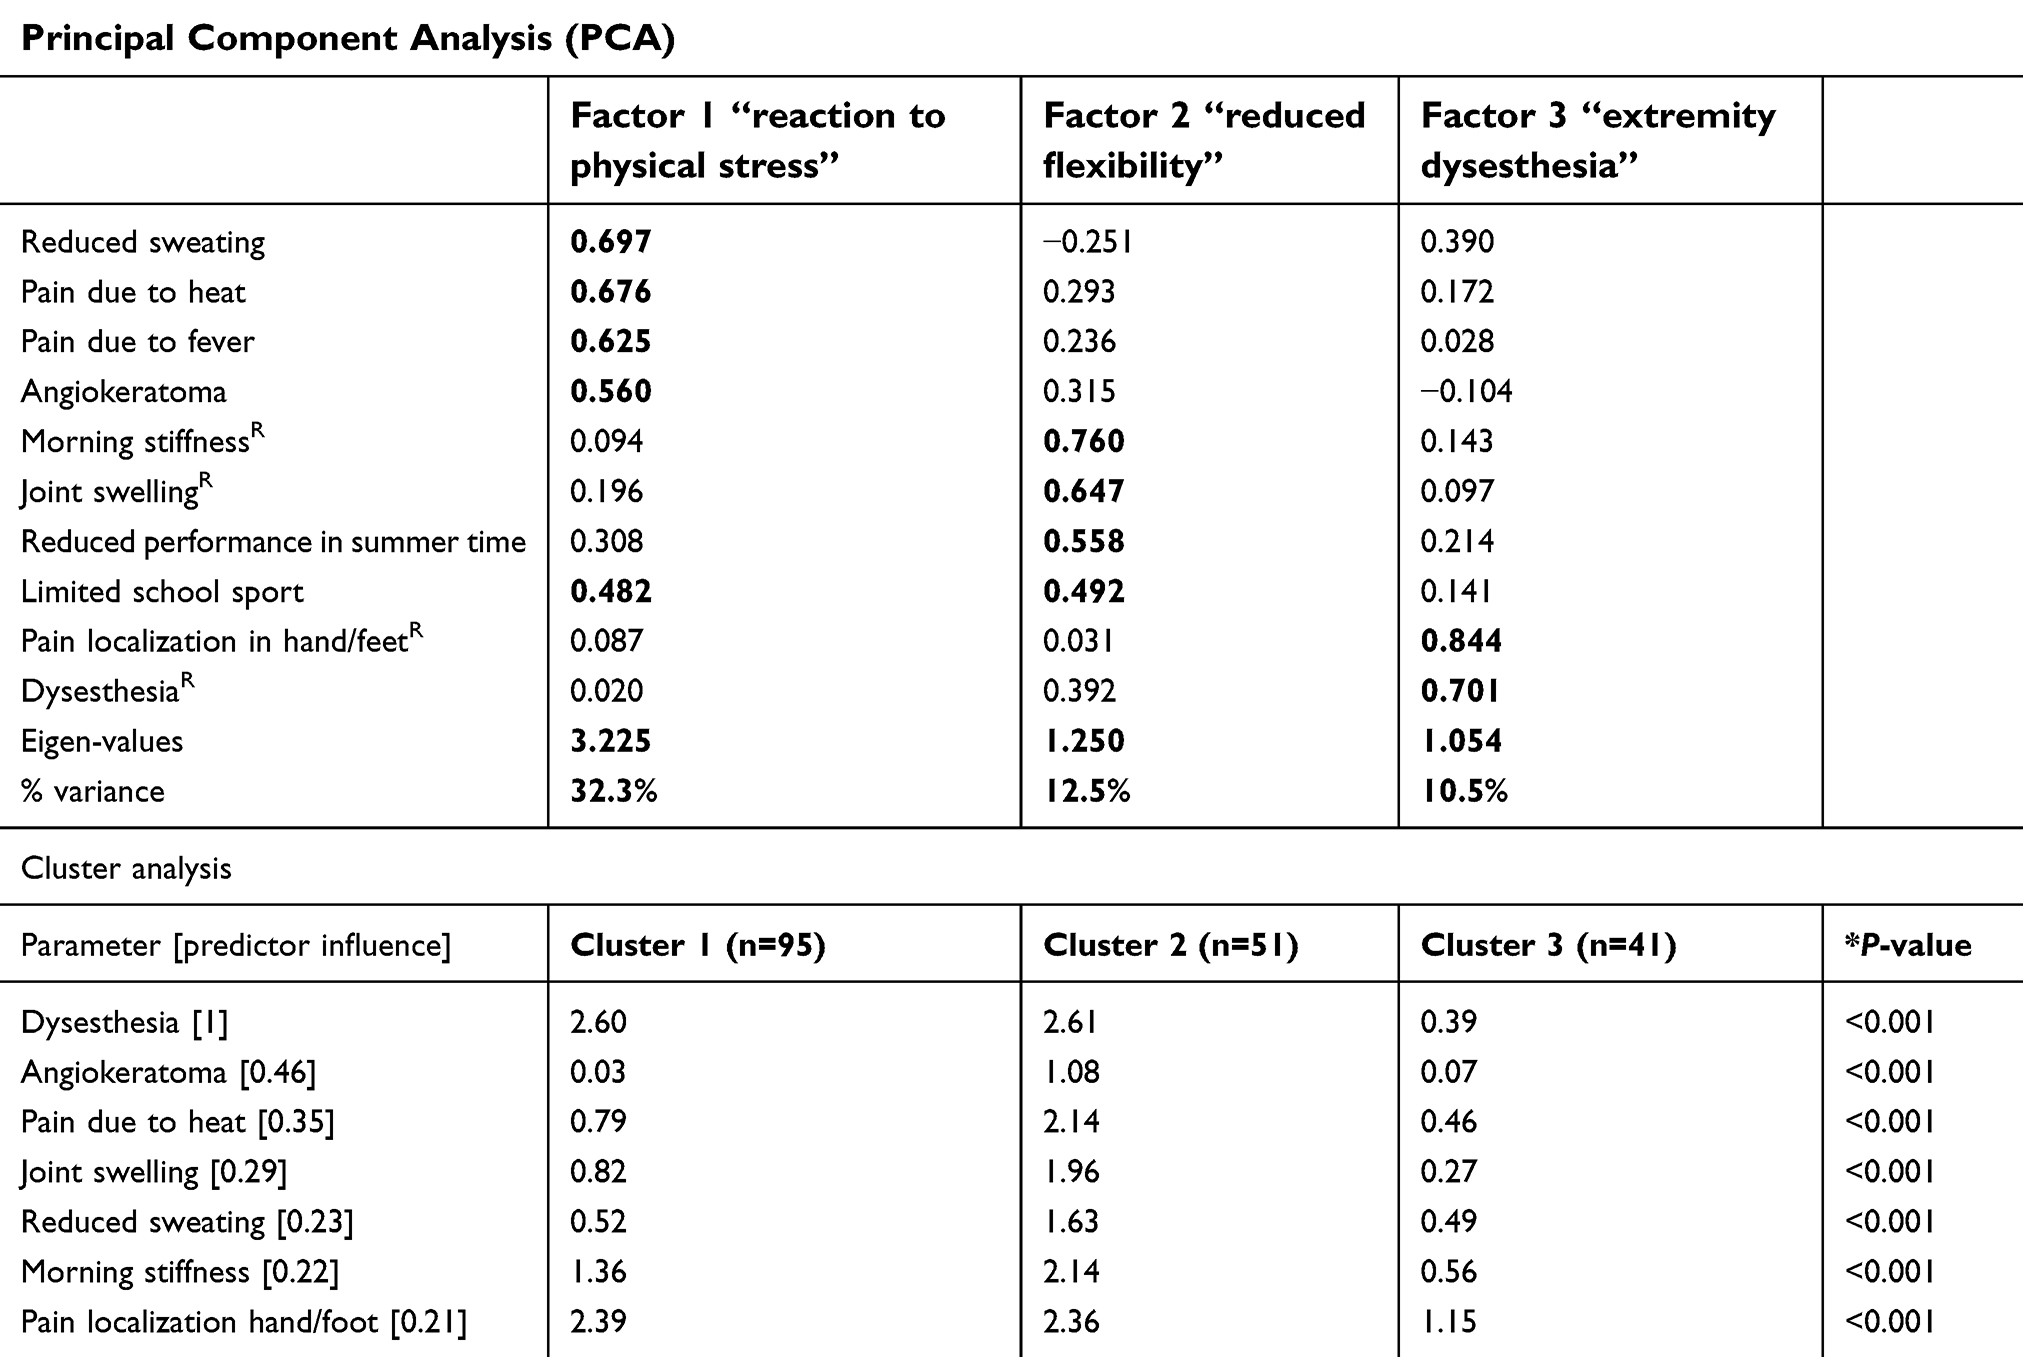 |
Table 2 Summary of the PCA and cluster analysis results |
Formula 1
3 models were identified by the PCA. Superscript “R” indicates reversed scoring of the variable. Q1 [pain due to fever], Q2 [reduced sweating], Q3 [pain localization in hand/feetR], Q4 [angiokeratoma], Q5 [joint swellingR], Q6 [reduced performance in summer time], Q7 [limited school sport], Q8 [pain due to heat], Q9 [morning stiffnessR], Q10 [dysesthesiaR].
Cluster analysis
For the cluster analysis, a total number of 187 patients (183 patients with unclassified extremity pain and 4 patients with diagnosed Fabry disease) were included. The number of variables (m) included in the cluster analysis was set according to Formann as: 2m= sample size (n).23 Therefore, 7 variables were included at a sample size of n=187.
The selection of variables was defined by PCA, according to the factor loading. Thus, for each factor (1–3), the two parameters with the highest loading were selected (ie, factor 1: “reduced sweating” and “pain due to heat”). Additionally, the item “angiokeratoma” was selected due to its pronounced distinction in identifying Fabry patients.
A two-step cluster analysis was conducted assuming equal intervals of ordinal scale. The log-likelihood method was set as distance measure and three clusters were predefined. The silhouette for cohesion and separation indicated a cluster structure of 0.3. A detailed characterization of each cluster is displayed in Table 2. A group analysis between clusters 1 and 3 indicated significant differences between clusters (Kruskal–Wallis test, P<0.001).
Conclusion
The awareness-initiative FabryScan reached over 500 clinics and hospitals. Thereby, awareness for the disease was created and previously unrecognized patients could be identified.
Moreover, the aims 1) to characterize patients with unclassified extremity pain and 2) to develop an objective model for retrospective identification of potential patients with Fabry disease were addressed.
ad. 1) Interestingly, the duration of pain significantly increased in the patient group, classified as “Fabry likely” as compared to the “Fabry possible” (P=0.003) and the “Fabry unlikely” (P<0.001) subgroup. This result is in line with the early onset of the disease and an average of 10.5 years until diagnosis.13 Moreover, the parameter “angiokeratoma” which has been reported as most distinct in separating indicated significant differences between the “Fabry likely” group as compared to the patient groups classified as “Fabry possible” (P=0.002) or “Fabry unlikely” (P=0.001).
ad. 2) The FabryScan evaluation system sorted all Fabry patients to the subgroup “fabry likely.” This classification was confirmed by the retrospective hypothesis-free cluster analysis, which sorted those patients to cluster 2. In comparison to clusters 1 and 3, cluster 2 had the most parameters with fabry-like characteristics such as angiokeratoma, pain due to heat and reduced sweating. This result indirectly confirmed accuracy of the initial FabryScan project by Arning et al in real-world data.19
Interestingly the parameters “morning stiffness” and “joint swelling” reached 1.3 and 2.5, respectively, in patients with Fabry disease. Moreover, no significant difference was detected when comparing the items “morning stiffness” and “joint swelling” between FabryScan subgroups (“likely,” “possible” and “unlikely”). In line with this result, a recent study assessed joint manifestations in Fabry patients, concluding that Fabry patients had higher prevalence of joint problems as compared to healthy controls.24 These observations suggest a higher frequency of joint-associated symptoms than previously recognized in Fabry patients.
Therefore, the parameters “morning stiffness” and “joint swelling” might have a less discriminatory power as previously expected.
However, also due to the stratification of Fabry patients in the correct cluster, the FabryScan still presents a useful tool to identify patients previously unrecognized with Fabry disease. Moreover, such an algorithm even represents an elegant method to confirm validity of previous stratification approaches and to retrospectively identify patients with rare diseases in general.
Limitations
The FabryScan was assessed by the treating physician in patients with unclassified extremity pain. Therefore, the authors cannot report to which extend the patients were diagnosed by the individual physician and which differential diagnosis was considered.
Acknowledgments
The authors would like to thank all participating patients, colleagues and the staff of the institutions for their contributions to data collection. This study was financially supported by the Sanofi Genzyme GmbH. The authors acknowledge financial support by Land Schleswig-Holstein within the funding program Open Access Publikationsfonds.
Disclosure
The authors declare that the sources of financial support had no influence on data assessment, analysis, and interpretation and disclose the potential conflicts of interest. JF reports grants and personal fees from Sanofi Genzyme GmbH, during the conduct of the study; personal fees and non-financial support from Grünenthal GmbH and Sanofi Genzyme, personal fees from Bayer, non-financial support from Novartis, outside the submitted work. PM reports grants and personal fees from Sanofi Genzyme GmbH, during the conduct of the study. MR received speaking fees and travel expenses from Pfizer, Grünenthal, Astellas, and grant/research support from Mundipharma and Grünenthal. PH reports speaking fees from Pfizer and Genzyme and travel reimbursement from Grünenthal. RB reports personal fees from Sanofi Genzyme GmbH, during the conduct of the study; grants from Pfizer, Genzyme GmbH, Grünenthal GmbH, Mundipharma. RB is a member of the EU Project No 633491: DOLORisk; a member of the IMI “Europain“ collaboration and industry members of this are: Astra Zeneca, Pfizer, Esteve, UCB-Pharma, Sanofi Aventis, Grünenthal GmbH, Eli Lilly and Boehringer Ingelheim Pharma GmbH&Co.KG. German Federal Ministry of Education and Research (BMBF): Member of the ERA_NET NEURON/IM-PAIN Project (01EW1503). German Research Network on Neuropathic Pain (01EM0903), NoPain system biology (0316177C). German Research Foundation (DFG), personal fees from Pfizer, Genzyme GmbH, Grünenthal GmbH, Mundipharma, Sanofi Pasteur, Medtronic Inc. Neuro-modulation, Eisai Co.Ltd., Lilly GmbH, Boehringer Ingelheim Pharma GmbH&Co.KG, Astellas, Desitin, Teva Pharma, Bayer-Schering, MSD GmbH, Seqirus, personal fees from Pfizer, Genzyme GmbH, Grünenthal GmbH, Mundipharma, Allergan, Sanofi Pasteur, Medtronic, Eisai, Lilly GmbH, Boehringer Ingelheim Pharma GmbH&Co.KG, Astellas, Novartis, Bristol-Myers Squibb, Biogenidec, AstraZeneca, Merck, Abbvie, Daiichi Sankyo, Glenmark Pharmaceuticals, Seqirus, Teva Pharma, Genentech, Galapagos NV, Kyowa Kirin GmbH, Vertex Pharmaceuticals Inc., Biotest AG, TAD Pharma GmbH, outside the submitted work. The authors report no other conflicts of interest in this work.
References
1. Germain DP. Fabry disease. Orphanet J Rare Dis. 2010;5:30. doi:10.1186/1750-1172-5-30
2. Uceyler N, Ganendiran S, Kramer D, Sommer C. Characterization of pain in fabry disease. Clin J Pain. 2014;30(10):915–920. doi:10.1097/AJP.0000000000000041
3. Toyooka K. Fabry disease. Curr Opin Neurol. 2011;24(5):463–468. doi:10.1097/WCO.0b013e32834a9433
4. Kaye EM, Kolodny EH, Logigian EL, Ullman MD. Nervous system involvement in Fabry’s disease: clinicopathological and biochemical correlation. Ann Neurol. 1988;23(5):505–509. doi:10.1002/ana.410230513
5. Maag R, Binder A, Maier C, et al. Detection of a characteristic painful neuropathy in Fabry disease: a pilot study. Pain Med. 2008;9(8):1217–1223. doi:10.1111/j.1526-4637.2008.00470.x
6. Uceyler N, Kahn AK, Kramer D, et al. Impaired small fiber conduction in patients with Fabry disease: a neurophysiological case-control study. BMC Neurol. 2013;13:47. doi:10.1186/1471-2377-13-202
7. Godel T, Kohn A, Muschol N, et al. Dorsal root ganglia in vivo morphometry and perfusion in female patients with Fabry disease. J Neurol. 2018;265(11):2723–2729. doi:10.1007/s00415-018-9053-y
8. Kalliokoski RJ, Kalliokoski KK, Penttinen M, et al. Structural and functional changes in peripheral vasculature of Fabry patients. J Inherit Metab Dis. 2006;29(5):660–666. doi:10.1007/s10545-006-0340-x
9. Rombach SM, van Den Bogaard B, de Groot E, et al. Vascular aspects of Fabry disease in relation to clinical manifestations and elevations in plasma globotriaosylsphingosine. Hypertension. 2012;60(4):998–1005. doi:10.1161/HYPERTENSIONAHA.112.195685
10. Shu L, Park JL, Byun J, Pennathur S, Kollmeyer J, Shayman JA. Decreased nitric oxide bioavailability in a mouse model of Fabry disease. J Am Soc Nephrol. 2009;20(9):1975–1985. doi:10.1681/ASN.2008111190
11. Moore DF, Scott LT, Gladwin MT, et al. Regional cerebral hyperperfusion and nitric oxide pathway dysregulation in Fabry disease: reversal by enzyme replacement therapy. Circulation. 2001;104(13):1506–1512.
12. Mehta A, Ricci R, Widmer U, et al. Fabry disease defined: baseline clinical manifestations of 366 patients in the Fabry outcome survey. Eur J Clin Invest. 2004;34(3):236–242. doi:10.1111/j.1365-2362.2004.01309.x
13. Reisin R, Perrin A, Garcia-Pavia P. Time delays in the diagnosis and treatment of Fabry disease. Int J Clin Pract. 2017;71(1). doi:10.1111/ijcp.12914
14. Hoffmann B, Mayatepek E. Fabry disease-often seen, rarely diagnosed. Dtsch Arztebl Int. 2009;106(26):440–447. doi:10.3238/arztebl.2009.0440
15. Bottcher T, Rolfs A, Tanislav C, et al. Fabry disease – underestimated in the differential diagnosis of multiple sclerosis? PLoS One. 2013;8(8):e71894. doi:10.1371/journal.pone.0071894
16. Becker J, Rolfs A, Karabul N, Berlit P, Kraemer M. D313Y mutation in the differential diagnosis of white matter lesions: experiences from a multiple sclerosis outpatient clinic. Mult Scler. 2016;22(11):1502–1505. doi:10.1177/1352458516638747
17. Shribman SE, Shah AR, Werring DJ, Cockerell OC. Fabry disease mimicking multiple sclerosis: lessons from two case reports. Mult Scler Relat Disord. 2015;4(2):170–175. doi:10.1016/j.msard.2015.01.001
18. Yau WY, Fabis-Pedrini MJ, Kermode AG. Fabry heterozygote mimicking multiple sclerosis. BMJ Case Rep. 2017;2017:1–3. doi: 10.1136/bcr-2017-220274
19. Arning K, Naleschinski D, Maag R, et al. FabryScan: a screening tool for early detection of Fabry disease. J Neurol. 2012;259(11):2393–2400. doi:10.1007/s00415-012-6619-y
20. Romanelli RJ, Shah SN, Ikeda L, et al. Patient characteristics and healthcare utilization of a chronic pain population within an integrated healthcare system. Am J Manag Care. 2017;23(2):e50–e56.
21. Hutcheson GD, Sofroniou N The multivariate social scientist. 1999: http://methods.sagepub.com/book/the-multivariate-social-scientist.
22. Field AP. Discovering Statistics Using SPSS: (And Sex and Drugs and Rock ‘N’ Roll). Los Angeles [i.e. Thousand Oaks, CA]. London: SAGE Publications; 2009.
23. Formann AK Die Latent-Class-Analyse: Einf¸hrung in Theorie und Anwendung. 1984.
24. Ivleva A, Weith E, Mehta A, Hughes DA. The influence of patient-reported joint manifestations on quality of life in fabry patients. JIMD Rep. 2018;41:37–45. doi:10.1007/8904_2017_84
 © 2019 The Author(s). This work is published and licensed by Dove Medical Press Limited. The full terms of this license are available at https://www.dovepress.com/terms.php and incorporate the Creative Commons Attribution - Non Commercial (unported, v3.0) License.
By accessing the work you hereby accept the Terms. Non-commercial uses of the work are permitted without any further permission from Dove Medical Press Limited, provided the work is properly attributed. For permission for commercial use of this work, please see paragraphs 4.2 and 5 of our Terms.
© 2019 The Author(s). This work is published and licensed by Dove Medical Press Limited. The full terms of this license are available at https://www.dovepress.com/terms.php and incorporate the Creative Commons Attribution - Non Commercial (unported, v3.0) License.
By accessing the work you hereby accept the Terms. Non-commercial uses of the work are permitted without any further permission from Dove Medical Press Limited, provided the work is properly attributed. For permission for commercial use of this work, please see paragraphs 4.2 and 5 of our Terms.