Back to Journals » International Journal of Chronic Obstructive Pulmonary Disease » Volume 14
Sputum Exosomal microRNAs Profiling Reveals Critical Pathways Modulated By Pseudomonas aeruginosa Colonization In Bronchiectasis
Authors Huang Y ![]() , Chen C, Yuan J, Li H, Han X, Chen R
, Chen C, Yuan J, Li H, Han X, Chen R ![]() , Guan W, Zhong N
, Guan W, Zhong N
Received 17 June 2019
Accepted for publication 21 October 2019
Published 22 November 2019 Volume 2019:14 Pages 2563—2573
DOI https://doi.org/10.2147/COPD.S219821
Checked for plagiarism Yes
Review by Single anonymous peer review
Peer reviewer comments 2
Editor who approved publication: Dr Chunxue Bai
Yan Huang,1 Chun-lan Chen,1 Jing-jing Yuan,1 Hui-min Li,1 Xiao-rong Han,1 Rong-chang Chen,2 Wei-jie Guan,1 Nan-shan Zhong1
1Department of Respiratory Medicine, State Key Laboratory of Respiratory Disease, National Clinical Research Center for Respiratory Disease, Guangzhou Institute for Respiratory Health, The First Affiliated Hospital of Guangzhou Medical University, Guangzhou, Guangdong, People’s Republic of China; 2Department of Respiratory Medicine, Shenzhen People’s Hospital, Shenzhen, Guangdong, People’s Republic of China
Correspondence: Wei-jie Guan; Nan-shan Zhong
Department of Respiratory Medicine, State Key Laboratory of Respiratory Disease, National Clinical Research Center for Respiratory Disease, Guangzhou Institute for Respiratory Health, The First Affiliated Hospital of Guangzhou Medical University, 151 Yanjiang Road, Guangzhou, Guangdong, People’s Republic of China
Tel +86-20-83062876; +86-20-83062719
Fax +86-20-83062718; +86-20-83062719
Email [email protected]; [email protected]
Background: Pseudomonas aeruginosa (PA) colonization confers poor prognosis in bronchiectasis. However, the biomarkers and biological pathways underlying these associations are unclear.
Objective: To identify the roles of PA colonization in bronchiectasis by exploring for sputum exosomal microRNA profiles.
Methods: We enrolled 98 patients with clinically stable bronchiectasis and 17 healthy subjects. Sputum was split for bacterial culture and exosomal microRNA sequencing, followed by validation with quantitative polymerase chain reaction. Bronchiectasis patients were stratified into PA and non-PA colonization groups based on sputum culture findings. We applied Gene Ontology and Kyoto Encyclopedia of Genes and Genome pathway enrichment analysis to explore biological pathways corresponding to the differentially expressed microRNAs (DEMs) associated with PA colonization.
Results: Eighty-two bronchiectasis patients and 9 healthy subjects yielded sufficient sputum that passed quality control. We identified 10 overlap DEMs for the comparison between bronchiectasis patients and healthy subjects, and between PA and non-PA colonization group. Both miR-92b-5p and miR-223-3p could discriminate PA colonization (C-statistic >0.60) and independently correlated with PA colonization in multiple linear regression analysis. The differential expression of miR-92b-5p was validated by quantitative polymerase chain reaction (P<0.05), whereas the differential expression of miR-223 trended towards statistical significance (P=0.06). These DEMs, whose expression levels correlated significantly with sputum inflammatory biomarkers (interleukin-1β and interleukin-8) level, were implicated in the modulation of the nuclear factor-κB, phosphatidylinositol and longevity regulation pathways.
Conclusion: Sputum exosomal microRNAs are implicated in PA colonization in bronchiectasis, highlighting candidate targets for therapeutic interventions to mitigate the adverse impacts conferred by PA colonization.
Keywords: bronchiectasis, microRNA, exosome, Pseudomonas aeruginosa, biological pathway
Introduction
Chronic airway infection and inflammation are implicated in the pathogenesis and progression of bronchiectasis.1 The dilated bronchi provide the niche for the expansion of opportunistic pathogens that elicit airway inflammation.2 Compared with other potentially pathogenic bacteria, Pseudomonas aeruginosa (PA) conferred significantly greater adverse impacts on bronchiectasis,3 including the more rapid lung function decline and frequent exacerbations.4 In fact, colonization of PA correlated with a substantial morbidity and mortality.5
Micro-ribonucleic acids (miRNA), the 18–25nt non-coding ribonucleic acids, have been implicated in the airway inflammatory responses.6 Up-regulated expression of miR-301b correlated with the heightened inflammation associated with PA infection.7 Exosomes are extracellular vesicles laden mainly with non-coding RNAs such as miRNAs,8 which are transferred to the target cells for modulating the host immunity.9 For instance, exosomal miR-155 enhanced whereas miR-146a suppressed inflammatory gene expression,10 suggesting that exosomal miRNA might be capable of modulating airway inflammation.
Currently, the mechanisms underlying the adverse impacts associated with PA colonization in bronchiectasis are unclear. Here, we sought to identify the differentially expressed miRNAs (DEMs) in sputum exosomes that were associated with PA colonization. This might help clarify whether and which miRNAs could be the biomarkers associated with PA colonization, and through which pathways PA modulates chronic airway inflammation in bronchiectasis.
Methods
Participants
Between November 2016 and March 2018, we consecutively recruited 98 bronchiectasis patients and 17 healthy subjects. Bronchiectasis was diagnosed with chest high-resolution computed tomography in the out-patient clinics of The First Affiliated Hospital of Guangzhou Medical University. Eligible patients remained clinically stable (respiratory symptoms not significantly exceeding normal daily variations) for at least 4 weeks. Healthy subjects had normal chest X-ray findings, and had no history of chronic respiratory diseases. None of the participants had malignancy, acute upper airway infection or antibiotic use within 4 weeks before recruitment. Exacerbations were defined based on the criteria stated in international guidelines.11 The study protocol was approved by The Ethics Committee of The First Affiliated Hospital of Guangzhou Medical University (Medical Ethics Year 2012, the 33rd). Written informed consent was obtained.
Study Design
Patients underwent history inquiry, spirometry (COSMED Inc., Italy) and collection of spontaneous sputum when clinically stable. Patients were followed-up at 3-to-6-month intervals to determine the bacterial colonization status, and record exacerbations and hospitalizations. We excluded patients followed-up for less than 6 months. Modified Reiff score was used to evaluate the radiologic severity of bronchiectasis.12,13 Etiologies, Bronchiectasis Severity Index (BSI), and E-FACED score were assessed5,14,15 at the initial stable visit. We validated the DEMs with quantitative polymerase chain reaction (qPCR) in 34 bronchiectasis patients who had sufficient paired sputum.
Procedures
Patients thoroughly gargled their mouth with distilled water, followed by forceful coughing. Sputum was expectorated in a sterile plastic pot. We selected the most purulent portion and performed cytology assessment under the light microscope. Sputum that met quality control criteria was split for bacterial culture (within 2 hrs), sputum sol preparation for inflammatory biomarker [interleukin (IL)-8, IL-1β, and tumor necrosis factor-α (TNF-α)] assays, and storage in −80°C freezers for subsequent extraction of the exosomes and miRNA detection. Sputum exosomes were identified with the H-7650 transmission electron microscope (HITACHI, Japan), and the DEMs associated with PA colonization were validated with qPCR by using ABI 7500 Real-Time System (Thermo Scientific, USA).
Definition Of PA Colonization
PA colonization was defined as sputum culture positive of PA for at least two occasions (at least 3 months apart) within 1 year, when clinically stable during the longitudinal follow-up. Bronchiectasis patients were stratified into PA and non-PA group (unmet the criteria of PA colonization).
Sputum miRNA Expression Profiling
After thawing, sputum was mixed with phosphate buffer solution. Exosomes were isolated with exoEasy Maxi Kit, and the total RNA was extracted with exoRNeasy Serum/Plasma Maxi Kit (Qiagen, Germany). Agilent Bioanalyzer 2100 system (Agilent Technologies, USA) was used to assess the purity and integrity of RNA, followed by sequencing with Hiseq 2500 platform (Illumina, USA). After denoising the raw reads, we calculated the false discovery rate (FDR), P value and fold-change for high-quality reads. MiRNA expression was corrected by transcripts per million.16,17 Mature human miRNAs were annotated with miRBase 22.0. See Figure S1 regarding the flowchart of sequencing schemes. See further details in Online Supplement.
Statistical Analysis
Statistical analyses were conducted with R software version 3.5.0 and Graphpad Prism 5.0 (Graphpad Inc., USA). Kolmogorov–Smirnov test was applied to determine the normality of continuous variables, which were presented as mean ± standard deviation or median (interquartile range) as appropriate. Count (percentage) was demonstrated for categorical data.
Principal component analysis (PCA) was applied for quality control and assessment of the global gene expression patterns. Identification of the DEMs was based on the FDR (cut-off: 0.10).18–20 The DEMs were initially screened via comparison between all bronchiectasis patients and healthy subjects, followed by the comparison between PA and non-PA group in bronchiectasis patients. Venn diagram was applied to demonstrate the unique or overlap DEMs. Multiple-group comparisons were made using analysis-of-variance or non-parametric analysis and adjusted with Benjamini–Hochberg correction. The diagnostic value of miRNA in differentiating PA group from non-PA group was analyzed with the C-statistic and 95% confidence interval (95% CI). To select the minimum set of DEMs that best discriminated PA colonization, machine learning was applied to perform least absolute shrinkage and selection operator linear regression analysis (LASSO)21 to avoid overfitting. Multiple linear regression was performed to analyze the correlation between DEMs and PA colonization. We finally included the miRNA for validation by performing qPCR assays, provided that the C-statistic was greater than 0.6, and that the expression level correlated significantly with PA colonization in the above-mentioned multiple regression models. The biological function and pathways of DEMs were analyzed with Gene Ontology (GO) and Kyoto Encyclopedia of Genes and Genomes Pathway Analysis (KEGG). Significant enrichment was defined as the unadjusted P value <0.01 and Padj <0.05 (corrected with the Benjamini–Hochberg algorithm).
Results
Subject Recruitment And Clinical Characteristics
Of the 115 participants who underwent screening, 82 bronchiectasis patients and 9 healthy controls were included in the final analysis. Twenty-four participants were excluded because of incomplete bacterial culture data or low-quality sequencing results (Figure 1).
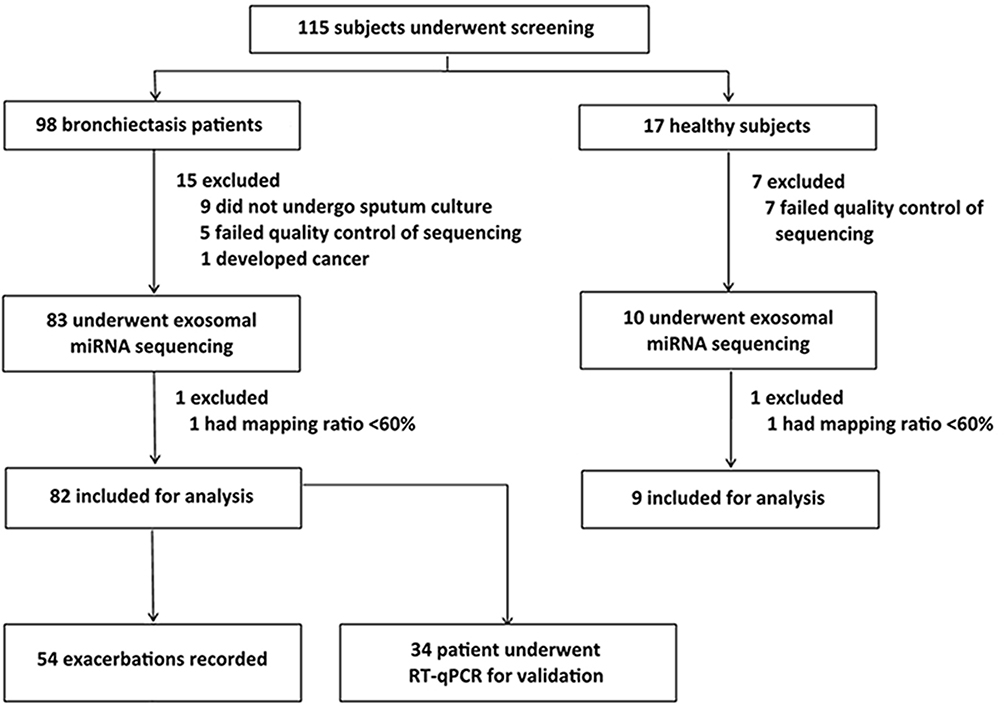 |
Figure 1 Study participants recruitment flow chart. We screened for 115 study participants, 22 of whom yielded sputa with a poor quality and were therefore excluded for sequencing. Two patients whose data for sequencing with low quality were also excluded from further analysis. Hence, the final cohort consisted of 91 study participants (82 with stable bronchiectasis and 9 healthy subjects). |
Table 1 shows the demographic and clinical characteristics of the study participants. Most patients had post-infectious and idiopathic bronchiectasis. Thirty-four bronchiectasis patients (41.5%) had PA colonization, who had worse lung function and greater disease severity than those without. The demographic and clinical characteristics of PA and non-PA group are shown in Table S1, and those in RT-qPCR cohort are shown in Table S2.
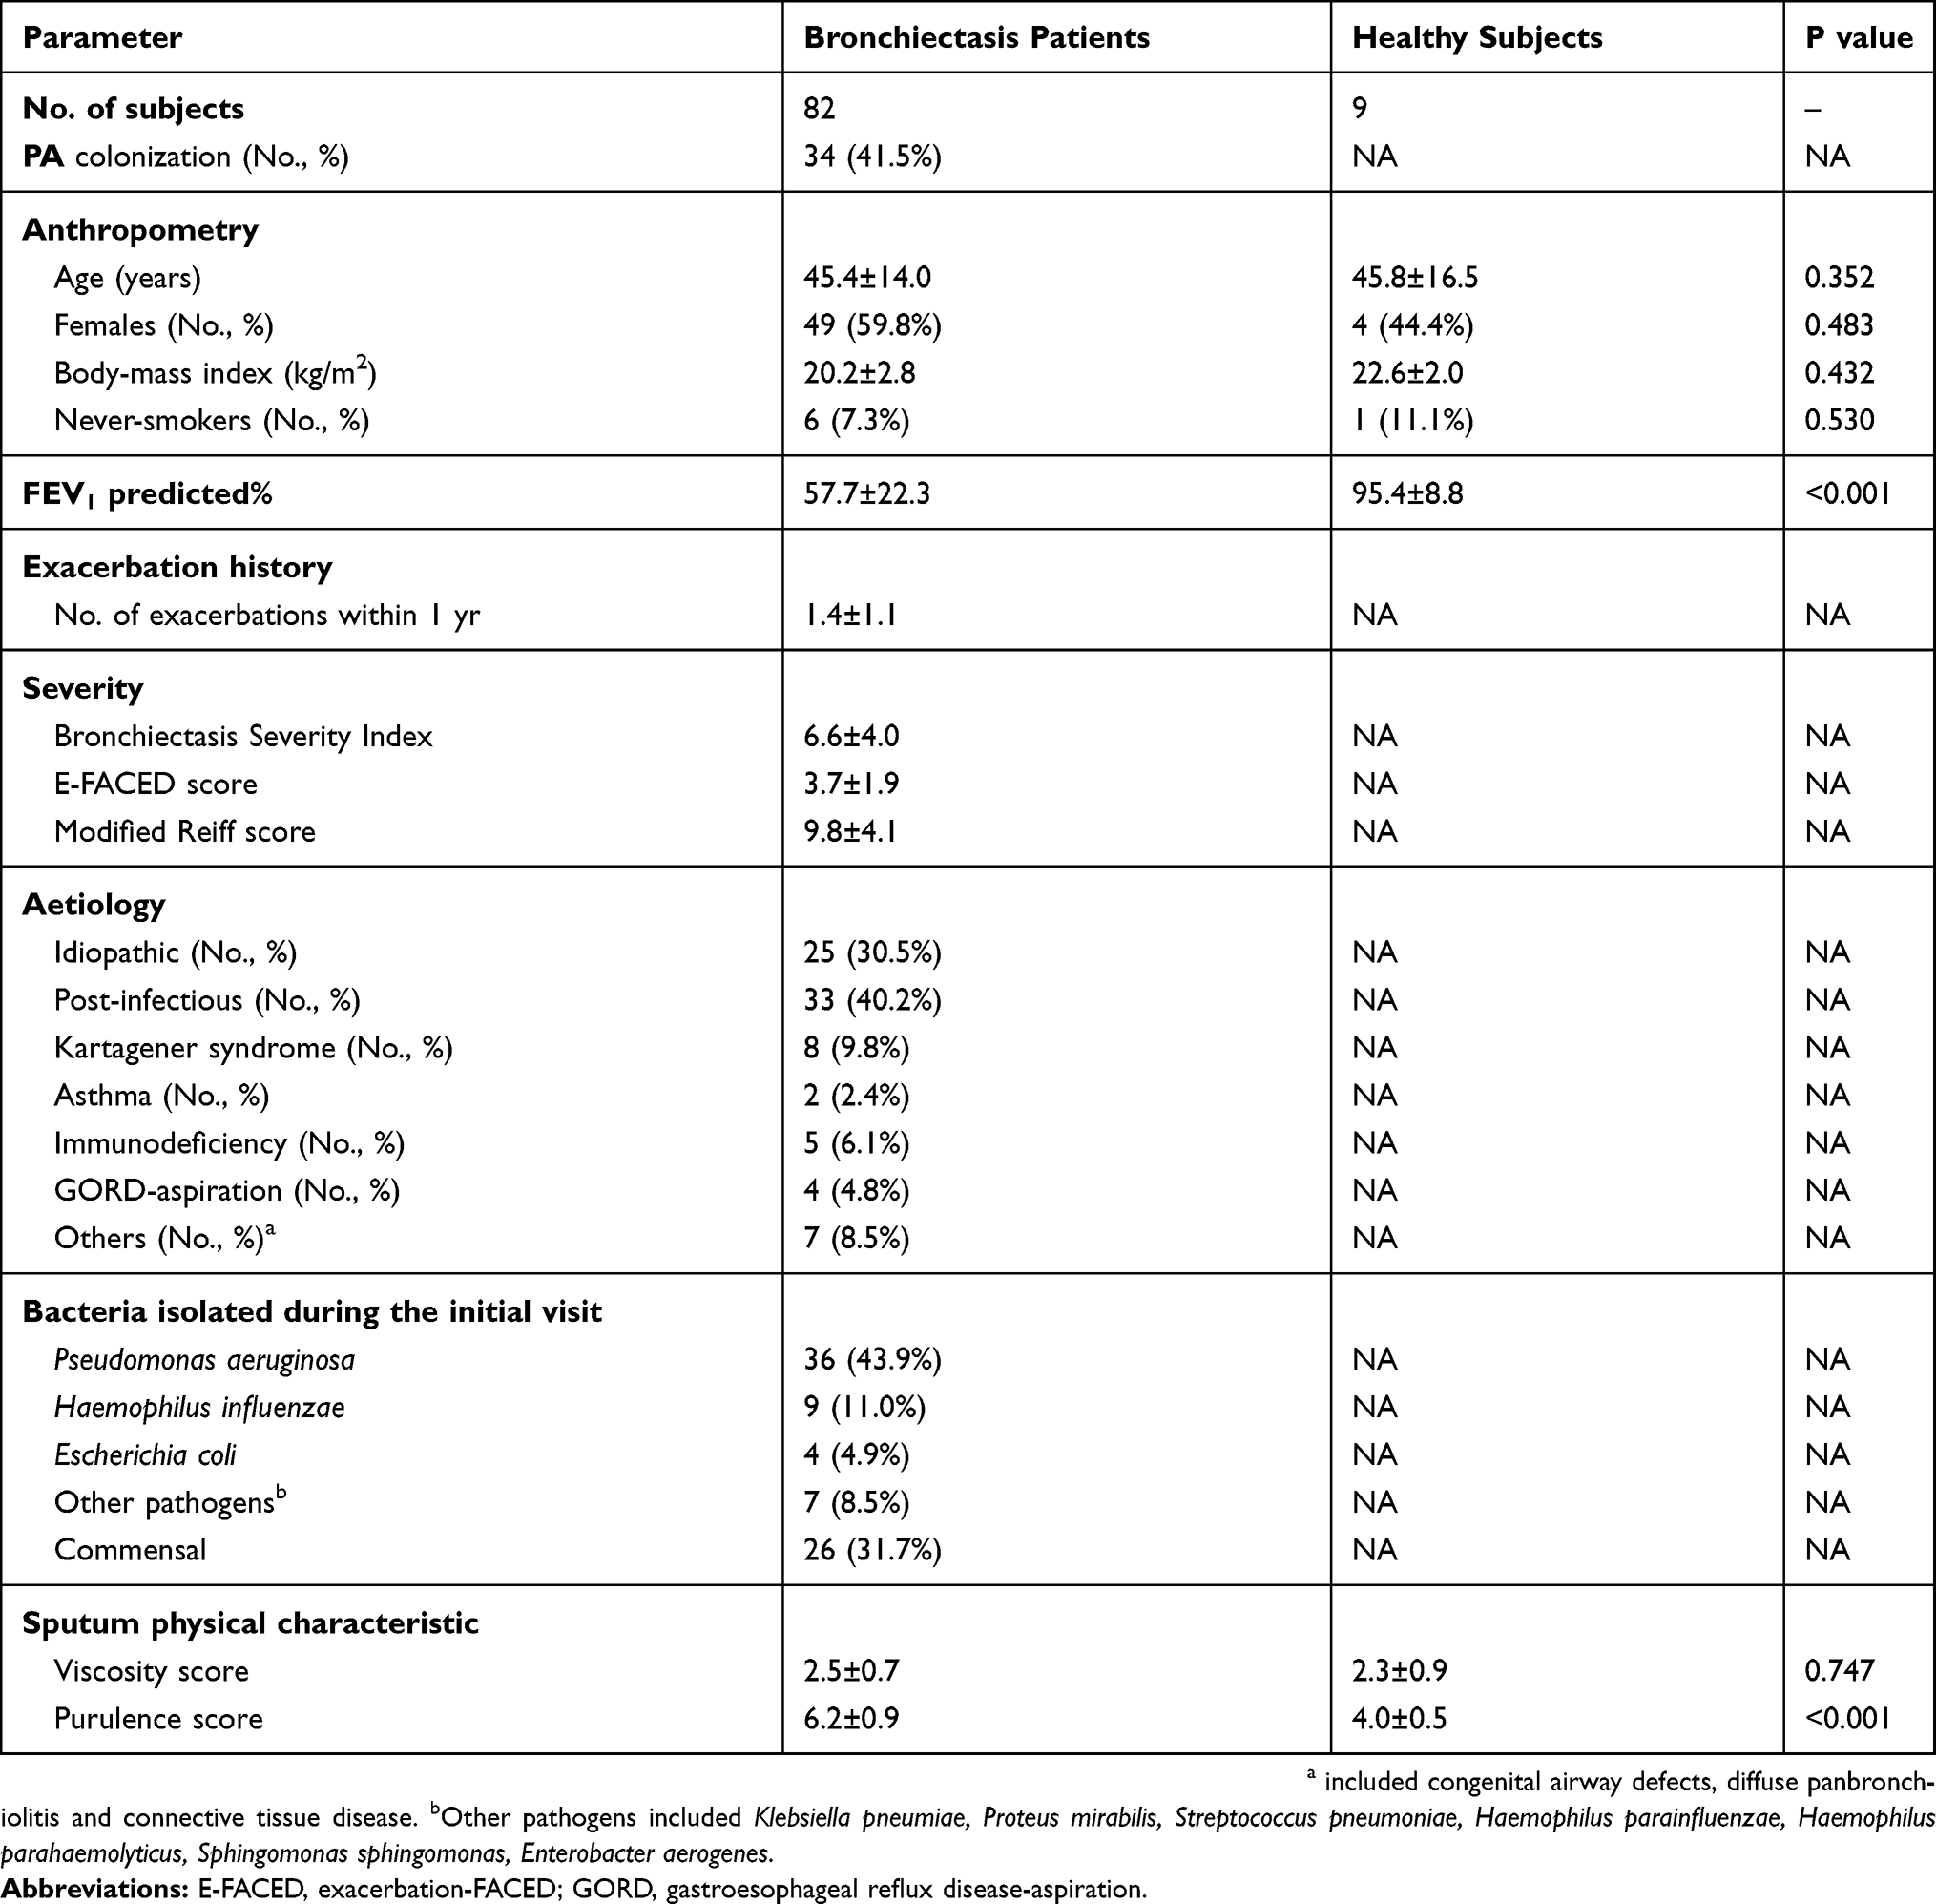 |
Table 1 Clinical Characteristics Of Patients With Clinically Stable Bronchiectasis And Healthy Subjects |
Main Sequencing Findings
We first applied the transmission electron microscope to confirm the successful extraction of extracellular vesicles (50–200 nm, Figure S2). On average, 10 million raw reads per sample were sequenced. We identified 1254 miRNAs in PA group, 1403 miRNAs in non-PA group, and 1132 miRNAs in healthy subjects. Next, we applied PCA and dendrogram to demonstrate the global miRNA expression patterns (Figure S3). There was some separation between PA group and healthy subjects, but less so between PA and non-PA group. The flowchart of the analysis is shown in Figure S4.
DEMs Between PA And Non-PA Group
After quality control of sequencing data, we identified 190 (129 up-regulated and 61 down-regulated) DEMs between all bronchiectasis patients and healthy subjects, and 22 DEMs (FDR<0.10) between PA and non-PA group in bronchiectasis patients. Of these, 10 (5 up-regulated and 5 down-regulated) DEMs in PA group discriminated from both non-PA group and healthy subjects (Figure 2A–C). Figure 2D demonstrates the expression levels of these 10 DEMs in PA and non-PA group. We noted significantly higher levels of miR-628-5p in PA group than in non-PA group (fold-change: 1.72, FDR: 0.03). The expression levels of the overlap DEMs are shown in Table S3.
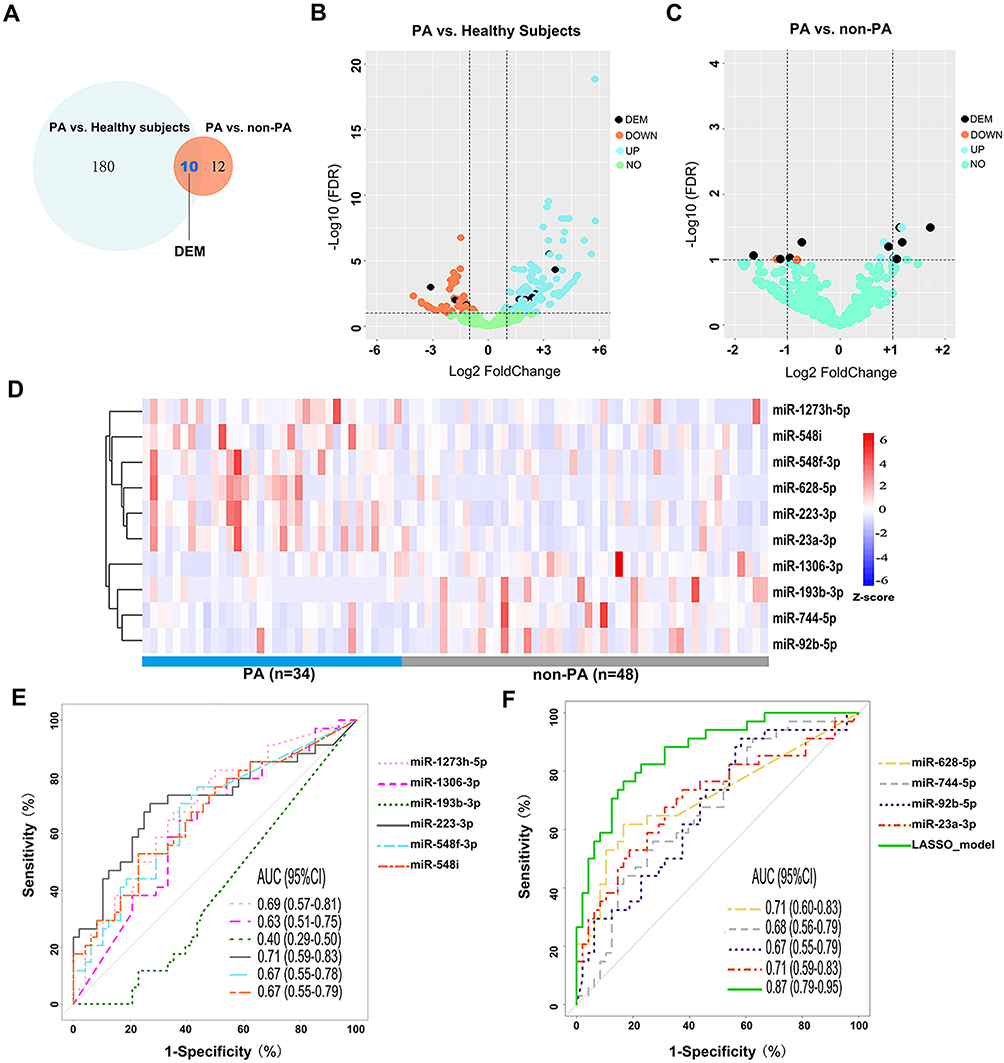 |
Figure 2 miRNA expression differentiating PA colonization status. (A) 190 DEMs were differentially expressed between PA group and healthy subjects, and 22 DEMs between PA group and non-PA group. There were 10 overlapped DEMs for the comparison of PA and non-PA group. Five of the DEMs were down-regulated, whereas five were up-regulated. (B) The volcano plot showing the log2(fold-change) and log2FDR of the 190 differentially expressed miRNAs between PA group and healthy subjects. The vertical line was set at the Log2(fold-change) of +1 and −1, respectively. (C) The volcano plot showing the log2(fold-change) and log2FDR of these 22 differentially expressed miRNAs between bronchiectasis patients with PA colonization and those without (non-PA colonization). The vertical line was set at the Log2(fold-change) of +1 and −1, respectively. (D) A heat map demonstrating 10 DEMs (5 up- and 5 down-regulated) after correction for multiple testing. Each column represents an individual patient sample, and each row represents an miRNA. The color code indicates the expression level, with red indicating higher expression levels and blue indicating lower expression levels. (E, F) Receiver operation characteristic curve demonstrating the diagnostic value of the 10 DEMs and the LASSO regression model to differentiate bronchiectasis patients with PA colonization from those without PA colonization. Abbreviations: PA, P. aeruginosa; DEM, differential expressed miRNA; FDR, false-discovery rate; AUC, area under the curve; Down, down-regulated (lower expression levels) in PA group compared with non-PA; Up, up-regulated (higher expression levels) in PA group compared with non-PA; LASSO, least absolute shrinkage and selection operator linear regression analysis. |
The Diagnostic Value Of DEMs
Next, we analyzed how well the 10 DEMs discriminated against the PA colonization status (Figure 2E and F). Overall, most miRNAs had the modest diagnostic value in discriminating the PA group from non-PA group. miR-628-5p (C-statistic: 0.71, 95% CI: 0.60, 0.83), miR-223-3p (C-statistic: 0.71, 95% CI: 0.59, 0.83), miR-23a-3p (C-statistic: 0.71, 95% CI: 0.59, 0.83) yielded the highest diagnostic value. Other miRNAs yielded the C-statistics ranging from 0.40 to 0.69. To improve the discriminative capacity, we also performed the LASSO regression model in which we included 74 bronchiectasis patients (>90%) in the training set and eight in the validation set. The accuracy of the LASSO model (see details in Online Supplement) to discriminate PA colonization in the validation set was 87.5%. The LASSO model yielded higher diagnostic value (C-statistic: 0.87, 95% CI: 0.79, 0.95) than any single miRNA in discriminating PA colonization.
DEMs Associated With PA Colonization
We performed multiple linear regression analysis to further validate the correlation between PA colonization and miRNA expression. miR-223-3p, miR-23a-3p, miR-628-5p, miR-92b-5p and miR-548f-3p expression significantly and independently correlated with PA colonization (all P<0.05, Table 2), but the remaining five DEMs did not (all P>0.05, Table S4). We validated the former five DEMs with qPCR assay among 34 bronchiectasis patients who had sufficient paired sputum samples. The correlation coefficient of the readings in duplicate wells was 0.943. miR-92b-5p was significantly down-regulated in PA group (fold-change: −2.94, P<0.05), while miR-223-3p trended towards an increased expression in PA group (fold-change: 2.06, P=0.063) compared with non-PA group (Figure S5, Table S5). In light of the discriminative capacity, the significant correlation with PA colonization, we have included miR-223-3p in pathway analysis despite that it narrowly missed the statistical significance in qPCR assays.
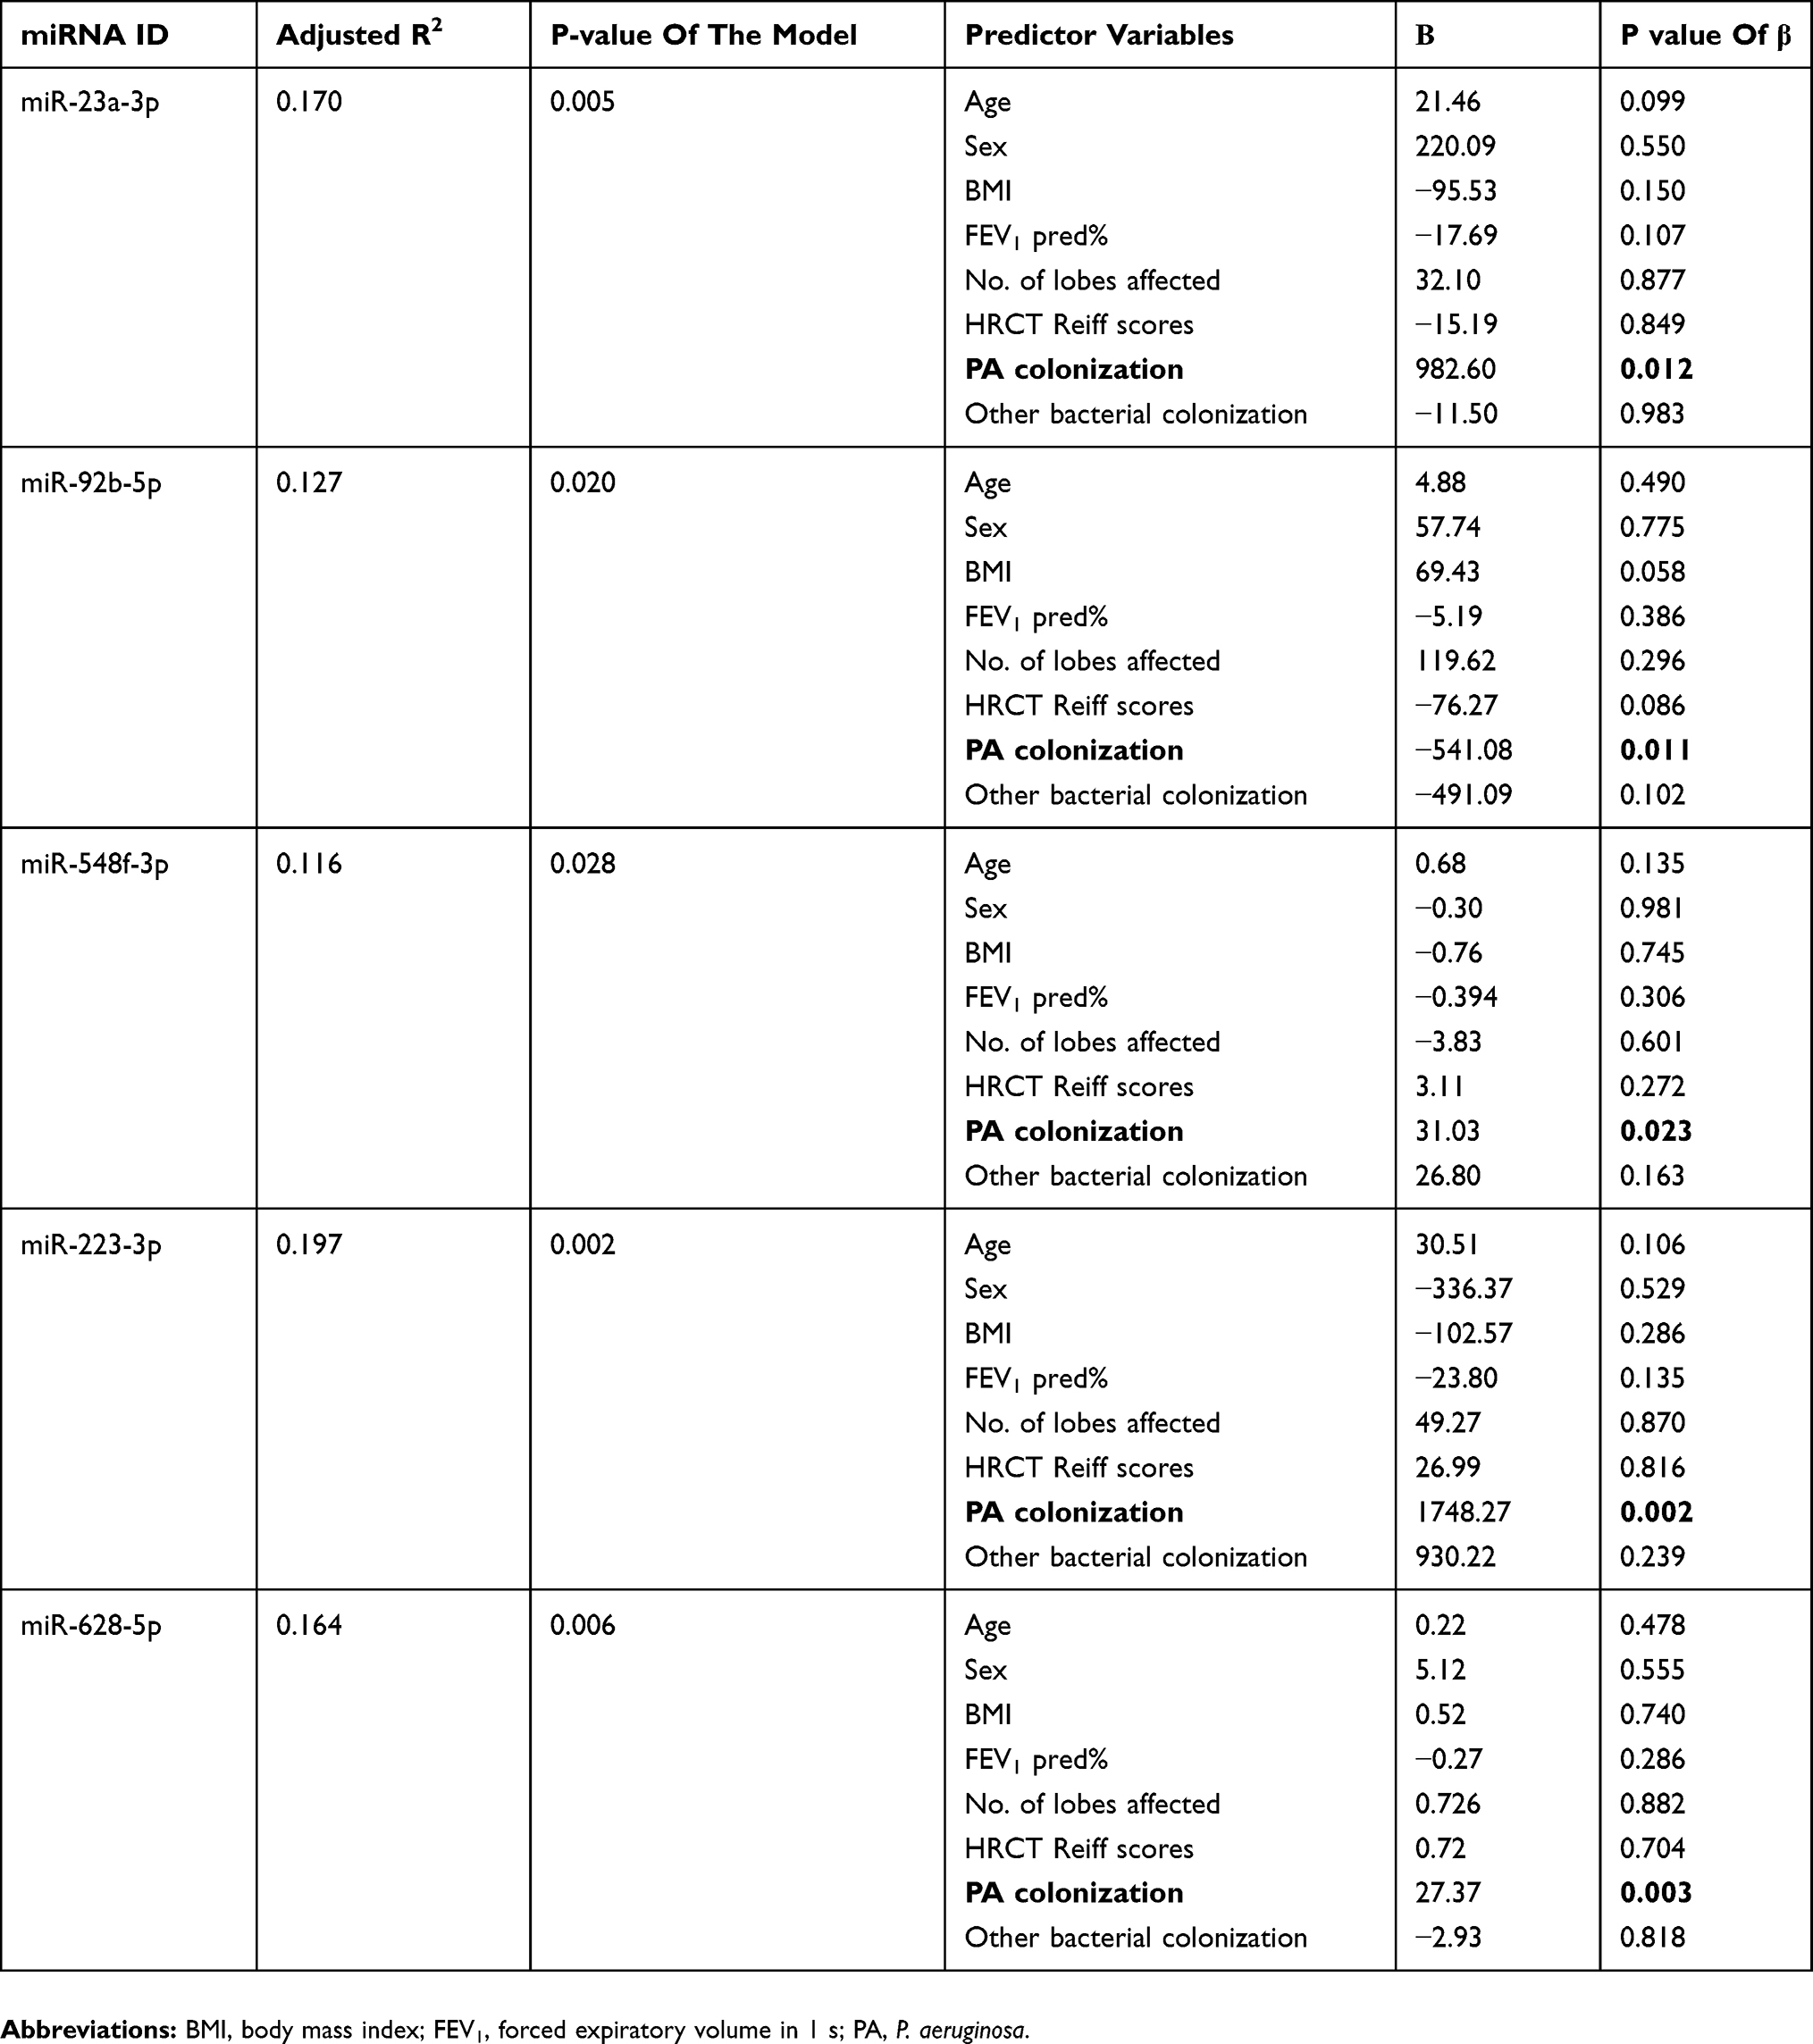 |
Table 2 Multiple Linear Regression Between The DEMs Associated With PA Colonization And Other Clinical Parameters |
miR-92b-5p And miR-223-3p Correlated With The Clinical Parameters In Bronchiectasis
We next explored the correlation between miR-92b-5p and miR-223-3p and the clinical parameters in bronchiectasis (corrected with Benjamini–Hochberg algorithm, Figure 3). The expression level of miR-223-3p correlated negatively with that of miR-92b-5p (r=−0.65 in PA group and −0.61 in non-PA group, both Padj<0.05). The expression level of miR-223-3p positively correlated with that of sputum IL-8 (r=0.61, Padj<0.05), and the expression level of miR-92b-5p negatively correlated with that of sputum IL-1β (r=−0.63, Padj<0.05) and the BSI (r=−0.58, Padj<0.05) in PA group. Moreover, the expression level of miR-92b-5p negatively correlated with that of sputum IL-1β (r=−0.49, Padj<0.05). Neither the expression level of miR-223-3p nor miR-92b-5p correlated with the number of bronchiectatic lobes, lung function or the E-FACED scores. We noted a less prominent correlation between the expression level of miR-223-3p and miR-92b-5p and that of sputum IL-1β in non-PA group than in PA group. Nonetheless, the BSI correlated with the expression level of miR-223-3p (r=0.18, P<0.001) but not miR-92b-5p (Table S6). However, there was no marked difference in the expression levels of miR-223-3p and miR-92b-5p between severe and mild-to-moderate bronchiectasis (both P>0.05, Figure S6).
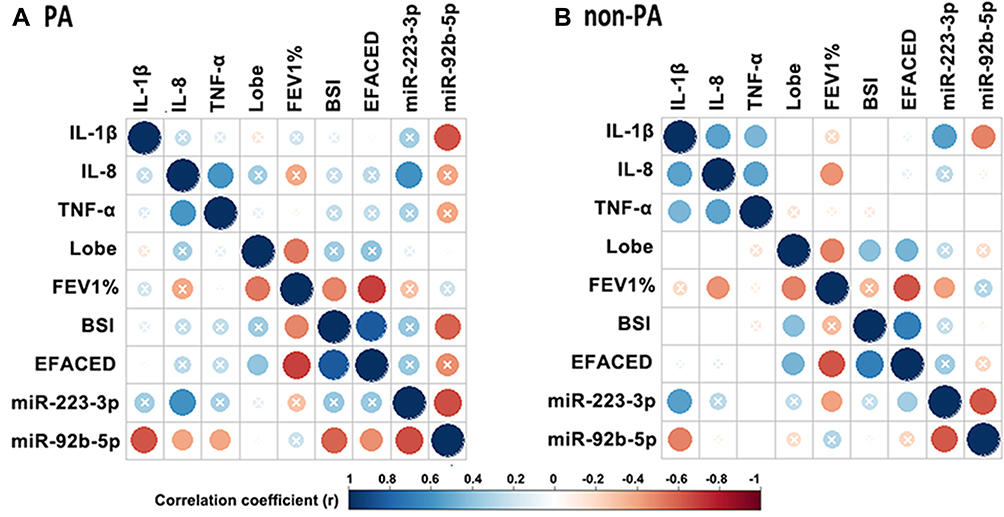 |
Figure 3 miR-92b-5p and miR-223-3p correlated with the clinical parameters of bronchiectasis. (A) Correlation matrix in PA group. (B) Correlation matrix in non-PA group. In both matrices, the lower left quadrant of the matrix represents the crude P values, and the upper right quadrant of the matrix presents the P values corrected with the Benjamini–Hochberg algorithm. The intersection within the circle represents the adjusted P value >0.05. Blue circle indicate positive correlation, while red circles denote negative correlation. Greater color intensity indicates a greater magnitude of correlation (correlation coefficient). Abbreviations: IL-1β, interleukin-1β; IL-8, interleukin-8; TNF-α, tumor necrosis factor-α; lobe, The number of affected lobes; FEV1%, forced expiratory volume in 1 s; BSI: bronchiectasis severity index; E-FACED, exacerbation-FACED score. |
Biological Pathways Of miR-92b-5p And miR-223-3p
Finally, we analyzed the canonical pathways of miR-223-3p and miR-92b-5p by using clusterProfiler package,22 based on the 826 target mRNAs of these two DEMs that were predicted by the DIANA-microT web server version 5.0 and validated with the DIANA-TarBase version 8.0 database.23,24
Gene Ontology Analysis
We identified the biological processes associated with inflammation, such as leukocyte differentiation, cellular response to oxidative stress. See further details in Figure S7.
KEGG And Genomic Analysis
KEGG analysis revealed 12 canonical pathways, five of which were not further analyzed because they were related to cancer pathways. Table 3 shows the most significant pathways of the annotated mRNAs. The interaction network of mRNAs was classified into four domains: inflammatory processes, hormonal responses, lung aging and stem cell (in which the nuclear factor-κB [NF-κB] signaling pathway, phosphatidylinositol signaling system were the top enriched pathways in the inflammatory processes). See Figure S8 regarding all enriched signaling pathways.
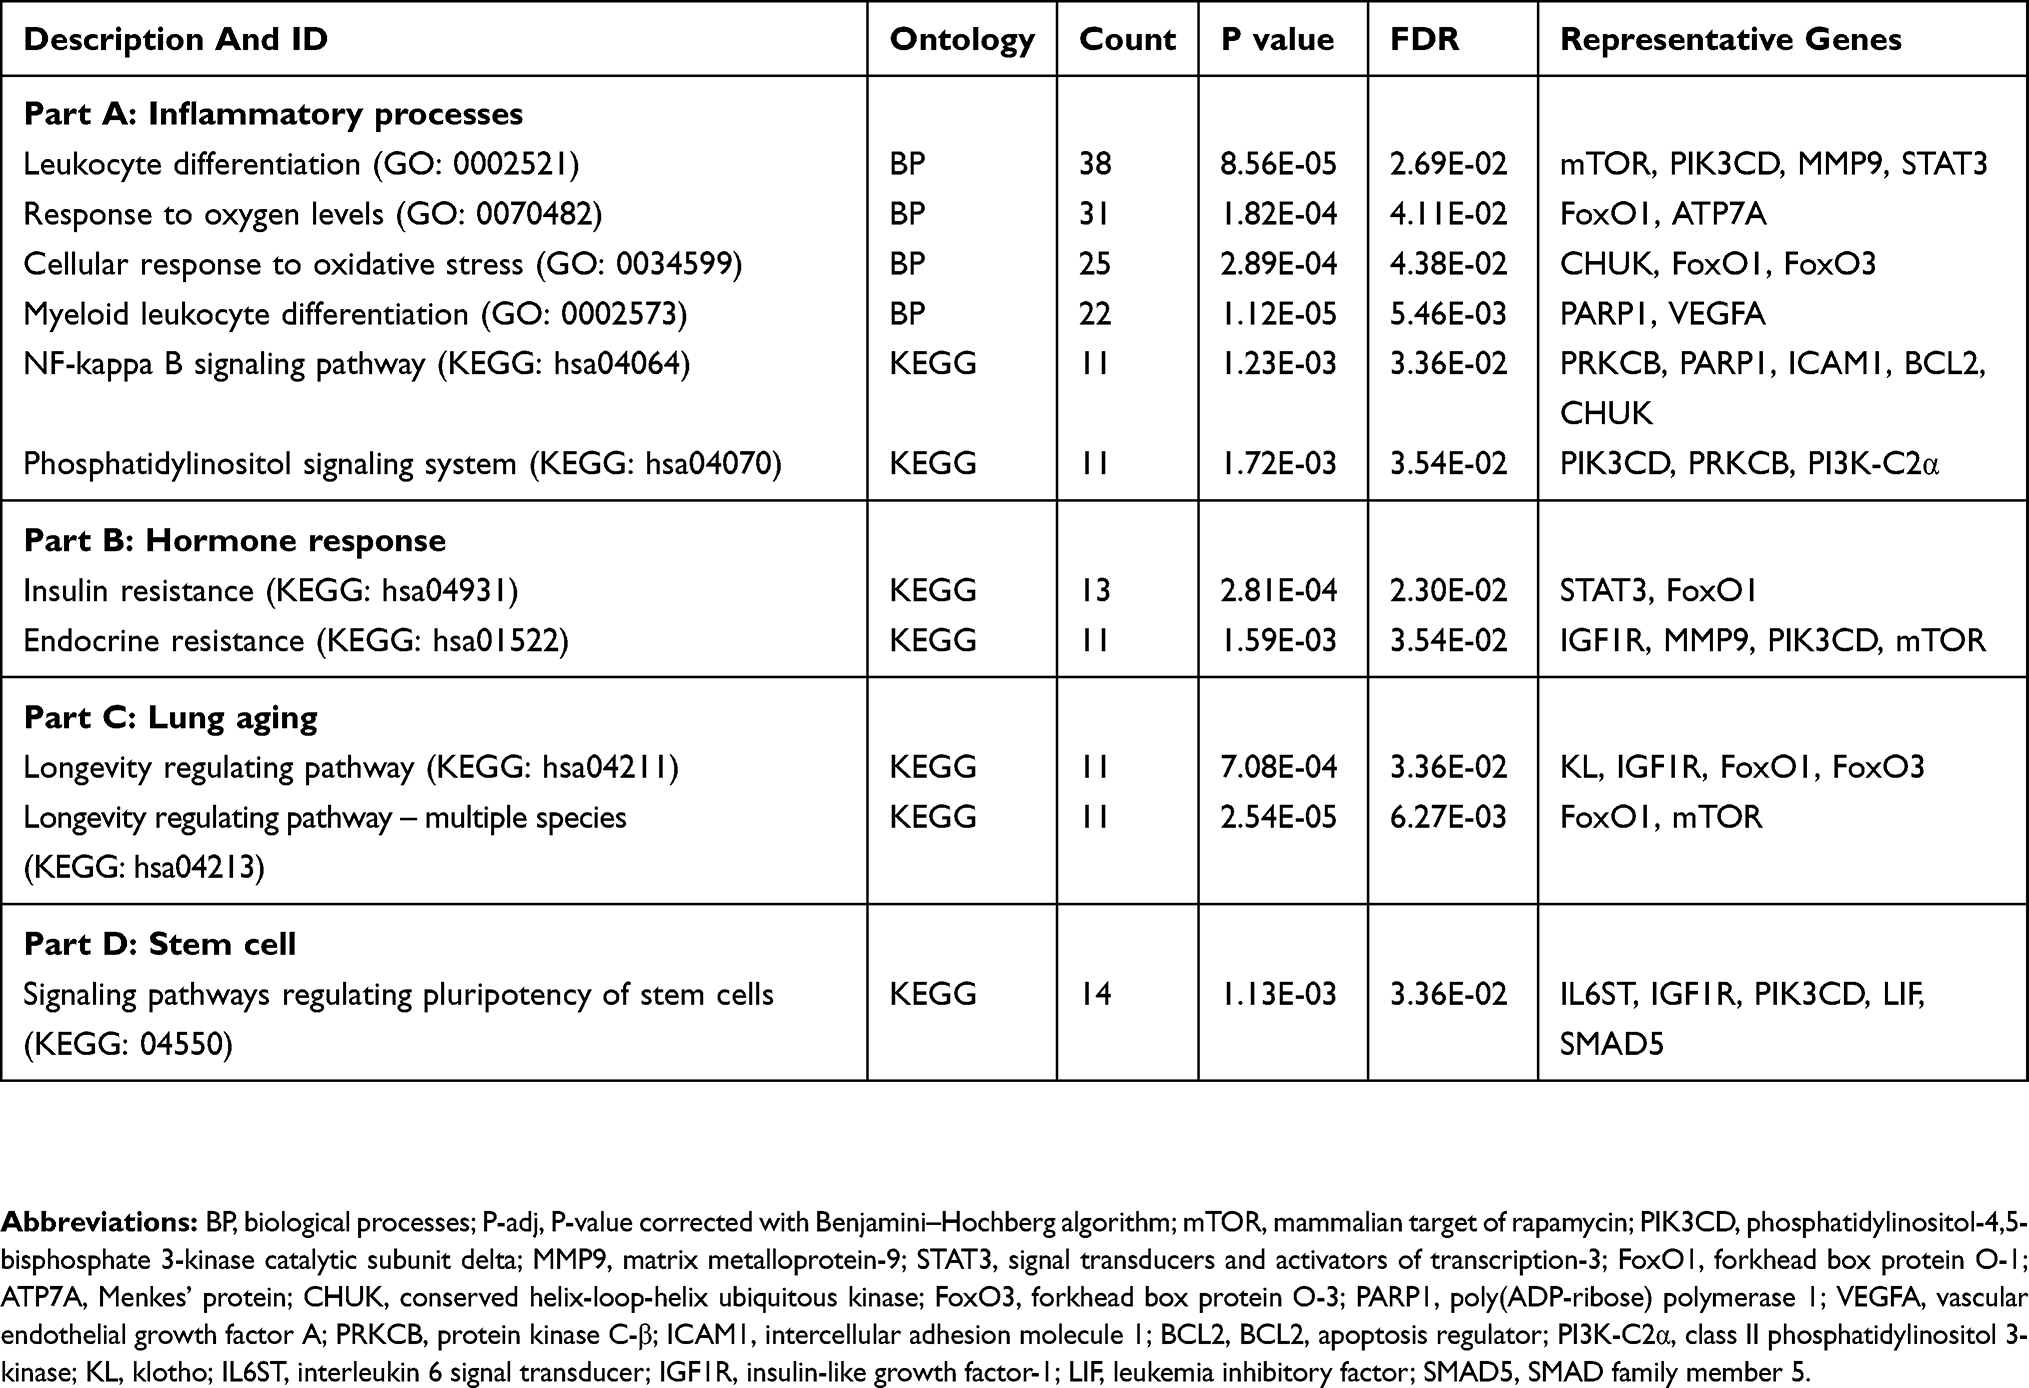 |
Table 3 The Significant Biological Pathways Of The DEMs Associated With PA Colonization In Bronchiectasis Patients |
Discussion
PA is a common opportunistic pathogen which correlates with poor prognosis in bronchiectasis.25 The known mechanisms included airway epithelial injury26,27 and toxin secretions (such as cyanide and pyocyanin).28,29 However, little is known regarding other candidate biological pathways underlying the adverse impacts of PA in bronchiectasis. We have detected sputum exosomal DEMs and analyzed their ability to discriminate PA colonization status and the correlation with clinical parameters in bronchiectasis. miR-223-3p and miR-92b-5p, which correlated significantly with sputum inflammatory biomarkers, were implicated in nuclear factor-κB, phosphatidylinositol and longevity regulation pathways. However, neither miR-223-3p nor miR-92b-5p correlated significantly with bronchiectasis severity (the BSI).
Previous studies demonstrated that sputum exosomes could be successfully extracted for biomarker assays,30–34 which was supported by our findings. Exosomal miRNAs play vital roles in mediating infection and inflammation in many chronic airway inflammatory diseases. For instance, miRNA expression in airway epithelial cells differed significantly between patients with cystic fibrosis and healthy subjects, and between patients with and without PA infection.35 Specifically, miR-223 was up-regulated along with increased IL-8 levels in the cells from patients with ΔF508 mutation35 in those with PA infection. miR-223 reportedly modulated the physiologic function of cystic fibrosis transmembrane conductance regulator and airway IL-8 expression, which might be the target of PA colonization in bronchiectasis. In neutrophilic asthma, miR-223 was up-regulated and positively correlated with sputum IL-1β levels.36 These observations hinted on how PA colonization might interact with the airway inflammation via miRNA modulation in bronchiectasis.
The inflammatory signaling pathways and the accelerated lung senescence might be associated with PA colonization in bronchiectasis. Upon PA infection, airway epithelial-derived exosomes37 stimulated toll-like receptor 4/MyD88/NF-κB signaling pathways.7 Increased levels of IL-8 of epithelial cells have also been detected in cystic fibrosis patients with PA infection.38 Congruent with these findings, our findings hinted on the potential link among PA colonization, altered miRNA expression, and NF-κB signaling pathway in bronchiectasis. Our findings suggested the significant correlation between miR-223-3p expression and sputum IL-8 levels, and between miR-92b-5p expression and sputum IL-1β levels. Phosphatidylinositol signaling pathway might also play a role in modulating inflammation associated with PA colonization in bronchiectasis. In fact, PA infection reportedly triggered the formation of airway epithelial cell protrusions leading to activation of phosphatidylinositol and NF-κB signaling pathways.39 Meanwhile, the toxin pyocyanin released by PA could mediate oxidative stress of airway epithelial cells by inducing the expression of antioxidative gene via the epidermal growth factor receptor-PI3K signaling pathway,40 which implied that phosphatidylinositol signaling pathway might play a role in bronchiectasis patients with PA colonization.
Apart from the inflammation-related pathways, longevity regulation pathway (ageing) might have also affected the prognosis of bronchiectasis associated with PA colonization. Ageing of the immune system predisposed to infection of opportunistic pathogens such as PA.41 In turn, PA infection accelerated cell senescence via NF-κB signaling pathway, which further hampered the eradication of PA.42 Collectively, our findings provide some hints on the complex network underlying the pathogenesis of bronchiectasis associated with PA colonization.
Our findings have clinical implications. Identification of sputum exosomal miRNA helps explore the important biological pathways underlying the pathogenesis of bronchiectasis, thus miRNAs and their pathways might serve as the complementary tool to explore for the candidate targets for future interventions of PA colonization. Apart from canonical inflammatory pathways, our results have implied the modulation of longevity regulation pathway which opens a new avenue for exploring how PA colonization interacts with the airway epithelium. The significant correlation between sputum inflammatory biomarkers and miR-92b-5p and miR-223-3p provided further evidence on the unresolved inflammation in the PA-colonized microenvironment.
There are notable limitations of our study. First, we compared miRNA expression in spontaneous sputum in bronchiectasis and in induced sputum in healthy subjects. Because all bronchiectasis patients could spontaneously produce sputum, we did not collect induced sputum in bronchiectasis patients. Salivary contamination has been minimized based on our experimental collection procedures. Second, the differential expression of miR-223-3p between PA and non-PA group did not reach to statistical significance (P=0.063) according to the qPCR assays given the insufficient sputum volume in the remaining patients. However, based on the discriminative capacity and the significant correlation with PA colonization and the fold-change of differential expression in both sequencing and qPCR assays, our findings of miR-223-3p expression patterns remained valid. We did not investigate the interactions between miRNA and mRNA. Besides, the association among airway neutrophilic inflammation, miRNA expression and PA colonization in bronchiectasis merits further investigation. Despite the efforts of identifying patients with PA colonization during longitudinal follow-up, we might have still underestimated the risk of misclassification (false-negative cases). Finally, all biological pathways were explored via bioinformatic analysis, further confirmatory experiments are warranted.
In summary, we have identified the differentially expressed sputum exosomal miRNA (miR-223-3p and miR-92b-5p) in bronchiectasis patients with PA colonization. The activation of inflammation and aging regulation pathways might provide clues for the intervention of PA colonization in bronchiectasis.
Acknowledgments
We thank Hong-kai Wu (State Key Laboratory of Respiratory Disease, Guangzhou, China) for bioinformatics analysis assistance and the technicians (Beijing Novogene Co. Ltd., Tianjin, China) for technical assistance and advice.
Author Contributions
All authors contributed to data analysis, drafting and revising the article, gave final approval of the version to be published, and agree to be accountable for all aspects of the work.
Disclosure
The authors report no conflicts of interest in this work.
References
1. Polverino E, Goeminne PC, McDonnell MJ, et al. European Respiratory Society guidelines for the management of adult bronchiectasis. Eur Respir J. 2017;3:1700629. doi:10.1183/13993003.00629-2017
2. Guan WJ, Gao YH, Xu G, et al. Sputum bacteriology in steady-state bronchiectasis in Guangzhou, China. Int J Tuberc Lung Dis. 2015;5:610–6193. doi:10.5588/ijtld.14.0613
3. Williams BJ, Dehnbostel J, Blackwell TS. Pseudomonas aeruginosa: host defence in lung diseases. Respirology. 2010;7:1037–1056. doi:10.1111/j.1440-1843.2010.01819.x
4. Finch S, McDonnell MJ, Abo-Leyah H, Aliberti S, Chalmers JD. A comprehensive analysis of the impact of Pseudomonas aeruginosa colonization on prognosis in adult bronchiectasis. Ann Am Thorac Soc. 2015;11:1602–16115.
5. Chalmers JD, Goeminne P, Aliberti S, et al. The bronchiectasis severity index. An international derivation and validation study. Am J Respir Crit Care Med. 2014;5:576–585. doi:10.1164/rccm.201309-1575OC
6. Maltby S, Plank M, Tay HL, Collison A, Foster PS. Targeting MicroRNA function in respiratory diseases: mini-review. Front Physiol. 2016;7:21. doi:10.3389/fphys.2016.00021
7. Li X, He S, Li R, et al. Pseudomonas aeruginosa infection augments inflammation through miR-301b repression of c-Myb-mediated immune activation and infiltration. Nat Microbiol. 2016;10:16132. doi:10.1038/nmicrobiol.2016.132
8. Eissa NT. The exosome in lung diseases: message in a bottle. J Allergy Clin Immunol. 2013;3:904–905. doi:10.1016/j.jaci.2013.01.021
9. Latorre I, Leidinger P, Backes C, et al. A novel whole-blood miRNA signature for a rapid diagnosis of pulmonary tuberculosis. Eur Respir J. 2015;4:1173–1176. doi:10.1183/09031936.00221514
10. Alexander M, Hu R, Runtsch MC, et al. Exosome-delivered microRNAs modulate the inflammatory response to endotoxin. Nat Commun. 2015;6:7321. doi:10.1038/ncomms8321
11. Hill AT, Haworth CS, Aliberti S, et al. EMBARC/BRR definitions working group. Pulmonary exacerbation in adults with bronchiectasis: a consensus for definition for clinical research. Eur Resp J. 2017;6:1700051. doi:10.1183/13993003.00051-2017
12. Reiff DB, Wells AU, Carr DH, Cole PJ, Hansell DM. CT findings in bronchiectasis limited value in distinguishing between idiopathic and specific types. Am J Radiol. 1995;165:261–267.
13. Bedi P, Chalmers JD, Goeminne PC, et al. The BRICS (Bronchiectasis radiologically indexed CT score): a multicenter study score for use in idiopathic and postinfective bronchiectasis. Chest. 2018;5:1177–1186. doi:10.1016/j.chest.2017.11.033
14. Guan WJ, Gao YH, Xu G, et al. Aetiology of bronchiectasis in Guangzhou, southern China. Respirology. 2015;5:739–748. doi:10.1111/resp.12528
15. Martinez-Garcia MA, Athanazio RA, Girón R, et al. Predicting high risk of exacerbations in bronchiectasis: the E-FACED score. Int J Chron Obstruct Pulmon Dis. 2017;12:275–284. doi:10.2147/COPD.S121943
16. Jiang K, Poppenberg KE, Wong L, et al. RNA sequencing data from neutrophils of patients with cystic fibrosis reveals potential for developing biomarkers for pulmonary exacerbations. J Cyst Fibros. 2018;
17. Wagner GP, Kin K, Lynch VJ. Measurement of mRNA abundance using RNA-seq data: RPKM measure is inconsistent among samples. Theory Biosci. 2012;4:281–285. doi:10.1007/s12064-012-0162-3
18. Chen H, Xing K, He X. The dJ/dS ratio test reveals hundreds of novel putative cancer drivers. Mol Biol Evol. 2015;8:2181–2185. doi:10.1093/molbev/msv083
19. Bell A, Bell D, Chakravarti N, Ma J, Henton N, Prieto VG. Detection of a MicroRNA molecular signature of ultraviolet radiation in the superficial regions of melanocytic nevi on sun-exposed skin. Mod Pathol. 2018;11:1744–1755. doi:10.1038/s41379-018-0088-5
20. Liu Y, Baker S, Jiang H, Stuart G, Bai Y. Correlating bladder cancer risk genes with their targeting microRNAs using MMiRNA-Tar. Genomics Proteomics Bioinformatics. 2015;3:177–182. doi:10.1016/j.gpb.2015.05.003
21. Zhang JX, Song W, Chen ZH, et al. Prognostic and predictive value of a microRNA signature in stage II colon cancer: a microRNA expression analysis. Lancet Oncol. 2013;13:1295–1306. doi:10.1016/S1470-2045(13)70491-1
22. Yu G, Wang LG, Han Y, He QY. clusterProfiler: an R package for comparing biological themes among gene clusters. OMICS. 2012;5:284–287. doi:10.1089/omi.2011.0118
23. Paraskevopoulou MD, Georgakilas G, Kostoulas N, et al. DIANA-microT web server v5.0: service integration into miRNA functional analysis workflows. Nucleic Acids Res. 2013;41:W169–W173. doi:10.1093/nar/gkt393
24. Karagkouni D, Paraskevopoulou MD, Chatzopoulos S, et al. DIANA-TarBase v8: a decade-long collection of experimentally supported miRNA-gene interactions. Nucleic Acids Res. 2018;D1:D239–D245. doi:10.1093/nar/gkx1141
25. Martínez-García MA, Soler-Cataluña JJ, Perpiñá-Tordera M, Román-Sánchez P, Soriano J. Factors associated with lung function decline in adult patients with stable non-cystic fibrosis bronchiectasis. Chest. 2007;5:1565–1572. doi:10.1378/chest.07-0490
26. Landsperger WJ, Kelly-Wintenberg KD, Montie TC, et al. Inhibition of bacterial motility with human antiflagellar monoclonal antibodies attenuates Pseudomonas aeruginosa-induced pneumonia in the immunocompetent rat. Infect Immun. 1994;62:4825–4830.
27. Chua SL, Yam JK, Hao P, et al. Selective labelling and eradication of antibiotic-tolerant bacterial populations in Pseudomonas aeruginosa biofilms. Nat Commun. 2016;7:10750. doi:10.1038/ncomms10750
28. O’Malley YQ, Reszka KJ, Spitz DR, Denning GM, Britigan BE. Pseudomonas aeruginosa pyocyanin directly oxidizes glutathione and decreases its levels in airway epithelial cells. Am J Physiol Lung Cell Mol Physiol. 2004;287:L94–L103. doi:10.1152/ajplung.00025.2004
29. Gilbert KB, Kim TH, Gupta R, Greenberg EP, Schuster M. Global position analysis of the Pseudomonas aeruginosa quorum-sensing transcription factor LasR. Mol Microbiol. 2009;73:1072–1085. doi:10.1111/mmi.2009.73.issue-6
30. Porro C, Lepore S, Trotta T, et al. Isolation and characterization of microparticles in sputum from cystic fibrosis patients. Respir Res. 2010;11:94. doi:10.1186/1465-9921-11-94
31. Njock MS, Guiot J, Henket MA, et al. Sputum exosomes promising biomarkers for idiopathic pulmonary fibrosis. Thorax. 2018;
32. Sánchez-Vidaurre S, Eldh M, Larssen P, et al. RNA-containing exosomes in induced sputum of asthmatic patients. J Allergy Clin Immunol. 2017;5:1459–1461.e2. doi:10.1016/j.jaci.2017.05.035
33. Enderle D, Spiel A, Coticchia CM, et al. Characterization of RNA from exosomes and other extracellular vesicles isolated by a novel spin column based method. PLoS One. 2015;8:e0136133. doi:10.1371/journal.pone.0136133
34. Stranska R, Gysbrechts L, Wouters J, et al. Comparison of membrane affinity-based method with size exclusion chromatography for isolation of exosome like vesicles from human plasma. J Transl Med. 2018;1:1. doi:10.1186/s12967-017-1374-6
35. Oglesby IK, Chotirmall SH, McElvaney NG, Greene CM. Regulation of cystic fibrosis transmembrane conductance regulator by microRNA-145, -223, and -494 is altered in ΔF508 cystic fibrosis airway epithelium. J Immunol. 2013;7:3354–3362. doi:10.4049/jimmunol.1202960
36. Maes T, Cobos FA, Schleich F, et al. Asthma inflammatory phenotypes show differential microRNA expression in sputum. J Allergy Clin Immunol. 2016;5:1433–1446. doi:10.1016/j.jaci.2016.02.018
37. Szul T, Bratcher PE, Fraser KB, et al. Toll-like receptor 4 engagement mediates prolyl endopeptidase release from airway epithelia via exosomes. Am J Respir Cell Mol Biol. 2016;3:359–369. doi:10.1165/rcmb.2015-0108OC
38. Fabbri E, Borgatti M, Montagner G, et al. Expression of microRNA-93 and interleukin-8 during Pseudomonas aeruginosa-mediated induction of proinflammatory responses. Am J Respir Cell Mol Biol. 2014;6:1144–1155. doi:10.1165/rcmb.2013-0160OC
39. Tran CS, Eran Y, Ruch TR, et al. Host cell polarity proteins participate in innate immunity to Pseudomonas aeruginosa infection. Cell Host Microbe. 2014;5:636–643. doi:10.1016/j.chom.2014.04.007
40. Xu Y, Duan C, Kuang Z, Hao Y, Jeffries JL, Lau GW. Pseudomonas aeruginosa pyocyanin activates NRF2-ARE-mediated transcriptional response via the ROS-EGFR-PI3K-AKT/MEK-ERK MAP kinase signaling in pulmonary epithelial cells. PLoS One. 2013;8:e72528. doi:10.1371/journal.pone.0072528
41. King CD, Singh D, Holden K, et al. Proteomic identification of virulence-related factors in young and aging C. elegans infected with Pseudomonas aeruginosa. J Proteomics. 2018;181:92–103. doi:10.1016/j.jprot.2018.04.006
42. Li H, Luo YF, Wang YS, et al. Using ROS as a second messenger, NADPH oxidase 2 mediates macrophage senescence via interaction with NF-κB during Pseudomonas aeruginosa Infection. Oxid Med Cell Longev. 2018;2018:9741838. doi:10.1155/2018/9741838
 © 2019 The Author(s). This work is published and licensed by Dove Medical Press Limited. The
full terms of this license are available at https://www.dovepress.com/terms
and incorporate the Creative Commons Attribution
- Non Commercial (unported, 3.0) License.
By accessing the work you hereby accept the Terms. Non-commercial uses of the work are permitted
without any further permission from Dove Medical Press Limited, provided the work is properly
attributed. For permission for commercial use of this work, please see paragraphs 4.2 and 5 of our Terms.
© 2019 The Author(s). This work is published and licensed by Dove Medical Press Limited. The
full terms of this license are available at https://www.dovepress.com/terms
and incorporate the Creative Commons Attribution
- Non Commercial (unported, 3.0) License.
By accessing the work you hereby accept the Terms. Non-commercial uses of the work are permitted
without any further permission from Dove Medical Press Limited, provided the work is properly
attributed. For permission for commercial use of this work, please see paragraphs 4.2 and 5 of our Terms.