")
Back to Journals » OncoTargets and Therapy » Volume 13
SPOCD1 accelerates ovarian cancer progression and inhibits cell apoptosis via the PI3K/AKT pathway
Authors Liu D, Yang Y, Yan A, Yang Y
Received 4 January 2019
Accepted for publication 29 May 2019
Published 15 January 2020 Volume 2020:13 Pages 351—359
DOI https://doi.org/10.2147/OTT.S200317
Checked for plagiarism Yes
Review by Single anonymous peer review
Peer reviewer comments 2
Editor who approved publication: Prof. Dr. Takuya Aoki
Dajiang Liu, 1,* Yuan Yang, 2,* Aiqin Yan, 3,* Yongxiu Yang 1
1Department of Obstetrics and Gynecology, The First Hospital of Lan Zhou University, Lanzhou, China; 2The Reproductive Medicine Special Hospital, The First Hospital of Lanzhou University, Lanzhou, China; 3Department of Obstetrics and Gynecology, Zhang ye People’s Hospital Affiliated to Hexi University, Zhangye, China
*These authors contributed equally to this work
Correspondence: Yongxiu Yang
Department of Obstetrics and Gynecology, The First Hospital of Lan Zhou University, No.1 Donggang West Road, Chengguan District, Lanzhou, Gansu Province, People’s Republic of China
Tel +86 1 380 931 8605
Email [email protected]
Background: Ovarian cancer (OC) is the most common type of gynecological malignant tumors with poor prognosis. The spen paralogue and orthologue C-terminal domain containing 1 (SPOCD1) is a newly identified molecule that has been indicated to discriminate progressive in human solid tumors. However, the role of SPOCD1 in OC remains unknown.
Methods: The expression of SPOCD1 in OC and non-cancerous tissue was detected by Realtime polymerase chain reaction and immunohistochemical staining. The expression of SPOCD1 in OC cells (SKOV3 and CAOV3) was also detected by immunohistochemical staining. The effect of SPOCD1 on cell proliferation was analyzed by Cell Counting Kit 8 and colony formation assay, and cell migration was analyzed by transwell assay. Apoptosis was analyzed by flow cytometry. The protein expression of SPOCD1, PTEN, PI3K, p-AKT, and mTOR in OC cells was measured by Western blot.
Results: SPOCD1 expression was significantly upregulated in OC tissues compared with non-cancerous tissues (P< 0.01), and was positively correlated to FIGO stage and tumor grade of OC. Also, SPOCD1 was significantly expressed in nucleus and cytoplasm of SKOV3 and CAOV3 cells. Kaplan–Meier analysis indicated that patients with high SPOCD1 expression had shorter overall survival (HR =1.512, 95%CI: 1.321– 2.793, P=0.031) and progression-free survival (HR =1.875, 95%CI: 1.435– 3.157, P=0.028). SPOCD1 was upregulated in OC SKOV3 and CAOV3 cells. Further investigation revealed that downregulation of SPOCD1 inhibited the SKOV3 and CAOV3 cells proliferation and migration. In addition, the deficit of SPOCD1 increased the apoptosis in SKOV3 and CAOV3 cells. PI3K/AKT pathway was inhibited by knockdown of SPOCD1 in SKOV3 and CAOV3 cells.
Conclusions: Our data suggest that SPOCD1 may act as a carcinogenesis factor by activating the PI3K/AKT pathway to restrained cell apoptosis in OC.
Keywords: ovarian cancer, SPOCD1, proliferation, AKT
Introduction
Ovarian cancer (OC) is the leading cause of cancer-associated death among gynecological malignancies in worldwide. An estimated 521,000 new cases and 225,000 deaths occurred in 2015 in China, and 58% of new cases occurred in developing countries.1,2 OC is difficult to early detection and diagnosis due to deep anatomical location, lacking clinical symptoms, and effective index.3 Approximately 70–75% of OC patients have undergone abdominal cavity or distant metastasis at first diagnosis, with five years survival rate only about 30%.4,5 The clinical prognosis of OC is difficult to predict.6,7 Therefore, it is necessary to identify new prognostic biomarkers and therapeutic targets to improve treatment strategies.
The spen paralogue and orthologue C-terminal domain containing 1 (SPOCD1) is a recently identified novel gene that encodes a protein belonging to the transcription factor S-II (TFIIS) family.8 SPOCD1 was initially found to interact with testis protein phosphatase 1 which is a major eukaryotic serine/threonine-specific phosphatase regulating cellular signaling.9 However, the exact role of SPOCD1 in biological processes remains unknown. Recent studies have shown that SPOCD1 can predict progression and prognosis in T1G3 bladder cancer.10 SPOCD1 was overexpressed in gastric tumors and SPOCD1 knocking out reduced gastric cancer cell proliferation, invasion, and migration activities in vitro and in vivo.11,12 Furthermore, SPOCD1 promoted cell proliferation and inhibited cell apoptosis through the regulation of vascular endothelial growth factor A (VEGF-A) in osteosarcoma.13 The PI3K/Akt pathway is frequently changed in OC in an array comparative genomic hybridization studies.14 Meanwhile, the expression levels of both PIK3CA and phosphorylated Akt were analyzed in OC patients and found to be associated with poor survival.15
SPOCD1 expression has not been studied in OC. It is still unclear whether SPOCD1 could serve as a potential biomarker or tumor promoter in OC. Thus, the aim of this study was to characterize the expression and localization of SPOCD1. In addition, correlation analysis was performed to investigate the association between SPOCD1 expression and clinicopathological features and prognosis in OC patients. The mechanisms of SPOCD1 on carcinogenesis in OC cells were explored. Our study might explore new insights into the treatment of OC in clinical practice.
Materials and methods
Complete datasets of 93 OC and 32 non-cancerous tissue samples were obtained from patients undergoing first curative treatment resection in the Department of Obstetrics and Gynecology of the First Hospital of Lanzhou University (Lanzhou, China) between January 2009 and December 2012. None of the enrolled patients received chemotherapy or radiotherapy prior to surgery. Diagnosis and differentiation of OC were defined according to World Health Organization criteria. The characteristics of 93 OC are shown in Table 1. The study was approved by the Ethics Committee of the first Hospital of Lanzhou University, and the specimens were collected after informed consent from each patient. The main clinical and pathological features of these patients were also collected. All the patients got follow-up for five years.
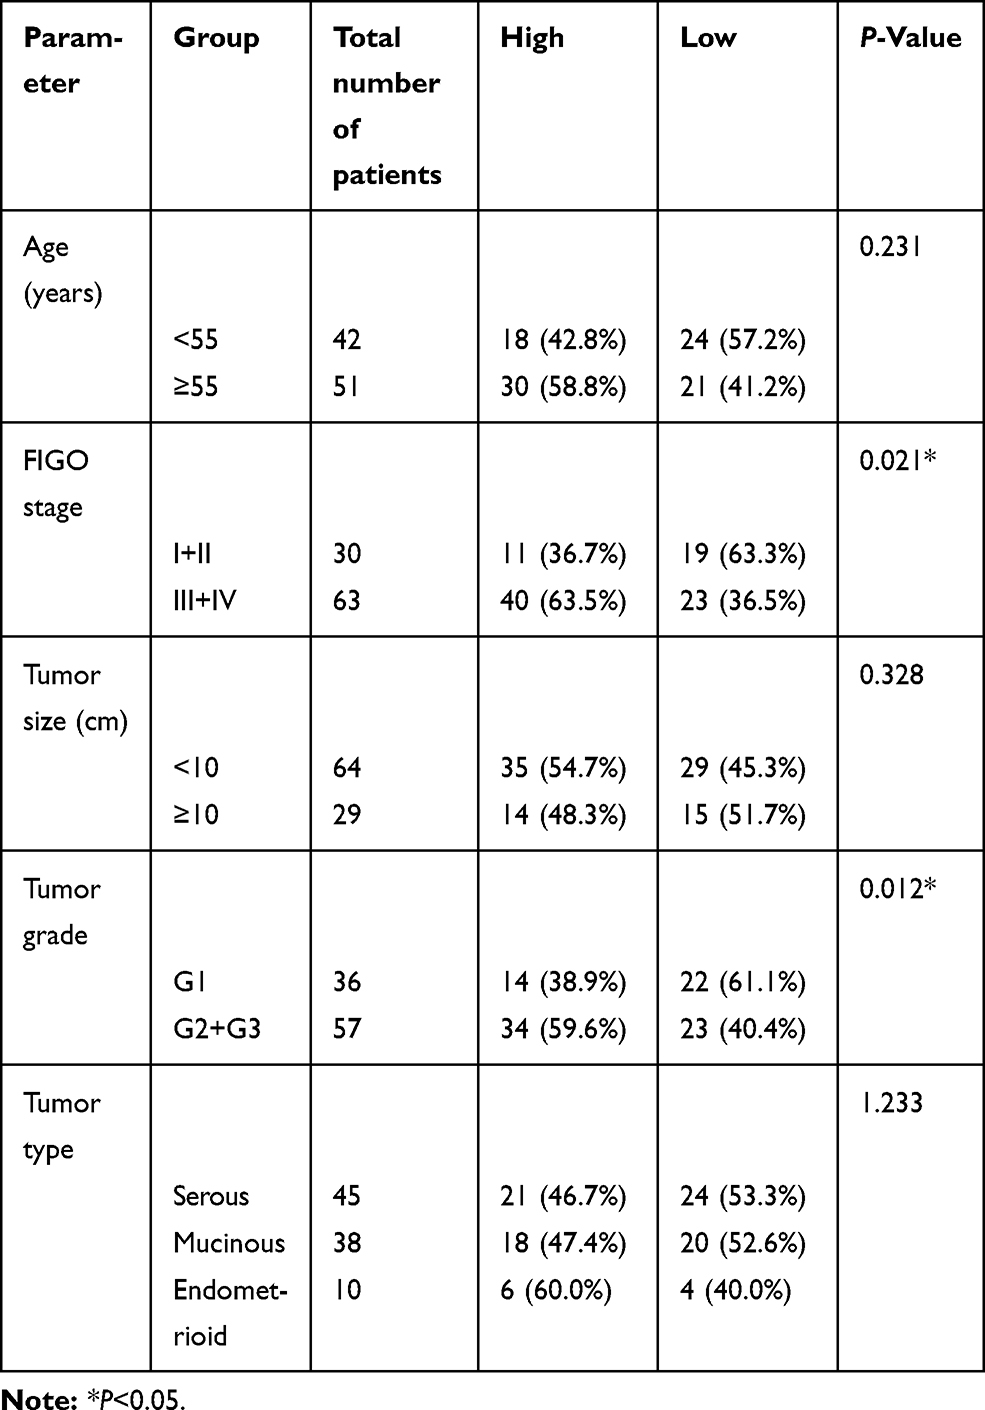 |
Table 1 Correlations between SPOCD1 expression and clinicopathological parameters in ovarian cancer patients |
Immunohistochemistry
The paraffin sections of tissues were dewaxed as routine. Endogenous peroxide activity was blocked by methanol containing 0.3% hydrogen peroxide for 30 mins. After exposure to 10% non-immunized goat serum in PBS for 10 mins, sections were treated at four Cover night with primary rabbit antibodies to SPOCD1 (1:200, Abcam, USA). The sections were then incubated with biotinylated anti-rabbit immunoglobulin serum for 30 mins, followed by incubation with peroxidase-labeled streptavidin for 20 mins at room temperature. Reaction products were visualized by diaminobenzidinetetra hydrochloride as chromogen. Finally, the sections were counter stained with hematoxylin. The percentage was scored as follows: 0 (0%), 1 (0–10%), 2 (10–50%), and 3 (>50%). The intensity was scored as follows: 0 (negative staining), 1 (weak staining), 2 (moderate staining), and 3 (intense staining). The final scores of SPOCD1 expression, ranging from 0 to 9, were calculated by multiplying the percentage score by the intensity score. Patients with a final score of <4 were classified as low expression group and vice versa.
Realtime PCR
Total RNA was extracted by the conventional Trizol method. First-strand cDNA was synthesized with a Prime Script Reverse Transcriptase Kit (GenePharma, Shanghai) according to the manufacturer’s instructions. The specific primers were as follows: GAPDH forward 5ʹ-TCCACCACCCTGTTGTGTA-3ʹ, and reverse 5ʹ-ACCACAGTCCATGCCATCAC-3ʹ; SPOCD1: Forward: 5ʹ-CCCCATGGAGTGAAGCTTGT and Reverse: 5ʹ-GCACCATGGGCCTTTTCTTC-3ʹ.
Western blot
Total protein was extracted and quantified according to the manufacturer’s instructions. Western blot assay was performed as described previously. A polyclonal rabbit anti-human antibody against SPOCD1 (1:1,000; Abcam, USA) and p-AKT (1:1,000; Abcam, USA) and the goat anti-rabbit secondary antibody (1:2,000; Invitrogen) were used. GAPDH (1:1,000; Abcam, USA) was used as a loading control. The ECL substrate was used to detect their expression. The band intensities were determined using the Bio-Rad imaging system (Hercules, USA).
Cell culture, treatment, and reagents
Human OC cell lines SKOV3and CAOV3 were purchased from ATCC and routinely cultured. Cell transfection involved use of lipofectamine 2000 (Invitrogen, Carlsbad, CA, USA) with SPOCD1 shRNA according to the manufacturer’s protocol. The primer sequence for SPOCD1 shRNA was designed by Shanghai GenePharma Co., Ltd. The efficiency in knocking down the target protein was determined by Western blot analysis after 48 hrs. SKOV3 and CAOV3 were treated by IGF-I after 24 hrs.
Cell growth assays
SKOV3 and CAOV3 cells were seeded in a 96-well plates at a density of 2,000 cells per well and maintained in DMEM containing 10% FBS at 37°C. Cell proliferation was detected by Cell Counting Kit 8 assay at various time points according to the manufacturer’s instructions (Dojindo, Japan). The experiments were repeated three times.
Colony formation
Cells were plated in six-well culture plates at 500 cells/well. After incubation for 14 days at 37°C, cells were washed twice with PBS and stained with 0.5% crystal violet solution. The number of colonies containing <50 cells was counted under a microscope. Colonies containing 50 cells or more were counted as colonies. The experiments were repeated three times.
Cell invasion assay
A total of 5×10⁴ cells were suspended in 500 μL DMEM without serum and added to the upper chamber, while 750 μL DMEM containing 10% FBS added in the lower chamber. After 48 hrs incubation, the cells on the upper layer were gently scratched with a cotton stick. The cells that invaded into the chamber membrane were fixed in 100% methanol for 30 mins, then stained with 0.5% crystal violet. At least three random microscopic fields (magnification, 40×) were analyzed for each insert. The experiments were repeated three times.
Flow cytometry assay
Apoptosis was detected and assayed by an Annexin-V/FITC Kit (BD Biosciences, San Jose, CA, USA) according to the manufacturer’s instructions and analyzed by flow cytometry after a series of processes as described previously.
Statistical analysis
Data are expressed as mean ± SD and were analyzed by use of GraphPad Prism 5. Two groups were compared by Student’s t-test, and multiple groups by One-way ANOVA, with further two group comparison by Multiple Comparison Test Tukey’s test. When the variance of the two groups was not homogeneous, nonparametric tests were used. Correlations were examined by Spearman correlation analysis. The cumulative progression-free survival (PFS) and overall survival (OS) rates were calculated using the Kaplan–Meier, and differences were compared using a log-rank test. P<0.05 was considered statistically significant.
Results
SPOCD1 high expressed in OC tissues
We determined mRNA expression levels of SPOCD1 in 32 ovarian tumors and 32 non-tumor tissues. Realtime PCR analysis revealed that SPOCD1 mRNA levels were significantly increased in OC tissues compared with non-cancerous tissues (P<0.01, Figure 1A). IHC in 93 samples analysis showed positive expression of SPOCD1 in the nucleus and cytoplasm of OC tissues (Figure 1B). Also, SPOCD1 was significantly expressed in nucleus and cytoplasm of SKOV3 and CAOV3 cells (Figure 1C).
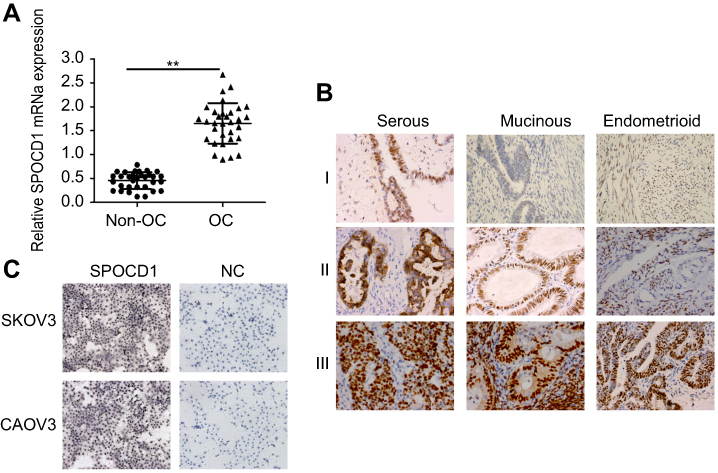 |
Figure 1 Expression of SPOCD1 in ovarian cancer tissues and non-cancerous tissues. (A) Realtime PCR analysis of SPOCD1 expression levels in ovarian cancer tissues and non-cancerous tissues (**P<0.01). (B) IHC staining of SPOCD1 expression in ovarian cancer tissues (including serous, Mucinous and Endometrioid) (I: low expression; II: moderate expression; III: high expression). ×400. (C) IHC staining of SPOCD1 expression in ovarian cancer SKOV3 and CAOV3 cells. ×200. Abbreviations: NC, negative control; OC, ovarian cancer. |
Relationships between SPOCD1 expression and clinicopathological features
To evaluate the significance of SPOCD1 expression in OC, we examined the associations between SPOCD1 expression and several clinicopathological features in 93 patients OC. As shown in Table 1, high SPOCD1 expression showed no association with patient age (P=0.231), histological subtype (P=1.233), or tumor size (P=0.328). However, high SPOCD1 expression was positively correlated with FIGO stage (P=0.021), tumor grade (P=0.012). Taken together, these results supported that SPOCD1 promoted the progression and development of OC.
Prognostic value of SPOCD1 in OC
We also performed a survival analysis. Kaplan–Meier plots of all patients with clinical follow-up whose tumors had either stained positively or negatively for SPOCD1 were carried out. Kaplan–Meier survival curve analysis was performed to predict OS and PFS in 93 OC patients. The results showed that high expression of SPOCD1 was negatively correlated with OS (HR=1.512, 95%CI:1.321–2.793, P=0.031) and PFS (HR =1.875, 95% CI:1.435–3.157, P=0.028) (P<0.05, Figure 2).
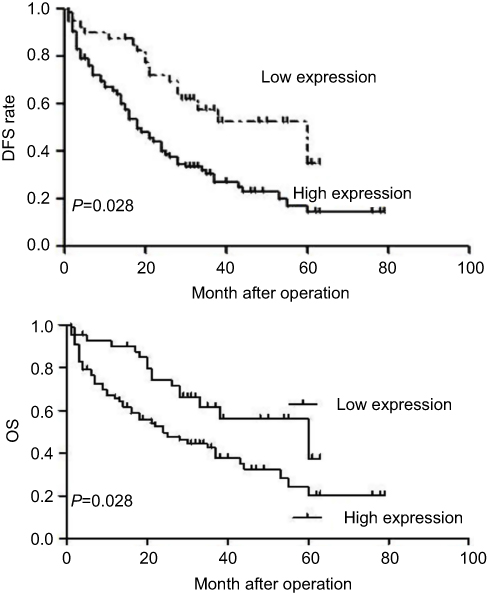 |
Figure 2 Kaplan–Meier survival curves for patients with ovarian cancer according to SPOCD1 expression level. Patients with high SPOCD1 expression levels exhibited a poor prognosis with respect to OS (P=0.031) and PFS (P=0.028). |
Knockdown of SPOCD1 with shRNA inhibits cell proliferation and metastasis in SKOV3 and CAOV3 cells
The effect of SPOCD1 knockdown by shRNA was detected by Western blot in SKOV3 and CAOV3 cells (Figure 3A). We found that knocking down endogenous SPOCD1 expression decreased cell proliferation compared to the NC groups in SKOV3 cells (P<0.05) (Figure 3B). In addition, SPOCD1 shRNA-transfected cells starkly decreased the colony formation ability compared with NC cells (Figure 3C) (P<0.05). shRNA-mediated suppression of SPOCD1 also suppressed cell migration compared to the NC groups (P<0.05) (Figure 3D). The role of sh-SPOCD1 in CAOV3 cells was similar to that in SKOV3 cells. Suppression of SPOCD1 inhibited CAOV3 cells proliferation and migration (Figure 3E–G).
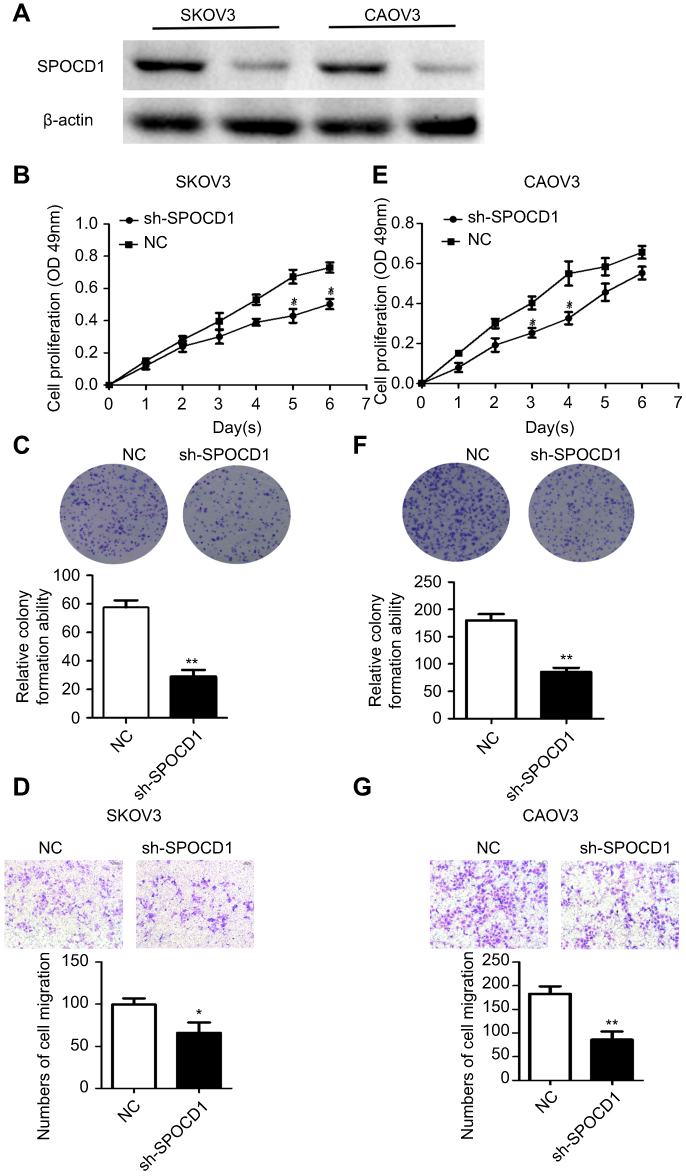 |
Figure 3 Effects of sh-SPOCD1 in SKOV3 and CAOV3 cells proliferation and metastasis. (A) Effect of knockdown SPOCD1 in SKOV3 and CAOV3 cells. (B, E) Effect of sh-SPOCD1on the cell proliferation rate in SKOV3 and CAOV3 cells expressing empty vector or sh-SPOCD1 and determined by CCK8 assay at the indicated time point, for P<0.05 (Vector vs sh-SPOCD1). (C, F) Effect of sh-SPOCD1 on colony formation. SKOV3 and CAOV3 cells with stable expression of vector or sh-SPOCD1 were seeded into six-well plates at 900 cells per well and cultured for 14 days, followed by crystal violet staining and colony counting. (D, G) Effect of sh-SPOCD1 on transwell assay. Data were analyzed as mean ± SD and for P<0.05 (Vector vs sh-SPOCD1).Abbreviation: NC, normal control. |
The deficit of SPOCD1 increases the apoptosis in SKOV3 and CAOV3 cells
In order to further figure out whether the ovarian SKOV3 and CAOV3 cells' proliferation were caused by increased cell division or apoptosis. We detected the cell cycle and apoptosis, respectively, by PI and Annexin-V-FITC. The result showed that the deficit of SPOCD1 increased the apoptosis in SKOV3 and CAOV3 cells (Figure 4), but the cell cycle was no changes between NC and sh-SPOCD1.
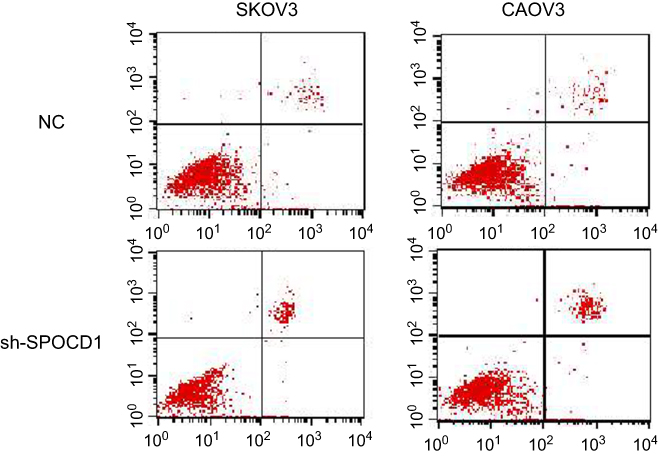 |
Figure 4 The deficit of SPOCD1 increases the apoptosis in SKOV3 and CAOV3 cells SKOV3 and CAOV3 cells expressing empty vector or sh-SPOCD1 were stained with Annexin-V-FITC (20 mg/mL). Apoptosis was analyzed by flow cytometry. |
Knockdown of SPOCD1 with shRNA inhibits PI3K/AKT pathway
In order to figure out the mechanism of SPOCD1 resulted in SKOV3 and CAOV3 cells apoptosis, the PI3K/AKT pathway was examined. As shown in Figure 5, when SPOCD1 was knocked down in SKOV3 cells, excluding PTEN, the protein levels of p-PI3k, p-AKT, and mTOR were notably downregulated. Interestingly, the protein level of p-PI3K, p-AKT, and mTOR was unchanged by adding PI3K/AKT pathway activator (IGF-1) in SPOCD1 shRNA-transfected SKOV3 cells. The protein expression of PTEN was unchanged in SPOCD1 shRNA-transfected and negative control SKOV3 cells (Figure 5A). The result of sh-SPOCD1 in CAOV3 cells was similar to that in SKOV3 cells. Knockdown of SPOCD1 downregulated the protein levels of p-PI3K, p-AKT, and mTOR in CAOV3 cells, which unchanged by adding PI3K/AKT pathway activator (IGF-1) (Figure 5B). These data revealed that SPOCD1 regulated OC cell proliferation by restrained cell apoptosis through activating PI3K/AKT pathway.
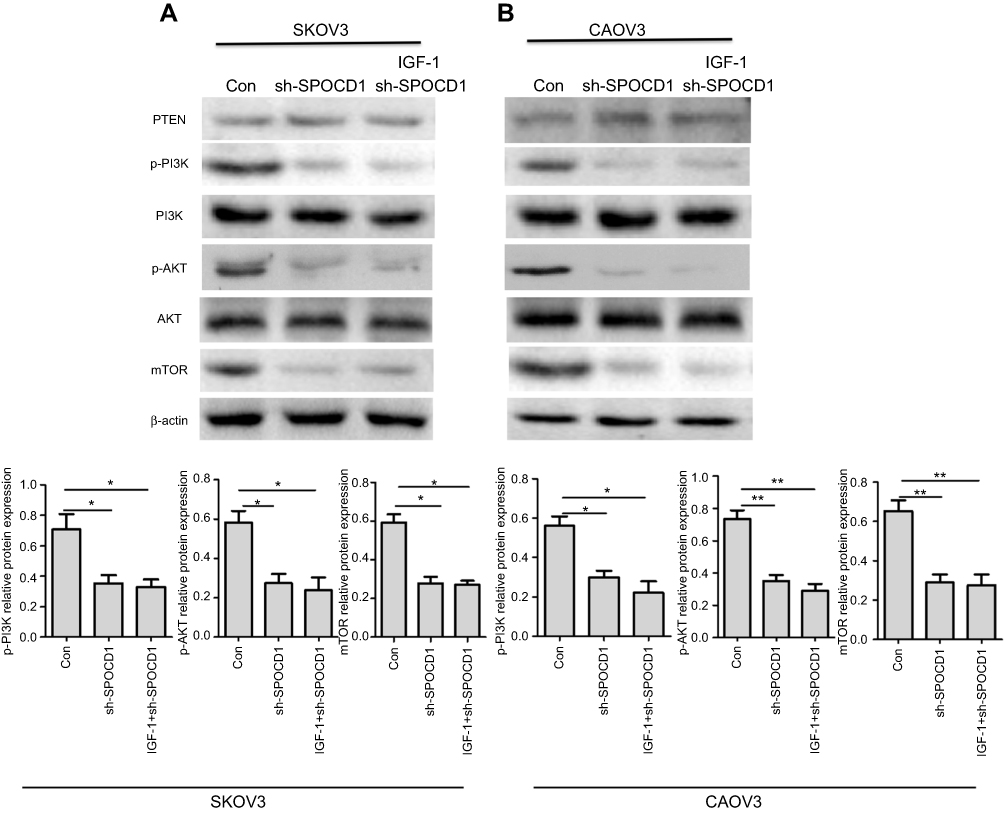 |
Figure 5 SPOCD1 deficit inhibited PI3K/AKT pathway in ovarian cancer cells. (A) In SKOV3 cells, SPOCD1 was knocked, and IGF-1 was used as the PI3K/AKT pathway activator. (B) In CAOV3 cells, SPOCD1 was knocked, and IGF-1 was used as the PI3K/AKT pathway activator. Relative protein level of PTEN, p-PI3K, PI3K, p-AKT, AKT, and β-actin was measured using Image J. Data were presented as mean ± SD from at least three independent experiments. **P<0.01 compared with control group. |
Discussion
Our results show that SPOCD1 was upregulated in OC compared with non-cancerous tissue. In addition, the association between SPOCD1 expression and the clinicopathological features of OC patients with were explored. Interestingly, patients with overexpression SPOCD1 were associated with advanced FIGO stage and low tumor grade. Also, high SPOCD1 expression had notably decreased OS and PFS compared with those with low SPOCD1 expression. The results suggested that SPOCD1 expression plays a crucial role in OC progression. A mechanistic study showed that the antitumor effects of SPOCD1 knocking down in OC cells. Downregulation of SPOCD1 caused significant decreases in cell proliferation and migration. Further study proposes that deficit of SPOCD1 increased the apoptosis and inhibited PI3K/AKT pathway in OC cells. The study explores a novel mechanism that the PI3K/AKT pathway are the responsible factors for the antitumor effects of sh-SPOCD1.
To our knowledge, the research about tumorigenesis role of SPOCD1 is little in OC. Recent study shows that SPOCD1 high expressed in bladder cancer and gastric cancer.10,12 SPOCD1 promotes the proliferation and metastasis of glioma cells by PTX3. SPOCD1 promotes cell proliferation and inhibits cell apoptosis in osteosarcoma via VEGF-A.13 Our study showed that SPOCD1 was significantly upregulated in OC samples and SKOV3 and CAOV3 cells. Importantly, statistical analysis revealed that a high level of SPOCD1 correlated with advanced clinicopathological characteristics and poor prognosis. Moreover, reducing SPOCD1 significantly promoted proliferation and migration of ovarian cells. Further study showed that deficit of SPOCD1 increased the apoptosis. It demonstrated that SPOCD1 promoted proliferation via inhibiting cell the increasing cell apoptosis. These data support the suggestion that SPOCD1 could be a promising independent prognostic factor for OC patients and favors an oncogenic role for SPOCD1 in OC.
The PI3K/AKT pathway has demonstrated to participate in the regulation of proliferation, apoptosis, and survival of many cancer cells.16,17 The PI3K/AKT signal AKT activator stimulated proliferation in various carcinoma cells.18 In this study, our results demonstrated that SPOCD1 contributed to induced acceleration of proliferation and migration through inhibiting cell apoptosis and activated the PI3K/AKT pathway in OC cells. This study identifies SPOCD1 as an oncogene in OC through the PI3K/AKT pathway. The mechanism underlying how SPOCD1 activates the PI3K/AKT pathway needs further investigation. Further experiments in cell and animal models of OC are needed to understand biological processes regulated by SPOCD1 in OC progression.
In conclusion, SPOCD1 has a crucial role in promoting tumorigenesis and growth of OC. The specific mechanisms have been primarly expounded and proved in this paper. Results from this study have the direct potential to develop SPOCD1 as an important biomarker for prognosis of OC and a therapeutic target for OC, especially for those with SPOCD1 overexpression.
Acknowledgments
The authors thank Dr. Feixue Xu, Jing Wang and Chang Liu who supported with data collection for the study, and drafting and revising the manuscript. This study was supported by the Foundation of Gansu natural science grant 18JR3RA340, the Foundation of Lanzhou science grant 2017-4-56, the Foundation of the first hospital of Lanzhou university grant ldyyn 2017-01 and 2017-13.
Disclosure
The authors report no conflicts of interest in this work.
References
1. Chen R, Zheng RS, Baade PD, et al. Cancer statistics in China, 2015. CA Cancer J Clin. 2016;66:115–132. doi:10.3322/caac.21338
2. Siegel RL, Miller KD, Jemel A. Cancer statistics, 2016. CA Cancer J Clin. 2016;66(1):7–30. doi:10.3322/caac.21332
3. Huang S, Qing C, Huang Z, Zhu Y. The long non-coding RNA CCAT2 is up-regulated in ovarian cancer and associated with poor prognosis. Diagn Pathol. 2016;11(1):49. doi:10.1186/s13000-016-0499-x
4. Yeung TL, Leung CS, Yip KP, et al. Cellular and molecular processes in ovarian cancer metastasis. A review in the theme: cell and molecular processes in cancer metastasis. Am J Physiol Cell Physiol. 2015;309(7):C444–C456. doi:10.1152/ajpcell.00213.2015
5. Borza CM, Pozzi A. Discoidin domain receptors in disease. Matrix Biol. 2014;34:185–192. doi:10.1016/j.matbio.2013.12.002
6. Cohen JG, White M, Cruz A, Farias-Eisner R. In 2014, can we do better than CA125 in the early detection of ovarian cancer? World J Biol Chem. 2014;5(3):286–300. doi:10.4331/wjbc.v5.i3.286
7. Monk BJ, Poveda A, Vergote I, et al. Anti-angiopoietin therapy with trebananib for recurrent ovarian cancer (TRINOVA-1): a randomised, multicentre, double-blind, placebo-controlled phase 3 trial. Lancet Oncol. 2014;15(8):799–808. doi:10.1016/S1470-2045(14)70244-X
8. Kimura K, Wakamatsu A, Suzuki Y, et al. Diversification of transcriptional modulation: large-scale identification and characterization of putative alternative promoters of human genes. Genome Res. 2006;16(1):55–65. doi:10.1101/gr.4039406
9. Wang Y, Tatakis DN. Human gingiva transcriptome during wound healing. J Clin Periodontol. 2017;44(4):394–402. doi:10.1111/jcpe.12669
10. Van der Heijden AG, Mengual L, Lozano JJ, et al. A five-gene expression signature to predict progression in T1G3 bladder cancer. Eur J Cancer. 2016;64:127–136. doi:10.1016/j.ejca.2016.06.003
11. Xu B, Ma R, Ren H, Qian J. Genome-wide analysis of uveal melanoma metastasis-associated LncRNAs and their functional network. DNA Cell Biol. 2018;37(2):99–108. doi:10.1089/dna.2017.4015
12. Zhu M, Yan C, Ren C, et al. Exome array analysis identifies variants in SPOCD1 and BTN3A2 that affect risk for gastric cancer. Gastroenterology. 2017;152(8):2011–2021. doi:10.1053/j.gastro.2017.02.017
13. Liang J, Zhao H, Hu J, Liu Y, Li Z. SPOCD1 promotes cell proliferation and inhibits cell apoptosis in human osteosarcoma. Mol Med Rep. 2018;17(2):3218–3225. doi:10.3892/mmr.2017.8263
14. Huang J, Zhang L, Greshock J, et al. Frequent genetic abnormalities of the PI3K/AKT pathway in primary ovarian cancer predict patient outcome. Genes Chromosomes Cancer. 2011;50(8):606–618. doi:10.1002/gcc.20883
15. Juric D, Krop I, Ramanathan RK, et al. Phase I dose-escalation study of taselisib, an oral PI3K inhibitor, in patients with advanced solid tumors. Cancer Discov. 2017;7(7):704–715. doi:10.1158/2159-8290.CD-16-1080
16. Spangle JM, Roberts TM, Zhao JJ. The emerging role of PI3K/AKT-mediated epigenetic regulation in cancer. Biochim Biophys Acta Rev Cancer. 2017;1868(1):123–131. doi:10.1016/j.bbcan.2017.03.002
17. Moga MA, Dimienescu OG, Arvatescu C, Mironescu A, Dracea L, Ples L. The role of natural polyphenols in the prevention and treatment of cervical cancer-an overview. Molecules. 2016;21(8):1055. doi:10.3390/molecules21081055
18. Manning BD, Cantley LC. AKT/PKB signaling: navigating downstream. Cell 2007;129(7):1261–1274. doi:10.1016/j.cell.2007.06.009
 © 2020 The Author(s). This work is published and licensed by Dove Medical Press Limited. The full terms of this license are available at https://www.dovepress.com/terms.php and incorporate the Creative Commons Attribution - Non Commercial (unported, v3.0) License.
By accessing the work you hereby accept the Terms. Non-commercial uses of the work are permitted without any further permission from Dove Medical Press Limited, provided the work is properly attributed. For permission for commercial use of this work, please see paragraphs 4.2 and 5 of our Terms.
© 2020 The Author(s). This work is published and licensed by Dove Medical Press Limited. The full terms of this license are available at https://www.dovepress.com/terms.php and incorporate the Creative Commons Attribution - Non Commercial (unported, v3.0) License.
By accessing the work you hereby accept the Terms. Non-commercial uses of the work are permitted without any further permission from Dove Medical Press Limited, provided the work is properly attributed. For permission for commercial use of this work, please see paragraphs 4.2 and 5 of our Terms.