
Back to Journals » International Journal of Chronic Obstructive Pulmonary Disease » Volume 21
SPG7-Mediated Regulation of mPTP and Mitochondrial Flickering in COPD: A Bioinformatics-Based Prediction of Mechanistic Framework
Authors Xu A  , Lv Y, Li S, Zhang X, Zhang J , Zhan C, Cheng Y, Tang L, Zhang C, Xiang S, Fang H, Zhou D
Received 21 January 2026
Accepted for publication 24 June 2026
Published 29 June 2026 Volume 2026:21 597903
DOI https://doi.org/10.2147/COPD.S597903
Checked for plagiarism Yes
Review by Single anonymous peer review
Peer reviewer comments 5
Editor who approved publication: Dr Jill Ohar
Anran Xu,1,* Yaping Lv,2,* Shaobin Li,1 Xinhui Zhang,3 Jirong Zhang,4 Chengyan Zhan,1 Yanqi Cheng,1 Ling Tang,1 Chen Zhang,1 Siyang Xiang,5 Hong Fang,1 Donghua Zhou6
1Department of Traditional Chinese Medicine Preventive Health Care, Longhua Hospital Affiliated to Shanghai University of Traditional Chinese Medicine, Shanghai, 200032, People’s Republic of China; 2Department of Laboratory Medicine, Renji Hospital, School of Medicine, Shanghai Jiao Tong University, Shanghai, 200127, People’s Republic of China; 3Department of Pediatrics, Shanghai Municipal Hospital of Traditional Chinese Medicine, Shanghai University of Traditional Chinese Medicine, Shanghai, 200071, People’s Republic of China; 4Department of Emergency, Longhua Hospital Affiliated to Shanghai University of Traditional Chinese Medicine, Shanghai, 200032, People’s Republic of China; 5Department of Traditional Chinese Medicine, Meilong Community Health Service Center, Shanghai, 201104, People’s Republic of China; 6Pneumology Department, Fengxian Branch of Longhua Hospital affiliated to Shanghai University of Traditional Chinese Medicine, Shanghai, 201400, People’s Republic of China
*These authors contributed equally to this work
Correspondence: Hong Fang, Department of Traditional Chinese Medicine Preventive Health Care, Longhua Hospital affiliated to Shanghai University of Traditional Chinese Medicine, Shanghai, 200032, People’s Republic of China, Email [email protected] Donghua Zhou, Pneumology Department, Fengxian Branch of Longhua Hospital affiliated to Shanghai University of Traditional Chinese Medicine, Shanghai, 201400, People’s Republic of China, Email [email protected]
Background: During the staged progression of chronic obstructive pulmonary disease (COPD), mitophagy homeostasis is disrupted and exhibits a typical dual role. Mitophagy is tightly regulated by ion channel-controlled mitochondrial membrane potential (ΔΨm) and may associate with mitochondrial permeability transition pore (mPTP) dynamics. However, this regulatory mechanism remains largely unknown, and the stage-specific requirements of mitophagy in COPD progression have yet to be established.
Methods: This study proposed a novel theoretical framework from prior literature. Using public databases, we linked mPTP-related genes to COPD state transitions via differential analysis and Mendelian randomization (MR). Key biomarkers were validated through gene enrichment, functional annotation, immune infiltration, and single-cell RNA sequencing (scRNA-seq) to assess biological significance. Finally, molecular docking confirmed their potential roles.
Results: We preliminarily aligned the “mitochondria-cell survival architecture” hypothesis with COPD progression. Compared with stable COPD (STCOPD), acute exacerbation of COPD (AECOPD) showed massive type II alveolar epithelial (AT2) cell death, hyperinflammation, increased energy demand, and impaired intercellular communication, consistent with activated ubiquitin-proteasome system (UPS), mitochondrial gene expression, macroautophagy initiation, and vesicle trafficking. Six biomarkers (including SPG7) were associated with AECOPD (AUC=0.705, 95% CI 0.554– 0.705). SPG7 was positively correlated with AECOPD (OR=1.126, 95% CI 1.008– 1.257), while the other five showed negative correlations. These markers were enriched in ion channel and G protein-coupled receptors (GPCRs) pathways. SPG7 expression paralleled energy demand and strongly interacted with AFG3L2 and PPIF, implicating it in mPTP regulation.
Conclusion: This study preliminarily supports the mitochondria-cell survival hypothesis. Bioinformatic analysis suggests that mPTP-triggered mitochondrial flickering maintains mitochondrial quality control. Furthermore, transient mPTP opening via SPG7-mediated CypD activation may constitute an independent protective pathway, potentially involving unique SPG7-CypD modifications. However, non-significant colocalization limits study robustness, necessitating rigorous experimental validation of these predictions.
Keywords: mitochondrial permeability transition pore, mitochondrial flickering, mitophagy, chronic obstructive pulmonary disease, bioinformatics analysis
Introduction
Asthma and chronic obstructive pulmonary disease (COPD) constitute the two most critical components of the chronic respiratory disease (CRD) burden. In the context of global population aging, COPD is the primary driver of the CRD burden.1 Despite deepening insights into the molecular mechanisms underlying COPD, disease progression remains closely associated with elevated mortality rates during acute exacerbations.2 Deaths attributed to COPD rank third among chronic disease-related mortality, preceded only by cardiovascular diseases and stroke. Concurrently, COPD is the fifth leading disabling disease globally.3 Furthermore, our group’s previous epidemiological research1 identified an accelerated upward trend in the prevalence and incidence of COPD among middle-aged and elderly populations in low socio-demographic index (SDI) and high SDI regions, respectively. This indicates that post-pandemic pulmonary damage and global population aging will become global public health priorities in the coming decades, necessitating targeted interventions to mitigate the sustained damage inflicted by COPD on patients worldwide during the process of pulmonary aging.4
COPD is a progressive aging-associated disease characterized by recurrent alternations between acute exacerbations and stable states as the disease progresses. Within the stable phase, the GOLD guidelines5 further classify stable COPD (STCOPD) into three stages: A, B, and E. Each stage signifies an aggravation of the patient’s clinical symptoms and reflects the progressive destruction of airway structures and the aging of pulmonary tissue in patients with COPD. Mounting evidence indicates that the stage-wise progression of COPD is closely associated with the process of pulmonary aging.6–8 This process predisposes patients with COPD to at least two extrapulmonary comorbidities,9 including osteoporosis, skeletal muscle dysfunction, and cognitive impairment. This systemic aging process is highly correlated with the oxidative stress experienced by patients with COPD.10 It is primarily manifested by the exacerbating effect of low-grade inflammatory infiltration—driven by the senescence-associated secretory phenotype (SASP)—on COPD,11 as well as a vicious cycle wherein oxidative stress further amplifies inflammation-induced cell death.12 Therefore, mitigating oxidative stress, enhancing energy metabolism, delaying cellular senescence, and preventing the destruction of pulmonary architecture caused by acute exacerbations hold the potential to open a new window for the comprehensive management of COPD.13
Oxidative stress is widely recognized as a crucial factor driving COPD progression, and both exogenous and endogenous reactive oxygen species may be implicated in the pathogenesis of COPD.13 Although inflammatory responses induced by cigarette smoke are considered the primary source of oxidative stress in COPD, studies have shown14 that oxidative stress persists even after smoking cessation. This implies that ROS leakage originating from mitochondria exerts a profound impact on the pathological mechanisms of COPD. Mitochondrial DNA is 30 times more susceptible to oxidants than nuclear DNA.13 Consequently, mounting evidence indicates that ROS leakage from the respiratory chain also leads to extensive mitochondrial dysfunction in COPD, thereby triggering chronic pulmonary inflammation.10 Mitochondria are characterized by their dynamic stability and systemic nature. Therefore, mitochondrial dysfunction is also a systemic phenomenon13 that affects multiple cell types, resulting in skeletal muscle atrophy and respiratory muscle dysfunction. For patients with COPD, pulmonary cells are the first to bear the burden of mitochondrial oxidative stress. Furthermore, mitochondrial dynamics regulate the onset and progression of COPD. Numerous studies have demonstrated that distinct states of mitochondrial compensation or decompensation manifest across the early stages, late stages, and acute exacerbations of COPD (AECOPD).3 These state alterations are primarily reflected in aberrant changes in mitochondrial quality control, encompassing mitophagy, fusion, and fission.3 As the largest intracellular energy factories,15 proper mitochondrial quality control serves as a critical pathway for maintaining ionic homeostasis, averting oxidative stress, and preventing intrinsic cellular apoptosis.15,16 However, mitochondrial quality control is an adenosine triphosphate (ATP)-dependent process; ultimately, cell fate is determined by the balance between the demand for substrate clearance and the cell’s tolerance capacity, and is constrained by the energy supply.17,18 These lines of evidence also elucidate why the majority of studies failing to stratify by COPD status present a typical dual effect: the simultaneous presence of insufficient mitophagy alongside the impacts of excessive mitophagy19,20 (Figure 1).
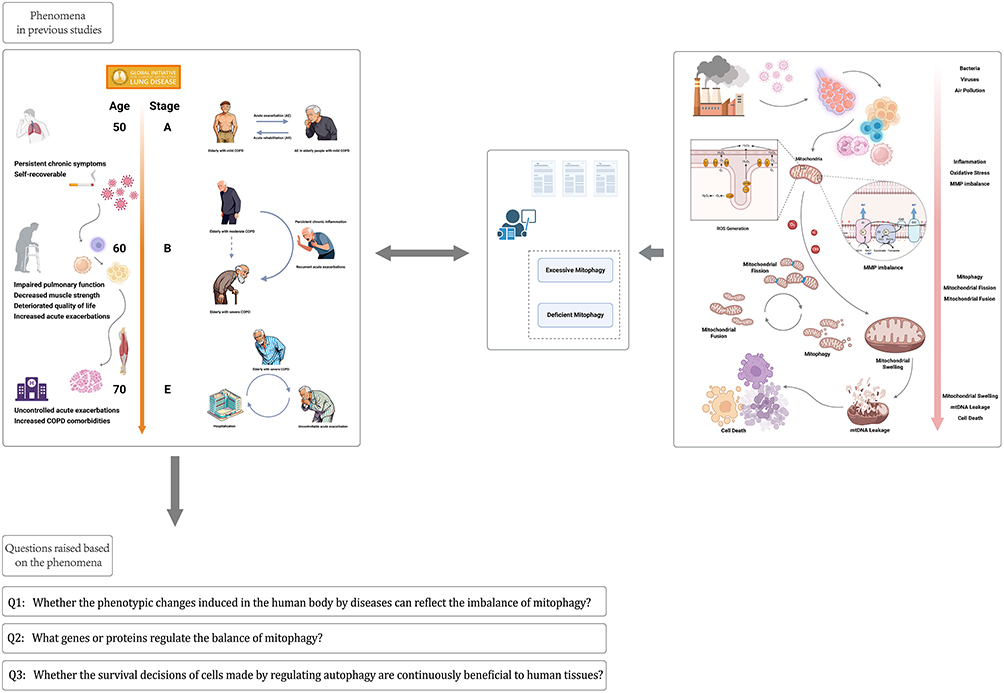 |
Figure 1 Key questions proposed based on mitochondria-related mechanisms and phenomena in COPD: COPD is a stage-specific age-related lung disease, characterized by stage-specific exacerbation and systemic aging. This alteration is highly associated with mitochondrial status. The role of mitochondrial membrane potential in maintaining mitochondrial quality control directly determines intrinsic cellular apoptosis. However, the direction of mitophagy remains controversial across all stages of COPD during this process. Based on this, we propose three key questions. ↑: Directional transitions/ directional progression. Created with BioRender.com. |
Based on the aforementioned phenomena, our research group has raised three questions as illustrated in Figure 1, and formulated the hypothesis presented in Figure 2: “The fundamental purpose of mitophagy is to maintain cell survival at the expense of self-sacrifice. If mitochondrial function can be restored and mitochondrial quality control bypassed while maintaining cell survival, thereby preserving a high level of cellular metabolic activity, it would contribute to delaying COPD-induced pulmonary aging”. This conjecture is well-founded, as the majority of proper mitochondrial functions rely on the stability of the mitochondrial inner membrane potential.16 Once the membrane potential is lost, mitochondria do not immediately initiate mitophagy; rather, there is a delay of approximately 30 minutes in Parkin activation. During this period, if the membrane potential is restored, PINK1 activation will be rapidly reversed,21 and oxidative phosphorylation will resume. The mitochondrial membrane potential is strictly governed by the ion transport processes across the mitochondrial membrane,16 and the mitochondrial permeability transition pore (mPTP) serves as a critical regulatory factor in maintaining this potential.22 Such mPTP-mediated “mitochondrial flickering” has been proven to play a decisive role in cell survival and apoptosis. The reversible opening of the mPTP directly regulates ROS and Ca2+ homeostasis, and mitigates the formation of mtROS through transient depolarization, respiratory chain activation, and accelerated electron flow.23 Therefore, as the initial step in a series of investigations, this study employs bioinformatics approaches (Figure 3) to examine the differential expression of mPTP-related genes across distinct disease states (STCOPD and AECOPD). While identifying the key genes that regulate “ mitochondrial flickering”, we also seek to evaluate the plausibility of the aforementioned hypothesis. Through this research, we anticipate discovering novel pathways that regulate the mitochondria-cell survival framework, thereby providing new insights and directions for future related studies.
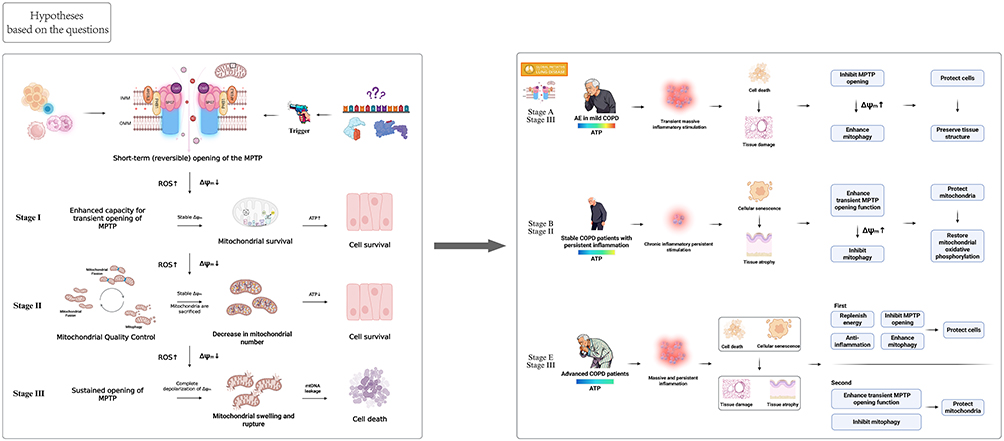 |
Figure 2 Mitochondria-cell survival architecture based on the hierarchical theory of COPD: Based on previous controversies and existing evidence, we propose a novel theory. We hypothesize that mitochondrial flickering plays a key role in regulating mitophagy. Enhancing mitochondrial flickering maintains the stability of mitochondrial membrane potential and regulates mitochondria-cell ion homeostasis. This process exerts at least two functions. First, during the stage when cells are under excessive stress and on the verge of death, this function can sustain cell survival by promoting mitophagy. Second, during the chronic inflammatory phase, it protects mitochondria from mitophagic damage, thereby maintaining cells in a high-energy metabolism state. Based on this, we further propose targeted intervention strategies for different stages of COPD. ↑: the upregulation or downregulation of ROS. ΔΨm: directional transitions/ directional progression. Created with BioRender.com. |
 |
Figure 3 Analysis flow chart. ↑: Directional transitions/ directional progression. |
Methods
Ethical Exemption
Ethical approval was waived for this study because all analyses were based on publicly available summary statistics databases, did not involve personal data, and were entirely anonymized. This study also obtained an ethical exemption in accordance with local policies and complies with Items 1 and 2, Article 32 of the Measures for Ethical Review of Life Science and Medical Research Involving Humans: (1) conducting research utilizing legally obtained public data or data generated through observation without interfering with public behavior; and (2) conducting research using anonymized information and data.
Data Sources
The objective of this study is to reveal the alterations in how differentially expressed genes regulate mPTP function in STCOPD and AECOPD, thereby inferring the critical role of mPTP-mediated ΔΨm changes in cellular life-and-death decisions during COPD state transitions. Therefore, the data sources must explicitly indicate whether the samples were derived from patients with COPD in the stable phase or the acute exacerbation state. According to the GOLD guidelines, the deterioration of AECOPD symptoms occurs within 14 days;5 thus, we defined patients with COPD experiencing acute exacerbations within 14 days as being in the AECOPD state. We retrieved the expression data of COPD-related genes under different states from the Gene Expression Omnibus (GEO) database (https://www.ncbi.nlm.nih.gov/geo/), including GSE148871, GSE148877, and GSE112165. Among them, GSE148871 and GSE148877 originated from the same study by the same research team, containing 304 and 209 samples, respectively. GSE148871 is an intervention study on AECOPD, whereas GSE148877 is an intervention study on STCOPD. We selected the baseline sputum samples prior to intervention from these two datasets as the training set, ultimately obtaining 28 STCOPD samples and 44 AECOPD samples. Subsequently, we retrieved the baseline and day-84 post-exacerbation sputum and blood samples from GSE148871 as the validation set, which included 16 STCOPD sputum samples, 21 STCOPD blood samples, 44 AECOPD sputum samples, and 49 AECOPD blood samples. Furthermore, GSE112165 was also utilized for the validation set, providing 17 STCOPD sputum samples and 13 AECOPD sputum samples, respectively. All three aforementioned datasets utilized the same GPL570 platform. To investigate the differential expression of target genes at the cellular level, we conducted an in-depth analysis using the GSE268542 dataset, which is based on 10x single-cell RNAseq technology and the GPL21697 platform, comprising 1 STCOPD lung tissue cell sample and 1 Influenza A Virus (IAV)-infected COPD lung tissue cell sample. Finally, we retrieved 2549 mPTP-related genes through the GeneCards database (https://www.genecards.org/), and after selecting those with a relevance score higher than 20, we ultimately obtained 196 mPTP-related genes. Further details regarding sample sources and the inclusion information for group integration can be found in Figure 3 and Table S1.
Differential Expression and Enrichment Analyses
To identify the differentially expressed genes (DEGs) between STCOPD and AECOPD, the raw expression matrix of the training set was normalized prior to differential analysis to ensure the comparability of sample baselines. Given that the two datasets originated from parallel cohorts of the same research team and the disease groupings were completely mutually exclusive, conventional batch effect correction algorithms would eliminate genuine biological variations. Therefore, following the methodological design of the datasets’ source literature,24 compulsory batch effect removal was not performed in this study. Subsequently, the limma package (v 3.64.3) was utilized to analyze the normalized matrix. DEGs were obtained based on the thresholds of |log2FC| > 1 and a false discovery rate (FDR, ie, adjusted P-value) < 0.05 following multiple testing correction via the Benjamini-Hochberg (BH) method. Thereafter, enrichment analysis of the DEGs was conducted utilizing the Gene Ontology (GO) and Kyoto Encyclopedia of Genes and Genomes (KEGG) databases, along with R packages such as clusterProfiler (v 4.16.0), to delineate the primary biological alterations during the transition from STCOPD to AECOPD. GO analysis revealed the significantly enriched biological processes (BP), cellular components (CC), and molecular functions (MF) of the DEGs, whereas KEGG analysis elucidated the signaling pathways involving the key target genes. The significance threshold for both enrichment analyses was set at an FDR (adjusted P-value) < 0.05 based on the BH correction method.
Screening of Key mPTP-Related Genes Among DEGs
To identify the key genes capable of regulating mPTP during disease progression, we first intersected the DEGs with the 196 genes obtained from the GeneCards database. Subsequently, the identified differentially expressed mPTP-related genes (DE-MPTPRGs) were integrated into the Search Tool for the Retrieval of Interacting Genes/Proteins (STRING) database (https://cn.string-db.org/) to construct a protein-protein interaction (PPI) network. A confidence score threshold was set to 0.9 to ensure the reliability of the included interactions.
To ensure the clinical significance of the key genes among the DE-MPTPRGs, we employed a robust Mendelian randomization (MR) framework for causal inference. In this analysis, DE-MPTPRGs were regarded as the exposure, whereas acute hospitalization for COPD served as the outcome. The cis-expression quantitative trait loci (cis-eQTL) data for the DE-MPTPRGs were derived from whole blood samples in the eQTLGen Consortium (https://www.eqtlgen.org/) and lung tissue samples from the Genotype-Tissue Expression (GTEx) database (Version V11; https://gtexportal.org/). The COPD acute hospitalization events were acquired from the IEU OpenGWAS database (https://gwas.mrcieu.ac.uk/), specifically utilizing the whole blood sample dataset labeled “finn-b-COPD HOSPITAL”. This dataset encompasses 16,380,466 single-nucleotide polymorphisms (SNPs) across 218,792 individuals, including 6500 COPD hospitalization events and 212,292 healthy European controls. Further information regarding data sources can be found in Table S2.
The MR analysis must satisfy three core assumptions: (1) a significant and robust association exists between the instrumental variables (IVs) and the exposure; (2) the IVs are independent of confounders; and (3) the IVs affect the outcome solely through the exposure pathway. Therefore, to screen for IVs, we initially utilized the TwoSampleMR package (v 0.6.22),25 setting a significance threshold of  . Then, the linkage disequilibrium (LD) effects of each SNP were removed based on the intervals of
  and
and  . The LD reference panel used was “EUR”. Finally, the robustness of the IVs was verified by calculating the F-statistic, with a value exceeding 10 indicating reliable IVs. Subsequently, to satisfy the exclusivity assumption, we set an exclusion threshold of
  . Concurrently, non-palindromic SNPs were harmonized, and all SNPs containing palindromic sequences were excluded to ensure proper allele alignment between the exposure and outcome datasets. Notably, when processing the lung tissue samples derived from the GTEx database, we set the intervals to
  and
and  to remove the LD effects of each SNP.
Various causal inference methods were employed for the MR analysis, including the MR-Egger, weighted median, inverse variance weighted (IVW),26 simple mode, and weighted mode methods, although the conclusive results primarily relied on the IVW method. To control for the risk of false positives induced by multiple hypothesis testing, the BH method was applied for multiple testing correction on the causal inference P-values of all candidate genes. Under this method, an adjusted P-value (FDR) <0.05 was established as the criterion for determining a significant causal relationship, and the effect model was selected based on the results of the heterogeneity test. If the heterogeneity P-value was <0.05, a (multiplicative) random-effects model was employed; otherwise, a fixed-effects model was utilized. Furthermore, sensitivity analyses were required to ensure the robustness of the results, which encompassed heterogeneity assessment,27 pleiotropy testing,28 and the leave-one-out (LOO) method.29 P-values <0.05 in the heterogeneity and pleiotropy tests indicated the presence of heterogeneity among the IVs and horizontal pleiotropy between the exposure and outcome variables, respectively. The LOO method sequentially removed each SNP and re-evaluated the results to ensure minimal variation in the outcome, thereby accounting for the impacts introduced by confounders.30
The selected DE-MPTPRGs, while validated by sensitivity analysis to have a causal relationship with COPD hospitalization events, must simultaneously exhibit a consistent expression trend with that in the differential gene analysis. Only the genes ultimately satisfying these criteria will be designated as the core genes among the DE-MPTPRGs.
After identifying the core genes among the DE-MPTPRGs, we performed a colocalization analysis on the key biomarkers utilizing the coloc R package.31 To ensure the inclusion of all phenotype-associated eQTLs, we expanded the eQTL screening window to 500 kb upstream and downstream. For each locus, a Bayesian approach evaluated the degree of support for the following five mutually exclusive hypotheses:32 (1) neither trait has an association; (2) only trait 1 has an association; (3) only trait 2 has an association; (4) both traits have an association, but each corresponds to a different causal variant; and (5) both traits have an association and share the same causal variant. This analysis provided a posterior probability for each hypothesis tested (H0, H1, H2, H3, and H4). We set the prior probability of a SNP being associated only with trait 1 ( ) to
) to  ; the prior probability of a SNP being associated only with trait 2 (
 ) to
) to  ; and the prior probability of a SNP being associated with both traits (
 ) to
) to  . If the posterior probability of a shared causal variant (
 ) is
) is  , the two signals are considered to demonstrate strong evidence of colocalization. Moderate evidence of colocalization was defined as
  Further information regarding the datasets utilized for the Mendelian randomization and gene colocalization analyses can be found in Table S3.
Validation of Predictive Models and Functional Annotation
After identifying the core genes among the DE-MPTPRGs, we validated the model across three datasets. The rms package (v 8.0–0) was utilized to construct a diagnostic nomogram incorporating the key genes, and calibration curves were established to evaluate the predictive performance of the nomogram. Subsequently, we plotted receiver operating characteristic (ROC) curves using the pROC package (v 1.19.0.1) to quantify the overall discriminative ability of the nomogram across all possible thresholds. Furthermore, decision curve analysis (DCA) was performed to determine the clinical utility of the nomogram. To further validate the expression trends of the key genes across different datasets, boxplots were employed for visual representation, and Pearson correlation coefficients were calculated using the psych package (v 2.5.6) to assess the synergistic interactions among the key biomarkers in the distinct validation sets.
To evaluate the biological significance of the alteration trends in the key genes, Gene Set Enrichment Analysis (GSEA) was conducted for each biomarker utilizing the clusterProfiler package, based on the MF dataset from the GO database. The enriched pathways were ranked according to their normalized enrichment scores (NES), with thresholds of  and P<0.05 established as the criteria for statistical significance. This approach facilitated the identification of molecular functions significantly associated with the expression profiles of the key genes.
Immune Infiltration Analysis
Regardless of the COPD stage, the disease is invariably accompanied by persistent inflammatory responses and continuous immune stress. Therefore, to evaluate the immunological differences in the AECOPD state compared to the STCOPD state, we performed immune cell profiling utilizing the single-sample Gene Set Enrichment Analysis (ssGSEA) algorithm within the GSVA package (v 2.2.0).33 This method computes the immune cell infiltration score for each sample based on gene sets comprising immune cell markers.34 Subsequently, immune cell types exhibiting significant variations were identified by comparing the immune cell scores between the STCOPD and AECOPD groups. To control for multiple comparison errors, the BH method was applied for multiple testing correction of the P-values representing inter-group differences, followed by appropriate data visualization. Concurrently, Spearman correlation analysis was employed to clearly elucidate the correlations between the key genes and the significantly distinct immune cells.
Single-Cell RNA Sequencing Analysis
To investigate in depth the differential expression of key genes in lung tissue cells between STCOPD and AECOPD, we analyzed the single-cell dataset GSE268542 utilizing the Seurat (v 5.3.0) and SingleR (v 2.8.0) packages. Prior to the analysis, strict quality control was performed on the data to evaluate the impacts of doublet effects, the cell cycle, and batch effects. Subsequently, batch effect correction and gene normalization were executed utilizing the Harmony (v 1.2.3) and SCTransform algorithms. During the analysis, the resolution was set to 0.7, and the Uniform Manifold Approximation and Projection (UMAP) algorithm was employed to visualize the cell clusters. To identify the specific marker genes for each cell subpopulation, the default data matrix was set to the variance-stabilized SCT dataset, and the Wilcoxon rank-sum test was performed using the FindAllMarkers function within the Seurat package. We established stringent screening criteria to ensure the specificity of the marker genes: only significantly upregulated positive genes were extracted, requiring an adjusted P-value <0.05 following multiple testing correction via the BH method, a log-fold change threshold  , and a difference in the expression proportion of candidate genes between the target cell population and the background cell population
  . Thereafter, the cell types were manually annotated and calibrated by referencing previous literature35,36 and the CellMarker 2.0 database (http://117.50.127.228/CellMarker/CellMarkerBrowse.jsp). Then, heatmaps and stacked bar charts were utilized to present the cell annotation profiles and the proportional changes of cells across different COPD states, respectively. Finally, bubble plots and UMAP plots were employed to visualize the expression of key genes in distinct COPD states and their distribution within the cell clusters, respectively.
Additionally, the Monocle3 package (v 1.4.26) was further utilized to construct a pseudotime analysis model for immune cells, delineating their developmental trajectories and the expression levels of key genes during the developmental process. Concurrently, module clustering was performed on the developmental trajectories of the immune cells to highlight the biological functions of each module. Subsequently, we analyzed the level of intercellular communication utilizing the CellChat package (v 1.6.1) by calculating the total interaction strength of all ligand-receptor pairs within each signaling pathway, thereby inferring the mitochondrial functional demands among cells under different COPD states.
Molecular Docking
To infer the potential roles of the key genes in mitochondria based on the validated functions of existing compounds, molecular docking was performed. First, the potential associated compounds for the core genes were retrieved from the Drug Signatures Database (DSigDB) via the Enrichr website (https://maayanlab.cloud/Enrichr/) and ranked in ascending order according to their adjusted P-values. Subsequently, the 3D structures of the small molecule compounds were obtained from the PubChem database (https://pubchem.ncbi.nlm.nih.gov/). The protein structures of the core genes were acquired via the UniProt website (https://www.uniprot.org/); notably, only protein structure models determined by X-ray crystallography were selected for subsequent analyses. AutoDock Vina (v 1.5.7) was utilized to perform the molecular docking. During this process, the proteins. Plus, a web server (https://proteins.plus/) was employed to predict the active pockets of the macromolecular proteins, followed by the use of the Protein-Ligand Interaction Profiler (PLIP) tool (https://plip-tool.biotec.tu-dresden.de/plip-web/plip/index) to predict the interaction forces. Finally, PyMOL (v 2.6.0) and Discovery Studio 2021 were used to visualize the 3D and 2D results of the molecular docking.
Statistical Analysis
Except for the single-cell sequencing analysis, which was conducted using R software (version 4.4.3), all other analyses were performed using R software (version 4.5.0). Differences between groups were evaluated utilizing the Wilcoxon test. In analyses involving multiple hypothesis testing—including the screening of differentially expressed genes, enrichment analysis, comparison of immune infiltration differences, identification of single-cell marker genes, and Mendelian randomization causal inference—the Benjamini-Hochberg (BH) method was uniformly employed to calculate the false discovery rate (FDR) for multiple testing correction, unless otherwise specified. For conventional single-hypothesis tests, a P-value < 0.05 was considered statistically significant; for analyses subjected to multiple testing correction, an adjusted P-value (FDR) < 0.05 was defined as statistically significant.
Results
Initial Functional Enrichment of DEGs
In the differential analysis, we identified a total of 9137 DEGs (Figure 4A and B). Among them, 856 genes were upregulated, and 8281 genes were downregulated (Table S4). Notably, because the datasets were derived from parallel cohorts of the same research team and the disease groupings were completely mutually exclusive, conventional batch effect correction was not performed. Concurrently, constrained by public databases, the sample size of the training set could not be expanded with additional matched data, which introduced confounding factors and caused a certain degree of bias in the differential results. To identify the most prominent directions of biological changes from the aforementioned variations, we conducted GO and KEGG enrichment analyses. In the KEGG analysis, we found that the DEGs were highly associated with multiple neurodegenerative diseases, such as Alzheimer’s disease and Parkinson’s disease. They were also associated with muscle atrophy. Notably, these diseases are highly correlated with mitochondrial behavior. Furthermore, the KEGG analysis results indicated associations with viral and bacterial infections, elucidating the potential etiology of AECOPD (Figure 4C).
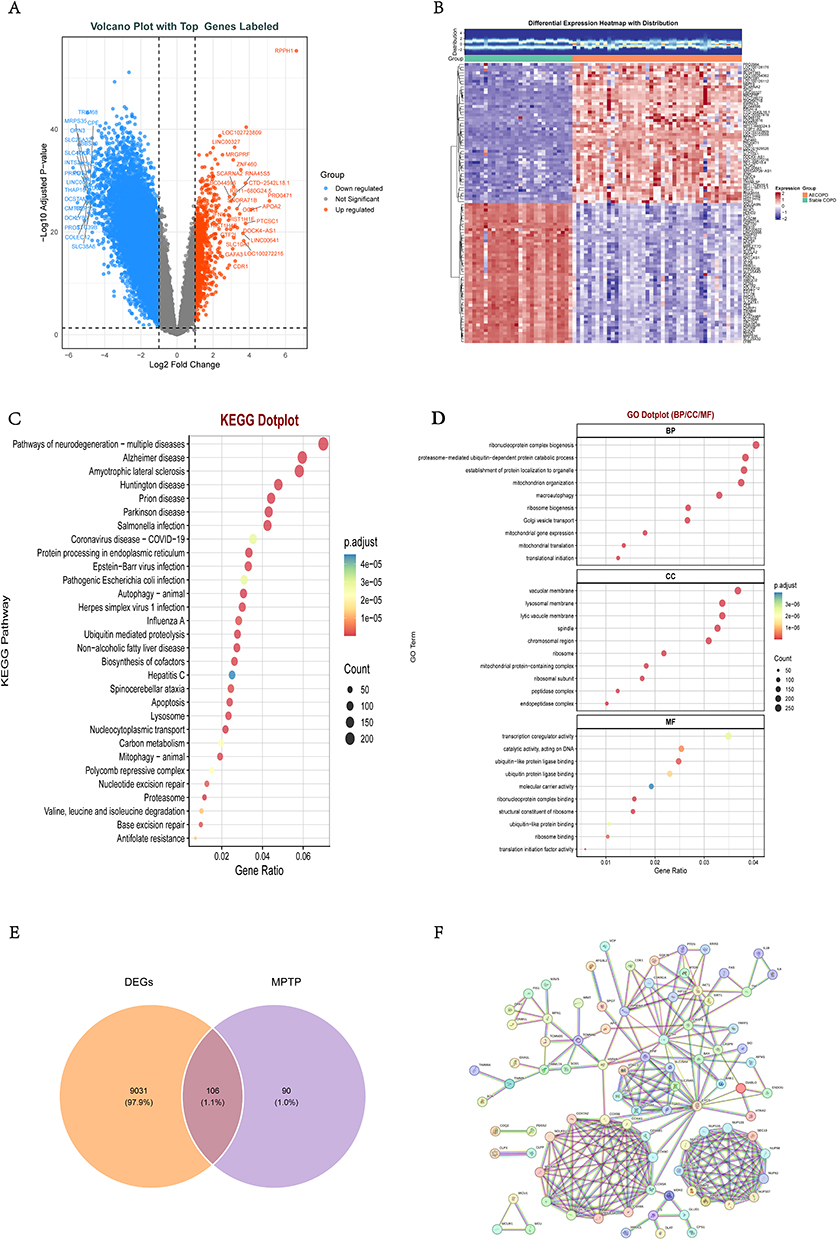 |
Figure 4 Preliminary screening and functional enrichment of differentially expressed mPTP-related genes in STCOPD and AECOPD: (A) Volcano plot. (B) Heatmap. (C) KEGG enrichment analysis of differentially expressed genes. (D) GO enrichment analysis of differentially expressed genes. (E) Venn diagram of the intersection between differentially expressed genes and mPTP-related genes. (F) PPI network diagram of differentially expressed mPTP-related genes. |
In the GO enrichment analysis, a total of 1257 biological terms were obtained, comprising 849 BPs, 251 CCs, and 157 MFs. Subsequently, we discovered that these biological processes were closely related to mitochondrial behavior. The GO analysis suggested that, through the activation of ubiquitin-protein binding processes and gene translational and transcriptional activities, biological processes, including ubiquitin-proteasome system (UPS) metabolism, mitochondrial gene expression, macroautophagy, and vesicular transport, occurred within the organelle membrane, mitochondria, or nuclear regions (Figure 4D).
Identification of Core Genes
Intersecting the DEGs with the MPTPRGs yielded a total of 106 DE-MPTPRGs (Figure 4E). Subsequently, leveraging the PPI network provided by STRING, we identified 248 unique interaction pairs (Figure 4F). Within this PPI network, we observed that SPG7 exhibited high-intensity interactions with AFG3L2 and PPIF. This suggests that these three proteins might constitute essential components of the mPTP and regulate its transient opening function.
To further identify the DE-MPTPRGs causally associated with COPD hospitalization events, we conducted MR analysis. Following a preliminary MR analysis utilizing whole blood-derived eQTL data, we identified eight key genes—COQ2, DIABLO, IMMT, PARP1, SEC13, SLC25A3, SPG7, and TNF—that satisfied the core assumptions of the MR analysis. However, PARP1 and SLC25A3 were excluded as their regulatory trends were inconsistent with the findings of the differential analysis. Ultimately, we retained six key DE-MPTPRGs (details regarding their corresponding SNP counts and further information are presented in Table 1). However, an MR analysis utilizing the lung tissue-derived eQTL dataset did not yield additional or more meaningful results compared to those derived from whole blood. Details are provided in Table S5.
 |
Table 1 Causal Relationships Between Differentially Expressed mPTP-Related Genes in STCOPD/AECOPD and COPD Hospitalization Events |
During the MR analysis of the six key DE-MPTPRGs, after excluding SNPs significantly associated with COPD hospitalization events, 131 IVs were ultimately obtained. The F-statistic for each SNP exceeded 10, confirming their suitability for the MR analysis (Tables S6 and S7). Finally, employing the IVW method, we elucidated the significant causal associations between the key genes and COPD hospitalization events.
Forest plots and scatter plots demonstrated that DIABLO, IMMT, COQ2, SEC13, and TNF were negatively associated with COPD hospitalization events, whereas SPG7 exhibited a positive association (Figures S1 and S2). Funnel plots revealed no evident asymmetry, suggesting that this analysis adhered to the principle of random assortment dictated by Mendel’s Second Law (Figure S3). In the sensitivity analyses, both the heterogeneity test and the horizontal pleiotropy test yielded P-values greater than 0.05, indicating the absence of significant heterogeneity and confounding bias, thereby validating the robustness of the analytical results (Tables S8 and S9). Nevertheless, the potential for genetic pleiotropy may still exist. The LOO plots demonstrated that the exclusion of any single SNP did not significantly alter the overall effect of the remaining SNPs on any of the key genes, further supporting the reliability of the MR analysis results (Figure S4). Finally, we conducted a colocalization analysis to evaluate the association between the expression of the key protein SPG7 and COPD hospitalization events. Regrettably, we did not find sufficient evidence to support the presence of a significant shared causal variant between SPG7 expression and the occurrence of COPD hospitalization events  . Further details are provided in Figure S5. We speculate that this outcome was influenced by the eQTL datasets employed, as neither the tissue- nor blood-derived eQTL data could comprehensively represent the pathological state of STCOPD. Secondly, the MR analysis results may imply that the exacerbation of COPD driven by SPG7 is not a local effect induced by a single potent mutation, but rather stems from the cumulative impact of multiple variants with minor effects. This is because, unlike colocalization analysis, MR has the capacity to aggregate multiple SNPs exhibiting consistent directions but weak individual effects, thereby capturing the accumulation of polygenic minor effects.
Validation and Functional Annotation of Key Genes
We utilized external validation sets to verify the diagnostic efficacy of the key genes, thereby further evaluating their critical roles in the transition from STCOPD to AECOPD. We integrated the key genes into a predictive nomogram and plotted calibration curves (Figure 5A–C). The calibration curves demonstrated a high degree of consistency between the predicted and actual observed outcomes, indicating acceptable predictive accuracy of the nomogram (Figure 5D–F). Furthermore, in the ROC curve evaluation, all areas under the curve (AUC) were greater than 0.7, further suggesting robust predictive performance (Figure 5G–I). To evaluate the clinical utility of the nomogram, decision curve analysis (DCA) was performed. The results revealed that the nomogram yielded a net benefit across a wide range of decision thresholds, indicating its superiority over the application of traditional single biomarkers in clinical scenarios (Figure S6).
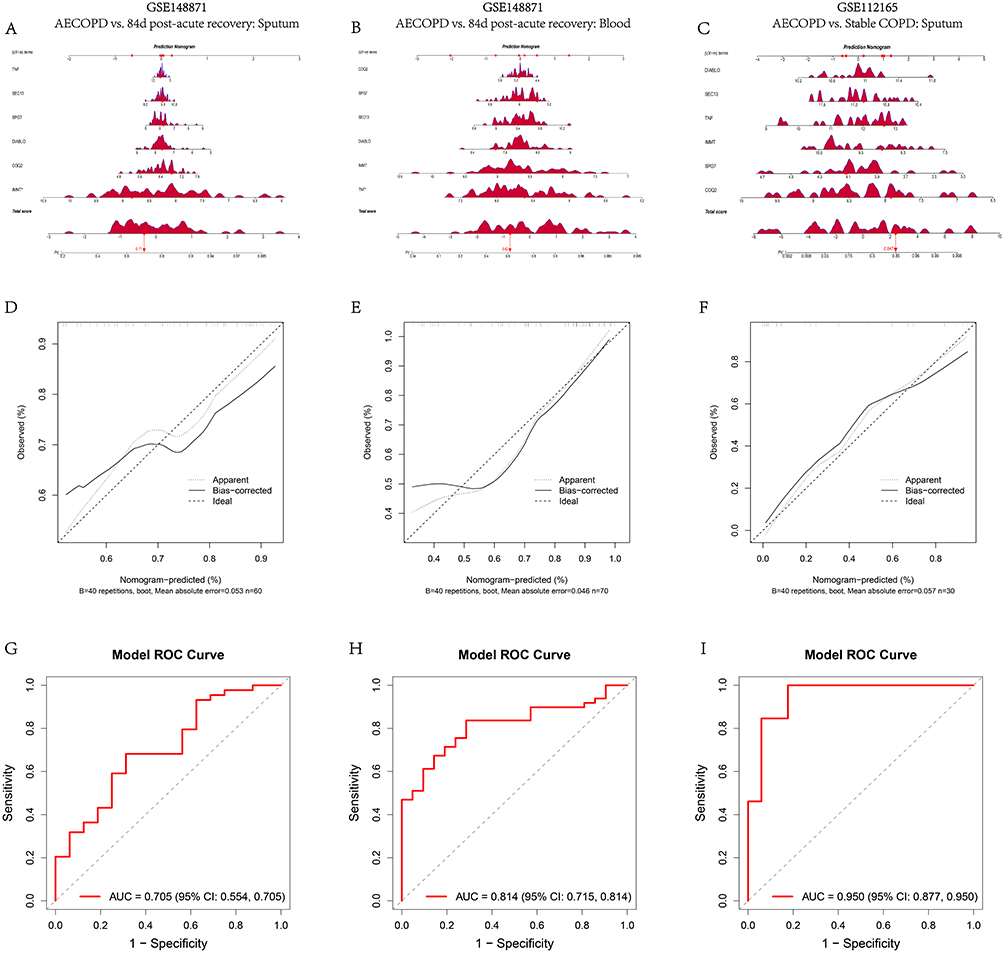 |
Figure 5 Validation of key biomarkers: (A) Development of a nomogram utilizing the expression levels of each biomarker for the GSE148871 Sputum cohort. (B) Development of a nomogram utilizing the expression levels of each biomarker for the GSE148871 Blood cohort. (C) Development of a nomogram utilizing the expression levels of each biomarker for the GSE112165 Sputum cohort. (D) Calibration curve of the nomogram for the GSE148871 Sputum cohort. (E) Calibration curve of the nomogram for the GSE148871 Blood cohort. (F) Calibration curve of the nomogram for the GSE112165 Sputum cohort. (G) Receiver operating characteristic curve and area under the curve analysis to evaluate the predictive performance of the nomogram for the GSE148871 Sputum cohort. (H) Receiver operating characteristic curve and area under the curve analysis to evaluate the predictive performance of the nomogram for the GSE148871 Blood cohort. (I) Receiver operating characteristic curve and area under the curve analysis to evaluate the predictive performance of the nomogram for the GSE112165 Sputum cohort. ↑: Indicate specific numerical values on the scale. |
Following the re-validation of the diagnostic efficacy, we evaluated the expression profiles of the key genes across the three validation sets. Boxplot analyses revealed that the expression levels of the six key genes did not all exhibit significant alteration trends between STCOPD and AECOPD, which may be attributed to the limited sample sizes of the validation sets. However, their overall median variation trends were fundamentally consistent with the findings from the training set. The primary discrepancy lay in the expression alterations of TNF, which were inconsistent across the three validation sets (Figure 6A–C). This phenomenon was even more pronounced in the correlation analysis (Figure 6E and F). We observed that across the three validation sets, the expressions of COQ2, DIABLO, IMMT, and SEC13 demonstrated positive synergistic correlations, whereas the expression of SPG7 was negatively correlated with all four aforementioned genes. As for TNF, its expression continued to exhibit significant disparities across the three validation sets.
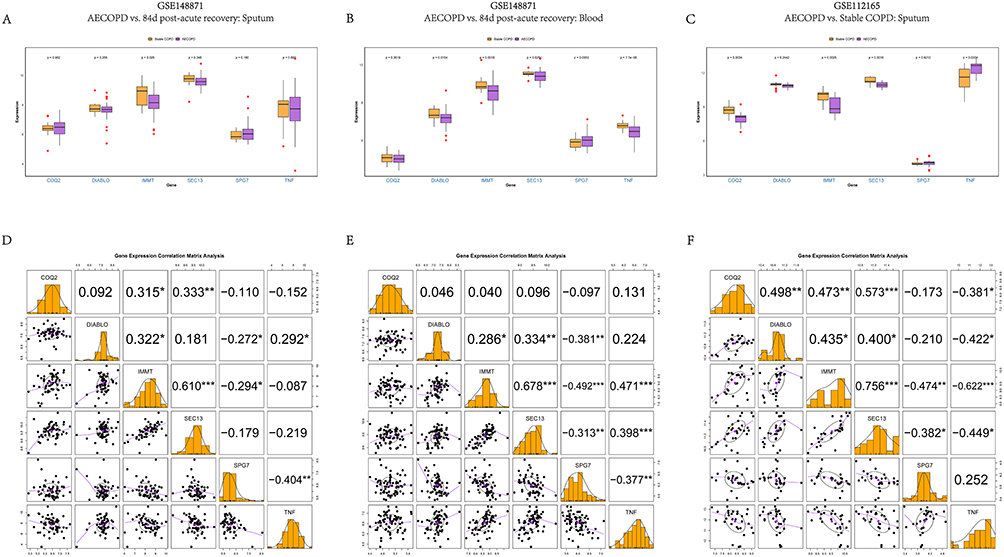 |
Figure 6 Functional expression of Biomarkers: (A) Expression levels of each biomarker between STCOPD and AECOPD in the sputum samples of the GSE148871 validation set. (B) Expression levels of each biomarker between STCOPD and AECOPD in the blood samples of the GSE148871 validation set. (C) Expression levels of each biomarker between STCOPD and AECOPD in the sputum samples of the GSE112165 validation set. (D) Correlation analysis of each biomarker between STCOPD and AECOPD in the sputum samples of the GSE148871 validation set. (E) Correlation analysis of each biomarker between STCOPD and AECOPD in the blood samples of the GSE148871 validation set. (F) Correlation analysis of each biomarker between STCOPD and AECOPD in the sputum samples of the GSE112165 validation set. *P < 0.05, **P < 0.01, ***P < 0.001. |
To comprehensively analyze the key molecular biological functions, GSEA was conducted. The GSEA results demonstrated that SPG7, SEC13, IMMT, DIABLO, COQ2, and TNF were significantly enriched in 108, 95, 86, 79, 77, and 76 molecular functions, respectively. Based on the expression trends of the key genes, we further discovered that during the transition from STCOPD to AECOPD, these molecular functions were predominantly concentrated in “voltage-gated monoatomic ion channel activity involved in regulation of presynaptic membrane potential”, “bitter taste receptor activity”, “serotonin receptor activity”, “neuropeptide receptor activity”, and “G protein-coupled amine receptor activity”. This implies a widespread activation of G protein-coupled receptors (GPCRs) (Figure 7A–F). The activation of these molecular functions further underscores the intimate relationship between the regulation of mitochondria-associated proteins and ion channel homeostasis, while also implying that the mPTP serves as a pivotal ion channel protein complex capable of executing mitochondrial quality control.
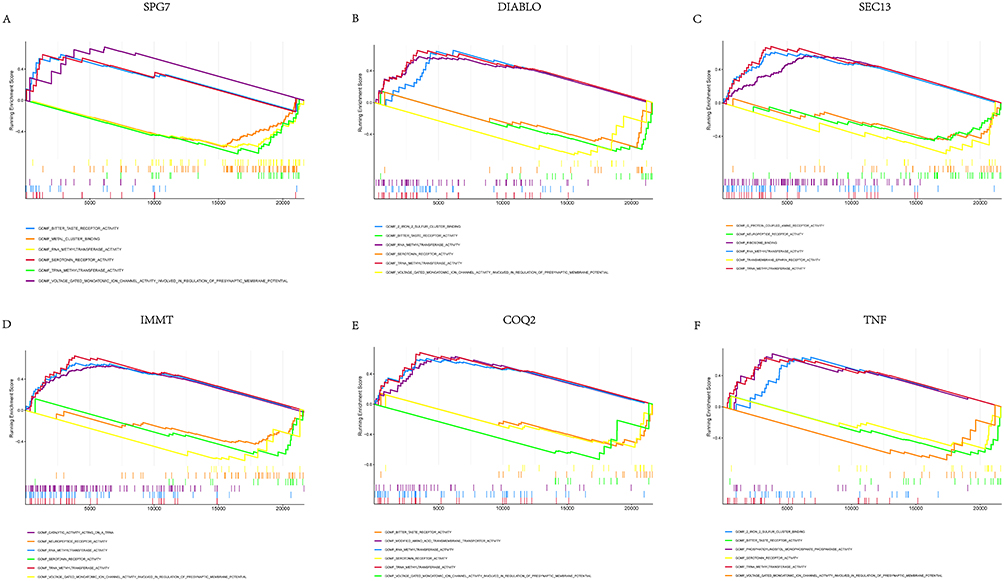 |
Figure 7 Gene set enrichment analysis of key biomarkers: (A) GSEA results for SPG7. (B) GSEA results for DIABLO. (C) GSEA results for SEC13. (D) GSEA results for IMMT. (E) GSEA results for COQ2. (F) GSEA results for TNF. |
Immune Responses Under Changes in Key Genes
We evaluated the infiltration scores of 28 immune cell types in the STCOPD and AECOPD samples, visualizing the results utilizing stacked bar charts (Figure 8A). The analysis revealed significant differences in the infiltration abundances of 20 immune cell types between the two groups (P<0.05). Among these, only activated B cells and monocytes exhibited significantly increased infiltration in the AECOPD sputum samples (P<0.05). Conversely, the infiltration of the remaining 18 immune cell types—including T helper cells, natural killer (NK) cells, CD4⁺T cells, and CD8⁺T cells—was significantly decreased in the AECOPD sputum samples (P<0.05). This further reflects the state of immune activation present in the sputum of patients with AECOPD compared to those with STCOPD (Figure 8B). Furthermore, we performed a correlation analysis between the 20 differentially infiltrated immune cell types and the key genes. The results demonstrated (Figure 8C and D) that the infiltration of activated B cells and monocytes was significantly and positively correlated with SPG7. In stark contrast to the alterations of SPG7, IMMT and SEC13 exhibited a significant negative correlation with activated B cell infiltration, while showing a significant positive correlation with the infiltration of the majority of the downregulated immune cells. COQ2, DIABLO, and TNF demonstrated weak correlations with the infiltration of most immune cells, lacking representativeness. Such synchronous alterations between the immune infiltration patterns and the expression trends of key genes further suggest that the immune infiltration microenvironment might exert an influence on the mPTP through interactions with SPG7, IMMT, and SEC13.
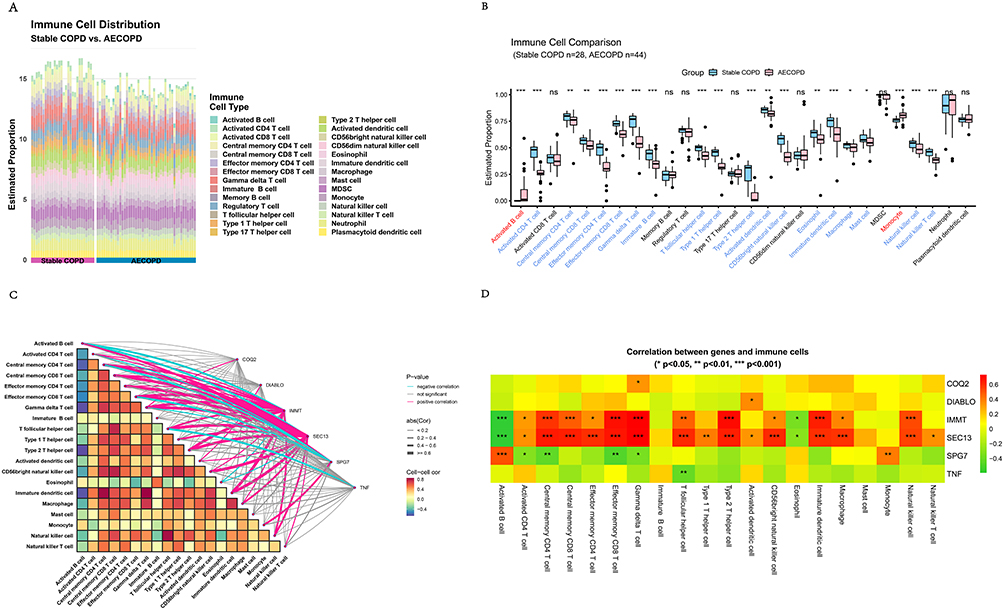 |
Figure 8 Immune infiltration analysis results: (A) Stacked bar chart of single-sample GSEA scores for 28 immune cell types. (B) Differences in immune cell infiltration abundance between STCOPD and AECOPD. Red indicates upregulation in AECOPD, while blue indicates downregulation in AECOPD. (C) Correlation heatmap and network graph illustrating the internal correlations among the immune cells and their interaction network with the key genes. (D) Heatmap detailing the specific expression correlations between the key genes and the infiltrating immune cells. *P < 0.05, **P < 0.01, ***P < 0.001, ns: P > 0.05. |
Single-Cell Analysis and Specific Expression of Key Genes
We further validated the expression alterations of the key DE-MPTPRGs between STCOPD and AECOPD at the cellular level through single-cell RNA sequencing (scRNA-seq) analysis. Following quality control, we obtained a total of 4730 cells and 19,194 genes (Figure S7A). Subsequently, we screened the top 3000 highly variable genes and utilized the top 41 principal components (PCs) for downstream analysis (Figure S7B and C). Through dimensionality reduction and clustering, 15 distinct cell clusters were generated (Figure S7D). By referencing the marker genes of pulmonary lineage cells from existing literature, we initially plotted the UMAP maps for 8 cell types and labeled their specific genes (Figure 9A and B). Similarly, for subsequent in-depth analysis, we further annotated 14 cell types (Figure 9C and D). However, the fifth cell cluster lacked specific cellular marker genes. To evaluate the type and state of this cell cluster, we discovered that within the fifth cell cluster (Table S10), MT-ND5 and MTRNR2L10 were activated, indicating enhanced mitochondrial respiratory activity in this cell population.37 The elevated expression of FUS and HNRNPH1 implies that the cells within this cluster are undergoing transcriptome remodeling38,39 in response to the altered inflammatory environment induced by IAV. Furthermore, the expression of STK4 was also upregulated, demonstrating that this cell cluster is highly associated with immune cells, including various T lymphocytes.40 Therefore, we deduced that the fifth cell cluster primarily represents a mixed population of activated stress-state lymphocytes (ASL). In the stacked bar charts (Figure 9E and F), we observed that although the overall proportion of T lymphocytes remained virtually consistent, the proportion of ASL exhibited a multifold increase in AECOPD, which aligned with the variation trend of neutrophils. Additionally, we observed that the decline in the proportion of epithelial cells was predominantly driven by a multifold reduction in the proportion of alveolar type II epithelial cells.
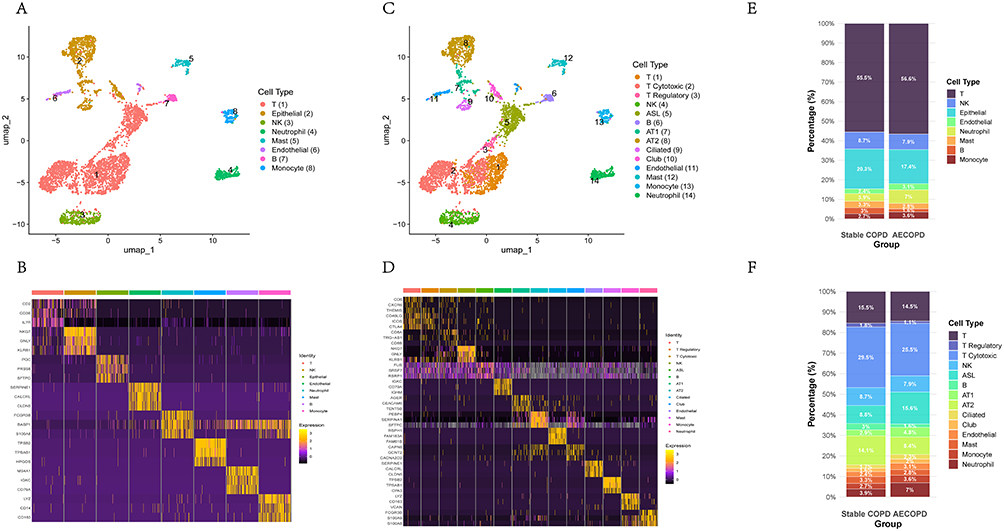 |
Figure 9 Single-cell sequencing analysis results: (A) UMAP plot visualizing 8 distinct cell clusters identified through clustering analysis. (B) Heatmap displaying the cell annotation results and marker gene expression for the 8 distinct cell clusters. (C) UMAP plot visualizing 14 distinct cell clusters identified through clustering analysis. (D) Heatmap displaying the cell annotation results and marker gene expression for the 14 distinct cell clusters. (E) Stacked bar chart illustrating the proportional distribution of the 8 annotated cell types between the Stable COPD and AECOPD groups. (F) Stacked bar chart illustrating the proportional distribution of the 14 annotated cell types between the Stable COPD and AECOPD groups. |
Subsequently, we investigated the expression profiles of the key genes across cell types between the groups. We observed that the expressions of COQ2, DIABLO, and TNF were not significant across the cells, whereas expression was predominantly observed for SPG7, IMMT, and SEC13 (Figure 10A), which could potentially be attributed to the limited sample size. The UMAP plots demonstrated the overall distribution and inter-group variation trends of the key gene expressions. The results indicated that although the inter-group variations in the expression of each key gene were not pronounced, the overall trends remained fundamentally consistent with the findings from the training set (Figure 10B–G). The expressions of COQ2, DIABLO, TNF, and SEC13 were relatively dispersed. However, SPG7 and IMMT were distinctly concentrated within the ASL cell cluster, implying that they might play crucial roles within this specific subpopulation.
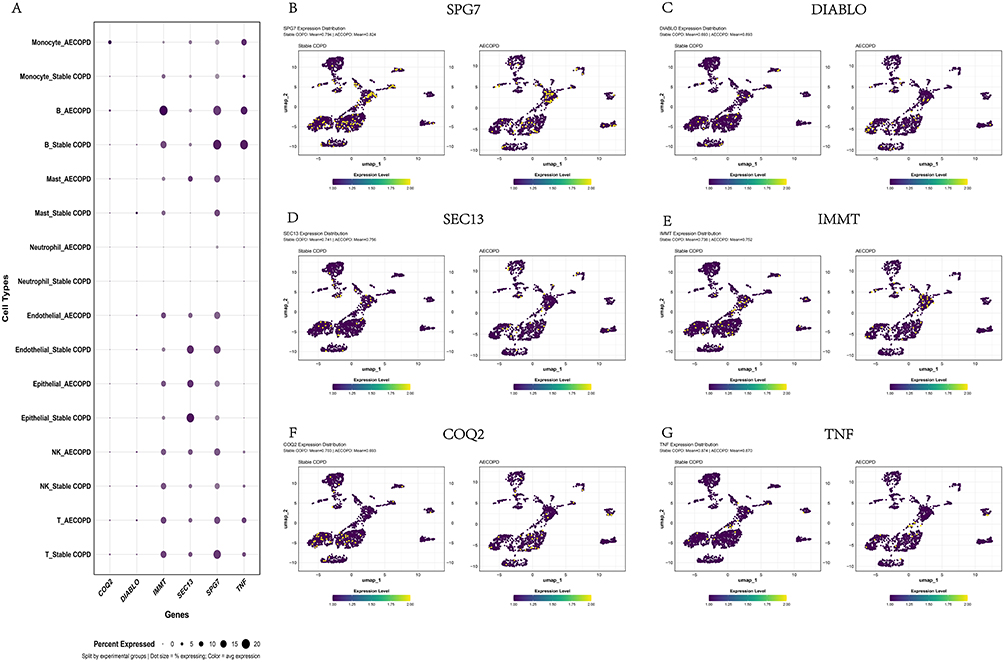 |
Figure 10 Expression levels of biomarkers in each cell type: (A) Expression levels of each biomarker among various cells, AECOPD, and STCOPD. (B) UMAP plots showing the single-cell expression distribution of the biomarker SPG7 in the STCOPD and AECOPD groups. (C) UMAP plots showing the single-cell expression distribution of the biomarker DIABLO in the STCOPD and AECOPD groups. (D) UMAP plots showing the single-cell expression distribution of the biomarker SEC13 in the STCOPD and AECOPD groups. (E) UMAP plots showing the single-cell expression distribution of the biomarker IMMT in the STCOPD and AECOPD groups. (F) UMAP plots showing the single-cell expression distribution of the biomarker COQ2 in the STCOPD and AECOPD groups. (G) UMAP plots showing the single-cell expression distribution of the biomarker TNF in the STCOPD and AECOPD groups. |
We observed that the key genes were primarily enriched in T lymphocytes. Therefore, we delineated the developmental trajectories of T lymphocytes utilizing pseudotime analysis. During T lymphocyte development, differentiation primarily bifurcates into two trajectories: one direction entails the differentiation of naive T cells into cytotoxic T cells, while the other involves differentiation into regulatory T cells, which subsequently progress to become the ASL subpopulation. Notably, compared with STCOPD, the abundance of the ASL cell cluster in AECOPD increased significantly, which potentially suggests a crucial role for ASL in immune activation and inflammatory responses (Figure 11A and B). Furthermore, Monocle3 clustered all T lymphocytes into a single partition (Figure 11C), further indicating that these cells belong to the same developmental lineage and are “closely related cells” with continuous differentiation relationships. Subsequently, we further analyzed the alterations in the expression levels of the key genes along the developmental trajectory. We found that, with the exception of TNF and SEC13, the expression levels of the remaining key genes were significantly elevated within the ASL cell cluster (Figure 11D), particularly SPG7. This further implies that SPG7 might be a pivotal gene regulating AECOPD via the mPTP. To determine the cellular functions within the ASL cluster, we constructed four co-expression gene modules (Figures 11E and S8). Given that ASL belongs to Module 4, we subsequently performed GO functional enrichment analysis on the genes within this module (Figure 11F). We discovered that the ASL cell cluster is highly associated with cellular respiration, oxidative phosphorylation, mitochondrial proton transmembrane transport, and mitochondrial membrane potential. This further suggests that the immuno-inflammatory state of AECOPD is influenced by the ASL cell cluster, which in turn is profoundly regulated by mitochondria. The underlying key mechanisms are likely highly correlated with the opening and closing of the mPTP.
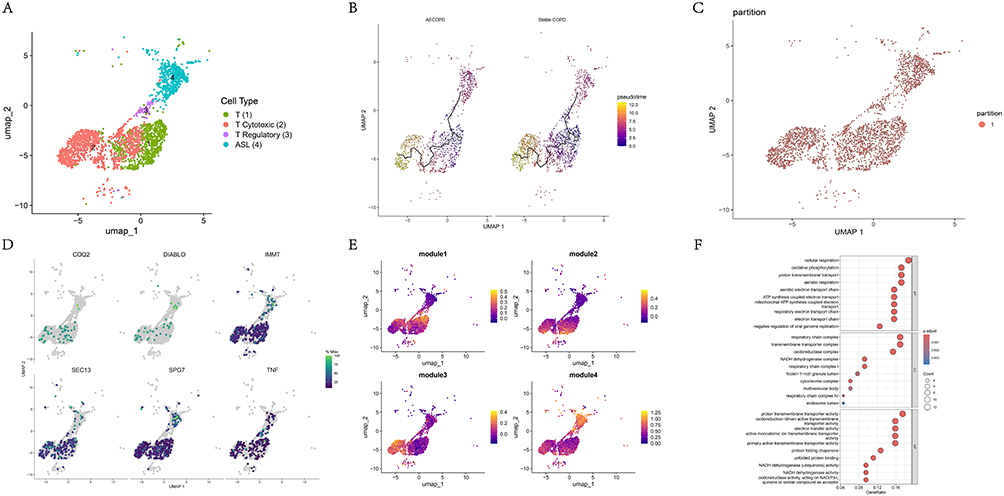 |
Figure 11 Pseudotime analysis results of T cells: (A) UMAP plot displaying the clustering results of T cell subclusters. (B) Pseudotime trajectory analysis of T cells, comparing the developmental trajectories between the AECOPD and Stable COPD groups. (C) UMAP plot showing the partition of T cells used for the developmental trajectory construction. (D) Expression trends of the six key biomarkers mapped onto the T cell developmental trajectory. (E) UMAP plots illustrating the distinct gene expression modules along the T cell developmental trajectory. (F) Dot plot showing the gene enrichment analysis results associated with Module 4. |
Finally, in the intercellular communication analysis, we observed that compared with STCOPD, the total number of interactions increased in AECOPD. This was predominantly characterized by an elevated number of interactions among immune cells, alongside a decline in interactions involving epithelial and endothelial cells (Figure 12A). Conversely, in stark contrast to the interaction count, the overall interaction strength among cells was significantly attenuated (Figure 12B). This indicates that during the AECOPD stage, the cellular architecture of the pulmonary tissue is disrupted, accompanied by the massive recruitment of immune cells; however, these recruited immune cells exist in a dysfunctional state. We postulate that this phenomenon might be attributed to the presence of dysfunctional mitochondria within these cells that cannot be effectively eliminated. This impairs ATP synthesis, thereby inducing oxidative stress, activating inflammatory pathways, and recruiting further immune cells, while simultaneously manifesting a state of diminished communication. This further corroborates the immuno-inflammatory infiltration microenvironment present in patients with AECOPD.
 |
Figure 12 Analysis results of intercellular communication: (A) Number of interactions. (B) Interaction strength. |
Regarding the overall findings of the single-cell analysis, constrained by an excessively small sample size, the expression of several key genes lacked statistical significance and exhibited unpronounced trends. Consequently, the single-cell analysis results serve merely as a supplementary reference to the preceding analyses.
Validation of Molecular Docking
The purpose of this study is not to screen for potential therapeutic agents for AECOPD, but rather to further validate whether the corresponding proteins of the key genes could serve as potential regulators of the mPTP, leveraging the confirmed functions of existing drugs. Regrettably, the database did not provide protein structure models for COQ2 and IMMT derived from X-ray crystallography; consequently, molecular docking for these two proteins was abandoned. Nevertheless, we obtained two potentially associated compounds for each core protein from the DSigDB database (Table 2). Finally, molecular docking was performed on the remaining four protein models, and the small molecule compounds bound to them all exhibited moderate to high binding affinities (Figure 13A–H).
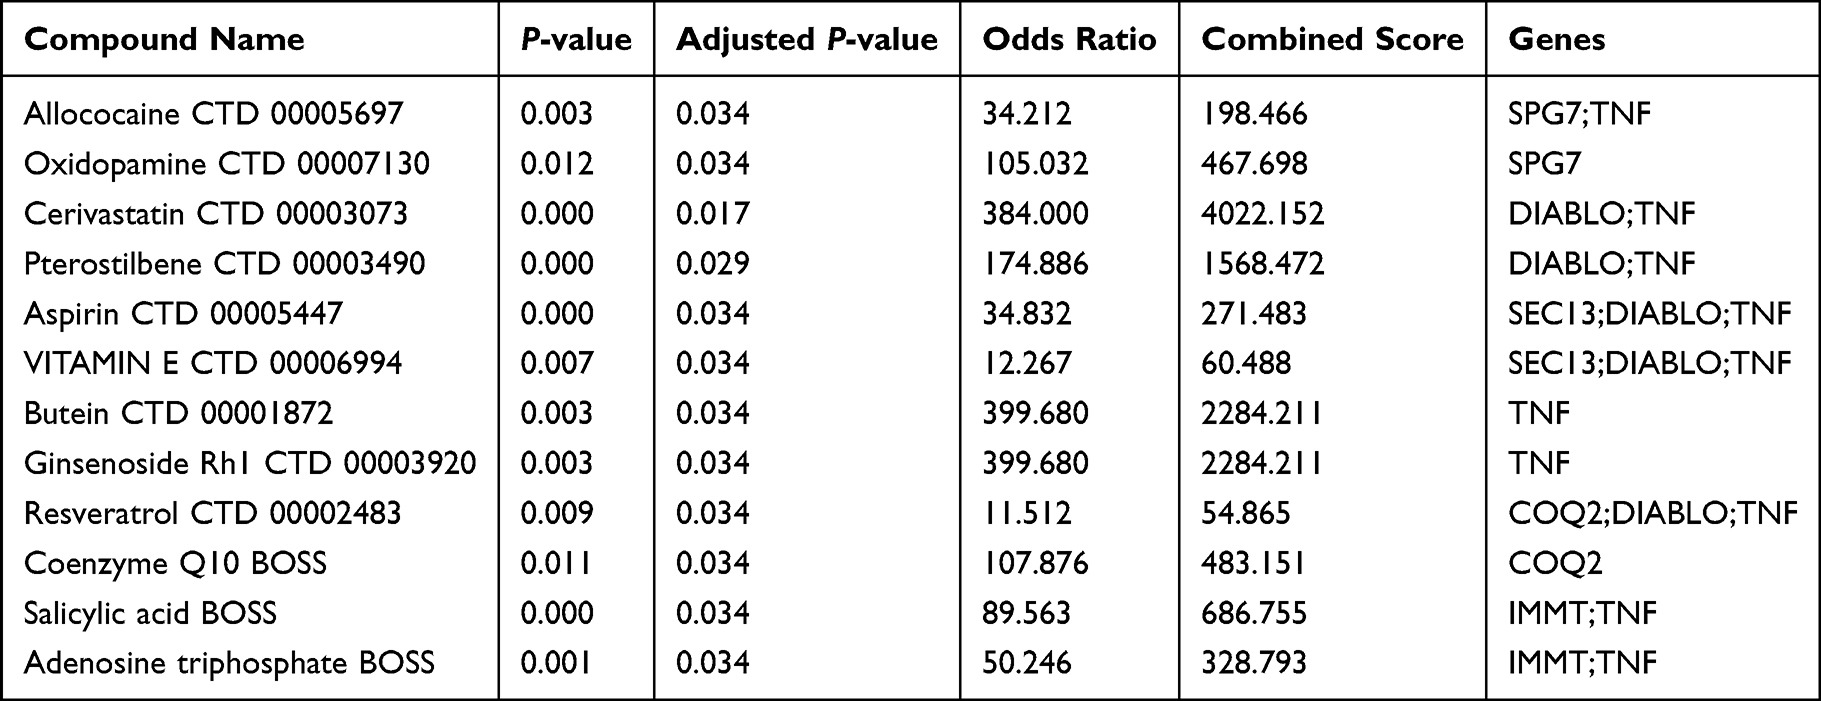 |
Table 2 Association Between Core Biomarkers and Potential Compounds: Derived From DSigDB |
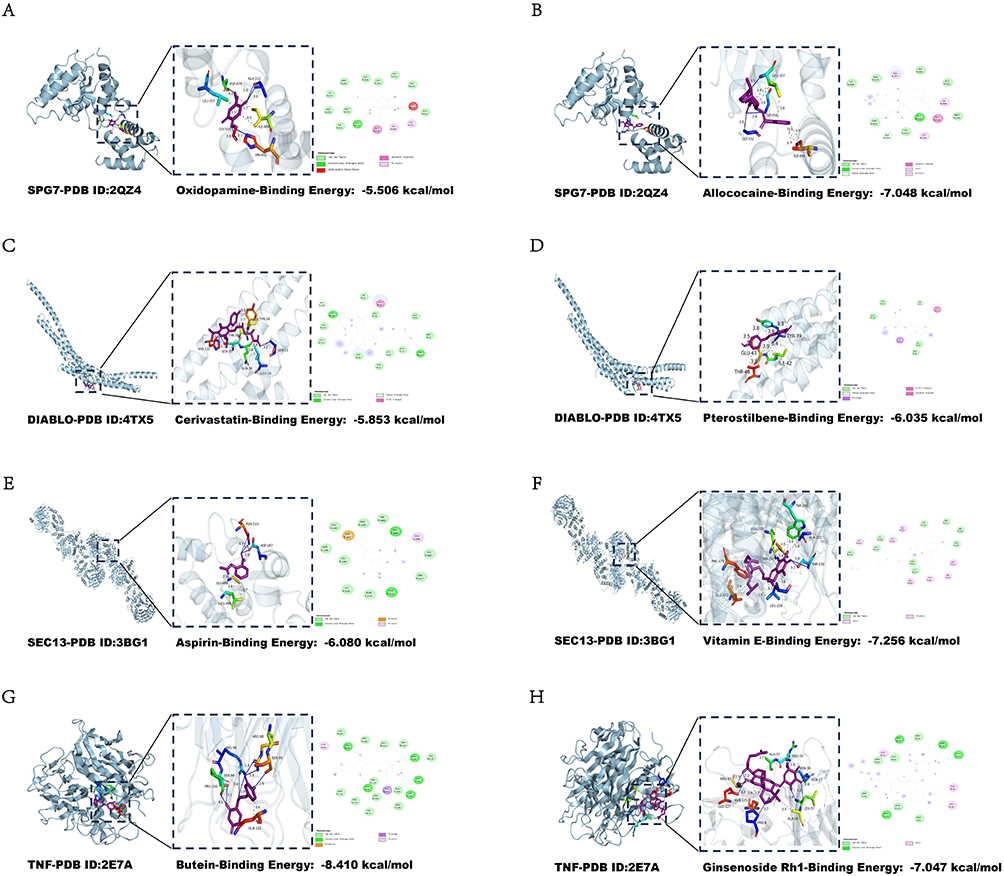 |
Figure 13 Molecular docking results: (A) Molecular docking results showing the binding interaction between SPG7 and Oxidopamine. (B) Molecular docking results showing the binding interaction between SPG7 and Allococaine. (C) Molecular docking results showing the binding interaction between DIABLO and Cerivastatin. (D) Molecular docking results showing the binding interaction between DIABLO and Pterostilbene. (E) Molecular docking results showing the binding interaction between SEC13 and Aspirin. (F) Molecular docking results showing the binding interaction between SEC13 and Vitamin E. (G) Molecular docking results showing the binding interaction between TNF and Butein. (H) Molecular docking results showing the binding interaction between TNF and Ginsenoside Rh1. |
From the presentation of all the aforementioned results, it is evident that the ultimate target gene of this study has been definitively identified. SPG7 demonstrated a crucial role across multiple key findings, which was further supported by the molecular docking results. Oxidopamine is a selective neurotoxin that induces dopaminergic neuronal damage via the generation of ROS and is widely utilized to establish animal models of Parkinson’s disease.41 The presence of potential binding sites between Oxidopamine and the SPG7 protein suggests that SPG7 might be a critical factor regulating mitochondrial function. Allococaine has been validated as a sodium channel inhibitor with the capacity to block voltage-gated sodium channels, thereby disrupting the stability of the membrane potential.42 Furthermore, the presence of even stronger binding sites between Allococaine and SPG7 indicates that SPG7 is highly correlated with membrane potential levels.
Discussion
COPD is an inflammatory disease characterized by progressive and irreversible structural and functional damage to lung tissue,43 primarily manifesting as airflow obstruction, mucus hypersecretion, alveolar wall destruction, and airway smooth muscle cell proliferation. Among these structures, alveolar type II (AT2) epithelial cells play a critical role in maintaining the structural and functional integrity of lung tissue.44 The extensive destruction and impairment of AT2 cells will lead to aberrant injury repair in COPD.45 Therefore, maintaining a stable cellular functional state to protect lung tissue architecture and delay the decline in pulmonary function represents the core interventional objective in the treatment of COPD. However, for cells to exert their normal physiological functions, they predominantly rely on the energy supplied by mitochondria. Consequently, the cellular state is intimately associated with the functional regulation of mitochondria. Once mitochondrial regulatory mechanisms are disrupted, the most severe consequence is the mediated initiation of intrinsic cellular apoptosis.
Across different stages of COPD, this dysregulation of mitochondrial homeostasis serves as a key factor mediating lung tissue damage, among which mitophagy represents the most critical mitochondrial regulatory mechanism. The precise regulation of mitophagy has become a primary focus for numerous researchers, as well as one of the most controversial subjects in the field. Some studies suggest that cigarette smoke extract (CSE) exacerbates mitochondrial damage and depolarization by increasing mitophagy,46 proposing that roflumilast exerts a protective effect on lung bronchial epithelial cells by inhibiting PINK1 expression.47 Conversely, other studies20,48,49 completely refute this perspective. These investigations argue that mitophagy attenuates the production of reactive oxygen species (ROS) in airway epithelial cells, thereby demonstrating that adequate mitophagy helps alleviate cigarette smoke-induced oxidative stress in lung tissue and mitigates COPD-associated airway inflammation. This contradiction is similarly evident in research concerning COPD-mediated cellular senescence. Several studies contend50–52 that impaired mitophagy is a primary cause of cellular senescence, reflecting that insufficient mitophagy leads to the accumulation of damaged mitochondria. Alternatively, other research proposes that if autophagy is persistently activated and unregulated under stress conditions, it preferentially damages lung epithelial cells, driving pulmonary inflammation and injury in COPD by compromising epithelial cell function.53 Furthermore, overactivation can lead to a decline in intracellular ATP levels, subsequently triggering programmed cell death or necrosis.54–56 Regarding the contradictory phenomena across these studies, some scholars propose that the physiological demands or pathological alterations in autophagy levels might correspond to distinct COPD phenotypes.17,57 We postulate that this phenomenon is associated not only with the COPD phenotype but also with the dynamic staging states of the disease.
Synthesizing the contradictory phenomena of the aforementioned previous studies and the preliminary results of the current study, we exploratively propose a mitochondria-driven hypothetical framework (Figure 2, left panel). The core of this hypothetical framework posits that “mitochondria strive to promote cell survival to maintain the structural and functional stability of pulmonary tissue, thereby protecting lung function and delaying pulmonary senescence”. We contend that for the structural cells of lung tissue, if cell death occurs, the physiological significance of all organelles is rendered obsolete, and pulmonary function will be further compromised. Therefore, this hypothesis initially proposes that upon exposure to massive external stimuli, cells preferentially initiate mitophagy; by sacrificing mitochondria, they attenuate intracellular energy metabolism to sustain cell survival. Mitophagy is contingent upon membrane potential depolarization, whereas the mitochondrial membrane potential is strictly governed by the ion transport processes of the mPTP.16,22 Accordingly, the hypothesis further suggests that mitophagy is not the preferred choice for cellular autoregulation.21 Instead, cells are more inclined to maintain a high-energy state while sustaining survival, thereby executing complete cellular metabolic functions. Finally, the hypothesis proposes that “mitochondrial flickering” might act as the trigger for maintaining the stability of the mitochondrial membrane potential; specifically, enhancing the capacity for “flickering” can not only rescue cells on the verge of intrinsic apoptosis by augmenting autophagy, but also reverse non-essential autophagy and restore oxidative phosphorylation, thereby stabilizing cellular function.
Therefore, based on the aforementioned hypothetical framework, this study further deduces a novel COPD management strategy (Figure 2, right panel). We postulate that acute exacerbations of mild COPD are frequently accompanied by massive transient external stimuli. At this stage, reactive cellular autophagy is upregulated but remains insufficient to counteract the extensive damage, thereby predisposing cells to death. Consequently, by enhancing “mitochondrial flickering”, we can enable cells to maintain viability via mitophagy during the acute phase and autonomously restore cellular function following the resolution of the stimuli. Conversely, during the pulmonary senescence phase of STCOPD, we contend that chronic inflammatory stimuli drive mitophagy into a state of persistent overactivation, and the ensuing accumulation of senescent cells accelerates tissue senescence. At this juncture, we can similarly enhance “mitochondrial flickering” to avert tissue senescence induced by excessive mitophagy. Finally, in the end-stage of COPD, the organism exhibits a vicious cycle characterized by a low-energy state and hyperinflammation. At this point, solely enhancing “mitochondrial flickering” is ineffective. We should initially provide exogenous energy supplementation to increase mitophagy substrates. Subsequently, following anti-inflammatory interventions and the amelioration of the hyperinflammatory tissue microenvironment, enhancing “mitochondrial flickering” can prevent membrane potential collapse. This, in turn, activates mitophagy to sustain cell survival, ultimately allowing for the gradual restoration of cellular energy metabolism.
As the inaugural study to validate the aforementioned hypothetical framework, a pivotal task of this research is to verify the plausibility of this hypothesis. Through bioinformatic analyses, this study revealed that, compared with STCOPD, AECOPD is characterized by extensive AT2 cell death, accompanied by pronounced mitophagy and substantial energy metabolic demands, ultimately manifesting as widespread cellular dysfunction. Furthermore, we discovered that these alterations are highly correlated with mitochondrial membrane potential, ion channel activity, and transmembrane transport functions. This implies that the mPTP might play a crucial role in these processes. Subsequently, we identified six biomarkers—COQ2, DIABLO, IMMT, SEC13, SPG7, and TNF—which might establish causal relationships with AECOPD through the regulation of the mPTP. Finally, we postulate that SPG7 is a pivotal gene involved in the regulation of mitochondrial function in AECOPD by modulating the mPTP. Moreover, the SPG7 protein might interact with AFG3L2 or CypD to mediate protein modifications, thereby influencing the opening of the mPTP.
The Demand for Mitophagy is Prevalent in the AECOPD Stage
A minority of studies58 propose that short-term exposure to PM2.5 or CSE increases susceptibility to AECOPD by elevating ROS production and subsequently activating mitophagy. These studies contend that excessive mitophagy, rather than its deficiency, contributes to the acute exacerbation of COPD. However, their arguments were established by directly targeting and inhibiting ROS. Consequently, we have reasonable grounds to question whether such alterations in mitophagy are not merely a survival requisite for cells to cope with oxidative stress. Encouragingly, a growing body of in vivo and in vitro research has validated a ubiquitous demand for mitophagy during the AECOPD stage. Initially, some scholars3,48,59 postulated that mitophagy, initiated by CSE-induced dysregulation of mitochondria-associated protein homeostasis, exerts a protective role in AECOPD. Furthermore, an increasing number of studies59–64 collectively assert that short-term exposure to CSE impairs mitophagy flux in pulmonary epithelial cells, which manifests as the accumulation of LC3-II, p62, and polyubiquitinated proteins. Conversely, enhancing mitophagy can alleviate this mitochondrial dysfunction.
The results of the present study further corroborate the plausibility of the hypothesis proposed in this section. We discovered that during the AECOPD stage, extensive AT2 cell death occurs, manifesting as a concurrent decline in both the number and strength of intercellular communications. This phenomenon is attributed to the fact that epithelial cells constitute the primary barrier between the organism and the external environment.65 Infections triggered by external stimuli, such as CSE and IAV, primarily drive epithelial cells to experience earlier and more pronounced cellular energy depletion and mitochondrial dysfunction.66 Consequently, to clear the infection and protect the cells, the organism manifests a robust energy demand. On the one hand, the tissues develop a hyperinflammatory microenvironment characterized by immune infiltration. This is evidenced by the profound activation of B cells in the sputum of patients with AECOPD. Initially, the activation of B cells requires energy; subsequently, activated B cells rely on oxidative phosphorylation to exert their immune functions.67 On the other hand, the rapid activation of immune cells is observed within the pulmonary tissues of patients with AECOPD. This activation is predominantly concentrated within the ASL cell cluster, which concurrently exhibits a high demand for oxidative phosphorylation. Furthermore, this process is accompanied by massive neutrophil infiltration.
The energy requirements of immune cells and the maintenance of cell viability within infectious and hyperinflammatory microenvironments impose a tremendous energy burden on the organism, a phenomenon similarly reflected by mitochondrial alterations at the cellular level. The present study discovered that during the AECOPD stage, GPCRs are extensively activated, thereby providing an energy gain for the cells. However, the activation of these receptors is not entirely beneficial to mitochondria; rather, it likely maintains a state of equilibrium. Bitter taste receptors (TAS2Rs), a class of G protein-coupled receptors, have been demonstrated to possess anti-inflammatory and bronchodilatory activities.68 Nevertheless, these effects are mediated through increased mitochondrial calcium uptake.69 Consequently, TAS2Rs-mediated mitochondrial calcium overload leads to the loss of membrane potential, activates apoptotic pathways, and disrupts mitochondrial energy metabolism.70 Although the activation of TAS2Rs elevates the risk of cell death, this risk is potentially mitigated and balanced by the concurrent activation of other GPCRs. For instance, the serotonin receptors identified in this study are functionally expressed within mitochondria, participating in the maintenance of mitochondrial ROS and calcium homeostasis, and enhancing ATP production efficiency to counteract stress and fluctuations in oxygen tension.71 This further corroborates the functional role of GPCRs localized to mitochondria.
The augmented energy production following stress is utilized for mitochondrial quality control to restore cellular function and promote cell survival. The present study reveals that in AECOPD samples, mitochondrial gene expression, macroautophagy, and vesicular transport are initiated, accompanied by the concurrent activation of the UPS. This implies the presence of abundant damaged proteins and mitochondria within the cells, alongside the widespread activation of mitophagy. Proteostasis is crucial for maintaining normal cellular processes and overall health.72 Fueled by adequate ATP,73 the UPS can mediate the clearance of oxidatively damaged mitochondria under both aerobic and anaerobic conditions.74 This process further accelerates the rate of mitophagy, thereby ensuring cell survival.
Nevertheless, the level of mitophagy remains insufficient. At the macroscopic level, it continues to exhibit similarities with mitochondrial dysfunction-related diseases, such as Alzheimer’s disease, Parkinson’s disease, and amyotrophic lateral sclerosis.75 Concurrently, various intercellular communications also manifest as dysfunctional. Therefore, we contend that, at least for acute exacerbations in patients with non-end-stage COPD, enhancing mitophagy represents a priority strategy that aligns with the physiological demands of the organism.
SPG7 is a Potential Regulator of Mitochondrial Flickering
At the genetic level in AECOPD, the alterations in the six biomarkers further elucidate the cellular regulatory mechanisms following stress. The expression changes of these six genes can be categorized into three distinct profiles manifesting post-cellular stress. The first category is represented by SPG7 and DIABLO, which promote cell survival. SPG7 is postulated to regulate the transient opening of the mPTP to mitigate the collapse of oxidative phosphorylation, thereby preserving cell viability under continuous Ca2⁺ stress.76,77 Although colocalization analysis does not support a significant shared causal variant between SPG7 and the occurrence of COPD hospitalization events, this does not negate the intrinsic impact of SPG7 on COPD-related hospitalizations. This is because COPD hospitalization events typically signify acute exacerbations or refractory severe COPD, wherein the confounding factors are not directly determined by a single gene or protein. If the hypothesis of the present study holds true, the protective upregulation of SPG7—acting in response to human energy demands and the decline in mitochondrial membrane potential—should manifest more prominently in patients with moderate-to-severe stable COPD. Furthermore, it should similarly exhibit systemic mitochondrial characteristics, thereby accumulating more extensively in whole blood. Only when the mitochondrial regulatory flux is thoroughly devastated, thereby inducing cell death and triggering an inflammatory burst, might this cumulative effect transition into AECOPD, culminating in a COPD hospitalization event. The downregulation of DIABLO, which encodes a mitochondria-released pro-apoptotic protein, indicates that cells are attempting to maximize survival through mitochondrial regulation.78 Molecular docking further revealed that the DIABLO protein possesses binding sites for Cerivastatin and Pterostilbene. Cerivastatin can activate the mitochondrial apoptotic pathway,79 whereas Pterostilbene can protect cells from damage.80 This corroborates the biological significance of DIABLO downregulation. The second category involves detrimental changes manifesting as stress-induced injury, encompassing the downregulation of SEC13, IMMT, and COQ2. SEC13 is primarily involved in protein transport and inter-organelle communication; its downregulation under infection or oxidative stress attenuates the antiviral immune response and increases cellular susceptibility to oxidative damage.81 IMMT primarily maintains mitochondrial structural integrity and functional homeostasis. Its downregulation signifies that oxidative damage compromises mitochondrial function, subsequently impacting cell migration and survival.82 COQ2 primarily maintains mitochondrial energy metabolism by participating in coenzyme Q biosynthesis and exerts antioxidant effects. Its downregulation indicates that the mitochondrial oxidative phosphorylation pathway is impaired.83 The final category is represented by TNF, reflecting the level of inflammation. The present study revealed inconsistent expression trends for TNF across different datasets. We postulate that this phenomenon might stem from the disparate inflammatory levels of COPD patients within the distinct datasets. Multiple studies have indicated that TNF-related protein levels are significantly elevated in patients with AECOPD.84,85 Compared with non-COPD individuals, patients with COPD exhibit higher levels of TNF-α, IL-8, and hs-CRP. However, following therapeutic interventions, the levels of TNF-α, IL-8, and hs-CRP in the peripheral blood universally decrease.86 Therefore, this phenomenon likely reflects the varying inflammatory states of COPD patients across the different datasets.
GSEA and single-cell sequencing analyses indicate that the alterations of these biomarkers correlate with the mitochondrial membrane potential via inner mitochondrial membrane ion channels, mitochondrial proton transmembrane transporters, and GPCRs, concurrently participating in the energy-yielding process of oxidative phosphorylation. Mitochondria maintain normal biological functions through numerous ion channels.16 Among these ion channels, the present study found that the regulation of Ca2⁺ channels plays a paramount role. Both TAS2Rs and serotonin receptors exert their biological functions by regulating the intramitochondrial Ca2⁺ concentration.68,87 If Ca2⁺ uptake mediated by the mitochondrial calcium uniporter complex16 represents the maintenance of cellular ionic homeostasis, then the “mitochondrial flickering” mediated by the mPTP constitutes the autonomous homeostatic regulation of the mitochondria. This is because the opening of the mPTP does not merely precipitate membrane potential collapse;76 an increasing body of evidence supports that mitochondrial flickering plays a vital role in mitochondrial Ca2⁺ homeostasis.77 Consequently, we contend that mitochondrial quality control during the AECOPD stage is highly correlated with the mPTP.
Among the six key biomarkers, only the expression trend of SPG7 consistently exhibits a high correlation with the regions characterized by a demand for oxidative phosphorylation. Furthermore, in the PPI network, we discovered that SPG7 exhibits robust interactions with AFG3L2 and PPIF. CypD is a peptidyl-prolyl isomerase encoded by the PPIF gene, which is located in the mitochondrial matrix and plays a critical regulatory role in the mPTP.76 To date, the exact molecular structure of the mPTP remains elusive, making CypD the sole identified critical regulatory factor of the mPTP.88 This implies that SPG7 very likely regulates mPTP function via CypD.
We postulate that the mPTP is regulated via at least two distinct pathways. The first, conventional pathway involves mitochondrial Ca2⁺ overload or oxidative stress inducing CypD to trigger the prolonged opening of the mPTP, which ultimately culminates in cellular damage.76 In the second pathway, we speculate that the SPG7 protein likely engages in a specific protein modification relationship with CypD. This interaction enables CypD to activate the transient opening function of the mPTP, thereby precluding its prolonged and detrimental activation.
Currently, an accumulating body of evidence substantiates our hypothesis. In 2015, the hypothesis postulating SPG7 as a core component of the mPTP was comprehensively proposed; this study89 indicated that the depletion of SPG7 leads to higher mitochondrial Ca2⁺ retention and exhibits characteristics similar to CypD knockdown, namely preventing Ca2⁺- and ROS-induced ΔΨm depolarization and cell death. However, the overexpression of SPG7 did not increase mitochondrial sensitivity to Ca2⁺-induced mPTP opening in the control group. This suggests that SPG7-mediated mPTP opening might represent a regulatory mechanism distinct from its full and sustained opening. In January 2020, the hypothesis of SPG7 acting as a core mPTP component was refuted; a subsequent study88 reported that no Ca2⁺-induced mPTP response was observed following SPG7 knockdown. Nevertheless, the study discovered that ATP levels increased significantly upon SPG7 overexpression. This further implies the stabilizing effect of SPG7 on the mitochondrial membrane potential. In October of the same year, another study77 directly confirmed that the functional expression of SPG7 is a prerequisite for CypD-mediated76 transient opening of the mPTP, and verified for the first time that SPG7 deficiency leads to neurodegeneration due to impaired mitochondrial flickering. In 2022, researchers90 further proposed that when AFG3L2 and SPG7 form a heterohexamer, the mPTP opens abnormally and induces cellular apoptosis. This m-AAA complex executes protein quality control within the inner membrane by selectively degrading unassembled and damaged proteins, while concurrently participating in the assembly of respiratory chain complexes.77 Therefore, the opening of the mPTP at this juncture is highly likely attributed to SPG7 losing its regulatory capacity over the mPTP following the formation of the heterohexamer. Accordingly, we can deduce that SPG7 is likely a pivotal factor regulating mitochondrial flickering, functioning independently of the traditional pathway of persistent mPTP activation.
Mitochondrial flickering serves as an efficacious pathway facilitating rapid Ca2⁺ release from mitochondria; furthermore, it can scavenge mtROS, activate the respiratory chain, and subsequently promote ATP synthesis.77,91 This aligns perfectly with the observed upregulation of SPG7. Consequently, we postulate that the protective effects elicited by SPG7 knockdown or CypD knockdown are merely transient. Once intramitochondrial oxidative stress and calcium overload completely overwhelm the autophagy flux, cell death remains inevitable—it is merely a matter of time. Only by restoring or augmenting the intrinsic ion regulatory mechanisms of mitochondria can cell survival be durably sustained.
Limitations of the Study
Although this study proposes several enlightening scientific hypotheses, as an exploratory investigation, it inevitably possesses certain limitations. First, constrained by the available resources in public databases, the sample size of this study is relatively limited (particularly the small scale of the training set and the single-cell transcriptome dataset), which, to some extent, reduces statistical power and may increase the risk of sampling error. Second, racial and population heterogeneity exists among the different datasets included in the analysis. Concurrently, eQTL data derived from healthy populations may not fully map the true pathological states and phenotypic characteristics of patients with STCOPD. Furthermore, microenvironmental discrepancies among different biological specimen sources (eg, peripheral blood, lung tissues, induced sputum), coupled with the diversity of triggering factors for AECOPD, may all act as potential confounding factors influencing the robustness of the analytical results. Third, the colocalization analysis failed to confirm the existence of a significant shared causal variant between SPG7 and COPD hospitalization events. Therefore, the specific biological functions of SPG7 as a potential key regulatory factor still urgently require validation through future in vivo and in vitro experiments as well as prospective cohort studies. Finally, during the processes of data mining and statistical fitting, multiple hypothesis testing and potential unmeasured confounding factors might elevate the risk of false-positive results.
Conclusion
In summary, this study exploratively proposes a “mitochondria-mediated cell survival hypothesis” and preliminarily corroborates its plausibility through bioinformatic analyses. Specifically, our research reveals widespread demands for energy and mitophagy during the AECOPD stage. Cells may satisfy this physiological demand and maintain viability by enhancing “mitochondrial flickering”, thereby preserving the structural integrity of the tissues. Additionally, we identified six biomarkers causally associated with acute exacerbations of COPD, among which SPG7 exhibited a profound correlation with mitochondrial flickering. However, the non-significant colocalization analysis attenuates the robustness of this hypothesis. Although the integrated results of this study suggest that SPG7 might be a potential key protein regulating the mPTP, the direct associations among these speculations, underlying mechanisms, and clinical evidence remain insufficiently explored. Given that persistent pulmonary senescence, frequent acute exacerbations, and multiple pulmonary infections alongside other related complications constitute the primary survival burden for patients with COPD, validating the mitochondria-related hypotheses of this study and integrating mitochondrial dysfunction with clinical outcome data represent a vital direction for future research endeavors.
Third Party Material
All of the material is owned by the authors and/or no permissions are required.
Data Sharing Statement
The original contributions of this study can be found in the main text and its supplementary materials; requests for data access and any further inquiries should be directed to the first corresponding author, Hong Fang.
Ethics Approval and Consent to Participate
Ethical approval was waived for this study because all analyses were based on publicly available summary statistics databases, did not involve personal data, and were entirely anonymized. This study also obtained an ethical exemption in accordance with local policies and complies with Items 1 and 2, Article 32 of the Measures for Ethical Review of Life Science and Medical Research Involving Humans: (1) conducting research utilizing legally obtained public data or data generated through observation without interfering with public behavior; and (2) conducting research using anonymized information and data.
Acknowledgments
We would like to express our gratitude to Longhua Hospital affiliated to Shanghai University of Traditional Chinese Medicine, and Director Hong Fang, for their support of this study.
Author Contributions
Anran Xu and Yaping Lv should be considered co-first authors. All authors made a significant contribution to the work reported, whether that is in the conception, study design, execution, acquisition of data, analysis and interpretation, or in all these areas; took part in drafting, revising or critically reviewing the article; gave final approval of the version to be published; have agreed on the journal to which the article has been submitted; and agree to be accountable for all aspects of the work.
Funding
This study was supported by the following grants: 1. National Natural Science Foundation of China (Grant No. 82202606); 2. National Natural Science Foundation Promotion Project of Renji Hospital, Shanghai Jiao Tong University School of Medicine (Grant No. RJTJ25-MS-112); 3. Preventive Treatment of Disease in Traditional Chinese Medicine Specialist Alliance Construction Project of Longhua Hospital Affiliated with Shanghai University of Traditional Chinese Medicine (Grant No. 2024LM01); 4. Fang Hong’s Famous TCM Physician Studio (Minhang District) (Grant No. mhmzy2024-06); 5. Wu Yingen’s Famous TCM Physician Studio Project (Shanghai Fengxian District Health Commission, Document No.2023-24); 6. Construction of Regional Traditional Chinese Medicine Diagnosis and Treatment Service System for Chronic Obstructive Pulmonary Disease (Fei Zhang) (Shanghai Municipal Health Commission, Shanghai Administration of Traditional Chinese Medicine, Document No.2024-15).
Disclosure
The authors declare that they have no competing interests.
References
1. Xu A, Liu Y, Li S, et al. Global burden of major chronic respiratory diseases among older adults aged 55 and above from 1990 to 2021: changes, challenges, and predictions amid the pandemic. PLoS One. 2025;20(8):e0329283. doi:10.1371/journal.pone.0329283
2. Kanani J. Autopsy analysis of sudden deaths in adults: causes and demographics from a one-year prospective study. Curr Health Sci J. 2025;51(3):343–28. doi:10.12865/CHSJ.51.03.05
3. Wang X, Zhu Z, Jia H, et al. Critical role of mitochondrial dynamics in chronic respiratory diseases and new therapeutic directions. Chin Med J. 2025;138(15):1783–1793. doi:10.1097/CM9.0000000000003704
4. Naeem S, Wang F, Mubarak R, et al. Mapping the global distribution, risk factors, and temporal trends of COPD incidence and mortality (1990-2021): ecological analysis. BMC Med. 2025;23(1):210. doi:10.1186/s12916-025-04014-0
5. Venkatesan P. GOLD COPD report: 2025 update. Lancet Respir Med. 2025;13(1):e7–e8. doi:10.1016/S2213-2600(24)00413-2
6. Cottage CT, Peterson N, Kearley J, et al. Targeting p16-induced senescence prevents cigarette smoke-induced emphysema by promoting IGF1/Akt1 signaling in mice. Commun Biol. 2019;2(1):307. doi:10.1038/s42003-019-0532-1
7. Woldhuis RR, Heijink IH, van den Berge M, et al. COPD-derived fibroblasts secrete higher levels of senescence-associated secretory phenotype proteins. Thorax. 2021;76(5):508–511. doi:10.1136/thoraxjnl-2020-215114
8. Birch J, Barnes PJ, Passos JF, et al. Mitochondria, telomeres and cell senescence: implications for lung ageing and disease. Pharmacol Ther. 2018;183:34–49. doi:10.1016/j.pharmthera.2017.10.005
9. Song Y, Han X, Wang Y, et al. Mitochondrial quality control: a new perspective in skeletal muscle dysfunction of chronic obstructive pulmonary disease. Aging Dis. 2024;16(6):3291–3310. doi:10.14336/AD.2024.1129
10. Fairley LH, Das S, Dharwal V, et al. Mitochondria-targeted antioxidants as a therapeutic strategy for chronic obstructive pulmonary disease. Antioxidants. 2023;12(4). doi:10.3390/antiox12040973
11. Bateman G, Guo-Parke H, Rodgers AM, et al. Airway epithelium senescence as a driving mechanism in COPD pathogenesis. Biomedicines. 2023;11(7):2072. doi:10.3390/biomedicines11072072
12. De Luca SN, Vlahos R. Targeting accelerated pulmonary ageing to treat chronic obstructive pulmonary disease-induced neuropathological comorbidities. Br J Pharmacol. 2024;181(1):3–20. doi:10.1111/bph.16263
13. Pokharel MD, Garcia-Flores A, Marciano D, et al. Mitochondrial network dynamics in pulmonary disease: bridging the gap between inflammation, oxidative stress, and bioenergetics. Redox Biol. 2024;70:103049. doi:10.1016/j.redox.2024.103049
14. Białas AJ, Sitarek P, Miłkowska-Dymanowska J, et al. The role of mitochondria and oxidative/antioxidative imbalance in pathobiology of chronic obstructive pulmonary disease. Oxid Med Cell Longev. 2016;2016(1):7808576. doi:10.1155/2016/7808576
15. Miao X, Jiang P, Wang Z, et al. Mitochondrial transplantation: a novel therapeutic approach for treating diseases. MedComm. 2025;6(6):e70253. doi:10.1002/mco2.70253
16. Szabo I, Szewczyk A. Mitochondrial ion channels. Annu Rev Biophys. 2023;52(1):229–254. doi:10.1146/annurev-biophys-092622-094853
17. Barnes PJ, Baker J, Donnelly L, et al. Autophagy in asthma and chronic obstructive pulmonary disease. Clin Sci. 2022;136(10):733–746. doi:10.1042/CS20210900
18. Albano GD, Montalbano AM, Gagliardo R, et al. Autophagy/mitophagy in airway diseases: impact of oxidative stress on epithelial cells. Biomolecules. 2023;13(8):1217. doi:10.3390/biom13081217
19. Mizumura K, Cloonan SM, Nakahira K, et al. Mitophagy-dependent necroptosis contributes to the pathogenesis of COPD. J Clin Invest. 2014;124(9):3987–4003. doi:10.1172/JCI74985
20. Araya J, Tsubouchi K, Sato N, et al. PRKN-regulated mitophagy and cellular senescence during COPD pathogenesis. Autophagy. 2019;15(3):510–526. doi:10.1080/15548627.2018.1532259
21. Narendra DP, Youle RJ. The role of PINK1-parkin in mitochondrial quality control. Nat Cell Biol. 2024;26(10):1639–1651. doi:10.1038/s41556-024-01513-9
22. Ying Z, Xiang G, Zheng L, et al. Short-term mitochondrial permeability transition pore opening modulates histone lysine methylation at the early phase of somatic cell reprogramming. Cell Metab. 2018;28(6):935–45.e5. doi:10.1016/j.cmet.2018.08.001
23. Endlicher R, Drahota Z, Štefková K, et al. The mitochondrial permeability transition pore-current knowledge of its structure, function, and regulation, and optimized methods for evaluating its functional state. Cells. 2023;12(9):1273. doi:10.3390/cells12091273
24. Begg M, Hamblin JN, Jarvis E, et al. Exploring PI3Kδ molecular pathways in stable COPD and following an acute exacerbation, two randomized controlled trials. Int J Chron Obstruct Pulmon Dis. 2021;16:1621–1636. doi:10.2147/COPD.S309303
25. Hemani G, Zheng J, Elsworth B, et al. The MR-base platform supports systematic causal inference across the human phenome. Elife. 2018;7. doi:10.7554/eLife.34408
26. Burgess S, Scott RA, Timpson NJ, et al. Using published data in Mendelian randomization: a blueprint for efficient identification of causal risk factors. Eur J Epidemiol. 2015;30(7):543–552. doi:10.1007/s10654-015-0011-z
27. Chen Z, Zhao P, Luo Z, et al. Cancer cell membrane-biomimetic nanoparticles for homologous-targeting dual-modal imaging and photothermal therapy. ACS Nano. 2016;10(11):10049–10057. doi:10.1021/acsnano.6b04695
28. Yang M, Wan X, Zheng H, et al. No evidence of a genetic causal relationship between ankylosing spondylitis and gut microbiota: a two-sample mendelian randomization study. Nutrients. 2023;15(4):1057.
29. Davey Smith G, Hemani G. Mendelian randomization: genetic anchors for causal inference in epidemiological studies. Hum Mol Genet. 2014;23(R1):R89–98. doi:10.1093/hmg/ddu328
30. Chen Z, Chen Y, Zhang H, et al. Sensitivity analysis for causal mediation analysis with Mendelian randomization. JUSTC. 2024;54(12):1204. doi:10.52396/JUSTC-2023-0055
31. Chen J, Xu F, Ruan X, et al. Therapeutic targets for inflammatory bowel disease: proteome-wide Mendelian randomization and colocalization analyses. EBioMedicine. 2023;89:104494. doi:10.1016/j.ebiom.2023.104494
32. Foley CN, Staley JR, Breen PG, et al. A fast and efficient colocalization algorithm for identifying shared genetic risk factors across multiple traits. Nat Commun. 2021;12(1):764. doi:10.1038/s41467-020-20885-8
33. Hänzelmann S, Castelo R, Guinney J, et al. GSVA: gene set variation analysis for microarray and RNA-seq data. BMC Bioinf. 2013;14(1):7. doi:10.1186/1471-2105-14-7
34. Charoentong P, Finotello F, Angelova M, et al. Pan-cancer immunogenomic analyses reveal genotype-immunophenotype relationships and predictors of response to checkpoint blockade. Cell Rep. 2017;18(1):248–262. doi:10.1016/j.celrep.2016.12.019
35. Adams TS, Schupp JC, Poli S, et al. Single-cell RNA-seq reveals ectopic and aberrant lung-resident cell populations in idiopathic pulmonary fibrosis. Sci Adv. 2020;6(28):eaba1983. doi:10.1126/sciadv.aba1983
36. Sauler M, McDonough JE, Adams TS, et al. Characterization of the COPD alveolar niche using single-cell RNA sequencing. Nat Commun. 2022;13(1):494. doi:10.1038/s41467-022-28062-9
37. Giorgi C, Aan FJ, Glibetic N, et al. Mitochondrial PTRH2 controls the deubiquitinase TRABID to regulate mt-ND5 stability and metabolism. PNAS Nexus. 2025;4(6):pgaf178. doi:10.1093/pnasnexus/pgaf178
38. Jiang F, Lang X, Chen N, et al. A novel HNRNPH1::ERG rearrangement in aggressive acute myeloid leukemia. Genes Chromosomes Cancer. 2022;61(8):503–508. doi:10.1002/gcc.23051
39. Mariani D, Setti A, Castagnetti F, et al. ALS-associated FUS mutation reshapes the RNA and protein composition of stress granules. Nucleic Acids Res. 2024;52(21):13269–13289. doi:10.1093/nar/gkae942
40. Cagdas D, Halacli SO, Tan C, et al. Diversity in serine/threonine protein kinase-4 deficiency and review of the literature. J Allergy Clin Immunol Pract. 2021;9(10):3752–66.e4. doi:10.1016/j.jaip.2021.05.032
41. Pantic I, Cumic J, Skodric SR, et al. Oxidopamine and oxidative stress: recent advances in experimental physiology and pharmacology. Chem Biol Interact. 2021;336:109380. doi:10.1016/j.cbi.2021.109380
42. Matthews JC, Collins A. Interactions of cocaine and cocaine congeners with sodium channels. Biochem Pharmacol. 1983;32(3):455–460. doi:10.1016/0006-2952(83)90523-3
43. Lai S, Guo Z. Stem cell therapies for chronic obstructive pulmonary disease: mesenchymal stem cells as a promising treatment option. Stem Cell Res Ther. 2024;15(1):312. doi:10.1186/s13287-024-03940-9
44. Barkauskas CE, Cronce MJ, Rackley CR, et al. Type 2 alveolar cells are stem cells in adult lung. J Clin Invest. 2013;123(7):3025–3036. doi:10.1172/JCI68782
45. Wang D, Liu H, Bai S, et al. The PAR6B-PRKCI-PAR3 complex influences alveolar regeneration in patients with the emphysema subtype of chronic obstructive pulmonary disease. Stem Cell Res Ther. 2025;16(1):97. doi:10.1186/s13287-025-04189-6
46. Zhou WC, Qu J, Xie S-Y, et al. Mitochondrial dysfunction in chronic respiratory diseases: implications for the pathogenesis and potential therapeutics. Oxid Med Cell Longev. 2021;2021(1):5188306. doi:10.1155/2021/5188306
47. Kyung SY, Kim YJ, Son ES, et al. The phosphodiesterase 4 inhibitor roflumilast protects against cigarette smoke extract-induced mitophagy-dependent cell death in epithelial cells. Tuberc Respir Dis. 2018;81(2):138–147. doi:10.4046/trd.2017.0115
48. Barnes PJ. Pulmonary diseases and ageing. Subcell Biochem. 2019;91:45–74.
49. Li D, Shen C, Liu L, et al. PKM2 regulates cigarette smoke-induced airway inflammation and epithelial-to-mesenchymal transition via modulating PINK1/Parkin-mediated mitophagy. Toxicology. 2022;477:153251. doi:10.1016/j.tox.2022.153251
50. Sundar IK, Maremanda KP, Rahman I, et al. Mitochondrial dysfunction is associated with Miro1 reduction in lung epithelial cells by cigarette smoke. Toxicol Lett. 2019;317:92–101. doi:10.1016/j.toxlet.2019.09.022
51. Ahmad T, Sundar IK, Lerner CA, et al. Impaired mitophagy leads to cigarette smoke stress-induced cellular senescence: implications for chronic obstructive pulmonary disease. FASEB j. 2015;29(7):2912–2929. doi:10.1096/fj.14-268276
52. Bodas M, Van Westphal C, Carpenter-Thompson R, et al. Nicotine exposure induces bronchial epithelial cell apoptosis and senescence via ROS mediated autophagy-impairment. Free Radic Biol Med. 2016;97:441–453. doi:10.1016/j.freeradbiomed.2016.06.017
53. Racanelli AC, Kikkers SA, Choi AMK, et al. Autophagy and inflammation in chronic respiratory disease. Autophagy. 2018;14(2):221–232. doi:10.1080/15548627.2017.1389823
54. Leist M, Single B, Castoldi AF, et al. Intracellular adenosine triphosphate (ATP) concentration: a switch in the decision between apoptosis and necrosis. J Exp Med. 1997;185(8):1481–1486. doi:10.1084/jem.185.8.1481
55. Eguchi Y, Shimizu S, Tsujimoto Y, et al. Intracellular ATP levels determine cell death fate by apoptosis or necrosis. Cancer Res. 1997;57(10):1835–1840.
56. Jiang S, Sun J, Mohammadtursun N, et al. Dual role of autophagy/mitophagy in chronic obstructive pulmonary disease. Pulm Pharmacol Ther. 2019;56:116–125. doi:10.1016/j.pupt.2019.04.002
57. Wen W, Yu G, Liu W, et al. Silencing FUNDC1 alleviates chronic obstructive pulmonary disease by inhibiting mitochondrial autophagy and bronchial epithelium cell apoptosis under hypoxic environment. J Cell Biochem. 2019;120(10):17602–17615. doi:10.1002/jcb.29028
58. Fan X, Dong T, Yan K, et al. PM2.5 increases susceptibility to acute exacerbation of COPD via NOX4/Nrf2 redox imbalance-mediated mitophagy. Redox Biol. 2023;59:102587. doi:10.1016/j.redox.2022.102587
59. Ito S, Araya J, Kurita Y, et al. PARK2-mediated mitophagy is involved in regulation of HBEC senescence in COPD pathogenesis. Autophagy. 2015;11(3):547–559. doi:10.1080/15548627.2015.1017190
60. Kumar M, Seeger W, Voswinckel R, et al. Senescence-associated secretory phenotype and its possible role in chronic obstructive pulmonary disease. Am J Respir Cell Mol Biol. 2014;51(3):323–333. doi:10.1165/rcmb.2013-0382PS
61. van der Toorn M, Slebos DJ, de Bruin HG, et al. Cigarette smoke-induced blockade of the mitochondrial respiratory chain switches lung epithelial cell apoptosis into necrosis. Am J Physiol Lung Cell Mol Physiol. 2007;292(5):L1211–8. doi:10.1152/ajplung.00291.2006
62. Mercado N, Colley T, Baker JR, et al. Bicaudal D1 impairs autophagosome maturation in chronic obstructive pulmonary disease. FASEB Bioadv. 2019;1(11):688–705. doi:10.1096/fba.2018-00055
63. Tran I, Ji C, Ni I, et al. Role of cigarette smoke-induced aggresome formation in chronic obstructive pulmonary disease-emphysema pathogenesis. Am J Respir Cell Mol Biol. 2015;53(2):159–173. doi:10.1165/rcmb.2014-0107OC
64. van Rijt SH, Keller IE, John G, et al. Acute cigarette smoke exposure impairs proteasome function in the lung. Am J Physiol Lung Cell Mol Physiol. 2012;303(9):L814–23. doi:10.1152/ajplung.00128.2012
65. Zhou YW, Sun J, Wang Y, et al. Tas2R activation relaxes airway smooth muscle by release of Gαt targeting on AChR signaling. Proc Natl Acad Sci U S A. 2022;119(26):e2121513119. doi:10.1073/pnas.2121513119
66. Wei YY, Ye JJ, Zhang D-W, et al. Melatonin rescues influenza A virus-induced cellular energy exhaustion via OMA1-OPA1-S in acute exacerbation of COPD. J Pineal Res. 2024;76(5):e12991. doi:10.1111/jpi.12991
67. Imahashi N, Basar R, Huang Y, et al. Activated B cells suppress T-cell function through metabolic competition. J Immunother Cancer. 2022;10(12):e005644. doi:10.1136/jitc-2022-005644
68. Lecchi G, Mocchetti C, Tunesi D, et al. Single-nucleotide polymorphisms of TAS2R46 affect the receptor downstream calcium regulation in histamine-challenged cells. Cells. 2024;13(14):1204. doi:10.3390/cells13141204
69. Talmon M, Rossi S, Lim D, et al. Absinthin, an agonist of the bitter taste receptor hTAS2R46, uncovers an ER-to-mitochondria Ca(2+)-shuttling event. J Biol Chem. 2019;294(33):12472–12482. doi:10.1074/jbc.RA119.007763
70. Miller ZA, Muthuswami S, Mueller A, et al. GLUT1 inhibitor BAY-876 induces apoptosis and enhances anti-cancer effects of bitter receptor agonists in head and neck squamous carcinoma cells. Cell Death Discov. 2024;10(1):339. doi:10.1038/s41420-024-02106-z
71. Pan Y, Ji N, Jiang L, et al. GPCRs identified on mitochondrial membranes: new therapeutic targets for diseases. J Pharm Anal. 2025;15(7):101178. doi:10.1016/j.jpha.2024.101178
72. Kandel R, Jung J, Neal S, et al. Proteotoxic stress and the ubiquitin proteasome system. Semin Cell Dev Biol. 2024;156:107–120. doi:10.1016/j.semcdb.2023.08.002
73. Abi Habib J, Lesenfants J, Vigneron N, et al. Functional differences between proteasome subtypes. Cells. 2022;11(3):421. doi:10.3390/cells11030421
74. Sulkshane P, Ram J, Thakur A, et al. Ubiquitination and receptor-mediated mitophagy converge to eliminate oxidation-damaged mitochondria during hypoxia. Redox Biol. 2021;45:102047. doi:10.1016/j.redox.2021.102047
75. Karbowski M, Oshima Y, Verhoeven N, et al. Mitochondrial proteotoxicity: implications and ubiquitin-dependent quality control mechanisms. Cell Mol Life Sci. 2022;79(11):574. doi:10.1007/s00018-022-04604-8
76. Liu J, Wu C, Lin Z, et al. Cyclophilin D (PPIF) and MPTP in hepatic ischemia-reperfusion injury: insights into mechanisms. Front Immunol. 2025;16:1575242. doi:10.3389/fimmu.2025.1575242
77. Sambri I, Massa F, Gullo F, et al. Impaired flickering of the permeability transition pore causes SPG7 spastic paraplegia. EBioMedicine. 2020;61:103050. doi:10.1016/j.ebiom.2020.103050
78. Paul A, Krelin Y, Arif T, et al. A new role for the mitochondrial pro-apoptotic protein SMAC/diablo in phospholipid synthesis associated with tumorigenesis. Mol Ther. 2018;26(3):680–694. doi:10.1016/j.ymthe.2017.12.020
79. Mollazadeh H, Tavana E, Fanni G, et al. Effects of statins on mitochondrial pathways. J Cachexia Sarcopenia Muscle. 2021;12(2):237–251. doi:10.1002/jcsm.12654
80. Wang W, Wang YR, Chen J, et al. Pterostilbene attenuates experimental atherosclerosis through restoring catalase-mediated redox balance in vascular smooth muscle cells. J Agric Food Chem. 2019;67(46):12752–12760. doi:10.1021/acs.jafc.9b05373
81. Liu Z, Yan M, Lei W, et al. Sec13 promotes oligodendrocyte differentiation and myelin repair through autocrine pleiotrophin signaling. J Clin Invest. 2022;132(7). doi:10.1172/JCI155096
82. Lin HY, Wu HJ, Chu P-Y, et al. Multi-omics and experimental analysis unveil theragnostic value and immunological roles of inner membrane mitochondrial protein (IMMT) in breast cancer. J Transl Med. 2023;21(1):189. doi:10.1186/s12967-023-04035-4
83. Vargas-Pérez M, Devos DP, López-Lluch G, et al. An AlphaFold structure analysis of COQ2 as key a component of the coenzyme Q synthesis complex. Antioxidants. 2024;13(4). doi:10.3390/antiox13040496
84. Hoult G, Gillespie D, Wilkinson TMA, et al. Biomarkers to guide the use of antibiotics for acute exacerbations of COPD (AECOPD): a systematic review and meta-analysis. BMC Pulm Med. 2022;22(1):194. doi:10.1186/s12890-022-01958-4
85. Chen YW, Leung JM, Sin DD, et al. A systematic review of diagnostic biomarkers of COPD exacerbation. PLoS One. 2016;11(7):e0158843. doi:10.1371/journal.pone.0158843
86. Sun X, He Z, Zhang J, et al. Compare the efficacy of inhaled budesonide and systemic methylprednisolone on systemic inflammation of AECOPD. Pulm Pharmacol Ther. 2015;31:111–116. doi:10.1016/j.pupt.2014.09.004
87. Cardon I, Grobecker S, Jenne F, et al. Serotonin effects on human iPSC-derived neural cell functions: from mitochondria to depression. Mol Psychiatry. 2024;29(9):2689–2700. doi:10.1038/s41380-024-02538-0
88. Klutho PJ, Dashek RJ, Song L, et al. Genetic manipulation of SPG7 or NipSnap2 does not affect mitochondrial permeability transition. Cell Death Discov. 2020;6(1):5. doi:10.1038/s41420-020-0239-6
89. Shanmughapriya S, Rajan S, Hoffman N, et al. SPG7 is an essential and conserved component of the mitochondrial permeability transition pore. Mol Cell. 2015;60(1):47–62. doi:10.1016/j.molcel.2015.08.009
90. Liu H, Fan H, He P, et al. Prohibitin 1 regulates mtDNA release and downstream inflammatory responses. EMBO j. 2022;41(24):e111173. doi:10.15252/embj.2022111173
91. Zorov DB, Filburn CR, Klotz L-O, et al. Reactive oxygen species (ROS)-induced ROS release: a new phenomenon accompanying induction of the mitochondrial permeability transition in cardiac myocytes. J Exp Med. 2000;192(7):1001–1014. doi:10.1084/jem.192.7.1001
 © 2026 The Author(s). This work is published and licensed by Dove Medical Press Limited. The
full terms of this license are available at https://www.dovepress.com/terms
and incorporate the Creative Commons Attribution
- Non Commercial (unported, 4.0) License.
By accessing the work you hereby accept the Terms. Non-commercial uses of the work are permitted
without any further permission from Dove Medical Press Limited, provided the work is properly
attributed. For permission for commercial use of this work, please see paragraphs 4.2 and 5 of our Terms.
© 2026 The Author(s). This work is published and licensed by Dove Medical Press Limited. The
full terms of this license are available at https://www.dovepress.com/terms
and incorporate the Creative Commons Attribution
- Non Commercial (unported, 4.0) License.
By accessing the work you hereby accept the Terms. Non-commercial uses of the work are permitted
without any further permission from Dove Medical Press Limited, provided the work is properly
attributed. For permission for commercial use of this work, please see paragraphs 4.2 and 5 of our Terms.
Recommended articles
Analysis and Validation of Mitophagy-Related Genes in Diabetic Foot Ulcers
Fang S, Zhang H, Liu W, Li S, Chen Z, Min J, Dai C, An J, Zhang H, Liu D
Journal of Inflammation Research 2025, 18:4367-4379
Published Date: 25 March 2025

Identification of ERN1 as a Potential Context-Dependent Biomarker in Chronic Obstructive Pulmonary Disease Based on Bioinformatics Analysis of GSE57148 Dataset
Peng Q, Yang M, Fan D, Zhou P
International Journal of Chronic Obstructive Pulmonary Disease 2026, 21:610706
Published Date: 17 June 2026