
Back to Journals » International Journal of General Medicine » Volume 18
Spatial Epidemiologic Analysis of Fetal Birth Defects in Guangxi, China
Authors Peng Z  , Huang X, Wei J, Chen B, Liang L, Feng B, Wei Q, He S
Received 20 February 2025
Accepted for publication 9 June 2025
Published 14 June 2025 Volume 2025:18 Pages 3151—3173
DOI https://doi.org/10.2147/IJGM.S521948
Checked for plagiarism Yes
Review by Single anonymous peer review
Peer reviewer comments 2
Editor who approved publication: Dr Satish Nair
Zhenren Peng,1– 5,* Xiuning Huang,4,5,* Jie Wei,4,5,* Biyan Chen,4,5 Lifang Liang,4,5 Baoying Feng,4,5 Qiufen Wei,1– 5 Sheng He1– 5
1Birth Defects Research Laboratory, Guangxi Clinical Research Center for Birth Defects, Nanning, 530002, People’s Republic of China; 2Birth Defects Research Laboratory, Guangxi Key Laboratory of Reproductive Health and Birth Defect Prevention, Nanning, 530002, People’s Republic of China; 3Birth Defects Research Laboratory, Guangxi Clinical Research Center for Pediatric Diseases, Nanning, 530002, People’s Republic of China; 4Birth Defects Research Laboratory, Birth Defects Prevention and Control Institute of Guangxi Zhuang Autonomous Region, Nanning, 530002, People’s Republic of China; 5Birth Defects Research Laboratory, Maternal and Child Health Hospital of Guangxi Zhuang Autonomous Region, Nanning, 530002, People’s Republic of China
*These authors contributed equally to this work
Correspondence: Qiufen Wei, Birth Defects Research Laboratory, Maternal and Child Health Hospital of Guangxi Zhuang Autonomous Region, No. 59 Xiangzhu Avenue, Nanning, Guangxi Zhuang Autonomous Region, 530002, People’s Republic of China, Email [email protected] Sheng He, Birth Defects Research Laboratory, Maternal and Child Health Hospital of Guangxi Zhuang Autonomous Region, No. 59 Xiangzhu Avenue, Nanning, Guangxi Zhuang Autonomous Region, 530002, People’s Republic of China, Email [email protected]
Purpose: To apply various spatial epidemiological approaches to detect spatial trends and geographical clusters of birth defects (BDs) prevalence in Guangxi, China, and to explore the risk factors for BDs.
Methods: Between 2016 and 2022, the Guangxi Birth Defects Monitoring Network (GXBDMN) monitored a total of 4.57 million fetuses in this study. The BDs data for fetuses could be obtained from the GXBDMN. The kriging interpolation, spatial autocorrelation, and spatial regression analyses were used to explore the spatial trends patterns, and risk factors of BDs.
Results: Between 2016 and 2022, 101,786 fetuses were diagnosed with BDs, resulting in an overall BDs prevalence of 222.68 [95% confidence intervals (CI): 221.33– 224.04] per 10,000 fetuses. The global spatial autocorrelation analysis showed a positive spatial autocorrelation in the prevalence of BDs at the county level. The local spatial autocorrelation analysis revealed that the primary clustering patterns of BDs prevalence were High–High and Low–Low. The local indicators of spatial association (LISA) cluster map and kriging interpolation analysis showed that the High–High cluster aggregation areas for the BDs prevalence were gradually shifted from Nanning and Liuzhou to Nanning from 2016 to 2022. The spatial lag model (SLM) results showed that the coefficients of education level (β=15.898, P=0.001), family monthly income per capita (β=0.010, P=0.005) and pre-gestational diabetes mellitus (PGDM)/gestational diabetes mellitus (GDM) (β=10.346, P=0.002) were statistically significant.
Conclusion: The spatial trends and geographical cluster patterns of county-level prevalence of BDs in Guangxi are very obvious. Especially, the trend of high clustering in the prevalence of BDs is particularly evident. In addition, BDs are becoming more prevalent due to higher education levels, an increase in family monthly income per capita of pregnant women, and pregnant women with PGDM or GDM.
Keywords: birth defects, fetuses, pregnant women, prevalence, spatiotemporal, spatial regression
Introduction
Birth defects (BDs), also known as congenital anomalies, refer to any structural or functional abnormalities that occur during intrauterine.1 Current epidemiological data reveal that congenital anomalies affect approximately 6% of global live births, constituting a major contributor to neonatal mortality.1 Global mortality statistics reveal that congenital disorders accounted for approximately 400,000 fatalities among children under five years of age in 2020, constituting a significant 8% of worldwide under-five mortality.2 China’s BDs epidemiological profile reveals a 5.6% occurrence rate, translating to approximately 900,000 affected newborns annually.3 This significant disease burden not only compromises neonatal survival and long-term health outcomes but also imposes substantial socioeconomic ramifications on families.3 While the global burden of BDs has demonstrated measurable decline in recent decades, significant health inequalities persist across developmental spectra.4 Notably, nations with lower development indices continue to experience disproportionate challenges. The synthesis of recent epidemiological data reveals consistent inverse correlations between development metrics and BDs outcomes: both incidence rates and mortality rates show progressive reduction with ascending human development index (HDI) values,5 while age-standardized prevalence rates (ASPRs) demonstrate similar associations with sociodemographic index (SDI) quartiles.6 This persistent gradient pattern underscores the critical need for development-sensitive intervention strategies.
The causes of BDs are complex. Etiological studies indicate that nearly half of congenital anomalies remain idiopathic, while identifiable causes can be categorized into five primary domains: monogenic mutations, chromosomal aberrations, polygenic–environmental interactions, teratogenic exposures, and essential nutrient deficiencies during critical developmental windows.7 The multifactorial origins of BDs encompass genetic predisposition, maternal health status, and environmental exposures, with specific risk patterns emerging across defect subtypes.8 Parental co-exposure to metal mixtures demonstrates synergistic effects on both overall BDs risks and specific congenital heart anomalies,9 particularly through cumulative prenatal exposure to nickel, barium, and lead.10 Atmospheric pollutants exhibit critical exposure windows, as evidenced by elevated hypospadias risk per 10 μg/m³ PM2.5 increase during preconception and first trimester,11 while ozone exposure shows strongest musculoskeletal malformation associations in pre-pregnancy periods.12 Behavioral modifiers further compound these risks, with active parental smoking increasing congenital heart defects susceptibility,13 and isolated exposures to polycyclic aromatic hydrocarbons or metal(loid)s elevating neural tube defects probabilities.14 These exposure–response relationships underscore the developmental system’s vulnerability to both chemical mixtures and temporal exposure patterns. Emerging evidence underscores the preventability of BDs through evidence-based interventions: preconception care protocols (such as folic acid fortification programs), gestational avoidance of teratogens (WHO Category D/X medications), and multidisciplinary risk mitigation frameworks. Pediatricians serve as pivotal coordinators in these initiatives, bridging prenatal counseling and postnatal surveillance.15 Given the marked spatiotemporal heterogeneity in BDs prevalence16 —systematic epidemiological mapping of modifiable risk factors is imperative to develop context-specific prevention guidelines.
Spatial epidemiology constitutes an interdisciplinary realm that amalgamates geographic information systems (GIS), statistical analysis methodologies, and epidemiological theories to examine the geographical dispersion of health outcomes.17 Its focus lies in detecting clusters of diseases, as well as probing into the interconnections between environmental and/or geographic determinants and the manifestation of diseases.17 In recent times, spatial epidemiology has garnered considerable attention in exploring the intricate nexus between the environment and health outcomes, assuming a pivotal role within the vast domain of public health.18 This emerging field has provided compelling evidence demonstrating a robust correlation between the prevalence of BDs and specific geographical locations.19 By integrating GIS, statistical modeling, and epidemiological principles, spatial epidemiology facilitates a nuanced understanding of how environmental factors, such as climate, soil composition, and water quality, influence the distribution and incidence of BDs across diverse landscapes. Consequently, it offers invaluable insights for policymakers and health practitioners striving to mitigate the burden of these conditions through targeted interventions and strategies. While numerous studies have mapped the spatial distribution of BDs prevalence through descriptive epidemiological surveys,19–24 these investigations primarily focused on basic spatial patterns without advanced statistical exploration. Although a limited number of studies18,25–27 have employed spatial autocorrelation analysis to characterize BDs clusters, their methodological applications remain confined to specific geographic regions or singular analytical scales. To address these gaps, this study systematically applied both global and local spatial autocorrelation analyses to BDs data from Guangxi. This dual-scale approach not only identified broad regional trends but also detected localized clusters that might reflect interactions between environmental exposures and socio-demographic factors, thereby advancing the methodological rigor in this field. Kriging interpolation served as a particularly valuable tool for spatial analysis due to its ability to model geostatistical relationships and visualize spatial variability. However, applications of Kriging interpolation to explore spatial trends in BDs remain notably limited. Current disciplinary knowledge indicated this study represented the first exploratory effort to employ Kriging interpolation in analyzing spatial patterns of BDs in Guangxi, China. Furthermore, while spatial regression methodologies have demonstrated considerable potential in disease mapping and risk factor identification, their application in BDs research remained underexplored. Although one prior study28 utilized the R statistical package and Integrated Nested Laplace Approximation for oral cleft mapping and parameter estimation within a Besag–York–Mollié ecological regression framework, the approach differed this study substantially. Here, this study conducted a pioneering investigation by applying spatial regression analysis to identify risk factors associated with BDs in Guangxi. This process involved simulating and validating multiple spatial regression models using GeoDa software, thereby enabling the selection of an optimal model for robust inference.
Guangxi, a western economic province situated in southwestern China, comprises 14 prefecture-level cities encompassing 70 counties and 41 administrative districts. Epidemiological investigations have reported an approximate 1% prevalence rate of BDs among perinatal infants (PIs) in this region,29,30 with significant spatial heterogeneity observed across geographical subdivisions.31 This study employs three advanced geospatial techniques: 1) Kriging interpolation for temporal trend analysis of BDs prevalence; 2) Spatial autocorrelation to identify significant disease clusters; and 3) Spatial regression modeling to elucidate potential environmental and demographic risk factors. The integrated application of these spatial epidemiological approaches enhances the capacity to discern spatial-temporal patterns and identify critical risk determinants for BDs at regional scale.
Materials and Methods
Study Population
The study population consists of pregnant women and their fetuses who delivered between 2016 and 2022. The observation period for fetuses with BDs, in the context of this study, referred to the specific timeframe during which the fetuses were monitored for the presence, progression, and/or resolution of congenital anomalies or structural and functional abnormalities. This period typically began at the designated 8th week of gestation and ends at 7 days after birth. The duration of the observation period was chosen to ensure adequate time for the detection and assessment of BDs, while also considering practical and ethical considerations related to the care of the fetuses and their mothers.
Data Source and Collection
The data were provided by the Guangxi Birth Defects Monitoring Network (GXBDMN), a hospital-based surveillance system dedicated to monitoring BDs. The GXBDMN was tasked with encompassing all hospitals within Guangxi, encompassing general hospitals, maternal and child health hospitals, and various other medical institutions (excluding community hospitals). The network monitored fetal births involving BDs within these hospitals. Utilizing the “Medical Institution Birth Defects Fetus Registration Card”, data on BDs cases were meticulously recorded whenever fetuses with BDs were born or induced in the participating hospitals, irrespective of their gestational age. Furthermore, the GXBDMN served as the repository for documenting the essential clinical information of both fetuses with BDs and their mothers. It was noteworthy that surveillance data indicated 99.95% of births in Guangxi occurred in hospitals between 2016 and 2022. This high rate ensured this study captured nearly all BDs cases, included those in rural regions with limited healthcare access, thereby minimizing bias in prevalence estimates.
In this study, the numerator for BDs prevalence was defined as the number of fetuses diagnosed with BDs, and the denominator was the total number of fetuses during the study period, which began at the designated 8th week of gestation and ended at 7 days after birth. The 95% confidence interval (CI) was estimated using the normal approximation method, which was suitable for large samples, and the calculations were performed using StataMP 16.
The data accessed and utilized in this study strictly adhered to all relevant data protection and privacy regulations. Specific measures were implemented to safeguard the confidentiality and anonymity of individuals whose data were included in the analysis, ensuring that no personal information could be traced back to any individual participant. The study protocol adhered to the guidelines established by the journal.
Inclusion and Exclusion Criteria
Inclusion Criteria
(1) Gestational Age: The fetus must be at least 8 weeks gestational age. This ensured that the fetus had developed to a stage where certain BDs could be detected or suspected. (2) Diagnosis Window: The monitoring period covered from the 8th week of pregnancy until 7 days postpartum. This window allowed for the detection of BDs both prenatally and shortly after birth. (3) Confirmed BDs: Only clinically confirmed BDs were included. This means that suspected defects based solely on symptoms, physical signs, imaging features, or auxiliary test results were not sufficient for inclusion unless they were later confirmed. (4) Severity and impact: BDs that occurred frequently, had severe health consequences, or imposed significant economic burdens were prioritized for inclusion. (5) Key variables: The mother’s residence, diagnosis time, diagnostic basis, fetal gestational age/birth time/age, and pregnancy outcome must fall within the scope defined by the surveillance program.
Exclusion Criteria
(1) Non-structural abnormalities: Conditions such as chest and abdominal cavity effusion, abdominal distension, frog-like abdomen, pericardial effusion, simple skin edema without other diagnoses, pulmonary hypertension, and single umbilical artery (unless accompanied by other malformations) were excluded. (2) Minor or benign conditions: Conditions like mild tricuspid regurgitation, atrial septal aneurysm, intrauterine growth retardation without structural malformations, small cysts inside the lips, Mongolian spots, epicanthus, iris heterochromia, absorbed fetuses/paper-like fetuses without structural malformations, and twin-to-twin transfusion syndrome without structural malformations were not reported. (3) Specific exclusions for certain defects: For congenital hydrocephalus, cases where the lateral ventricle diameter measured by ultrasound was less than 10mm or does not exceed 15mm after 32 weeks of gestation were excluded. Choroid plexus cysts were excluded unless they were 10mm or larger at 32 weeks of gestation or increased in size during the monitoring period. Small eyes (corneal diameter less than 10mm or anterior-posterior diameter of the eyeball less than 20mm) required reporting regardless of size, but smaller variations not meeting these criteria were excluded. Similar exclusions applied to other defects such as small ears, accessory ears or preauricular appendages, ear anterior sinus and fistulas, septal defects (both ventricular and atrial), patent ductus arteriosus (unless unhealed after birth in non-preterm infants), and others based on specific size or diagnostic criteria. (4) Syndromic or multiple malformations: While severe malformations within syndromes or multiple malformations should generally be noted separately in the report, isolated or mild manifestations of these conditions might be excluded based on the specific guidelines of the surveillance program.
Data Diagnostic Criteria
The clinical diagnosis of BDs, also known as congenital malformations, involved a comprehensive process encompassing prenatal screening (ultrasound examinations, maternal serum screening, and genetic testing), postnatal physical examinations, specialized tests, laboratory tests, imaging studies (including radiographic imaging and echocardiography), and consultations with specialists. Based on these assessments, a diagnosis was confirmed in accordance with the classification system of the International Statistical Classification of Diseases and Related Health Problems, Tenth Revision (ICD-10), and subsequently reported.
Data Quality Control
To guarantee the quality and reliability of the data on BDs for this study, stringent control measures were implemented at every stage of BDs surveillance. These stages encompassed the completion of registration cards, data collection and entry, data reduction and clean-up, as well as data analysis. During the quality control process, the completion rate of data entry was mandatory at 100%. Furthermore, the error rate for entry items and the underreporting rate for births and major subtypes of BDs were both required to remain below 1%. The focal points of quality control encompassed thorough checks on gestation week, maternal age, BDs subtypes, and birth outcomes for fetuses with BDs, among other critical aspects.
Spatial Statistical Analyses
Geocoding BDs Prevalence
The prevalence of BDs was geocoded using the regionalism code embedded in the Guangxi shapefile, which delineated administrative boundaries at the county/district level. The base geographic data, sourced from the National Platform for Common Geographical Information Services, was processed in ArcGIS (Version 10.2) to ensure coordinate system consistency (WGS84 projection). Disease prevalence values were matched to centroid coordinates of each administrative unit through a spatial join algorithm, with manual cross-validation performed to resolve topological errors (eg, mismatched polygon overlaps). This geoprocessing framework enabled spatial analysis of BDs prevalence distribution patterns across the 14 prefectural jurisdictions, while the provincial geographic context is visualized in Figure 1 to situate the study area within China’s southwestern region. Figure 2 displays the scope of counties and districts under jurisdiction of 14 cities in Guangxi. Sensitivity analyses confirmed that alternative projection methods (eg, Albers equal-area) produced <5% variance in BDs prevalence estimates, validating the robustness of our spatial attribution approach.
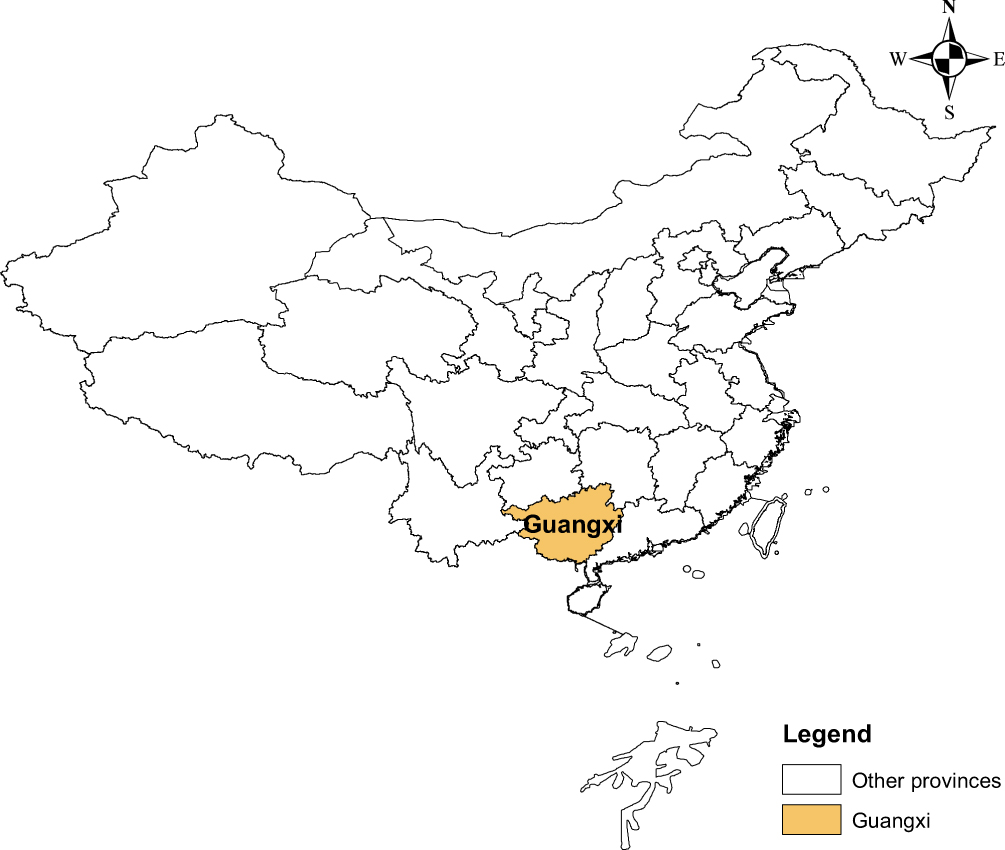 |
Figure 1 Geographic location map of Guangxi in China. |
 |
Figure 2 Scope of counties and districts under the jurisdiction of 14 cities in Guangxi. |
Kriging Interpolation Analysis
Kriging interpolation is a regression algorithm for spatial modeling and prediction that uses weighted moving average interpolation to produce the best linear and unbiased prediction in space.32,33 In this study, Kriging interpolation analysis will be applied to predict the prevalence of BDs in Guangxi, and the predictive values of the prevalence of BDs will be mapped. The trends of the prevalence of BDs could be described using kriging interpolation. It was noteworthy that this study employed the ordinary kriging model for spatial interpolation analysis, with the semivariogram model specified as spherical.
This study determined the reliability of Kriging interpolation analysis results through cross-validation. Validation parameters in the cross-validation report include: Mean Error (ME), Root Mean Square Error (RMSE), Mean Standardized Error (MSE), Average Standard Error (ASE), and Standardized RMSE. ME represents the average deviation between predicted and observed values (reflecting systematic error), with an ideal value close to 0. RMSE indicates the root mean square error (comprehensively reflecting prediction accuracy), where smaller values are preferable (interpretation requires consideration of data magnitude). MSE denotes the mean of standardized errors (reflecting whether errors are accurately estimated), with an ideal value close to 0. ASE represents the average prediction standard error (reflecting model uncertainty, ideally approaching the RMSE). Standardized RMSE signifies the standardized root mean square error (with an ideal value of 1; values >1 suggest the model underestimates errors, while values <1 indicate overestimation).
Table 1 shows the Kriging interpolation analysis cross-validation results. From the data presented in Table 1, it could be observed that the slope (coefficient of x) and intercept of the regression function varied annually. The slope fluctuated between years but generally remained between 0.06 and 0.21. Despite fluctuations, the slope did not exhibit drastic changes, indicated that the influence of the independent variable x was relatively stable. The intercept showed an increasing trend year by year, rising from 123.48 in 2016 to 205.76 in 2022. This reflected that in the absence of the influence of the independent variable x, the baseline level of the predicted value was increasing annually.
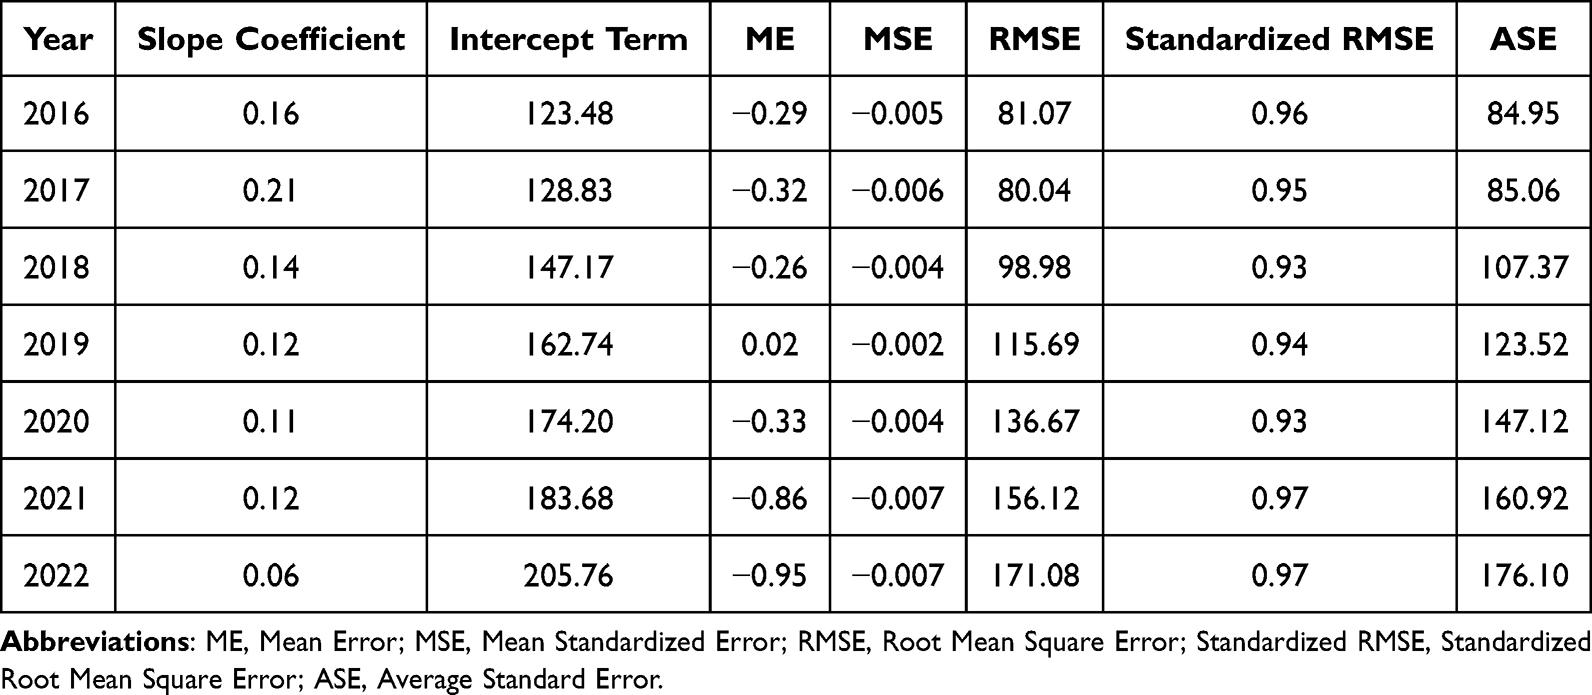 |
Table 1 Kriging Interpolation Analysis Cross-Validation Results |
Prediction error was a key indicator for measuring the accuracy of model predictions. From the data presented in Table 1, the ME value fluctuated between years, with both positive and negative values. Negative values indicated that the model’s predicted values were generally lower than the actual values, while positive values indicated the opposite. Overall, the fluctuation range of the ME value was relatively small. MSE value and Standardized RMSE value were relatively stable, without drastic fluctuations. This indicated that the distribution of prediction errors was relatively stable ASE value increased year by year, consisted with the trend of RMSE value. This indicated that as the year increased, the uncertainty of the model’s predictions was increasing.
Based on the above analysis, it could make the following judgments on the cross-validation results of ordinary Kriging interpolation: Although the slope and intercept of the regression function fluctuated, they remained stable overall. The distribution of prediction errors was also relatively stable, indicated that the model had a certain degree of stability. Additionally, despite the increasing ASE year by year, and the increasing uncertainty of model predictions, the trend of the ASE was consistent with that of RMSE, indicated that the model had a certain degree of prediction accuracy.
Spatial Autocorrelation Analysis
Spatial autocorrelation analysis is an important analytical process for analyzing geographical clusters. Generally, spatial autocorrelation has two analytical methods: global autocorrelation and local autocorrelation.
Global spatial autocorrelation is a correlation analysis of the entire study area, which assumes that all spatial elements (stochastic variables) are on a plane.34 Global spatial autocorrelation is utilized to describe the overall spatial distribution of a phenomenon. And assess whether the phenomenon has a spatial cluster within the entire study area. The Global Moran’s I statistic is usually used to test for spatial clusters in global spatial autocorrelation analysis.34 The global Moran’s I statistic is a stochastic process of identifying stochastic phenomena that are distributed in space of two dimensions and can evaluate the patterns of spatial clusters.34 The pattern can be clustered, discrete, or random. In this study, the global Moran’s I statistic was first applied to explore whether the county-level prevalence of BDs had a spatial cluster area throughout the entire study area. The formula for the global Moran’s I statistic is:

In equation (1), where zi is the deviation between the attribute of unit i and its average value  . wi,j represents the spatial weight between units i and j, n represents the number of observations (units), and S0 represents the total spatial weights. The Z test is usually used to test the global Moran’s I index. The values of the global Moran’s I index range from −1 to +1. Significant spatial autocorrelation at the 95% CI level can be observed for Z scores with values above 1.96 or below −1.96. Positive spatial autocorrelation is indicated when the P value is below 0.05 and the global Moran’s I index is above 0. It means that high value is adjacent to high value, or low value is adjacent to low value. Negative spatial autocorrelation is indicated when the P value is below 0.05 and the global Moran’s I index is below 0. It means that low value is adjacent to high value, or high value is adjacent to low value. A random spatial pattern is indicated when the P value is higher than 0.05 and the global Moran’s I index is 0.
Local spatial autocorrelation analysis is being advanced by Professor Luc Anselin.35 In accordance with Professor Luc Anselin’s research, the global Moran’s I statistics can be decomposed into each observation’s contribution by using a new general class of local indicators of spatial association (LISA) statistics. The LISA statistic is generally applied to study local spatial clusters when the global Moran’s I statistic is significant. It is possible to interpret it as an indicator of local non-stationary areas or hot spots. In addition, it can be utilized to evaluate the impact of specific locations on the magnitude of the global Moran’s I statistic and to identify anomalies. Hence, local spatial autocorrelation analysis can be applied to detect which areas have spatial aggregation. And determine the spatial cluster patterns for the prevalence of BDs in Guangxi when the global Moran’s I statistic is significant. The formula for the LISA statistic is:

In equation (2), where xi is the spatial attribute value of unit i. wi,j represents the spatial weight between units i and j, n represents the number of observations (units), and Si2 represents the aggregation of all spatial weights. The Z test is employed to examine LISA statistics. Significant spatial autocorrelation at the 95% CI level is observed when Z scores are above 1.96 or below −1.96. Classifying local spatial cluster patterns into 4 types is possible when the P value is below 0.05: High–High cluster (cluster of high values) and Low–Low cluster (cluster of low values), High–Low cluster (outliers in which a high value is surrounded primarily by low values) and Low–High cluster (outliers in which a low value is surrounded primarily by high values).35
In this study, spatial autocorrelation analysis was implemented in GeoDa (Version 1.18) using the spatial statistics toolbox. For global autocorrelation, this study constructed a first-order queen contiguity spatial weights matrix to define neighborhood relationships, with row standardization applied to mitigate influences from units with varying neighbor counts. The Global Moran’s I statistic was computed using a 95% CI significance level, determined via 999 permutations to ensure robust Monte Carlo simulations. Z-scores exceeding ±1.96 were considered statistically significant, following best practices for spatial cluster detection.
To complement this, this study performed Anselin Local Moran’s I analysis to identify hotspots (high–high clusters) and coldspots (low–low clusters) of BDs prevalence at the county level. This LISA was visualized using a LISA cluster map, with significance assessed at p<0.05. A false discovery rate (FDR) correction was applied to control for Type I errors in multiple comparisons.
Critically, this study validated the appropriateness of the spatial weights matrix by comparing results with inverse distance weighting (IDW) and k-nearest neighbor (k=4) configurations. The queen contiguity matrix demonstrated superior sensitivity for detecting administrative boundary-based clusters, aligning with this study’s focus on county-level health disparities. All spatial diagnostics were performed on projected coordinate systems (Albers equal-area) to preserve areal unit integrity.
To verify the accuracy of the spatial autocorrelation analysis results, this study incrementally increased the number of k-nearest neighbors from the original 4 to 6 and 8, respectively, generated spatial weights for each scenario to perform spatial autocorrelation analysis. The cross-validation results revealed that the global and local spatial autocorrelation analysis outcomes remained unaffected regardless of whether the number of k-nearest neighbors was 4, 6, or 8.
This finding underscored the robustness of the spatial weights employed in this study, as the analysis results exhibited consistency across varying neighborhood sizes. The selection of k-nearest neighbor counts (4, 6, and 8) was based on a systematic approach to evaluate the sensitivity of the spatial autocorrelation measures to different neighborhood definitions. By expanding the neighborhood size, this study aimed to assess whether the spatial dependencies observed were persistent and not merely artifacts of a specific neighborhood configuration.
The invariance of the results across different k values suggested that the spatial patterns captured were genuine and not dependent on the arbitrary choice of neighborhood size. This robustness was crucial for the reliability and generalizability of the spatial autocorrelation analysis, as it indicated that the identified spatial relationships were intrinsic to the data rather than being influenced by the specific parameter settings. Consequently, the spatial weights matrix constructed in this study could be considered appropriate and effective for capturing the underlying spatial dependencies in the dataset.
Spatial Regression Analysis
Spatial regression analysis is a method that incorporates spatial effect parameters. Spatial regression models that are commonly used include the spatial lag model (SLM), spatial error model (SEM), and spatial Durbin model (SDM). Considering the general specification, Professor Luc Anselin36 provided the formula for the general spatial regression model:



In equations (3), (4), and (5), where y is an N-dimensional vector. β is a K×1 vector of parameters associated with exogenous (ie, not lagged dependent) variables X (N×K matrix). ρ is the coefficient of the spatially lagged dependent variable, and λ is the coefficient in a spatial autoregressive structure for the disturbance ϵ. The disturbance μ is assumed to be distributed normally with a general diagonal covariance matrix Ω. The two N×N matrices W1 and W2 are standardized spatial weight matrices, associated with a spatial autoregressive process in the dependent variable and the disturbance term, respectively.
Prior to conducting a spatial regression analysis, the global ordinary least squares (OLS) method is commonly employed to execute Lagrange multiplier (LM) tests and robust LM test diagnostics, which are aimed at assessing spatial dependence and spatial heterogeneity.36,37 The rules governing the LM test are as follows: retain the OLS results if neither the LM-Lag statistic nor the LM-Error statistic is statistically significant; implement the SLM if only the LM-Lag statistic is statistically significant; or apply the SEM if only the LM-Error statistic is statistically significant.
A robust LM test should be performed when both the LM-Lag statistic and LM-Error statistic are statistically significant. The guidelines for the robust LM test are as follows: implement the SLM when only the robust LM-Lag statistic is statistically significant; apply the SEM when only the robust LM-Error statistic is statistically significant; and, in the case where both the robust LM-Lag and robust LM-Error statistics are statistically significant, utilize the SDM.
The estimation effects of the spatial regression model can be diagnosed by using the statistic values of R-squared, log-likelihood, Akaike information criterion (AIC), and Schwarz criterion. The spatial regression model’s estimation effect improves when R-squared and log-likelihood are larger and AIC and Schwarz criterion are smaller. The spatial regression model’s appropriateness can be further confirmed by using the standardized residual map of spatial regression analysis. An outlier is typically defined as an observation where the absolute value of its standardized residual exceeds 2, suggesting that the predictive value in this region is significantly higher or lower than anticipated.
In this study, the county-level prevalence of BDs was designated as the dependent variable in the spatial regression model. The model framework included 19 independent variables, thoughtfully selected based on prior epidemiological evidence and domain expertise. These variables were categorized into demographic and socioeconomic factors, early pregnancy complications, medication and substance use, exposure to environmental toxins, and medical histories of the pregnant women to systematically assess their associations with BDs prevalence. The model incorporated a total of 19 independent variables, which encompassed demographic and socioeconomic factors, early pregnancy complications, medication and substance use, exposure to environmental toxins, and medical histories of the pregnant women. Specifically, these variables included the age, gravidity, parity, education level, and family monthly income per capita in Renminbi (RMB) of the pregnant women; indicators of whether the women experienced fever, viral infection, pre-gestational diabetes mellitus (PGDM) or gestational diabetes mellitus (GDM), antibiotic use, contraceptive drug use, sedative use, alcohol consumption, pesticide exposure, radiation exposure, and chemical exposure during early pregnancy; and whether they had a history of dead fetus, spontaneous abortions, giving birth to a child with BDs, or being involved in a consanguineous marriage prior to pregnancy. Of note, this study rigorously tested for multicollinearity and applied variance inflation factor (VIF) thresholds to ensure model stability. Additionally, this study validated the model using cross-validation techniques to confirm predictive accuracy and generalizability.
Prior to spatial regression analysis, it is standard practice to construct spatial weight matrices. The specific methods and parameters used in this study were as follows: (1) ID Variable Selection: ID number was selected as the unique identifier. (2) Contiguity Weight Settings: Queen contiguity was chosen with the order of contiguity set to 1. (3) Distance Weight Settings: For geometric centroids, the distance metric was set to Euclidean distance, and standardization (Z-transformation) was applied. (4) Distance Band Settings: A specified bandwidth of 0.648969 was defined. (5) K-Nearest Neighbors Settings: The number of neighbors (k) was set to 4. (6) Kernel Settings: The kernel function was configured as uniform, with diagonal weights=1, and the maximum k-nearest neighbor (knn) distance was used as the bandwidth.
Spatial Statistical Analysis Software
The kriging interpolation will be calculated by ArcGIS 10.2, which is a GIS software developed by the Esri company. Spatial autocorrelation analysis and spatial regression analysis will be conducted by GeoDa 1.18, which is a spatial analysis software developed by Professor Luc Anselin and his team. The results of spatial statistical analyses will be presented in maps by ArcGIS 10.2. The significance level for statistical testing was set at α=0.05.
Results
Prevalence of BDs in Each Year
In this study, the GXBDMN monitored 4.57 million fetuses between 2016 and 2022. Of which, 101,786 fetuses were diagnosed with BDs, which resulted in an overall BDs prevalence of 222.68 (95% CI: 221.33–224.04) per 10,000 fetuses. During the study period, the prevalence of BDs increased year by year, rising from 162.60 (95% CI: 159.93–165.28) per 10,000 fetuses in 2016 to 306.14 (95% CI: 301.08–311.19) per 10,000 fetuses in 2022. The detailed prevalence of BDs in Guangxi for each year from 2016 to 2022 is shown in Table 2.
 |
Table 2 Prevalence of Birth Defects in Guangxi from 2016 to 2022 (per 10,000 Fetuses) |
Kriging Interpolation Analysis Results
From 2016 to 2022, there was a noticeable spatiotemporal aggregation characteristic of the prevalence of BDs, as were shown by the results of the kriging interpolation analysis. The high-value aggregation areas for the prevalence of BDs gradually shifted from the cities of Nanning and Liuzhou to the city of Nanning from 2016 to 2022. The original county-level prevalence of BDs in Guangxi fluctuated between 0 and 497.12, 0 and 473.48, 0 and 657.45, 0 and 750.74, 0 and 891.57, 0 and 1074.95, and 0 to 1080.57 per 10,000 fetuses annually from 2016 to 2022, respectively. In comparison, the predictive values obtained through kriging interpolation analysis ranged from 94.55 to 220.22, 15.56 to 403.61, 111.10 to 312.91, 119.73 to 332.78, 120.31 to 383.56, 127.04 to 398.69, and 140.15 to 419.13 per 10,000 fetuses for each corresponding year. The county-level prevalence of BDs in Guangxi from 2016 to 2022 was analyzed by kriging interpolation analysis, as shown in Figure 3.
 |
Figure 3 Kriging interpolation map of the county-level prevalence of birth defects in Guangxi from 2016 to 2022 (per 10,000 perinatal fetuses). (A–G) Kriging interpolation map of birth defects prevalence in the year 2016, 2017, 2018, 2019, 2020, 2021 and 2022, respectively. |
Global Spatial Autocorrelation Analysis Results
The Z test for global Moran’s I statistic showed that spatial autocorrelation was significant at the 95% CI level. And the global Moran’s I index of the prevalence of BDs for each year from 2016 to 2022 was 0.232, 0.277, 0.257, 0.240, 0.253, 0.192, and 0.181, respectively. These results indicated that there was a positive spatial autocorrelation of BDs prevalence throughout the entire study area. It was observed that high BDs prevalence was adjacent to high BDs prevalence or low BDs prevalence was adjacent to low BDs prevalence at the county level. The Moran’s I index of county-level prevalence of BDs in Guangxi is shown in Table 3 for each year from 2016 to 2022.
 |
Table 3 Moran’s I Index of County-Level Prevalence of Birth Defects in Guangxi from 2016 to 2022 |
Local Spatial Autocorrelation Analysis Results
Figure 4 displays a LISA cluster map of the county-level prevalence of BDs in Guangxi from 2016 to 2022. According to the LISA cluster map, High–High and Low–Low were the primary clustering patterns for BDs prevalence. The High–High cluster aggregation areas for the prevalence of BDs were gradually shifted from the city of Nanning and Liuzhou to the city of Nanning from 2016 to 2022. The details of the LISA cluster type and aggregation areas from 2016 to 2022 are presented in Table 4.
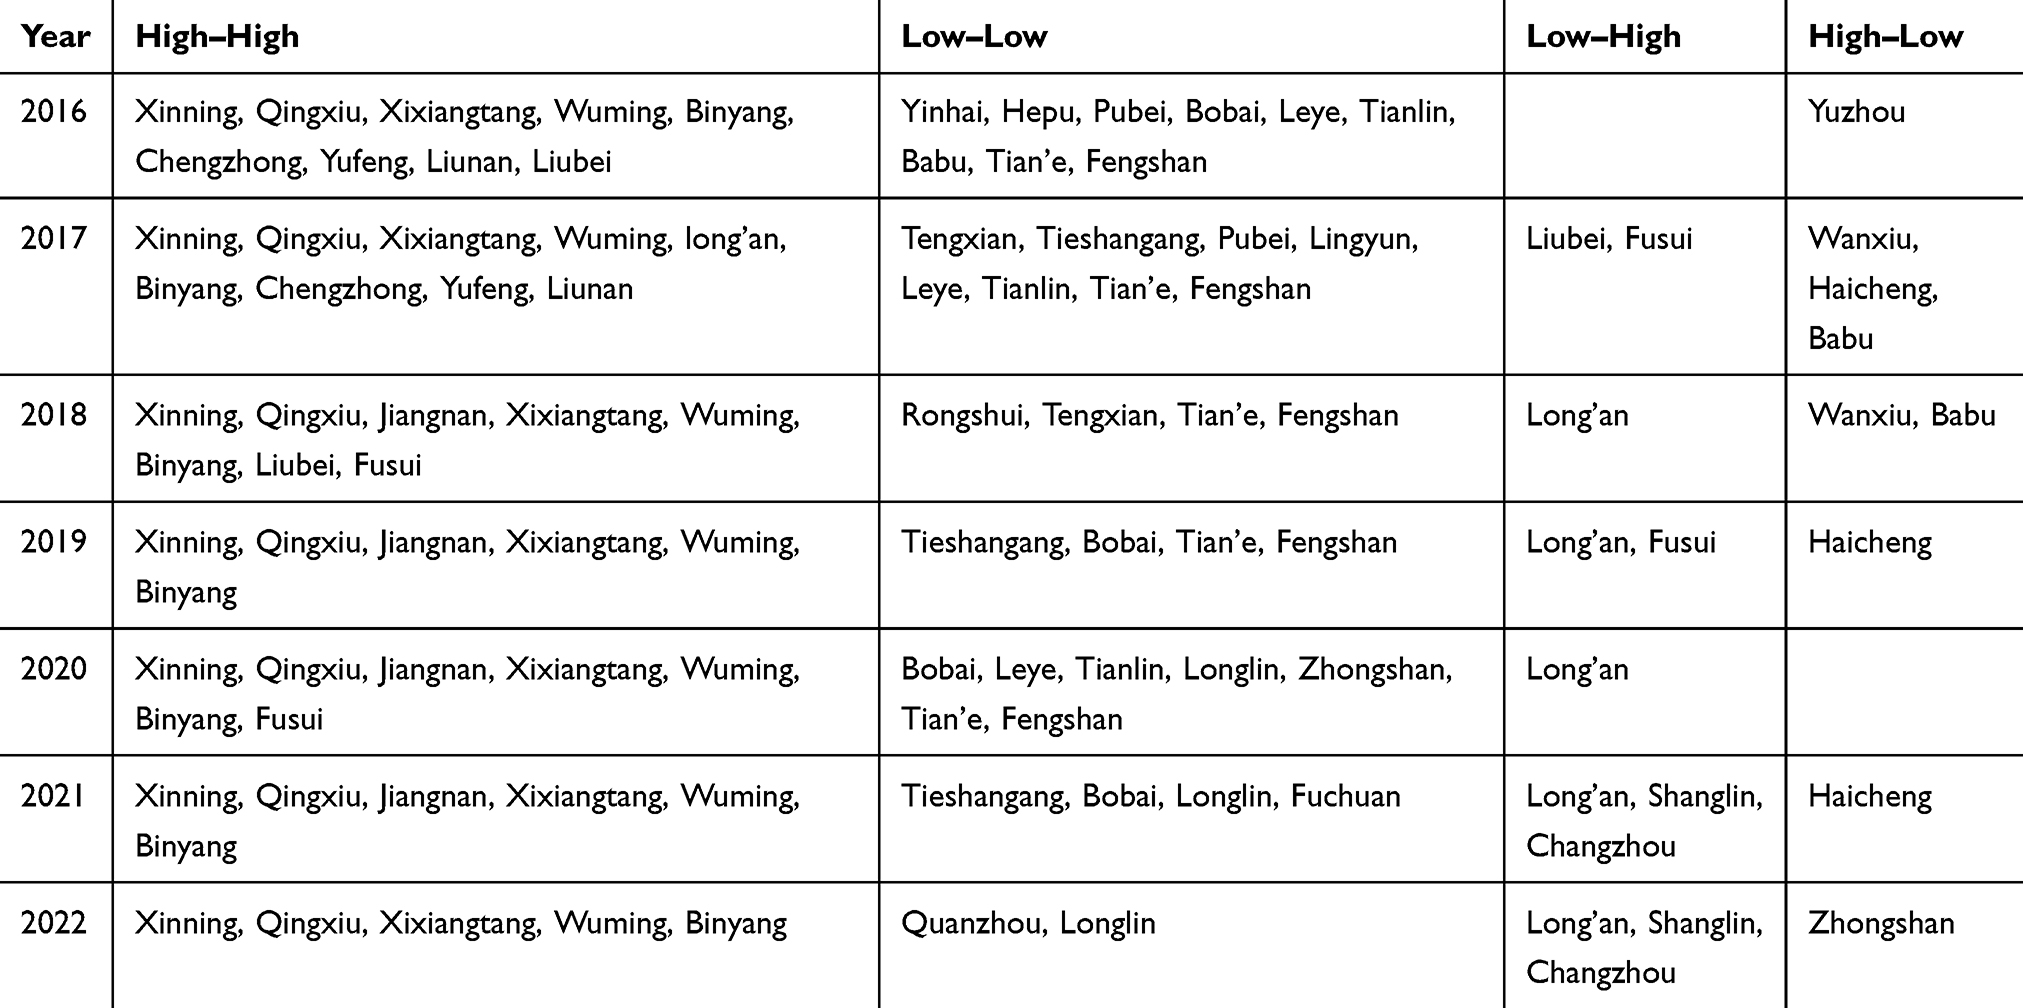 |
Table 4 Local Indicators of Spatial Association Cluster Type and Aggregation Areas of the County-Level Prevalence of Birth Defects in Guangxi from 2016 to 2022 |
 |
Figure 4 Local indicators of spatial association cluster map of county-level prevalence of birth defects in Guangxi from 2016 to 2022. (A–G) Local indicators of spatial association cluster map of birth defects prevalence in the year 2016, 2017, 2018, 2019, 2020, 2021 and 2022, respectively. (H) Cluster types. |
Spatial Regression Analysis Results
To determine which type of spatial regression model was more appropriate to explore the risk factors of BDs, the global OLS was first used for investigation. Table 5 shows the diagnostic results for the spatial regression model. The LM test results demonstrated that the global OLS was not a suitable model for analyzing the risk factors of BDs. Due to the statistical significance of Moran’s I (error) and the positive spatial autocorrelation of the residual (Moran’s I index=2.453, P=0.014). Furthermore, the statistical significance of LM-Lag was significant (P=0.002), but the statistical significance of LM-Error was not significant (P=0.056). It indicated that the SLM may be a more appropriate spatial regression model to explore the risk factors of BDs. Additionally, the estimation effect of SLM was the most effective model among the three regression models of OLS, SLM, and SEM. Due to the largest statistic values for R-squared and log-likelihood for SLM, respectively, were 0.644 and −551.211. And the statistic values of AIC and Schwarz criterion for SLM were the lowest (1144.420 and 1201.320, respectively). Therefore, the results above suggested that spatial regression analysis should be performed using SLM to explore the risk factors of BDs.
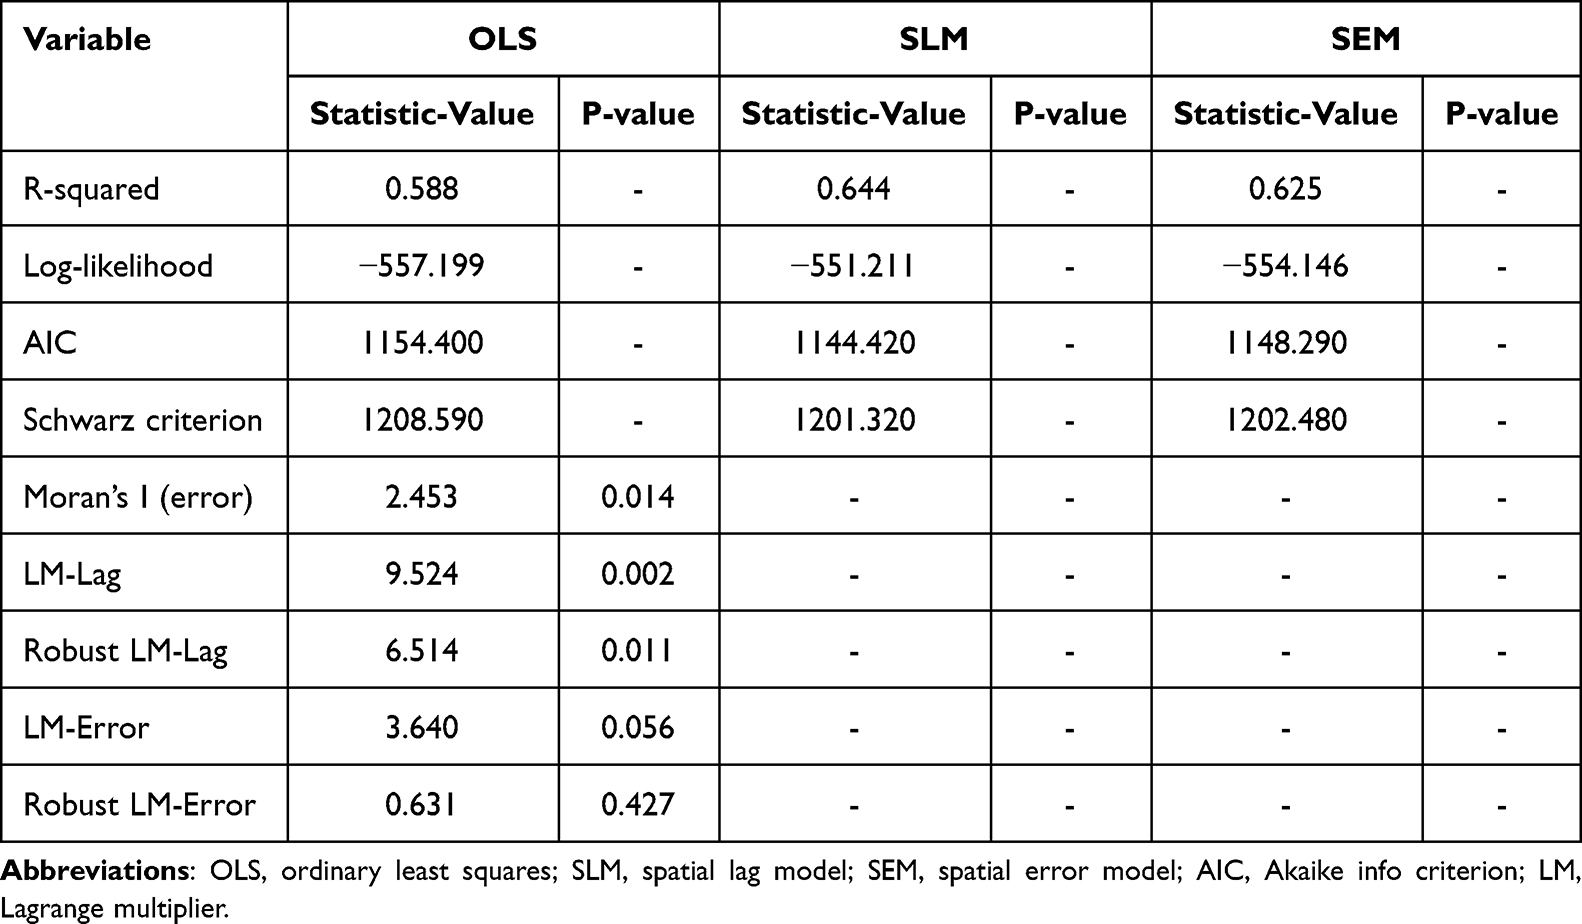 |
Table 5 Spatial Regression Model Diagnostics Results |
The likelihood ratio test (LR-test) was applied to SLM to investigate the risk factors of BDs. According to the LR-test results, it was accepted the hypothesis that the spatial regression coefficients were significant at a 95% CI level (LR-test statistic=11.975, P=0.001). Table 6 displays the estimation results of SLM. According to the spatial regression analysis results of SLM, the regression coefficients of education level (β=15.898, P=0.001), family monthly income per capita (β=0.010, P=0.005), and PGDM/GDM (β=10.346, P=0.002) were statistically significant.
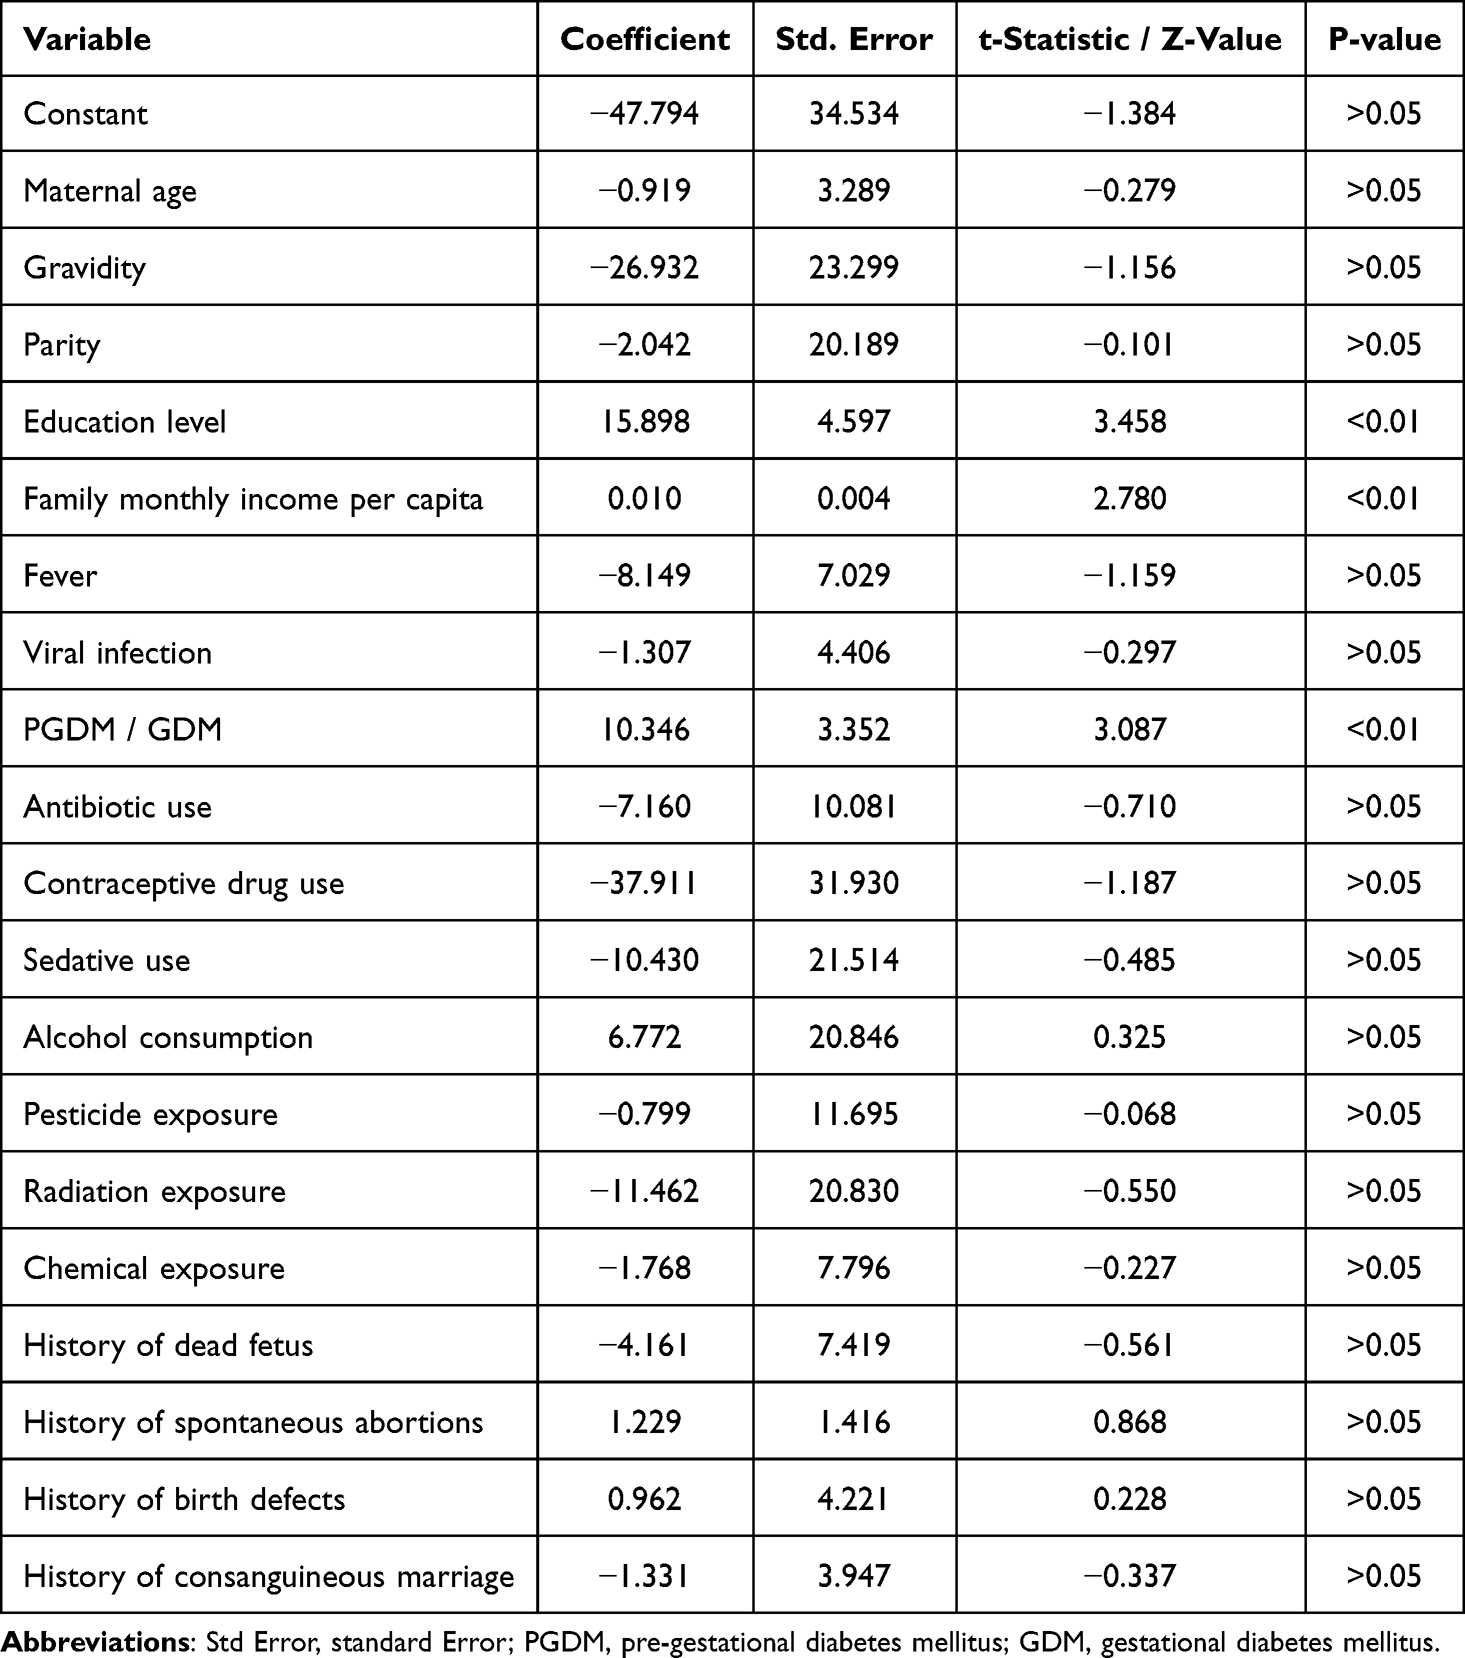 |
Table 6 Estimation Results of Spatial Lag Model |
The county-level prevalence of BDs in Guangxi from 2016 to 2022 was analyzed through a standardized residual map from spatial regression analysis, as shown in Figure 5. According to the standardized residual map, there were five outliers (standardized residuals exceeding 2). The items were distributed in the Xingning district and Wuming district of Nanning City, Chengzhong district of Liuzhou City, Yuzhou district of Yulin City, and Jinchengjiang district of Hechi City. These results indicated that the predictive values of BDs prevalence in those five regions were much higher than expected.
 |
Figure 5 Standardized residual map of spatial regression analysis of county-level prevalence of birth defects in Guangxi from 2016 to 2022. |
Discussion
Spatial epidemiology, leveraging GIS spatial analysis technology, held a pivotal position in disease control and prevention efforts, particularly within the realms of disease surveillance and health risk assessment in public health frameworks.38 Recent advancements witnessed its application in examining BDs and maternal health challenges. However, a critical observation was that many of these studies predominantly relied on basic descriptive mapping to elucidate spatial distribution patterns,23 which, while informative, often fell short of providing comprehensive insights. In the specific context of Guangxi, China, the understanding of the spatial epidemiology of BDs remained limited and fragmented. This limitation underscored the urgency for more in-depth and nuanced research to fill the existing knowledge gap. This study emerged as a groundbreaking endeavor, marked the inaugural spatial epidemiology report on BDs prevalence in Guangxi. Notably, it represented a pioneering effort in utilizing a spatial regression model to delve into the intricate web of risk factors associated with BDs within this region. By employing this sophisticated analytical approach, this research not only mapped out the spatial distribution of BDs but also identified and quantified the contributions of various risk factors, thereby offering a more holistic and scientifically robust understanding of the issue. The application of spatial regression models addressed a critical gap in understanding geographically clustered BDs risk factors. This approach revealed synergistic effects between socioeconomic disparities (eg, uneven healthcare access) and environmental gradients (eg, industrial emissions), providing actionable insights for region-specific prevention strategies. This advancement was significant as it enabled policymakers and healthcare providers to target interventions more precisely, ultimately enhancing the effectiveness of disease prevention and control strategies in Guangxi. In summary, this study filled a crucial gap in the existing literature on spatial epidemiology of BDs in Guangxi, China, by introducing a spatial regression model that provided deeper insights into the risk factors influencing BDs prevalence. This approach not only enhanced the understanding of the disease’s spatial dynamics but also facilitated the development of targeted and impactful public health interventions. These spatially explicit risk maps could prioritize maternal health campaigns in high-prevalence clusters, optimizing resource allocation in Guangxi’s under-resourced districts. While this study focused on Guangxi, the observed patterns might inform regions with comparable developmental trajectories.
Kriging interpolation analysis and spatial autocorrelation analysis constitute pivotal methodologies within the realm of geographical analyses. This study harnessed these techniques to unravel the dynamic trends and spatial configurations of BDs prevalence in Guangxi spanning from 2016 to 2022. The findings from kriging interpolation analysis delineated the temporal evolution of BDs prevalence, revealed a notable shift in the epicenter of high prevalence. Initially, the cities of Nanning and Liuzhou emerged as hotspots; however, by the study’s conclusion in 2022, Nanning emerged as the predominant focus of high BDs prevalence. Complementing this, spatial autocorrelation analysis further illuminated the geographical clustering and dispersion patterns of BDs cases. Remarkably, the convergence of results from both methodologies underscored a consistent narrative: a distinct and pronounced pattern of BDs prevalence shifting primarily towards Nanning over the seven-year period. This convergence not only validated the robustness of the analytical approach but also provided a comprehensive understanding of the spatial dynamics governing BDs prevalence in Guangxi. The observed spatial shift in BDs clusters might reflect evolving environmental and demographic dynamics. A plausible explanation involved Liuzhou’s industrial restructuring—such as the downsizing of steel/chemical industries post. The spatial shift from Liuzhou to Nanning might reflect divergent regional policies: Liuzhou’s industrial downsizing reduced heavy metal emissions, whereas Nanning’s urbanization exacerbated prenatal care fragmentation in migrant communities. These dynamics aligned with global patterns where economic transitions reshape environmental health risks. Concurrently, Nanning’s rapid urbanization introduced new stressors, including traffic-related fragmented prenatal care accessed in peripheral districts serving migrant populations. While this study controlled for some confounders, it was acknowledged that unmeasured factors like maternal occupational exposures might also contribute—such as occupational exposures to pesticides or heavy metals—might contribute to residual confounding. Targeted interventions in transitioning cities should integrate environmental remediation with mobile prenatal clinics to mitigate urban-rural healthcare gaps. This warranted longitudinal geospatial analysis in future work. Moreover, the integration of kriging interpolation and spatial autocorrelation analyses offered a novel perspective that transcended traditional approaches, enriching the comprehension of the distribution characteristics of BDs prevalence. This holistic view not only aided in identifying high-risk areas but also informed targeted intervention strategies, thereby holding significant implications for public health policy formulation and resource allocation in Guangxi. In summary, this study underscored the utility of combining kriging interpolation and spatial autocorrelation analyses in unraveling the complex spatial patterns of BDs prevalence. The insights gained from this synthesis contribute to a deeper understanding of the epidemiological landscape of BDs in Guangxi, with potential ramifications for disease control and prevention efforts in the region.
Kriging interpolation emerged as a potent technique for delineating the trends in the prevalence of BDs, offering a comprehensive spatial representation. This interpolation method functioned as a smoothing tool, enhancing the estimation accuracy for predictive values that transcend geographical boundaries.39 Notably, it addressed the issue of missing data during the analysis, thereby ensuring a robust dataset for inference.39 The application of kriging interpolation yielded a notable smoothing effect, where high original values tended to undergo slight underestimation, whereas low original values experienced modest overestimation.39 In the context of this study spanning from 2016 to 2022, the predictive values generated through kriging interpolation demonstrated consistent patterns. Specifically, the peak predictive values for BDs prevalence consistently fell below the highest original values observed in the dataset. Conversely, the nadir predictive values surpassed the lowest original values recorded. This tendency underscored the smoothing nature of kriging interpolation, which might have been particularly advantageous in regions with sparse or unevenly distributed data points, as it provided a more continuous and generalized view of BDs prevalence trends. Furthermore, the utilization of kriging interpolation in this study underscored its versatility in handling complex spatial patterns and potential nonlinear relationships within the data. By smoothing out local anomalies and interpolating between known points, kriging provided a more reliable estimate of BDs prevalence across the study area. The smoothing effect of kriging interpolation not only compensated for data sparsity but also unmasked latent trends, such as risk diffusion from urban cores to peri-urban areas. This pattern suggested environmental exposures (eg, PM2.5) might transcend administrative boundaries, necessitating cross-jurisdictional pollution control policies. This not only aided in identifying areas of high and low risk but also facilitated more informed decision-making and resource allocation in public health interventions aimed at reducing BDs prevalence. However, it was crucial to acknowledge the potential biases introduced by smoothing and to interpret the results within this context, considering the specific characteristics and limitations of the study area and dataset.
Spatial autocorrelation analysis stood as a pivotal method within the realm of spatial cluster analysis, fostered interdisciplinary collaboration between applied epidemiology researchers and spatial statisticians.40 This synergy was vital, as spatial cluster analysis offered a unique lens through which to scrutinize the spatial distribution patterns of BDs prevalence.25 In this study, the statistical significance of all global Moran’s I statistics for BDs prevalence, coupled with their positive values, underscored the presence of spatial autocorrelation. However, these results alone do not delineate the specific spatial cluster patterns nor pinpoint the areas with spatial aggregation. To address this gap, this study conducted a local spatial autocorrelation analysis, which revealed an intriguing phenomenon captured in the LISA cluster map. Notably, from 2016 to 2022, the High–High cluster aggregation areas for BDs prevalence exhibited a shift, transitioned from the cities of Nanning and Liuzhou towards a more concentrated presence in Nanning. This transition was marked by a turning point in 2019, whereafter the high–high cluster aggregation areas were predominantly located in Nanning from 2019 to 2022. These findings indicated that during the period from 2016 to 2018, high BDs prevalence in Guangxi was predominantly aggregated in both Nanning and Liuzhou, with a subsequent concentration solely in Nanning from 2019 onwards. The observed trends in spatial aggregation aligned with the kriging interpolation analysis results, reinforced the reliability of the findings. The kriging interpolation analysis, by smoothly transitioning between known data points, further supported the notion of shifting aggregation patterns, highlighted the dynamic nature of BDs prevalence across Guangxi. This dynamic shift in aggregation areas might have reflected changes in environmental factors, healthcare access, or socioeconomic conditions, which warranted further investigation to inform targeted interventions and policies aimed at reducing BDs prevalence. The post-2019 concentration in Nanning coincided with provincial healthcare reforms that expanded tertiary hospital capacity, inadvertently attracting high-risk pregnancies from surrounding regions. The integration of spatial autocorrelation analysis with kriging interpolation provided a comprehensive understanding of the spatial distribution and clustering patterns of BDs prevalence, offered valuable insights for public health practitioners and policymakers. As the field of spatial epidemiology continues to evolve, such interdisciplinary approaches will be crucial in addressing complex health challenges and promoting equitable health outcomes.
This study revealed a notable increase in the prevalence of BDs in Guangxi from 2016 to 2022, rose from 162.60 per 10,000 fetuses in 2016 to 306.14 per 10,000 fetuses in 2022, at an average annual growth rate of 11.25%. When compared to national surveillance data from the China Birth Cohort Study (CBCS) spanning 2017 to 2021, which reported a prevalence of 250 per 10,000 fetuses.16 The findings of this study indicated a higher prevalence in Guangxi. It was crucial to acknowledge that the discrepancy might stem from methodological differences, particularly the definition of the perinatal period used in various studies. While this study covered the period from conception to birth, most provincial studies in China focused on the perinatal period, spanning from 28 weeks of gestation to 42 days postpartum. This methodological divergence hindered direct comparisons, underscored the need for standardization in reporting periods and definitions to facilitate broader comparisons and a comprehensive understanding of BDs across China. National harmonization of surveillance periods (eg, adopting conception-to-birth definitions) is urgently needed to enable valid interregional comparisons. Within Guangxi, the cities of Nanning and Liuzhou, situated in the south and northeast, respectively, exhibited the highest BDs prevalences among the 14 cities analyzed. Specifically, Nanning recorded a prevalence of 388.24 per 10,000 fetuses (95% CI: 383.96 to 392.51 per 10,000 fetuses), and Liuzhou reported a prevalence of 276.49 per 10,000 fetuses (95% CI: 270.92 to 282.06 per 10,000 fetuses). The upward trend was particularly pronounced in Nanning, where the prevalence increased from 242.50 per 10,000 fetuses in 2016 to 551.41 per 10,000 fetuses in 2022, marking an average annual increase of 14.22%. In contrast, Liuzhou saw a more modest increase from 264.16 per 10,000 fetuses in 2016 to 308.72 per 10,000 fetuses in 2022, with an average annual growth rate of 2.62%. The higher BDs prevalence in Nanning likely reflected both true risk escalation and enhanced ascertainment due to concentrated prenatal diagnostics. The higher prevalence in these cities, particularly Nanning, might be attributed to several factors. As the provincial capital, Nanning boasted the highest gross domestic product (GDP) in Guangxi, followed closely by Liuzhou, according to the Guangxi Statistical Yearbook (2023).41 This economic prosperity likely translated into better access to healthcare services, including specialized prenatal and postnatal care. Consequently, pregnant women, particularly those with complex health issues identified elsewhere, might prefer to seek care in Nanning’s hospitals, which offered higher levels of professional maternal and child health services. This concentration of high-risk pregnancies in Nanning might have contributed to the observed higher prevalence of BDs. Given these findings, it was imperative for health administrative departments to consider this issue when formulated health policies. Strategies to address the rising prevalence of BDs in Guangxi, particularly in cities like Nanning and Liuzhou, should be prioritized. This included enhancing prenatal and postnatal care services, promoting awareness among pregnant women about the importance of early detection and management of risk factors, and investing in research to identify the underlying causes of BDs in this region. Additionally, fostering collaboration among healthcare providers, researchers, and policymakers to develop standardized reporting frameworks will be crucial for advancing the understanding of BDs and informing evidence-based interventions nationwide.
The complex etiology of BDs was characterized by interactions among genetic susceptibility, maternal health conditions, and environmental factors, with distinct risk profiles observed across different defect subtypes.8 Parental co-exposure to metal mixtures, notably cumulative prenatal nickel, barium, and lead exposure, was found to exert interactive effects on both general BDs risk and specific congenital heart anomalies.9,10 Critical temporal windows for atmospheric pollutant effects were identified, with preconception and first-trimester PM2.5 exposure (per 10 μg/m³ increase) correlating with hypospadias risk,11 while prepregnancy ozone exposure demonstrated the strongest associations with musculoskeletal malformations.12 Behavioral factors amplified these risks, as parental smoking was associated with increased congenital heart defects susceptibility,13 and isolated polycyclic aromatic hydrocarbon or metal(loid) exposures were linked to elevated neural tube defects probabilities.14 These findings collectively highlighted the developmental system’s sensitivity to both combined chemical exposures and temporally patterned environmental insults.
The multifactorial nature of BDs was well-documented, with various prenatal and maternal characteristics played pivotal roles.42–44 Notably, the presence of PGDM or GDM in pregnant women significantly elevated the risk of BDs in their offspring.45–47 Specifically, pregnant women diagnosed with PGDM, irrespective of their body mass index (BMI), exhibited a robust association with a wide spectrum of BDs, with odds ratios (OR) spanning from 2.0 to 75.9.46 Intriguingly, approximately 12.7% to 14.8% of PGDM-affected pregnancies resulted in fetuses with BDs,48,49 indicated a substantial burden. Furthermore, GDM in early pregnancy also posed an elevated risk for overall BDs in newborns, as evidenced by a relative risk (RR) of 1.18 (95% CI: 1.13 to 1.23).45 Beyond glycemic status, the educational attainment of pregnant women was considered a potential determinant of BDs risk, albeit with inconsistent findings. Some studies reported that pregnant women with lower educational levels were associated with an increased risk of overall BDs, with an OR of 8.40 (95% CI: 2.17 to 32.52).50 Conversely, other investigations implicated higher educational levels as a risk factor, particularly for specific types of BDs such as Down syndrome.51 This discrepancy suggested that the relationship between maternal education and BDs risk might be complex and potentially mediated by other factors such as accessed to healthcare, health literacy, or lifestyle choices. The paradoxical association between education and BDs risk might reflect competing forces: health literacy (protective) versus delayed childbearing (risk-enhancing). Moreover, socioeconomic status, proxied by family monthly income, emerged as another significant factor influencing BDs risk. High family income was identified as a risk factor for certain types of BDs, including syndactyly,51 highlighting the need to consider broader socioeconomic determinants in understanding the etiology of BDs. These findings underscored the importance of a holistic approach in identifying and mitigating risk factors for BDs, which might involve interventions targeting both medical and socioeconomic domains. Collectively, the understanding of BDs risk factors must evolve to incorporate the nuanced interactions between maternal health conditions, educational attainment, and socioeconomic status. Future research should aim to clarify these relationships and explore potential mechanisms underlying these associations, ultimately contributing to the development of more effective preventive strategies. Additionally, conception during spring and winter was associated with a 31% and 39% increased risk of congenital heart defects, respectively, compared to autumn.52 Exposure to air pollutants (PM2.5, NO2, and SO2) in the first trimester, particularly during colder seasons, demonstrated stronger adverse effects on BDs.53 Lower preconception dietary vitamin D intake (<65.21 IU/d) independently correlated with elevated risks of congenital anomalies (adjusted odds ratios (aOR)=1.16–1.42), even after accounting for UV exposure and conception season, emphasizing dietary insufficiency as a distinct risk factor.54 While seasonal variations in environmental exposures were noted, the current study did not explicitly address mechanisms underlying seasonal fluctuations in BDst prevalence. Future investigations incorporating longitudinal environmental monitoring, time-stratified analyses, and maternal metabolic profiling may clarify interactions between climatic factors, nutritional status, and developmental outcomes.
In recent years, an increasing number of researchers had utilized spatial regression models to investigate the determinants of various diseases.55,56 However, studies employing these models to explore the risk factors associated with BDs remained scarce, particularly in the context of Guangxi. Notably, to date, no research had applied a spatial regression framework to analyze BDs risk factors specifically within Guangxi. This study addressed this gap by adopting a rigorous methodology. After conducting a global OLS regression followed by LM and robust LM tests, the SLM emerged as the most suitable spatial regression model for examining BDs risk factors in Guangxi. The results from the SLM analysis revealed education level, family monthly income per capita, and a history of PGDM or GDM as significant risk factors. Specifically, these findings indicated that a higher education level and higher family monthly income per capita among pregnant women, as well as the presence of PGDM prior to pregnancy or GDM in early pregnancy, were associated with an increased likelihood of BDs in offspring. These insights contributed to the existing body of knowledge by providing a spatial perspective on BDs risk factors, which was a departure from many previous studies. The use of a spatial regression model represented a novel approach in this research domain, offering a more nuanced understanding of the geographical and socioeconomic factors influencing BDs occurrence. Consequently, these findings held potential for informing public health policies and interventions aimed at mitigating BDs risks in Guangxi and similar regions. It was hoped that future studies would build upon this foundation, further refining and expanding the application of spatial regression models in the exploration of BDs risk factors. The observed socioeconomic gradient might partly reflect ascertainment bias: affluent populations disproportionately access advanced diagnostics, inflating detection rates. However, the observed association between socioeconomic status and BDs prevalence should be interpreted with caution, as correlational findings did not establish causation. Two potential explanatory mechanisms warranted consideration. First, disparities in healthcare access might introduce detection bias: populations with higher socioeconomic status typically demonstrated greater utilization of prenatal diagnostic technologies and specialized pediatric care, potentially elevating BDs ascertainment rates relative to under-resourced regions. Second, demographic variations across socioeconomic strata, particularly the tendency toward delayed childbearing in educated cohorts—a recognized risk factor for BDs—could partially account for the observed epidemiological pattern. These considerations highlighted the need for future studies incorporating individual-level exposure assessments and biomarker data to disentangle socioeconomic proxies from biological etiological pathways.
The above findings of this study might inform regions sharing Guangxi’s socioeconomic and environmental context. However, healthcare system disparities and environmental factors necessitate context-specific adaptations. Given the identified spatiotemporal risk shifts, future multi-regional studies should integrate harmonized environmental monitoring (eg, PM2.5, heavy metals) and epigenetic biomarkers to elucidate gene–environment interactions driving cluster dynamics.
Strengths and Improvements
This study had two major strengths. First, the BDs surveillance data in this study were based on all BDs monitoring hospitals throughout Guangxi, the spatial trends and spatial cluster patterns of the county-level prevalence of BDs over the years could be accurately presented. Second, this paper was the first study based on a spatial regression model to explore the risk factors of BDs in Guangxi, China. However, the BDs data of this study were collected by the GXBDMN, which was a hospital-based, passive surveillance system. The related risk factors of various subgroups of BDs not independently to be analyzed in this study, such as congenital heart defects, polydactyly, and syndactyly, et al.
While this study acknowledged the potential influence of environmental variables on observed spatial patterns, the authors recognized that specific factors (eg, air quality metrics, proximity to industrial zones) were not systematically quantified due to data availability constraints. This reflected a critical gap in current surveillance infrastructure, particularly in low-resource regions where environmental monitoring networks were sparse. Future work will prioritize partnerships with environmental health agencies to integrate multisource data and validate preliminary correlations identified in this study.
Conclusion
In conclusion, the global spatial autocorrelation analysis results confirm the positive spatial autocorrelation in Guangxi county-level BDs prevalence, which in turn indicates that the BDs prevalence tends to high value or low value cluster together. Besides, by using the LISA cluster Map and kriging interpolation map, it finds that high BDs prevalence has gradually shifted from the city of Nanning and Liuzhou to the city of Nanning over the years. The spatial regression analysis results suggest that the higher education level and the increase of family monthly income per capita of pregnant women, and pregnant women with PGDM or GDM increase the prevalence of BDs for fetuses.
Data Sharing Statement
The datasets used and analyzed during the current study are available from the corresponding author upon reasonable request.
Ethical Statement
This study was conducted in accordance with the principles of the Declaration of Helsinki and was approved by the Ethics Committee of Maternal and Child Health Hospital of Guangxi Zhuang Autonomous Region (No. 2021-3-24). In addition, the authors have taken all necessary steps to ensure that the individuals involved in this research were informed about the research aims and procedures. Written informed consent for participation was not required for this study in accordance with the national legislation and the institutional requirements. Furthermore, the authors affirm that the data accessed and utilized in this study strictly adhered to all relevant data protection and privacy regulations. Specific measures were implemented to safeguard the confidentiality and anonymity of individuals whose data were included in the analysis, ensuring that no personal information could be traced back to any individual participant. The study protocol adhered to the guidelines established by the journal.
Acknowledgments
We acknowledged all medical workers who collected and inputted BDs data for the GXBDMN. This paper has been uploaded to ResearchSquare as a preprint: https://www.researchsquare.com/article/rs-3941985/v1.
Author Contributions
All authors made a significant contribution to the work reported, whether that is in the conception, study design, execution, acquisition of data, analysis, and interpretation, or all these areas; took part in drafting, revising, or critically reviewing the article; gave final approval of the version to be published; have agreed on the journal to which the article has been submitted; and agree to be accountable for all aspects of the work.
Funding
This work was supported by the Guangxi Natural Science Foundation (2023GXNSFAA026046), Guangxi Key Laboratory of Reproductive Health and Birth Defect Prevention (21-220-22), Guangxi Clinical Research Center for Pediatric Diseases (Guike AD22035121), Appropriate Technology Development and Application Project for Guangxi Medicine and Health (S2023043), Self-Funded Program of Guangxi Health Commission (Z20210056, Z-A20230310, and Z-A20240334), and Open Project Funding Support for Guangxi Key Laboratory of Birth Defects Research and Prevention (Maternal and Child Health Hospital of Guangxi Zhuang Autonomous Region) (GXWCH-ZDKF-2023-14).
Disclosure
The authors report no conflicts of interest in this work.
References
1. World Health Organization. Congenital disorders: overview. 2025. Available from: https://www.who.int/health-topics/congenital-anomalies#tab=tab_1.
2. World Health Organization. Congenital conditions. 2025. Available from: https://www.who.int/teams/maternal-newborn-child-adolescent-health-and-ageing/newborn-health/congenital-conditions.
3. National Health Commission of the people’s Republic of China. Notice on printing and distributing the national program for comprehensive prevention and control of birth defects (GWBFYF [2018] No.19). 2018. Available from: http://www.nhc.gov.cn/fys/s3589/201812/9644ce7d265342779099d54b6962a4e0.shtml.
4. Bai Z, Han J, An J, et al. The global, regional, and national patterns of change in the burden of congenital birth defects, 1990–2021: an analysis of the global burden of disease study 2021 and forecast to 2040. EClinicalMedicine. 2024;77:102873. doi:10.1016/j.eclinm.2024.102873
5. Du C, Zhang Z, Xiao S, et al. Association of the national level of human development with the incidence and mortality of congenital birth defects in 2019: a cross-sectional study from 189 countries. Biosci Trends. 2024;18(4):325–334. doi:10.5582/bst.2024.01199
6. Li XY, Hou MJ, Kong XM, et al. The congenital birth defects burden in children younger than 14 years of age, 1990–2019: an age-period-cohort analysis of the global burden of disease study. J Glob Health. 2024;14:04012. doi:10.7189/jogh.14.04012
7. World Health Organization. Congenital disorders: causes. 2025. Available from: https://www.who.int/health-topics/congenital-anomalies#tab=tab_2.
8. Cruz-Cruz JP, Nieto-García R, Rivera-Ramírez PB, et al. Risk factors for isolated congenital heart defects in infants from Western Mexico. Congenit Anom. 2025;65(1):e12589. doi:10.1111/cga.12589
9. Lv H, Jiang Y, Ye K, et al. Prenatal Parental Exposure to Metals and Birth Defects: a Prospective Birth Cohort Study. Environ Sci Technol. 2024;58(32):14110–14120. doi:10.1021/acs.est.4c01945
10. Chen L, Zhao Y, Sun J, et al. Relationship between pregnant women’s combined exposure to heavy metals and their offspring’s congenital heart defects in Lanzhou, China. Front Pediatr. 2024;12:1291076. doi:10.3389/fped.2024.1291076
11. Li W, Li Y, Xu W, et al. Maternal PM(2.5) exposure and hypospadias risk in Chinese offspring: insights from a nationwide surveillance-based study. J Hazard Mater. 2024;472:134503. doi:10.1016/j.jhazmat.2024.134503
12. Li Y, Zhou C, Liu J, et al. Maternal Exposure to Ozone and the Risk of Birth Defects: a Time-Stratified Case-Crossover Study in Southwestern China. Toxics. 2024;12(7):519. doi:10.3390/toxics12070519
13. Han J, Zhang Y, Liu Y, Liu J, Zhang Y, Wang K. Parental Smoking and the Risk of Birth Defects in Offspring in China: a Systematic Review and meta-Analysis. Birth Defects Res. 2024;116(12):e2422. doi:10.1002/bdr2.2422
14. Jia XQ, Li Y, Jin L, et al. Association of Co-Exposure to Polycyclic Aromatic Hydrocarbons and Metal(loid)s with the Risk of Neural Tube Defects: a Case-Control Study in Northern China. Biomed Environ Sci. 2025;38(2):154–166. doi:10.3967/bes2024.130
15. Groisman B, Bidondo MP, Piola A, Tellechea AL, Barbero P, Liascovich R. World Birth Defects Day. Arch Argent Pediatr. 2019;117(5):284–285. doi:10.5546/aap.2019.eng.284
16. Yue W, Zhang E, Liu R, et al. The China birth cohort study (CBCS). Eur J Epidemiol. 2022;37(3):295–304. doi:10.1007/s10654-021-00831-8
17. Morrison CN, Mair CF, Bates L, et al. Defining Spatial Epidemiology: a Systematic Review and Re-orientation. Epidemiology. 2024;35(4):542–555. doi:10.1097/ede.0000000000001738
18. Klein J, Ryan J, Dwivedi P, Leslie T, Vyas A, Krishnan A. Neighborhood location and nutritional resources as a risk factor for congenital heart disease in the fetus. Birth Defects Res. 2023;115(16):1556–1565. doi:10.1002/bdr2.2231
19. Miao H, He H, Nie C, Ren J, Luo X. Spatiotemporal Characteristics and Risk Factors for All and Severity-Specific Preterm Births in Southern China, 2014–2021: large Population-Based Study. JMIR Public Health Surveill. 2024;10:e48815. doi:10.2196/48815
20. de Andrade DP, Marques CM, Andrade DCR, et al. Population-based assessment of major congenital malformations in the United States: smoking risk association. J Dev Orig Health Dis. 2025;16:e13. doi:10.1017/s2040174425000054
21. Dekirmendjian A, Benchimol EI, Skarsgard E, Shah PS, Zani A. Incidence of Congenital Diaphragmatic Hernia in Canada: time Trends and Analysis by Location, Maternal Age, and Sex. J Pediatr Surg. 2025;60(4):162194. doi:10.1016/j.jpedsurg.2025.162194
22. Kennedy C, Young S, Davis K, Creighton EW, Johnson A, Hartzell L. Evaluating Geographic Distribution and Potential Environmental Risk Factors of Orofacial Cleft Anomalies Utilizing a Statewide Birth Defects Registry. Cleft Palate Craniofac J. 2025;10556656251326443. doi:10.1177/10556656251326443
23. Lu H, Olshan AF, Serre ML, et al. Spatiotemporal Trends of Birth Defects in North Carolina, 2003–2015. medRxiv. 2024. doi:10.1101/2024.08.12.24311873
24. Toti A, Vetuna B, Kalit V, Duke T. Birth defects in a rural province in Papua New Guinea. Arch Dis Child. 2024;109(9):702–706. doi:10.1136/archdischild-2024-327200
25. Li J, Lin S, Wu J, Pei L, Shang X. Association between maternal exposure to chemical fertilizer and the risk of birth defects in a rural population in northern China: a population-based study. Int Health. 2023;15(3):299–308. doi:10.1093/inthealth/ihac027
26. Reis LC, Barbian MH, Cardoso-Dos-Santos AC, Silva EVL, Boquett JA, Schuler-Faccini L. Prevalence of congenital anomalies at birth among live births in the state of Maranhão from 2001 to 2016: temporal and spatial analysis. Rev Bras Epidemiol. 2021;24(suppl 1):e210020. doi:10.1590/1980-549720210020.supl.1
27. Cardoso-Dos-Santos AC, Ramallo V, Zagonel-Oliveira M, et al. An invincible memory: what surname analysis tells us about history, health and population medical genetics in the Brazilian Northeast. J Biosoc Sci. 2021;53(2):183–198. doi:10.1017/s0021932020000127
28. Shin H, Ahn E, Choi EJ. Access to antenatal healthcare and the prevalence of oral clefts: a spatial analysis. Eur J Oral Sci. 2020;128(2):145–152. doi:10.1111/eos.12688
29. Peng ZR, Wei J, Huang XN, et al. Effect of gray model (1, 1) on prediction of birth defects among the population of Guangxi Zhuang Autonomous Region. J Pra Med. 2022;38(11):1378–1384. doi:10.3969/j.issn.1006-5725.2022.11.014
30. Peng Z, Wei J, Chen B, et al. Epidemiology of birth defects based on a birth defects surveillance system in southwestern China and the associated risk factors. Front Pediatr. 2023;11:1165477. doi:10.3389/fped.2023.1165477
31. Peng ZR, Wei J, Chen BY, et al. Spatial analysis on birth defects in Guangxi based on geographic information system. Dis Surveillance. 2022;37(02):262–268. doi:10.3784/jbjc.202104080184
32. Le ND, Zidek JV. Statistical Analysis of Environmental Space-Time Processes. Springer Science+Business Media; 2006:342.
33. Cressie NAC. Statistic for Spatial Data.
34. Moran PA. Notes on continuous stochastic phenomena. Biometrika. 1950;37(1–2):17–23. doi:10.1093/biomet/37.1-2.17
35. Anselin L. Local Indicators of Spatial Association-LISA. Geog Anal. 1995;27(2):93–115. doi:10.1111/j.1538-4632.1995.tb00338.x
36. Anselin L. Lagrange Multiplier Test Diagnostics for Spatial Dependence and Spatial Heterogeneity. Geog Anal. 1988;20(1):1–17. doi:10.1111/j.1538-4632.1988.tb00159.x
37. Anselin L, Bera AK, Florax RJGM, Yoon M. Simple Diagnostic Tests for Spatial Dependence. Regional Science Urban Economics. 1996;26(1):77–104. doi:10.1016/0166-0462(95)02111-6
38. Eberth JM, Kramer MR, Delmelle EM, Kirby RS. What is the place for space in epidemiology? Ann Epidemiol. 2021;64:41–46. doi:10.1016/j.annepidem.2021.08.022
39. Moore DA, Carpenter TE. Spatial analytical methods and geographic information systems: use in health research and epidemiology. Epidemiol Rev. 1999;21(2):143–161. doi:10.1093/oxfordjournals.epirev.a017993
40. Fritz CE, Schuurman N, Robertson C, Lear S. A scoping review of spatial cluster analysis techniques for point-event data. Geospat Health. 2013;7(2):183–198. doi:10.4081/gh.2013.79
41. Guangxi Zhuang Autonomous Region Bureau of Statistics & Survey Office of the National Bureau of Statistics in Guangxi. Guangxi Statistical Yearbook (2023). China Statistics Press. 594. 2023.
42. Mogess WN, Mihretie TB. Prevalence and associated factors of congenital anomalies in Ethiopia: a systematic review and meta-analysis. PLoS One. 2024;19(4):e0302393. doi:10.1371/journal.pone.0302393
43. Chen X, Yang Y, Chen L, Wang K. Pregnancy outcomes and birth defects in offspring following Non-steroidal anti-inflammatory drugs exposure during pregnancy: a systematic review and meta-analysis. Reprod Toxicol. 2024;125:108561. doi:10.1016/j.reprotox.2024.108561
44. Zhou X, He J, Wang A, et al. Multivariate logistic regression analysis of risk factors for birth defects: a study from population-based surveillance data. BMC Public Health. 2024;24(1):1037. doi:10.1186/s12889-024-18420-1
45. Zhang TN, Huang XM, Zhao XY, Wang W, Wen R, Gao SY. Risks of specific congenital anomalies in offspring of women with diabetes: a systematic review and meta-analysis of population-based studies including over 80 million births. PLoS Med. 2022;19(2):e1003900. doi:10.1371/journal.pmed.1003900
46. Tinker SC, Gilboa SM, Moore CA, et al. Modification of the association between diabetes and birth defects by obesity, National Birth Defects Prevention Study, 1997–2011. Birth Defects Res. 2021;113(14):1084–1097. doi:10.1002/bdr2.1900
47. Wu Y, Liu B, Sun Y, et al. Association of Maternal Prepregnancy Diabetes and Gestational Diabetes Mellitus With Congenital Anomalies of the Newborn. Diabetes Care. 2020;43(12):2983–2990. doi:10.2337/dc20-0261
48. Nakanishi K, Kanagawa T, Fujikawa K, Ishii K, Waguri M. Congenital malformation and hemoglobin A1c in the first trimester among Japanese women with pregestational diabetes. J Obstet Gynaecol Res. 2021;47(12):4164–4170. doi:10.1111/jog.15015
49. Dude AM, Badreldin N, Schieler A, Yee LM. Periconception glycemic control and congenital anomalies in women with pregestational diabetes. BMJ Open Diabetes Res Care. 2021;9(1):e001966. doi:10.1136/bmjdrc-2020-001966
50. Ueker ME, Silva VM, Moi GP, Pignati WA, Mattos IE, Silva AMC. Parenteral exposure to pesticides and occurrence of congenital malformations: hospital-based case-control study. BMC Pediatr. 2016;16(1):125. doi:10.1186/s12887-016-0667-x
51. Wang QQ, He CY, Mei J, Xu YL. Epidemiology of Birth Defects in Eastern China and the Associated Risk Factors. Med Sci Monit. 2022;28:e933782. doi:10.12659/msm.933782
52. Miao S, Liu L, Tang Y, Ge H. Season, household registry and isolated birth defects: a population-based case-control study in Danyang, China. Int Health. 2024;16(5):562–567. doi:10.1093/inthealth/ihae034
53. Cheng Y, Yin J, Yang L, et al. Ambient air pollutants in the first trimester of pregnancy and birth defects: an observational study. BMJ Open. 2023;13(3):e063712. doi:10.1136/bmjopen-2022-063712
54. Adrien N, Orta OR, Nestoridi E, Carmichael SL, Yazdy MM. Early pregnancy vitamin D status and risk of select congenital anomalies in the National Birth Defects Prevention Study. Birth Defects Res. 2023;115(3):290–301. doi:10.1002/bdr2.2101
55. Sornlorm K, Es U, Laohasiriwong W, Thi WM. Exploring demographic, healthcare, and socio-economic factors as predictors of COVID-19 incidence rate: a spatial regression analysis. PLoS One. 2024;19(10):e0312717. doi:10.1371/journal.pone.0312717
56. Venkatesan P, Prakash SS, Ramasamy J. Association of dietary patterns and health outcomes by spatial regression analysis of nationally representative survey data from India. Indian J Public Health. 2023;67(3):399–407. doi:10.4103/ijph.ijph_112_23
 © 2025 The Author(s). This work is published and licensed by Dove Medical Press Limited. The
full terms of this license are available at https://www.dovepress.com/terms
and incorporate the Creative Commons Attribution
- Non Commercial (unported, 4.0) License.
By accessing the work you hereby accept the Terms. Non-commercial uses of the work are permitted
without any further permission from Dove Medical Press Limited, provided the work is properly
attributed. For permission for commercial use of this work, please see paragraphs 4.2 and 5 of our Terms.
© 2025 The Author(s). This work is published and licensed by Dove Medical Press Limited. The
full terms of this license are available at https://www.dovepress.com/terms
and incorporate the Creative Commons Attribution
- Non Commercial (unported, 4.0) License.
By accessing the work you hereby accept the Terms. Non-commercial uses of the work are permitted
without any further permission from Dove Medical Press Limited, provided the work is properly
attributed. For permission for commercial use of this work, please see paragraphs 4.2 and 5 of our Terms.
Recommended articles

Toxoplasma gondii Infection and ABO Blood Group Association Among Pregnant Sudanese Women: A Case Study
Magboul AM, Elamin E, Tamomh AG, Mohammed HY, Suliman MA, Ibrahim RM, Hassan IM, Mohammed SM, Albashir AA, Mhmoud MM, Abakar FS, Ahmed RA
International Journal of Women's Health 2023, 15:1375-1381
Published Date: 31 August 2023
Epidemiology of Congenital Heart Defects in Perinatal Infants in Guangxi, China
Peng Z, Wei J, Huang X, Chen B, Liang L, Feng B, Song P, He J, Que T, Lan J, Qin J, He S, Wei Q
International Journal of General Medicine 2024, 17:5381-5396
Published Date: 18 November 2024
Preeclampsia Among Pregnant Women Admitted to a Tertiary Care Hospital in Taiz City: Insights from a Conflict-Stricken Setting in Southwest Yemen
Hasan HM, Thabit MS, Abdulaziz M
International Journal of Women's Health 2026, 18:586732
Published Date: 17 February 2026
Epidemiological Analysis of Tuberculosis in Nakfa District, Eritrea: A 14 Year Spatiotemporal Study and Implications for TB Control
Mengistu ST, Kesete Y, Tesfay M, Ghebremeskel GG, Abraham S, Hamida ME, Achila OO
Infection and Drug Resistance 2026, 19:568404
Published Date: 12 March 2026