")
Back to Journals » Nature and Science of Sleep » Volume 13
Social Network and Risk of Poor Sleep Outcomes in Older Adults: Results from a Spanish Prospective Cohort Study
Authors Leon-Gonzalez R, Rodriguez-Artalejo F, Ortola R , Lopez-Garcia E, Garcia-Esquinas E
Received 30 October 2020
Accepted for publication 15 January 2021
Published 17 March 2021 Volume 2021:13 Pages 399—409
DOI https://doi.org/10.2147/NSS.S288195
Checked for plagiarism Yes
Review by Single anonymous peer review
Peer reviewer comments 4
Editor who approved publication: Dr Steven A Shea
Rocio Leon-Gonzalez,1 Fernando Rodriguez-Artalejo,1– 3 Rosario Ortola,1,2 Esther Lopez-Garcia,1– 3 Esther Garcia-Esquinas1,2
1Department of Preventive Medicine and Public Health, School of Medicine, Universidad Autónoma de Madrid/IdiPAZ, Madrid, Spain; 2CIBER of Epidemiology and Public Health (CIBERESP), Madrid, Spain; 3IMDEA Food Institute, CEI Uam+csic, Madrid, Spain
Correspondence: Esther Garcia-Esquinas
Department of Preventive Medicine and Public Health, School of Medicine, Universidad Autónoma de Madrid, Calle del Arzobispo Morcillo 4, Madrid, 28029, Spain
Tel +34 91-497-27-61
Email [email protected]
Background: Not having social support has been associated with poor sleep, but most prospective studies were based on social support in the workplace, did not account for baseline sleep characteristics or did not assess sleep duration. Moreover, no previous research has evaluated the relationship between social network and sleep outcomes in an older Spanish population.
Methods: 1444 individuals aged ≥ 60 years were followed between 2012 and 2015. At baseline (2012), a poor social network index (SNI) was computed by summing the following dichotomous indicators: not being married; living alone; not having daily contact with family, friends or neighbors; being alone ≥ 8h/day; lacking someone to go for a walk with; not having emotional support; lacking instrumental support. Higher values in SNI indicate less social support. In 2012 and 2015, information was collected on sleep duration (hours/day) and on symptoms of sleep disturbance: bad overall sleep; difficulty falling asleep, awakening during nighttime, early awakening with difficulty getting back to sleep, use of sleeping pills, feeling restless in the morning, being asleep at daytime, and having an Epworth Sleepiness Scale> 10. Poor sleep duration was defined as short (< 6 h) or long (> 9 h) nighttime sleep, and poor sleep quality as having ≥ 4 indicators of sleep disturbance. Linear or logistic regression models were used to assess the relationship of SNI with changes in sleep duration and in number of sleep disturbance indicators, or with the risk of developing poor nighttime sleep or poor sleep quality.
Results: Compared to individuals in the lowest (best) quartile of the SNI in 2012, those in the second, third and fourth quartiles, respectively, displayed a mean (95%confidence interval [95% CI]) change of 2.32 (− 7.58– 12.22), − 2.70 (− 13.19– 7.79) and − 13.04 (− 23.41- − 2.67) minutes in sleep duration from 2012 to 2015; p for trend=0.02. A 1-point increase in the SNI at baseline was associated with an increased risk of short nighttime sleep (Odds Ratio [OR] and 95% CI: 1.22 (1.05– 1.42)), poor sleep quality (OR: 1.13; 95% CI: 1.00– 1.30), and of the indicator of sleep disturbance “early awakening with difficulty getting back to sleep” (OR: 1.20; 95% CI: 1.07– 1.35).
Conclusion: A poorer social network is associated with a higher risk of short sleep and poor sleep quality in older adults.
Keywords: social network, emotional support, instrumental support, sleep, older people
Introduction
Sleep disorders are a common health problem with prevalence estimates ranging from 10% to 50% of the general population.1 Individuals with sleep problems frequently report physical and mental fatigue, altered mood, and poor concentration, which have a negative impact on their family life, professional activities and social relationships.2 Several meta-analyses of observational studies have shown that poor sleep duration (<6 or >9 hours/day) is associated with an increased risk of stroke,3 coronary heart disease,4,5 hypertension,5 diabetes,3,5 obesity,3,5 falls,6 all-cause3–5 and cancer-specific7,8 mortality.
The prevalence of social isolation among older adults is also high. According to recent estimates, only in the United States (US), 7.7 million community-dwelling older adults report being socially isolated.9 A social network is defined as the structure of all relevant relationships that link individuals with the people surrounding them. Prospective studies have shown an increased mortality among individuals with weaker social relationships.10 A lack of social support has also been associated with a higher risk of anxiety and depression,11 cardiovascular disease (CVD)12 and diabetes,13 and a lower adherence to medications for chronic disease management and control.14–16
Although there is evidence that not having social support is associated with poor sleep outcomes,17 most prospective studies are based on social support in the workplace, do not account for baseline sleep characteristics or do not assess sleep duration.17 Moreover, the few prospective studies on social support and sleep characteristics among the elderly have been carried out in Anglo-Saxon and Asian populations,18–23 with no previous study having evaluated this association in an older Mediterranean population. This is important because there are cultural differences in how people seek, receive and perceive social support from their social network,24,25 and some of these differences may moderate the relationship between social interactions and health outcomes.26 For example, older adults in Mediterranean countries are less frequently involved in volunteer groups or part-time employments, and rely more on the contact with family members than those from other developed regions.27,28 Some studies have also shown that older adults from more individualistic societies29 and societies with better welfare regimes like those in Northern and Central Europe, are less likely to suffer from loneliness and its consequences than those in more collectivistic cultures with lower levels of social protection in Southern and Eastern Europe.30 Also, when compared to older adults from other European regions, the Spanish elderly have longer nighttime sleep, shorter daytime naps, and later bed and wake up times.31 Given these particularities, we aimed to evaluate whether social network was prospectively associated with changes in sleep quality and sleep duration over time in community-dwelling older adults in Spain.
Methods
Study Participants and Design
The Seniors-ENRICA cohort was established during 2008–2010 with individuals selected by multi-stage stratified random sampling from the non-institutionalized Spanish population aged ≥60 years (wave 1).32 For these analyses, we used data from 2519 subjects participating in wave 2 (2012), the first wave with social network information available. At baseline (2012) and follow-up (2015), information regarding sociodemographic variables, sleep characteristics, health behaviors and morbidity was collected. During follow-up (2012–2015), 207 participants died and 488 were lost to follow-up (please see Supplementary Figure 1). Socio-demographic, lifestyle, and clinical characteristics of individuals lost to follow-up and those remaining were similar.33 This study was conducted in accordance with the Declaration of Helsinki. Study participants gave written informed consent, and the study was approved by the Clinical Research Ethics Committee of La Paz University Hospital, Madrid.
Study Variables
At baseline (2012), social network was assessed with eight questions about marital status, cohabitation, frequency of contacts with relatives other than those with whom you live, frequency of contacts with friends or neighbors, amount of time spent alone, availability of someone to go for a walk with, receipt of emotional support (ie, having someone to talk, share feelings or problems with), and receipt of instrumental support (ie, having someone who can take care of important things in case of sickness).34 Using this information, the following dichotomous (0/1) variables were created: not being married, living alone, not having daily/almost daily contacts with family members other than those living with, not having daily/almost daily contact with friends or neighbors, spending more than 8 hours/day alone, lacking someone to go for a walk with, not having emotional support, and not having someone to take care of important things in case of sickness. An overall social network index (SNI) was calculated as the sum of points for each dichotomous item and ranged from 0 (better) to 8 (worse).35
The SNI showed an acceptable internal consistency (Cronbach’s alpha, 0.68). It has content validity because the questions covered different aspects of the structure (ie, marital status, frequency of contact with relatives), and function (ie, emotional help, instrumental help) of social relationships within the network.36 With regards to construct validity, there is empirical evidence that the questions used enable subject´s principal social ties to be assessed.37 Finally, our measure of social network has criterion validity, because most of its items have been shown to be associated with both the physical and social dimensions of health-related quality of life, as measured by the Short Form-36 (SF-36) questionnaire on a sample of 3600 persons representative of the Spanish population aged ≥60 years.38
In 2012 and 2015, information on sleep duration and on symptoms of sleep disturbance was collected. Sleep duration was obtained with the question: “Approximately, for how long do you usually sleep per night?” Responses were categorized as short (<6 h), normal (7–8 h), or long sleep (>9 h).39 A sleep disturbance scale was built as the sum of the points given to each symptom of sleep disturbance (ie, bad overall sleep, difficulty falling asleep, awakening during nighttime, early awakening with difficulty getting back to sleep, use of sleeping pills, feeling restless in the morning, being asleep at daytime, and having an Epworth Sleepiness Scale (ESS) >10), with higher scores meaning worse sleep (please see Supplementary Table 1 for further details).40 Individuals were then classified according to quartiles of the sleep disturbance scale, with those in the highest quartile (ie, those with ≥4 points) being deemed to suffer from poor sleep quality. The main advantage of quantiles is that they help characterize the shape of the relationship between exposure and outcome without a priori assumptions about the form of the relationship and ensuring equal size groups (which increases the power of the analyses).
In 2012, information was collected on age, sex, education (≤primary, secondary and university studies), smoking status (current, former and never smoker), alcohol consumption (never/occasional drinkers, moderate drinkers, heavy/binge drinkers and ex-drinkers), and time (hours/week) in different leisure-time activities (watching television [TV], at the computer, reading, and listening music).41 Physical activity (PA) was assessed with the validated questionnaire used in the EPIC-cohort study in Spain, and expressed in metabolic equivalents of tasks (METs)- hours/week.42 Recreational PA included walking (commuting, shopping, or leisure time), cycling (commuting or leisure time), and playing sports (running, playing soccer, doing aerobics, swimming, or playing tennis), while household PA included doing household chores (cleaning, cooking, doing laundry or children rearing), gardening, and doing home repair (do-it-yourself activities). Compared with the rate of energy expended at rest, the assigned METs were 2.5 for walking and household chores and 4.0 for cycling, playing sports, gardening, and home repair.43 Weight and height were measured with standardized procedures, and the body mass index (BMI) was calculated as weight in kilos divided by squared height in meters. Food consumption was collected with a validated diet history and caffeine intake (mg/d) estimated from standard composition tables of foods in Spain.44 Adherence to a Mediterranean-type diet was assessed with the Mediterranean Diet Adherence Screener (MEDAS) score, which ranges from 0 (lowest) to 14 (highest adherence to the Mediterranean diet) and consists of 2 questions on food intake habits (“sofrito” and olive oil) considered characteristic of the Spanish Mediterranean diet, and 12 questions on food consumption frequency.45
Depression was ascertained with the 10-item version of the Geriatric Depression Scale (GDS-10),46 with the following yes-no questions being considered: 1) “Are you basically satisfied with your life?” 2) “Have you dropped many of your activities and interests?” 3) “Do you feel that your life is empty?” 4) “Are you afraid that something bad is going to happen to you?” 5) “Do you feel happy most of the time?” 6) “Do you often feel helpless?” 7) “Do you feel you have more problems with your memory than most?” 8) “Do you feel full of energy?” 9) “Do you feel that your situation is hopeless?” and 10) “Do you think that most people are better off than you are?”. The total number of “yes” responses to questions 2, 3, 4, 6, 7, 9, and 10, and “no” responses to questions 1, 5, and 8 were added to estimate a total depressive symptom score ranging from 1 to 10. Psychological distress was estimated using the 12-item general health questionnaire (GHQ-12), a screening tool that assesses the respondent’s current psychological state and asks if that differs from his/her usual state.47 The GHQ-12 included the following questions: “Have you recently … ” 1)“Lost much sleep over worry?” 2)“Felt constantly under strain?” 3)“Felt you couldn´t overcome your difficulties?” 4)“Been feeling unhappy or depressed?” 5)“Been losing confidence in yourself?” 6)“Been thinking of yourself as a worthless person” 7)“Been able to concentrate on what you´re doing” 8)‘Felt that you are playing a useful part in things’ 9)“Felt capable of making decisions about things?” 10)‘Been able to enjoy your normal day-to-day activities’ 11)“Been able to face up your problems” and 12)“Been feeling reasonable happy, all things considered?”. The response options were worded in terms of “less than usual”, “no more than usual”, “rather more than usual”, or “much more than usual”. Questions 1 through 6 were scored 1 point if participants responded “rather more than usual”, or “much more than usual”, whereas questions 7 through 12 were scored 1 point if they answered “less than usual” or “no more than usual”. The final scale ranged from 0 to 12, with higher scores indicating higher short-term psychological distress. Health-related quality of life was measured using the second version of the 12-item Short Form Health Survey, previously validated in Spain.48 Participants were also asked about any prescribed drugs, and these were checked by the study staff against drug packages at home. Finally, in 2012, participants reported if they had experienced ≥ 2 falls in the last year, and if they had suffered from any of the following physician-diagnosed diseases: CVD (ischemic heart disease, stroke, heart failure), diabetes, hypertension, cancer, respiratory disease (chronic bronchitis, asthma), or osteomuscular disease (osteoarthritis, arthritis).
Statistical Analyses
From the 1824 individuals who participated in 2015, we excluded 153 without data on sleep variables at baseline or at follow-up, and 227 without data on social network or potential confounders at baseline, leading to a final analytical sample of 1444 individuals (Supplementary Figure 1).
Differences in the social network by sociodemographic, lifestyle, morbidity, and sleep variables were tested using analysis of variance (ANOVA) for continuous variables and Pearson’s chi square for categorical variables. In cross-sectional analyses we evaluated the association of the SNI (as continuous and categorized into quartiles) and its components with the prevalence of short (<6) and long (>9) nighttime sleep, as well as with the prevalence of having ≤1, 2, 3 or ≥4 sleep disturbance indicators. Results from these models are presented as relative prevalence ratios (RPR) and their 95% confidence intervals (95% CI). In prospective analyses, we evaluated the association of the SNI (as continuous and categorized into quartiles) and its components with: a) changes in nighttime sleep duration (continuous) between 2012 and 2015; b) risk of short (<6) or long (>9) nighttime sleep in 2015; c) changes in the number of indicators of sleep disturbance (continuous) between 2012 and 2015; and d) risk of poor sleep quality (≥4 indicators of sleep disturbance). Model 1 adjusted for age, sex, education, and baseline values of the studied outcomes; model 2 further adjusted for baseline information on lifestyle factors (tobacco smoking, alcohol drinking, time/day spent in different activities [ie, watching TV, reading, listening music, at the computer], recreational and household PA, diet quality, caffeine consumption, and BMI); as well as for baseline GHQ-12 and GDS-10 scores, baseline number of drug treatments, prevalence of chronic morbidities, and number of falls during the preceding year. Results are presented as mean changes [MC] (for continuous outcomes) or odds ratios [OR] (for categorical outcomes), along with their 95% CI.
Finally, we evaluated whether the studied associations varied with sex, age, education, previous diagnosis of depression, PA, diet quality and caffeine consumption, by using likelihood-ratio tests that compared models with interaction terms and without. Given that no significant interactions were found, results are presented for the total sample.
Statistical significance was set at 2-sided p<0.05. Analyses were performed with STATA (version 13.0; Stata Corp.)
Results
Among study participants, 29% were not married, 20% lived alone, 29% did not have frequent contact with family members other than those with whom they lived, 40% did not have frequent contact with friends or neighbors, 19% spent more than 8 hours/day alone, 41% lacked someone to go for a walk with, 6% lacked emotional support and 49% instrumental support. Supplementary Table 2 shows the frequency of poor social network items stratified by the participants’ characteristics. Women, older participants, those with lower education, never drinkers or smokers, more sedentary and less active participants, as well as those with greater morbidities more frequently lived alone and spent >8 hours during daytime alone. Younger men showed lower contact with family members and a greater lack of instrumental support than their counterparts.
In cross-sectional analyses, a 1-point increase in the SNI was associated with having long night-time sleep (RPR and 95% CI: 1.17 [1.03–1.33]) and presenting ≥4 sleep disturbance indicators (RPR: 1.12; 95% CI: 1.00–1.25), while showed a borderline association with short night-time sleep (RPR: 1.08; 95% CI: 0.99–1.19) (Supplementary Table 3). Unmarried participants showed the highest prevalence of short sleep (RPR: 1.41; 95% CI: 1.00–1.19).
Over a mean follow-up of 2.8 years, participants lost an average of 10.45 minutes of sleep (SD: 75.9) (please see Supplementary Table 4), and a total of 88 and 104 participants developed short and long sleep, respectively (Table 1). Regarding the mean number of sleep disturbance indicators, this was unchanged, as some individuals improved while others worsen their sleep. However, of 1200 individuals with good sleep quality at baseline, 127 (10.6%) developed ≥4 sleep disturbance indicators (Table 2).
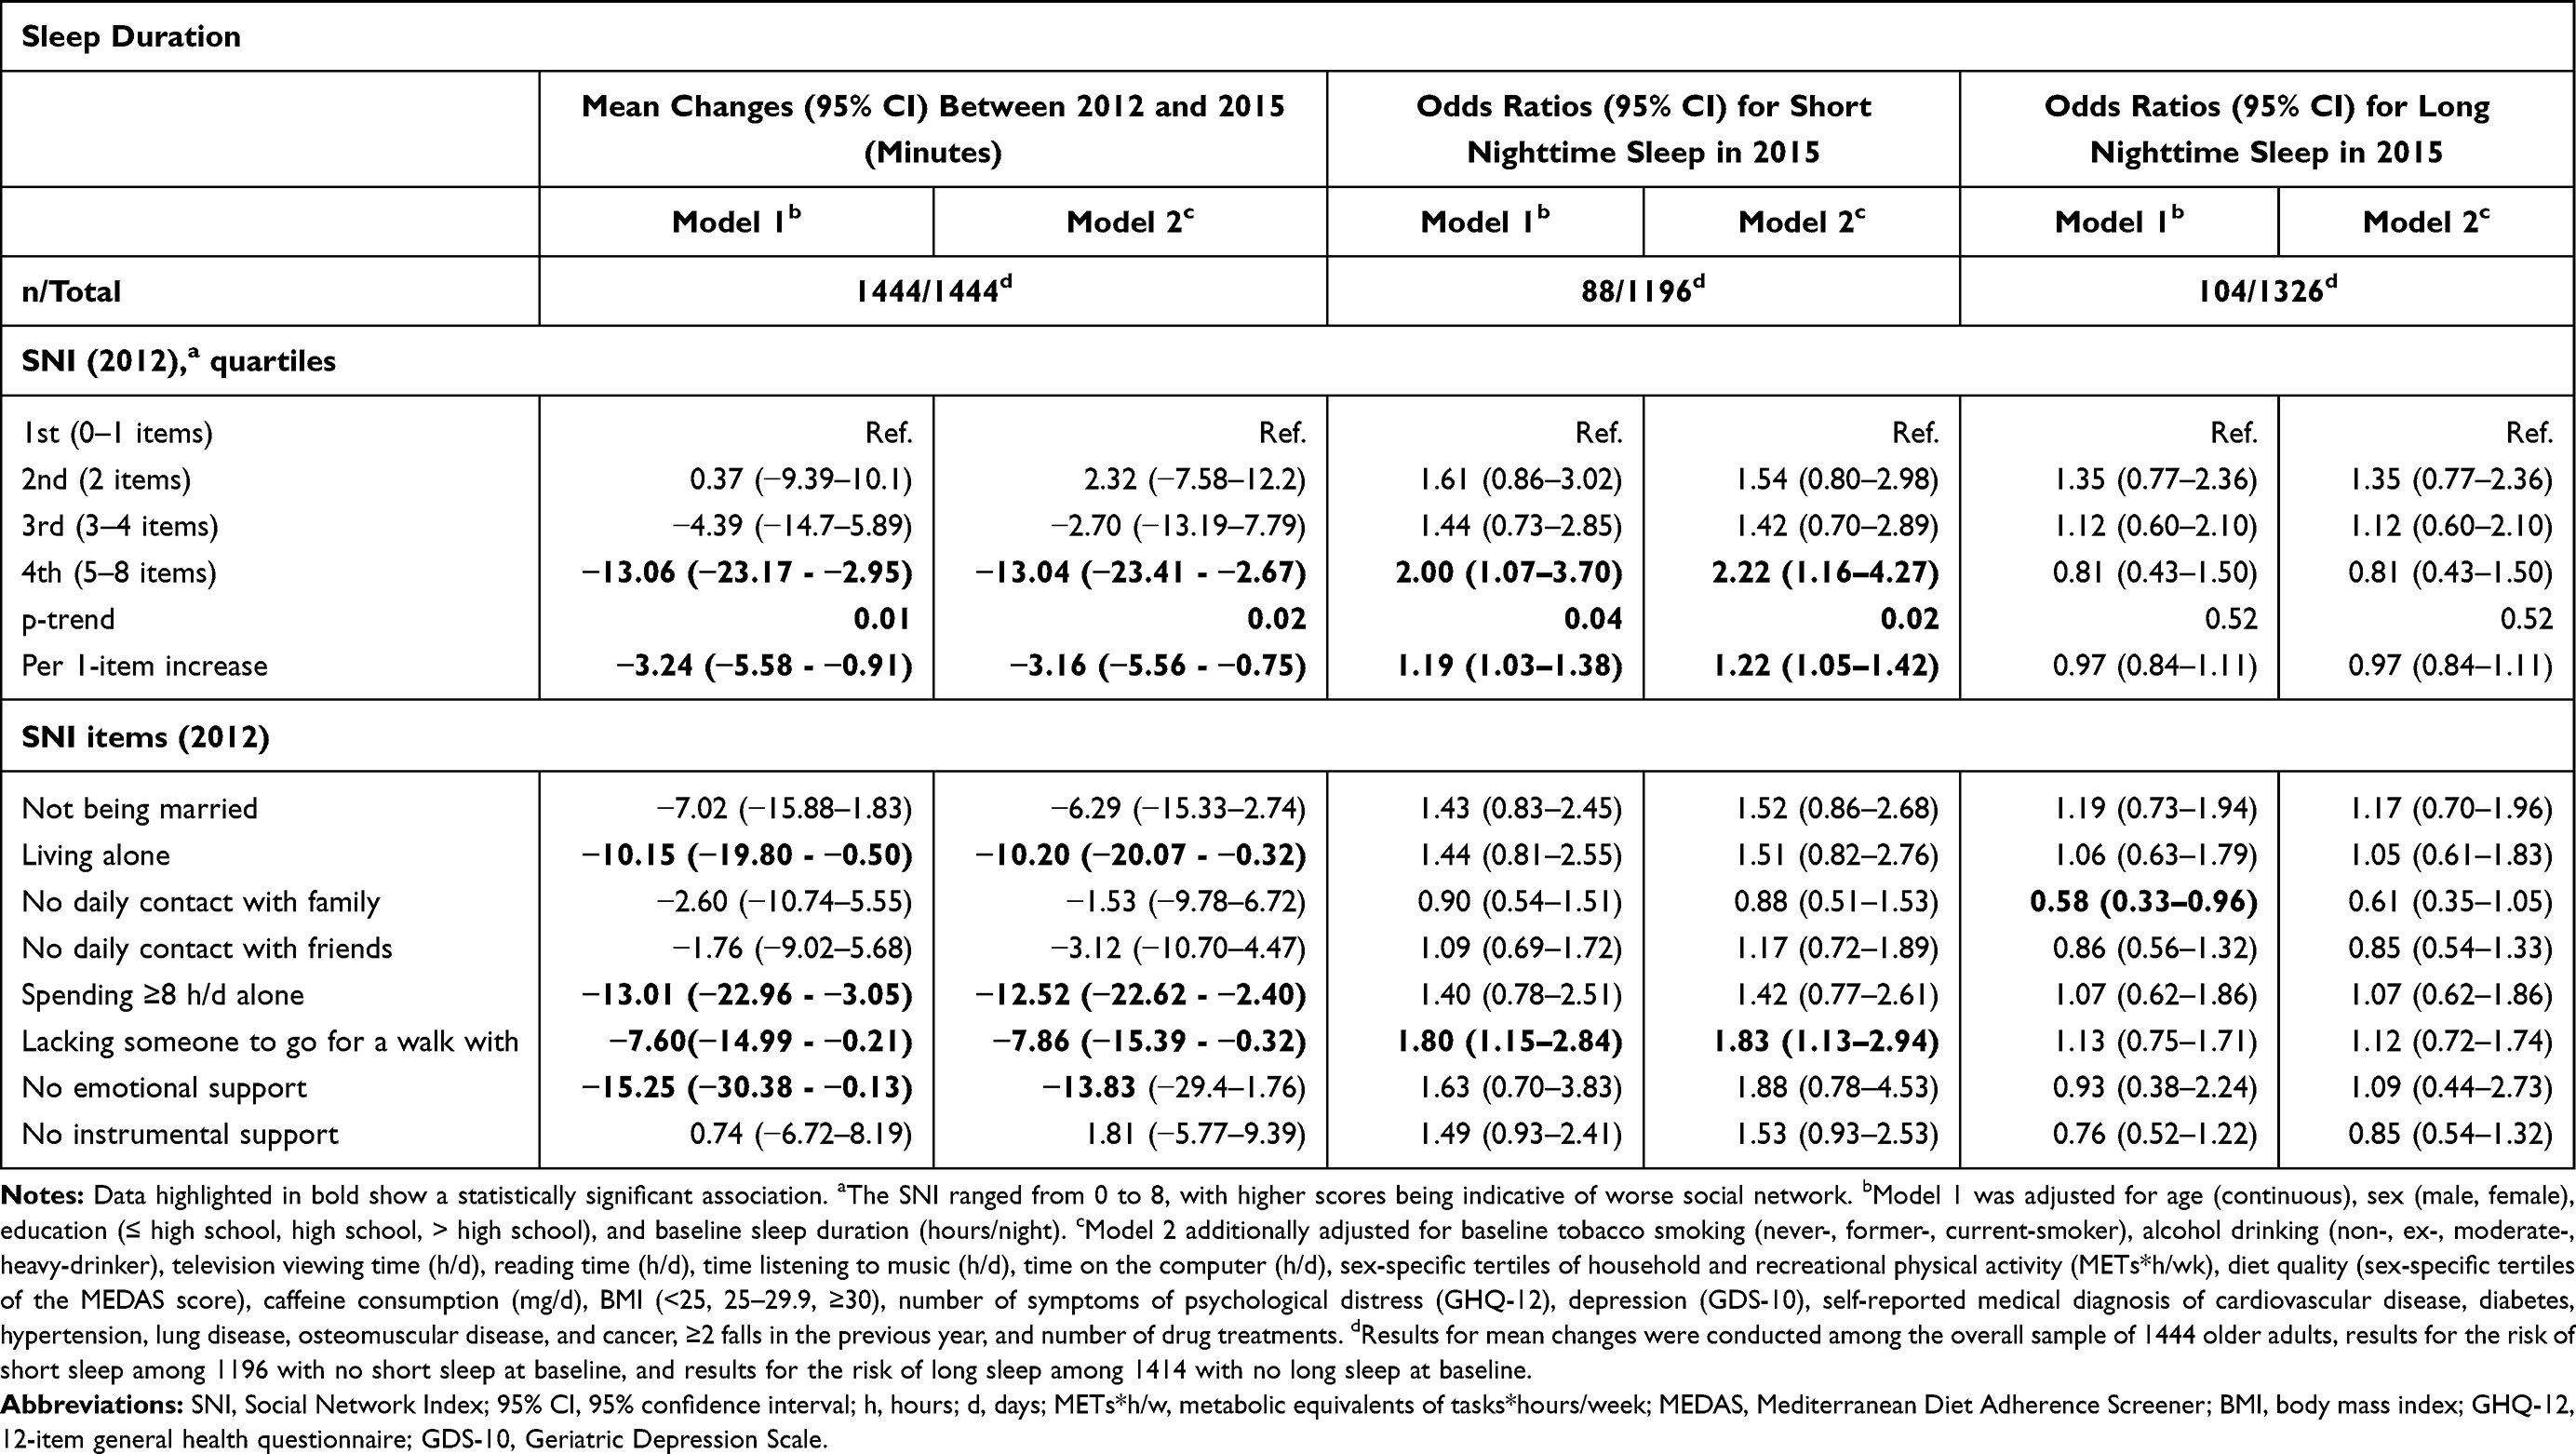 |
Table 1 Prospective Association Between Values of the Social Network Index (SNI) and Its Components in 2012, Changes in Nighttime Sleep Duration Between 2012 and 2015, and Risk of Short (<6 Hours) or Long (>9 Hours) Nighttime Sleep in 2015 |
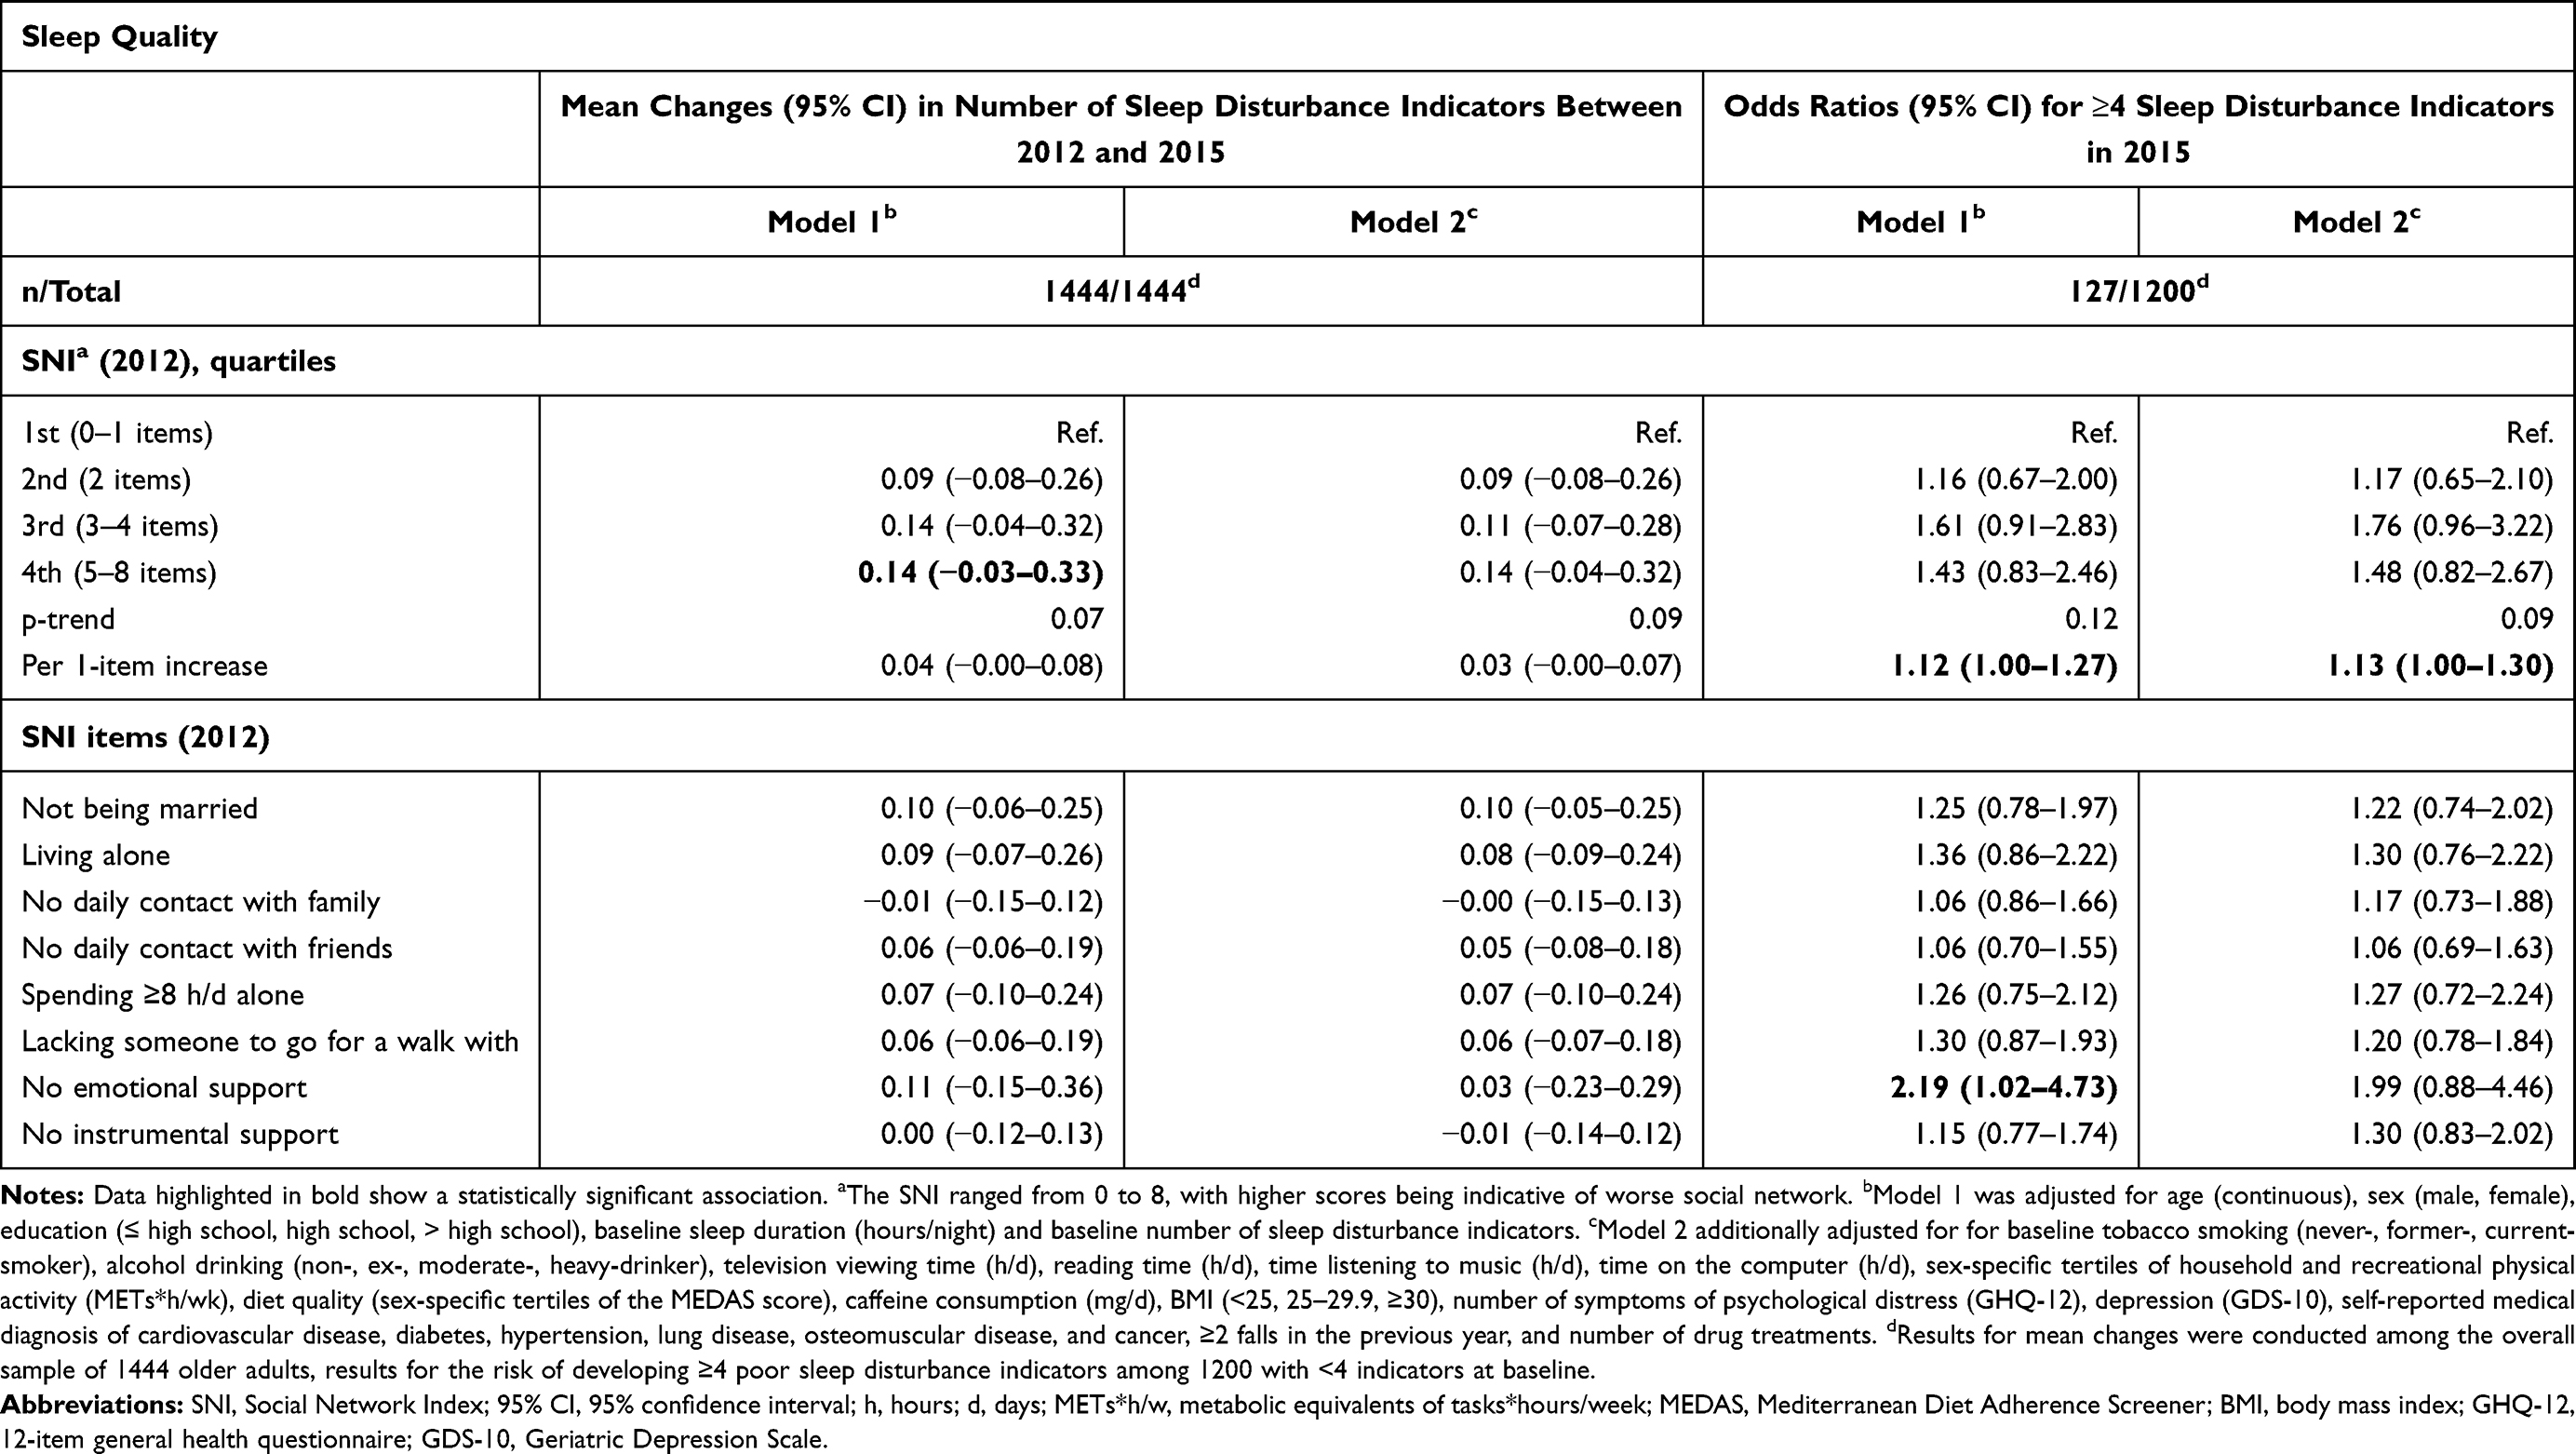 |
Table 2 Prospective Association Between Values of the Social Network Index (SNI) and Its Components in 2012, Changes in the Sleep Disturbance Scale Between 2012 and 2015, and Risk of Developing ≥4 Poor Sleep Disturbance Indicators in 2015 |
After multivariate adjustment, and compared to individuals in the lowest (best) quartile of baseline SNI, those in the second, third and fourth quartiles, respectively, suffered MC (95% CI) in sleep duration of 2.32 (−7.58–12.22), −2.70 (−13.19–7.79) and −13.04 (−23.41 - −2.67) minutes from 2012 to 2015; p for trend=0.02. Additionally, a higher risk of sleeping <6 h/d at follow-up was observed in those with worse social network (OR per 1 item increase in the SNI: 1.22; 95% CI: 1.05–1.42; Table 1). Living alone, spending ≥8 h/d alone, not having someone to go for a walk with, and not having emotional support showed the strongest associations with reductions in sleep duration and risk of short sleep.
Table 2 shows no overall association between baseline SNI scores and changes in the number of sleep disturbance indicators (MC in sleep disturbance scale per 1 item increase in the SNI: 0.03; 95% CI: −0.00–0.07). However, an increased risk of developing ≥ 4 sleep disturbance indicators at follow-up was observed among those with worse baseline social network (OR per 1 item increase in the SNI: 1.13; 95% CI: 1.00–1.30). When each sleep disturbance indicator was considered individually, a worse SNI score was only significantly associated with the risk of “early awakening and difficulty getting back to sleep” (odds ratio per 1-item increase: 1.20; 95% CI: 1.07–1.35), and no mean changes in the EES scores between baseline and follow-up were observed (data not shown in tables).
Discussion
In this cohort of community-dwelling older adults from a Mediterranean country, a worse SNI was cross-sectionally associated with the prevalence of long-term sleep and prospectively associated with a reduction in sleep duration and an increased risk of short sleep over time, regardless of other relevant sociodemographic, behavioral, and clinical covariates. Living alone, spending ≥8 h/d alone, not having someone to go for a walk with, and not having emotional support showed the strongest associations with reductions in sleep duration and risk of short sleep. Participants with worse SNI, and in particular those lacking someone to go for a walk with and those lacking emotional support, were more likely to display ≥ 4 poor sleep quality indicators at baseline, as well as to develop ≥ 4 sleep disturbance indicators when these were not present at baseline.
Despite sleep disorders being more common among older compared with younger adults,49 and the evidence showing that older adults with both short and long sleep display worse cognitive function,50,51 and are at increased risk of depression,52 falls,53 pain symptoms54 and disability,55 only a few previous studies have evaluated the prospective association between measures of social network and sleep characteristics in community-dwelling older adults.18–23 Findings from these cannot be directly compared with ours since they considered different social relationships and used different measures of sleep quality and duration, but they also showed a positive influence of social networks on sleep outcomes. Specifically, a study on 447 older adults followed for 2 years found a prospective relationship between emotional loneliness, as measured with 3 items of the de Jong Gierveld Scale, and poor sleep quality, assessed with the Pittsburgh Sleep Quality Index (PSQI).18 In another study, with 639 older adults from Taiwan, baseline social isolation (measured with a 4-item index: not being married, living alone, living in a rural area, not participating in any social groups) predicted worse PSQI scores 6 years later.23 Two studies from the National Social Life, Health and Aging Project in the US, with 52420 and 72719 subjects each, found that, while increasing social participation (volunteer work, religious services, meetings of organized groups) during 5 years was not associated with improved actigraphic measures of sleep quality or self-reported sleep characteristics,20 having a positive marital relationship predicted better actigraphy-estimated sleep quality. Also, in a cohort of 1417 older adults in Singapore, older adults with a weak social network, assessed with a modification of the Lubben’s social network scale, showed an increased risk of restless sleep 2 and 6 years later, as measured with the item “my sleep was restless” of the Center for Epidemiological Studies Depression (CES-D) scale.22 Finally, in a cohort of 1951 British older adults, a greater quality of relationship with the closest person, measured with an adapted version of the Close Person’s Questionnaire, was related to better score on the PSQI up to15 years latter.21
Weak social networks may influence sleep through several biological pathways, such as the dysregulation of the hypothalamic-pituitary-adrenocortical (HPA) axis,56,57 or the promotion of pro-inflammatory cytokine production.58,59 Different studies have found a link between measures of social isolation, loneliness, and perceived social support in older adults, and hyperactivity of the hypothalamic–pituitary–adrenal (HPA) axis. For instance, in a study from the Medical Research Council National Survey of Health and Development with 1795 older adults, those who were widowed or who were living alone had higher nighttime cortisol and flatter diurnal slope than their counterparts.21 In another study with 78 Chinese older adults, those who spent more time and effort in developing and strengthening their social ties showed a greater rise in cortisol in the morning and a significantly steeper decline over the day, attesting to more effective activation and deactivation of the HPA axis.56 Also, in a study with 92 African American older adults, a positive association between the frequency of weekly social activities and a steeper diurnal cortisol decline was observed.60 Moreover, in the Longitudinal Study of Ageing, lower positive support was recently associated with higher hair cortisone levels in a sample of 2520 older adults.61 On the other hand, feelings of loneliness and a lack of social support have been associated with increased levels of inflammatory biomarkers like fibrinogen62,63 or C reactive protein.58,63 Also, loneliness has shown to heighten feelings of vulnerability and unconscious vigilance for social threat,64 and increase total peripheral resistance and systolic blood pressure.65 More specifically, we recently found that lower social support was associated with higher nocturnal systolic blood pressure, and lower systolic blood pressure dipping in older individuals.66 Finally, a lack of social support may affect sleep hygiene practices, enhance chronic musculoskeletal pain,64 or increase the adoption of unhealthy lifestyle-behaviors.67–69
Limitations of our study include the use of self-reported sleep quality and sleep duration, which may be affected by recall and social desirability biases. However, the use of self-reported measures of sleep is habitual in large prospective studies due to its low-cost and simplicity. Although objective measures of sleep duration are more accurate, information related to personal perception of sleep quality can only be achieved with self-reported data. We also did not have information on sleep diaries. While we have not formally assessed the reliability of our instrument to measure social network, we have previously shown that this instrument was associated with hospital readmission and mortality among older patients with heart failure.35
Conclusions
Poor social network is prospectively associated with short sleep and worse sleep quality. Given the large number of older adults with social isolation, and the high prevalence and health consequences of sleep problems, there is a need to develop and evaluate interventions (ie, providing company, emotional support) that target social isolation for improving this important health outcome.
Abbreviations
US, United States; CVD, cardiovascular disease; SNI, Social Network Index; SF-36, Short Form-36; ESS, Epworth Sleepiness Scale; TV, television; PA, physical activity; METs, metabolic equivalents of tasks; BMI, body mass index; MEDAS, Mediterranean Diet Adherence Screener; GDS-10, Geriatric Depression Scale; GHQ-12, 12-item general health questionnaire; ANOVA, analysis of variance; RPR, relative prevalence ratios; MC, mean changes; OR, odds ratios; CI, confidence interval; PSQI, Pittsburgh Sleep Quality Index; CES-D, Center for Epidemiological Studies Depression; HPA, hypothalamic-pituitary-adrenocortical.
Data Sharing Statement
Data are available from the corresponding author on a reasonable request.
Ethics Approval and Informed Consent
This study was conducted in accordance with the Declaration of Helsinki. Study participants gave written informed consent, and the study was approved by the Clinical Research Ethics Committee of La Paz University Hospital, Madrid.
Funding
This work has been supported by grants PI18/287 and 19/319 from the Instituto de Salud Carlos III, State Secretary of R+D+I; and European Regional Development Fund (ERDF) and European Social Fund (ESF).
Disclosure
The authors report no conflicts of interest in this work.
References
1. Stubbs B, Vancampfort D, Thompson T, et al. Pain and severe sleep disturbance in the general population: primary data and meta-analysis from 240,820 people across 45 low- and middle-income countries. Gen Hosp Psychiatry. 2018;53:52–58. doi:10.1016/j.genhosppsych.2018.05.006
2. Léger D, Poursain B, Neubauer D, Uchiyama M. An international survey of sleeping problems in the general population. Curr Med Res Opin. 2008;24(1):307–317. doi:10.1185/030079907x253771
3. Jike M, Itani O, Watanabe N, Buysse DJ, Kaneita Y. Long sleep duration and health outcomes: a systematic review, meta-analysis and meta-regression. Sleep Med Rev. 2018;39:25–36. doi:10.1016/j.smrv.2017.06.011
4. Yin J, Jin X, Shan Z, et al. Relationship of sleep duration with all‐cause mortality and cardiovascular events: a systematic review and dose‐response meta‐analysis of prospective cohort studies. J Am Heart Assoc. 2017;6(9). doi:10.1161/JAHA.117.005947
5. Itani O, Jike M, Watanabe N, Kaneita Y. Short sleep duration and health outcomes: a systematic review, meta-analysis, and meta-regression. Sleep Med. 2017;32:246–256. doi:10.1016/j.sleep.2016.08.006
6. Wu L, Sun D. Sleep duration and falls: a systemic review and meta-analysis of observational studies. J Sleep Res. 2017;26(3):293–301. doi:10.1111/jsr.12505
7. Chen Y, Tan F, Wei L, et al. Sleep duration and the risk of cancer: a systematic review and meta-analysis including dose–response relationship. BMC Cancer. 2018;18(1):1149. doi:10.1186/s12885-018-5025-y
8. Stone CR, Haig TR, Fiest KM, McNeil J, Brenner DR, Friedenreich CM. The association between sleep duration and cancer-specific mortality: a systematic review and meta-analysis. Cancer Causes Control. 2019;30(5):501–525. doi:10.1007/s10552-019-01156-4
9. Cudjoe TKM, Roth DL, Szanton SL, Wolff JL, Boyd CM, Thorpe RJ. The epidemiology of social isolation: national health and aging trends study. J Gerontol Ser B. 2018. doi:10.1093/geronb/gby037
10. Holt-Lunstad J, Smith TB, Layton JB, Brayne C. Social relationships and mortality risk: a meta-analytic review. PLoS Med. 2010;7(7):e1000316. doi:10.1371/journal.pmed.1000316
11. Vink D, Aartsen MJ, Schoevers RA. Risk factors for anxiety and depression in the elderly: a review. J Affect Disord. 2008;106(1–2):29–44. doi:10.1016/j.jad.2007.06.005
12. Freeborne N, Simmens SJ, Manson JE, et al. Perceived social support and the risk of cardiovascular disease and all-cause mortality in the Women’s Health Initiative Observational Study. Menopause. 2019;26(7):698–707. doi:10.1097/GME.0000000000001297
13. Altevers J, Lukaschek K, Baumert J, et al. Poor structural social support is associated with an increased risk of Type 2 diabetes mellitus: findings from the MONICA/KORA Augsburg cohort study. Diabet Med. 2016;33(1):47–54. doi:10.1111/dme.12951
14. Mondesir FL, Carson AP, Durant RW, Lewis MW, Safford MM, Levitan EB. Association of functional and structural social support with medication adherence among individuals treated for coronary heart disease risk factors: findings from the REasons for Geographic and Racial Differences in Stroke (REGARDS) study. PLoS One. 2018;13(6):e0198578. doi:10.1371/journal.pone.0198578
15. Magrin ME, D’Addario M, Greco A, et al. Social support and adherence to treatment in hypertensive patients: a meta-analysis. Ann Behav Med. 2015;49(3):307–318. doi:10.1007/s12160-014-9663-2
16. Miller TA, Dimatteo MR. Importance of family/social support and impact on adherence to diabetic therapy. Diabetes Metab Syndr Obes. 2013;6:421–426. doi:10.2147/DMSO.S36368
17. Kent de Grey RG, Uchino BN, Trettevik R, Cronan S, Hogan JN. Social support and sleep: a meta-analysis. Heal Psychol. 2018;37(8):787–798. doi:10.1037/hea0000628
18. McHugh JE, Lawlor BA. Perceived stress mediates the relationship between emotional loneliness and sleep quality over time in older adults. Br J Health Psychol. 2013;18(3):546–555. doi:10.1111/j.2044-8287.2012.02101.x
19. Chen J-H, Waite LJ, Lauderdale DS. Marriage, relationship quality, and sleep among U.S. older adults. J Health Soc Behav. 2015;56(3):356–377. doi:10.1177/0022146515594631
20. Chen J-H, Lauderdale DS, Waite LJ. Social participation and older adults’ sleep. Soc Sci Med. 2016;149:164–173. doi:10.1016/j.socscimed.2015.11.045
21. Stafford M, Bendayan R, Tymoszuk U, Kuh D. Social support from the closest person and sleep quality in later life: evidence from a British birth cohort study. J Psychosom Res. 2017;98:1–9. doi:10.1016/j.jpsychores.2017.04.014
22. Cheng GH-L, Malhotra R, Chan A, Østbye T, Lo JC. Weak social networks and restless sleep interrelate through depressed mood among elderly. Qual Life Res. 2018;27(10):2517–2524. doi:10.1007/s11136-018-1895-3
23. Yu B, Steptoe A, Niu K, Ku P-W, Chen L-J. Prospective associations of social isolation and loneliness with poor sleep quality in older adults. Qual Life Res. 2018;27(3):683–691. doi:10.1007/s11136-017-1752-9
24. Kim HS, Sherman DK, Taylor SE. Culture and social support. Am Psychol. 2008;63(6):518–526. doi:10.1037/0003-066X
25. Rokach A, Orzeck T, Cripps J, Lackovic-Grgin K, Penezic Z. The effects of culture on the meaning of loneliness. Soc Indic Res. 2001;53(1):17–31. doi:10.1023/A:1007183101458
26. Campos B. What is the role of culture in the association of relationships with health? Soc Personal Psychol Compass. 2015;9(11):661–677. doi:10.1111/spc3.12226
27. Litwin H. Social networks and well-being: a comparison of older people in Mediterranean and non-Mediterranean countries. J Gerontol B Psychol Sci Soc Sci. 2010;65B(5):599–608. doi:10.1093/geronb/gbp104
28. López-Cerdá E, Carmona-Torres JM, Rodríguez-Borrego MA. Social support for elderly people over 65 years in Spain. Int Nurs Rev. 2019;66(1):104–111. doi:10.1111/inr.12468
29. Fokkema T, De Jong Gierveld J, Dykstra PA. Cross-national differences in older adult loneliness. J Psychol Interdiscip Appl. 2012;146(1–2):201–228. doi:10.1080/00223980.2011.631612
30. Nyqvist F, Nygård M, Scharf T. Loneliness amongst older people in Europe: a comparative study of welfare regimes. Eur J Ageing. 2019;16(2):133–143. doi:10.1007/s10433-018-0487-y
31. Ohayon MM. Interactions between sleep normative data and sociocultural characteristics in the elderly. J Psychosom Res. 2004;56(5):479–486. doi:10.1016/j.psychores.2004.04.365
32. García-Esquinas E, Pérez-Hernández B, Guallar-Castillón P, Banegas JR, Ayuso-Mateos JL, Rodríguez-Artalejo F. Housing conditions and limitations in physical function among older adults. J Epidemiol Community Health. 2016;70(10):954–960. doi:10.1136/jech-2016-207183
33. García-Esquinas E, José García-García F, León-Muñoz LM, et al. Obesity, fat distribution, and risk of frailty in two population-based cohorts of older adults in Spain. Obesity. 2015;23(4):847–855. doi:10.1002/oby.21013
34. Redondo-Sendino Á, Guallar-Castillón P, Banegas JR, Rodríguez-Artalejo F. Relationship between social network and hypertension in older people in Spain. Rev Española Cardiol (English Ed). 2005;58(11):1294–1301. doi:10.1016/S1885-5857(06)60417-9
35. Rodríguez-Artalejo F, Guallar-Castillón P, Herrera MC, et al. Social network as a predictor of hospital readmission and mortality among older patients with heart failure. J Card Fail. 2006;12(8):621–627. doi:10.1016/j.cardfail.2006.06.471
36. Valtorta NK, Kanaan M, Gilbody S, Hanratty B. Loneliness, social isolation and social relationships: what are we measuring? A novel framework for classifying and comparing tools. BMJ Open. 2016;6(4):e010799. doi:10.1136/bmjopen-2015-010799
37. Glass TA, Mendes de Leon CF, Seeman TE, Berkman LF. Beyond single indicators of social networks: a LISREL analysis of social ties among the elderly. Soc Sci Med. 1997;44(10):1503–1517. doi:10.1016/s0277-9536(96)00270-5
38. García EL, Banegas JR, Pérez-Regadera AG, Cabrera RH, Rodríguez-Artalejo F. Social network and health-related quality of life in older adults: a population-based study in Spain. Qual Life Res. 2005;14(2):511–520. doi:10.1007/s11136-004-5329-z
39. Hirshkowitz M, Whiton K, Albert SM, et al. National Sleep Foundation’s sleep time duration recommendations: methodology and results summary. Sleep Heal. 2015;1(1):40–43. doi:10.1016/j.sleh.2014.12.010
40. Campanini MZ, Guallar-Castillón P, Rodríguez-Artalejo F, Lopez-Garcia E. Mediterranean diet and changes in sleep duration and indicators of sleep quality in older adults. Sleep. 2017;40(3). doi:10.1093/sleep/zsw083
41. Martínez-González MA, López-Fontana C, Varo JJ, Sánchez-Villegas A, Martinez JA. Validation of the Spanish version of the physical activity questionnaire used in the nurses’ health study and the health professionals’ follow-up study. Public Health Nutr. 2005;8(7):920–927. doi:10.1079/phn2005745
42. Pols MA, Peeters PH, Ocké MC, Slimani N, Bueno-de-mesquita HB, Collette HJ. Estimation of reproducibility and relative validity of the questions included in the EPIC Physical Activity Questionnaire. Int J Epidemiol. 1997;26(Suppl 1):S181–S189. doi:10.1093/ije/26.suppl_1.s181
43. Ainsworth BE, Haskell WL, Herrmann SD, et al. 2011 compendium of physical activities: a second update of codes and MET values. Med Sci Sports Exerc. 2011;43(8):1575–1581. doi:10.1249/MSS.0b013e31821ece12
44. Guallar-Castillón P, Sagardui-Villamor J, Balboa-Castillo T, et al. Validity and reproducibility of a Spanish dietary history. PLoS One. 2014;9(1):e86074. doi:10.1371/journal.pone.0086074
45. Schröder H, Fitó M, Estruch R, et al. A Short screener is valid for assessing mediterranean diet adherence among older Spanish men and women. J Nutr. 2011;141(6):1140–1145. doi:10.3945/jn.110.135566
46. Yesavage JA, Brink TL, Rose TL, et al. Development and validation of a geriatric depression screening scale: a preliminary report. J Psychiatr Res. 1982;17(1):37–49. doi:10.1016/0022-3956(82)90033-4
47. Sánchez-López MDP, Dresch V. The 12-item general health questionnaire (GHQ-12): reliability, external validity and factor structure in the Spanish population. Psicothema. 2008;20(4):839–843.
48. Schmidt S, Vilagut G, Garin O, et al. Reference guidelines for the 12-ItemShort-Form Health Survey version 2 based on the Catalan general population. Med Clin (Barc). 2012;139(14):613–625. doi:10.1016/j.medcli.2011.10.024
49. Neikrug AB, Ancoli-Israel S. Sleep Disorders in the Older Adult – a Mini-Review. Gerontology. 2010;56(2):181–189. doi:10.1159/000236900
50. Ding G, Li J, Lian Z. Both short and long sleep durations are associated with cognitive impairment among community-dwelling Chinese older adults. Medicine (Baltimore). 2020;99(13):e19667. doi:10.1097/MD.0000000000019667
51. Low DV, Wu MN, Spira AP. Sleep duration and cognition in a nationally representative sample of U.S. older adults. Am J Geriatr Psychiatry. 2019;27(12):1386–1396. doi:10.1016/j.jagp.2019.07.001
52. Van Den Berg JF, Luijendijk HJ, Tulen JHM, Hofman A, Neven AK, Tiemeier H. Sleep in depression and anxiety disorders: a population-based study of elderly persons. J Clin Psychiatry. 2009;70(8):1105–1113. doi:10.4088/JCP.08m04448
53. Fu L, Yu X, Zhang W, et al. The relationship between sleep duration, falls, and muscle mass: a cohort study in an elderly Chinese population. Rejuvenation Res. 2019;22(5):390–398. doi:10.1089/rej.2018.2102
54. Chen T-Y, Lee S, Schade MM, Saito Y, Chan A, Buxton OM. Longitudinal relationship between sleep deficiency and pain symptoms among community-dwelling older adults in Japan and Singapore. Sleep. 2019;42(2). doi:10.1093/sleep/zsy219
55. Nakakubo S, Doi T, Makizako H, et al. Sleep duration and excessive daytime sleepiness are associated with incidence of disability in community-dwelling older adults. J Am Med Dir Assoc. 2016;17(8):
56. Lai JCL, Chong AML, Siu OT, Evans P, Chan CLW, Ho RTH. Social network characteristics and salivary cortisol in healthy older people. ScientificWorldJournal. 2012;2012:929067. doi:10.1100/2012/929067
57. Adam EK, Hawkley LC, Kudielka BM, Cacioppo JT. Day-to-day dynamics of experience-cortisol associations in a population-based sample of older adults. Proc Natl Acad Sci. 2006;103(45):17058–17063. doi:10.1073/pnas.0605053103
58. Elliot AJ, Heffner KL, Mooney CJ, Moynihan JA, Chapman BP. Social relationships and inflammatory markers in the MIDUS cohort: the role of age and gender differences. J Aging Health. 2018;30(6):904–923. doi:10.1177/0898264317698551
59. Louks EB, Sullivan LM, D’Agostino RB, Larson MG, Berkman LF, Benjamin EJ. Social networks and inflammatory markers in the Framingham Heart Study. J Biosoc Sci. 2006;38(6):835–842. doi:10.1017/S0021932005001203
60. Zilioli S, Fritz H, Tarraf W, Lawrence SA, Cutchin MP. Socioeconomic status, ecologically assessed social activities, and daily cortisol among older Urban African Americans. J Aging Health. 2020;32(7–8):830–840. doi:10.1177/0898264319856481
61. Iob E, Kirschbaum C, Steptoe A. Positive and negative social support and HPA-axis hyperactivity: evidence from glucocorticoids in human hair. Psychoneuroendocrinology. 2018;96:100–108. doi:10.1016/j.psyneuen.2018.06.008
62. Steptoe A, Owen N, Kunz-Ebrecht SR, Brydon L. Loneliness and neuroendocrine, cardiovascular, and inflammatory stress responses in middle-aged men and women. Psychoneuroendocrinology. 2004;29(5):593–611. doi:10.1016/S0306-4530(03)00086-6
63. Mezuk B, Diez Roux AV, Seeman T. Evaluating the buffering vs. direct effects hypotheses of emotional social support on inflammatory markers: the Multi-Ethnic Study of Atherosclerosis. Brain Behav Immun. 2010;24(8):1294–1300. doi:10.1016/j.bbi.2010.06.006
64. Hawkley LC, Cacioppo JT. Loneliness matters: a theoretical and empirical review of consequences and mechanisms. Ann Behav Med. 2010;40(2):218–227. doi:10.1007/s12160-010-9210-8
65. Hawkley LC, Thisted RA, Masi CM, Cacioppo JT. Loneliness predicts increased blood pressure: 5-year cross-lagged analyses in middle-aged and older adults. Psychol Aging. 2010;25(1):132–141. doi:10.1037/a0017805
66. Sanchez M, López-García E, Guallar-Castillón P, et al. Social support and ambulatory blood pressure in older people. J Hypertens. 2016;34(10):2045–2052. doi:10.1097/HJH.0000000000001036
67. Böhm AW, Mielke GI, da Cruz MF, Ramires VV, Wehrmeister FC. Social support and leisure-time physical activity among the elderly: a population-based study. J Phys Act Heal. 2016;13(6):599–605. doi:10.1123/jpah.2015-0277
68. Loprinzi PD, Crush EA. Source and size of social support network on sedentary behavior among older adults. Am J Health Promot. 2018;32(1):28–31. doi:10.1177/0890117116686888
69. Boehlen F, Herzog W, Quinzler R, et al. Loneliness in the elderly is associated with the use of psychotropic drugs. Int J Geriatr Psychiatry. 2015;30(9):957–964. doi:10.1002/gps.4246
 © 2021 The Author(s). This work is published and licensed by Dove Medical Press Limited. The full terms of this license are available at https://www.dovepress.com/terms.php and incorporate the Creative Commons Attribution - Non Commercial (unported, v3.0) License.
By accessing the work you hereby accept the Terms. Non-commercial uses of the work are permitted without any further permission from Dove Medical Press Limited, provided the work is properly attributed. For permission for commercial use of this work, please see paragraphs 4.2 and 5 of our Terms.
© 2021 The Author(s). This work is published and licensed by Dove Medical Press Limited. The full terms of this license are available at https://www.dovepress.com/terms.php and incorporate the Creative Commons Attribution - Non Commercial (unported, v3.0) License.
By accessing the work you hereby accept the Terms. Non-commercial uses of the work are permitted without any further permission from Dove Medical Press Limited, provided the work is properly attributed. For permission for commercial use of this work, please see paragraphs 4.2 and 5 of our Terms.