Back to Journals » Neuropsychiatric Disease and Treatment » Volume 12
Sleep deprivation disturbed regional brain activity in healthy subjects: evidence from a functional magnetic resonance-imaging study
Authors Wang L, Chen Y, Yao Y, Pan Y, Sun Y
Received 1 November 2015
Accepted for publication 17 February 2016
Published 12 April 2016 Volume 2016:12 Pages 801—807
DOI https://doi.org/10.2147/NDT.S99644
Checked for plagiarism Yes
Review by Single anonymous peer review
Peer reviewer comments 3
Editor who approved publication: Professor Wai Kwong Tang
Li Wang, Yin Chen, Ying Yao, Yu Pan, Yi Sun
Department of Neurology, Sir Run Run Shaw Hospital, School of Medicine, Zhejiang University, Hangzhou, People’s Republic of China
Objective: The aim of this study was to use amplitude of low-frequency fluctuation (ALFF) to explore regional brain activities in healthy subjects after sleep deprivation (SD).
Materials and methods: A total of 16 healthy subjects (eight females, eight males) underwent the session twice: once was after normal sleep (NS), and the other was after SD. ALFF was used to assess local brain features. The mean ALFF-signal values of the different brain areas were evaluated to investigate relationships with clinical features and were analyzed with a receiver-operating characteristic curve.
Results: Compared with NS subjects, SD subjects showed a lower response-accuracy rate, longer response time, and higher lapse rate. Compared with NS subjects, SD subjects showed higher ALFF area in the right cuneus and lower ALFF area in the right lentiform nucleus, right claustrum, left dorsolateral prefrontal cortex, and left inferior parietal cortex. ALFF differences in regional brain areas showed high sensitivity and specificity. In the SD group, mean ALFF of the right claustrum showed a significant positive correlation with accuracy rate (r=0.687, P=0.013) and a negative correlation with lapse rate (r=-0.706, P=0.01). Mean ALFF of the dorsolateral prefrontal cortex showed a significant positive correlation with response time (r=0.675, P=0.016).
Conclusion: SD disturbed the regional brain activity of the default-mode network, its anticorrelated “task-positive” network, and the advanced cognitive function brain areas.
Keywords: sleep deprivation, amplitude of low-frequency fluctuation, default-mode network, functional magnetic resonance imaging
Introduction
Sleep is very important for humans to live a normal life. Sleep deprivation (SD), widespread in today’s society, is a sleep-loss status generally caused by personal or environmental reasons.1 SD can lead to a series of changes in emotional balance, and has a detrimental effect on cognitive function, attention, learning, and working memory.2–5 Long-term SD duration is associated with exaggerated neural reactivity, multisystemic and multiorganic dysfunction, and negative metabolic, psychological, physiological, or even behavioral reactivity.1,6–8
Many studies have been carried out in short-term SD (24 hours), and found that SD adversely affects brain function and cognitive domains.9,10 A previous study employing resting-state functional magnetic resonance imaging (rs-fMRI) to explore brain-activation patterns by acupuncture stimuli during SD status found that sanyinjiao (SP6) elicits greater and anatomically different activations in the salience network than those of sham stimuli.11 rs-fMRI studies have found altered functional connectivity in the sleep-deprived brain.12–15 Furthermore, multiple observations of altered connectivity within and between various resting-state networks have been reported for SD.12–18 These findings suggest that SD disturbs resting-state brain-activity patterns for internal processing of information.19 However, the neurologic mechanisms remain unclear.
The amplitude of low-frequency fluctuation (ALFF) can locate which brain region has abnormal regional spontaneous neuronal activity in blood oxygen level-dependent signals, and has been shown to have good-to-moderate test–retest reliability ranging from minimal to robust.20–22 Therefore, the simple calculation and reliable characterization of the ALFF measurement make it a potentially useful tool for rs-fMRI data analysis to investigate various functional brain changes.15 Recently, the use of ALFF measurement has been successfully applied to SD,15,23 wakefulness and light sleep,24 obstructive sleep apnea,25 primary insomnia,26 and primary angle-closure glaucoma.27 In this study, we hypothesized that SD would result in aberrant regional brain activity. To test the hypothesis, we utilized ALFF as an index to investigate the potential neurologic mechanisms of SD.
Materials and methods
Subjects
Sixteen healthy university students (mean age 24.51±2.75 years, mean education duration 16.8±1.8 years) responding to a web-based questionnaire were recruited. All subjects met the following criteria, as in previous studies:1,15,28 1) no symptoms associated with sleep disorders and no history of any psychiatric or neurologic disorders; 2) right-handed; 3) good sleeping habits; 4) good sleep onset and/or maintenance, and no history of swing shift, shift work, sleep complaints, or other sleep disorders; 5) regular dietary habits, and had not consumed any stimulants, alcohol, tea, cigarettes, medications, or caffeine for at least 3 months prior to the study; 6) no foreign implants in the body, and no inborn or other acquired diseases; 7) moderate body shape and weight; and 8) Pittsburgh Sleep Quality Index score <5.
Research design and procedures
To evaluate sleep status, all subjects were monitored for 1 week by wearing a Fitbit Flex tracker (http://help.fitbit.com).28 Each of the subjects underwent the session twice randomly. Once was after normal sleep (NS), and the other was after a total of 24 hours’ SD. Each subject underwent an MRI scan at each session, before which all subjects underwent an attention network test.15,29,30 A simple questionnaire was administered immediately after the scans to ascertain whether the subjects were awake during the scans. SD was conducted in a specialized room, and started from 7 pm and ended at 7 pm the following day.
All volunteers were informed of the purposes, methods, and potential risks. This study was approved by the human-research ethics committee of Sir Run Run Shaw Hospital of Zhejiang University. All volunteers participated voluntarily, and all signed an informed consent form.
MRI parameters
MRI scans were performed on a 3 T MR scanner (Trio; Siemens, Munich, Germany). High-resolution T1-weighted images were acquired with a three-dimensional spoiled gradient-recalled sequence in a sagittal orientation: 176 images (repetition time 1,900 ms, echo time 2.26 ms, thickness 1 mm, gap 0.5 mm, acquisition matrix 256×256, field of view 250×250 mm, flip angle 9°) were obtained. Finally, rs-fMRI scan was obtained with eyes opened. A total of 240 functional images (repetition time 3,000 ms, echo time 30 ms, thickness 4 mm, gap 1.2 mm, acquisition matrix 64×64, flip angle 90°, field of view 220×220 mm; 36 axial slices with gradient-recalled echo-planar imaging pulse sequence) covering the whole brain were obtained.
fMRI data analysis
Based on the MatLab 2012a (MathWorks, Natick, MA, USA), data preprocessing was performed by Data Processing Assistant for Resting-State fMRI (http://rfmri.org/DPARSF) software, including Digital Imaging and Communication in Medicine form transformation, slice timing, head-motion correction, spatial normalization, and smooth. The first ten time points of the functional images were discarded, due to the possible instability of the initial MRI signal and the participants’ adaptation to the scanning environment. Participants who had more than 1.5 mm maximum translation in x, y, or z and 1.5° motion rotation were rejected. Friston six head-motion parameters were used to regress out the head-motion effects based on recent work showing that the higher-order models were more effective in removing head-motion effects.31,32 After head-motion correction, the fMRI images were spatially normalized to Montreal Neurological Institute space and resampled at a resolution of 3×3×3 mm. Smoothening was performed with a Gaussian kernel of 6×6×6 mm3 full width at half maximum. After preprocessing, the time series for each voxel was temporally band-pass filtered (0.01–0.08 Hz) and linearly detrended to reduce low-frequency drift and physiological high-frequency respiratory and cardiac noise. The details of the ALFF calculation have been reported in previous studies.15,27,33 To reduce the global effects of variability across the participants, the mean ALFF value of each voxel was divided by the global mean ALFF value for each participant.
Receiver-operating characteristic curve
Discrimination results are considered excellent for areas under the curve between 0.9 and 1, good between 0.8 and 0.9, fair between 0.7 and 0.8, poor between 0.6 and 0.7, and failed between 0.5 and 0.6.34 Since different ALFF areas might be utilized as markers to separate the SD group from the NS group, the mean signal values of the different areas were extracted and used for receiver-operating characteristic (ROC)-curve analysis to investigate whether these specific ALFF differences had the sensitivity and specificity to distinguish the SD group from the NS group.
Brain–behavior correlation analysis
Based on the ALFF findings, the mean ALFF-signal values of the different brain areas were extracted and their correlations calculated with the behavioral performances using the IBM Statistical Package for the Social Sciences (SPSS, version 21.0) software, with the statistical threshold set at P<0.05.
Statistical analysis
A two-paired t-test was used to assess the differences in brain activity between the two groups. A corrected significance level of individual voxels of P<0.001 and contiguous cluster volume ≥351 mm3, using an AlphaSim corrected threshold of cluster P<0.05, were used to determine statistical significance.
Results
Behavioral results
Compared with the NS subjects, the SD subjects showed a lower response-accuracy rate (SD: 92%±1.95%, NS: 97.25%±2.42%, t=−5.852; P<0.001), a longer response time (SD: 631.61±86.67 ms, NS: 527.49±39.06 ms, t=3.794; P=0.002), and a higher lapse rate (SD: 7.11%±9.59%, NS: 0.09%±0.25%, t=2.534; P=0.028).
ALFF differences
Compared with the NS subjects, the SD subjects showed higher ALFF area in the right cuneus (Brodmann’s area [BA] 17, BA 18), and lower ALFF area in the right lentiform nucleus, right claustrum, left middle frontal gyrus (BA 46), and left inferior parietal cortex (IPC; BA 39). Details are presented in Figure 1 and Table 1.
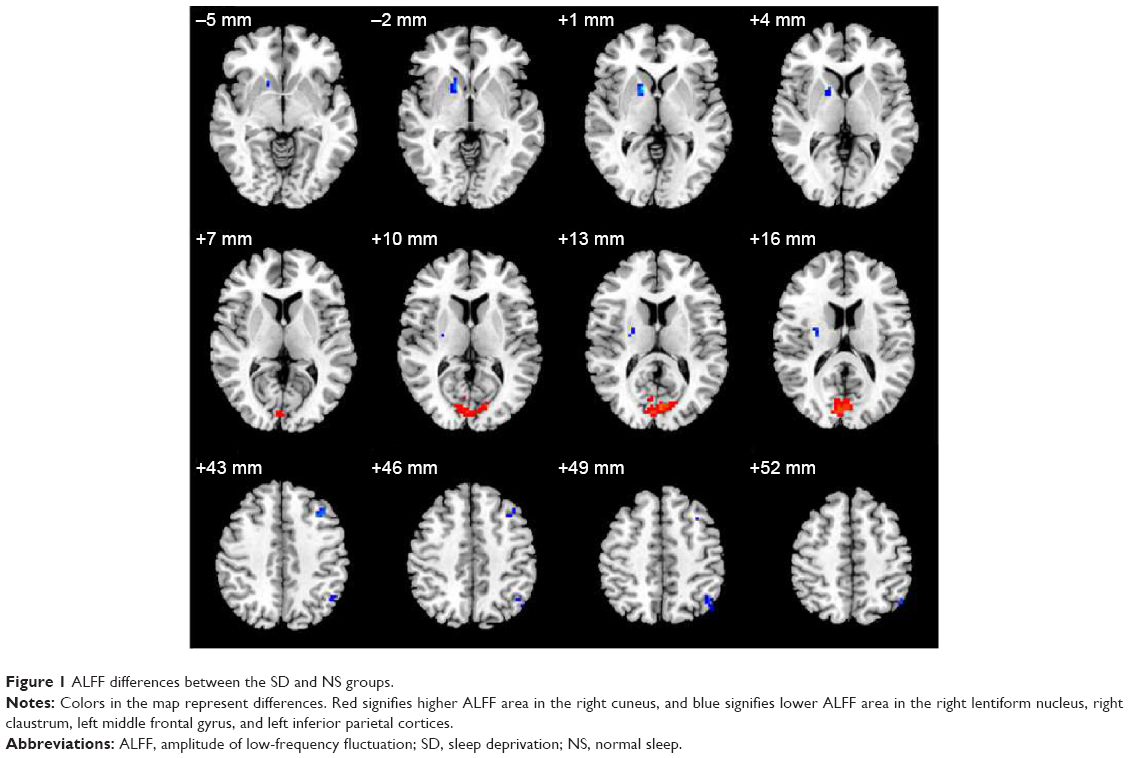 | Figure 1 ALFF differences between the SD and NS groups. |
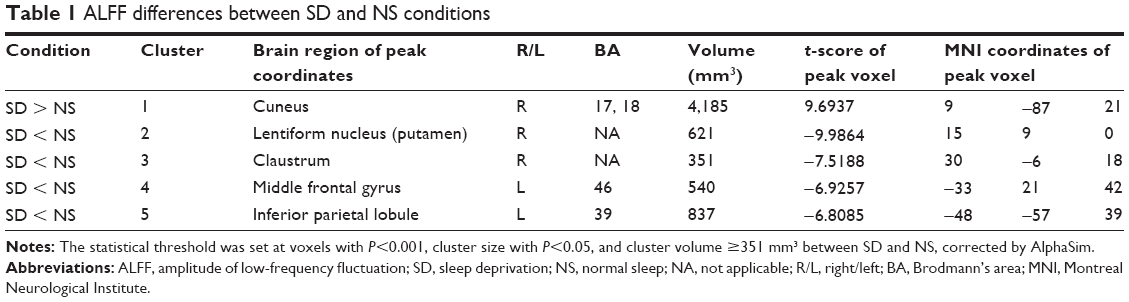 | Table 1 ALFF differences between SD and NS conditions |
ALFF analysis shows high sensitivity and specificity
Figure 2 shows the mean ALFF-signal values of the altered regional brain areas. These different values were used for ROC-curve analysis to investigate whether these specific ALFF differences had the sensitivity and specificity to distinguish the SD group from the NS group. ROC-curve analysis showed that the area under the curve of the five different brain areas (from cluster 1 to cluster 5) was 0.861 with a cutoff point of 0.996 (mean ALFF-signal value), 0.757 with a cutoff point of −0.538, 0.944 with a cutoff point of −0.93, 0.826 with a cutoff point of 0.084, and 0.736 with a cutoff point of 0.471. Further diagnostic analysis showed that the different brain areas alone discriminated SD status from NS status with high sensitivity and specificity: corresponding values from clusters 1–5 were 0.667 and 0.917, 0.667 and 0.833, 0.833 and 0.917, 0.833 and 0.833, and 0.583 and 0.833, respectively. Details are presented in Figure 3.
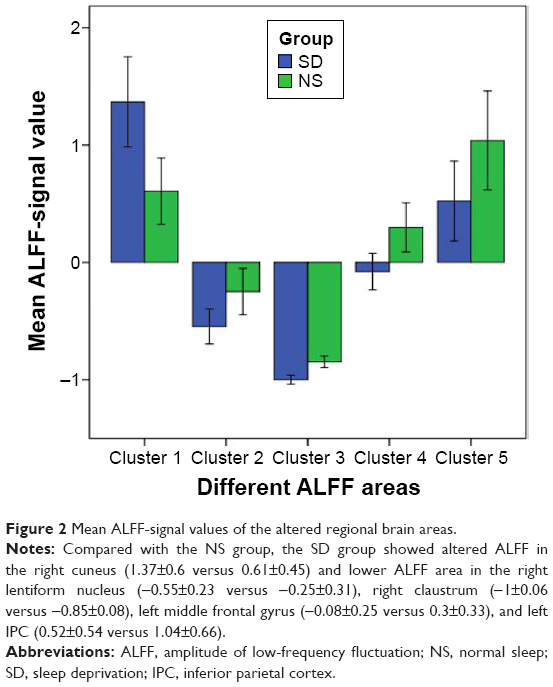 | Figure 2 Mean ALFF-signal values of the altered regional brain areas. |
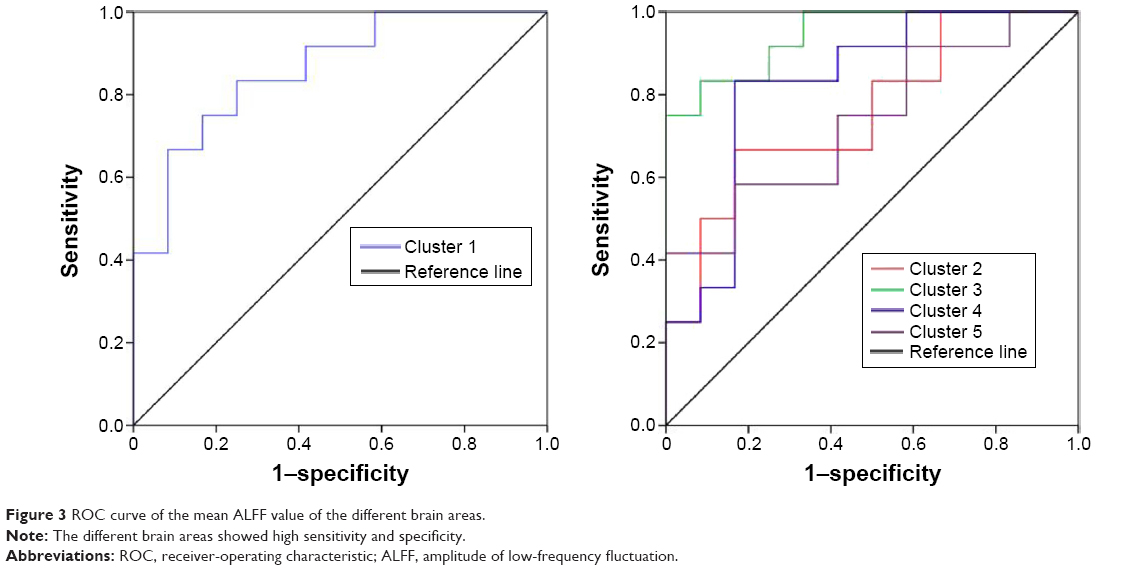 | Figure 3 ROC curve of the mean ALFF value of the different brain areas. |
Brain–behavior correlation results
In the SD group, the mean ALFF value of the right claustrum showed a significant positive correlation with accuracy rate (r=0.687, P=0.013) and a negative correlation with lapse rate (r=−0.706, P=0.01). The mean ALFF value of the middle frontal gyrus showed a significant positive correlation with response time (r=0.675, P=0.016).
Discussion
In this study, our results confirmed functional alterations in resting-state networks after SD. Compared with the NS subjects, the SD subjects showed higher ALFF areas in the right visual network and lower ALFF areas in the right lentiform nucleus, right claustrum, left dorsolateral prefrontal cortex (DLPFC), and left IPC. ALFF differences in regional brain areas showed high sensitivity and specificity. The reliability of the ALFF differences revealed that the different ALFF areas could serve as markers to distinguish the SD condition from the NS condition. Our findings may suggest that SD is associated with the model of excitation–inhibition imbalance in the central nervous system.
Previous studies have demonstrated that hyperarousal reactivation in the occipital gyrus was found in SD subjects and patients with insomnia.1,28 These findings supported our results that the SD group showed higher ALFF area in the right cuneus compared with the NS group. The vision-related regions were not only activated by real vision but also by visual mental imagery,35,36 since the visual cortex is relevant to emotional activities and emotional changes can lead to higher blood oxygen level-dependent signal regions in the visual cortex.37,38 The higher activity in the visual cortex may represent a compensatory reaction to recover the emotional changes.
Among the spontaneously synchronized neuronal networks, the “task-negative” network and its “task-positive” anticorrelated network (ACN) have received the most attention.19 The task-negative network was the default-mode network (DMN). The IPC region, one key region of the DMN, is obligatorily or unintentionally engaged in the recall, consolidation, and retrieval of episodic memory information,39–41 as well as being implicated in diverse cognitive operations42 that include bodily awareness,43 generating a sense of personal responsibility44 and moral decision making.45 Chee and Chuah found that SD reduced the IPC deactivation during a visual short-term memory task.46 Horovitz et al revealed a decreased functional connectivity between the IPC and the medial PFC during deep sleep and after partial SD.47,48 Nie et al found that patients with chronic insomnia demonstrated significantly decreased functional connectivity between the left medial temporal lobe and the left IPC compared with good sleepers.49 De Havas et al also found that the IPC node of the DMN was consistently impaired and might represent an early marker for the effects of 24-hour SD, as well as serving as an indicator of hitherto-unexplored behavioral impairments.50 Our results were in accordance with these findings. The DLPFC, one region of the ACN, recruits working-memory tasks, and has been implicated to be responsible for failure in working memory for the sleep-deprived brain.51–54 It is well known that sleep plays an important role in the formation and consolidation of memories.55 Patients with insomnia show significant reduction in gray-matter concentrations and lower regional homogeneity in the DLPFC.28,56 One recent SD study reported a reduced anticorrelation between the DMN and ACN nodes at both task-related and resting states.50 In support of these findings, in the present study we found that the SD subjects showed lower ALFF in the DMN and ACN nodes compared with NS subjects; furthermore, the mean ALFF value of the ACN node showed a significant positive correlation with response time (r=0.675, P=0.016). These findings may represent a decline in attention and memory processes by SD.
The lentiform nucleus and claustrum are associated with advanced cognitive function and involved in aberrant regional brain activity in patients with obstructive sleep apnea.57 In the SD group, the mean ALFF value of the right claustrum showed a significant positive correlation with accuracy rate (r=0.687, P=0.013) and a negative correlation with lapse rate (r=−0.706, P=0.01). SD decreased the regional brain activity in several brain areas thus needs to attempt to recruit more specific advanced cognitive function brain areas to sustain alertness and accomplish cognitive performance. In this study, SD showed a continuing decline in the DMN–ACN activity, therefore, the lentiform nucleus and claustrum were recruited to sustain alertness and accomplish cognitive performance.
Conclusion
In this study, our results confirmed that SD demonstrated a compensatory reaction in the visual network and disturbed spontaneous neuronal activity in advanced cognitive function brain areas and the DMN–ACN compared with NS. The mean ALFF-signal values of the different brain areas showed high sensitivity and specificity. Our findings provide insights into the pathophysiological mechanism of SD, and may be helpful for understanding the pathophysiology of SD.
Disclosure
The authors report no conflicts of interest in this work.
References
Dai XJ, Gong HH, Wang YX, et al. Gender differences in brain regional homogeneity of healthy subjects after normal sleep and after sleep deprivation: a resting-state fMRI study. Sleep Med. 2012;13:720–727. | ||
Drummond SP, Brown GG. The effects of total sleep deprivation on cerebral responses to cognitive performance. Neuropsychopharmacology. 2001;25:S68–S73. | ||
Jackson ML, Huqhes ME, Croft RJ, et al. The effect of sleep deprivation on BOLD activity elicited by a divided attention task. Brain Imaging Behav. 2011;5:97–108. | ||
Luber B, Stanford AD, Bulow P, et al. Remediation of sleep-deprivation-induced working memory impairment with fMRI-guided transcranial magnetic stimulation. Cereb Cortex. 2008;18:2077–2085. | ||
Nilsson JP, Söderström M, Karlsson AU, et al. Less effective executive functioning after one night’s sleep deprivation. J Sleep Res. 2005;14:1–6. | ||
Ohayon MM, Smolensky MH, Roth T. Consequences of shiftworking on sleep duration, sleepiness, and sleep attacks. Chronobiol Int. 2010;27:575–589. | ||
Tsigos C, Chrousos GP. Hypothalamic-pituitary-adrenal axis, neuroendocrine factors and stress. J Psychosom Res. 2002;53:865–871. | ||
Walker MP, Stickgold R. Sleep, memory and plasticity. Annu Rev Psychol. 2006;57:139–166. | ||
Basner M, Rao H, Goel N, Dinges DF. Sleep deprivation and neurobehavioral dynamics. Curr Opin Neurobiol. 2013;23:854–863. | ||
Goel N, Rao H, Durmer JS, Dinges DF. Neurocognitive consequences of sleep deprivation. Semin Neurol. 2009;29:320–339. | ||
Gao L, Zhang M, Gong H, et al. Differential activation patterns of FMRI in sleep-deprived brain: restoring effects of acupuncture. Evid Based Complement Alternat Med. 2014;2014:465760. | ||
De Havas JA, Parimal S, Soon CS, Chee MW. Sleep deprivation reduces default mode network connectivity and anti-correlation during rest and task performance. Neuroimage. 2012;59:1745–1751. | ||
Bosch OG, Rihm JS, Scheidegger M, et al. Sleep deprivation increases dorsal nexus connectivity to the dorsolateral prefrontal cortex in humans. Proc Natl Acad Sci U S A. 2013;110:19597–19602. | ||
Shao Y, Wang L, Ye E, et al. Decreased thalamocortical functional connectivity after 36 hours of total sleep deprivation: evidence from resting state FMRI. PLoS One. 2013;8:e78830. | ||
Dai XJ, Liu CL, Gong HH, et al. Long-term sleep deprivation decreases the default spontaneous activity and connectivity pattern in healthy male subjects: a resting-state fMRI study. Neuropsychiatr Dis Treat. 2015;11:761–772. | ||
Piantoni G, Cheung BL, Van Veen BD, et al. Disrupted directed connectivity along the cingulate cortex determines vigilance after sleep deprivation. Neuroimage. 2013;79:213–222. | ||
Yoo SS, Gujar N, Hu P, et al. The human emotional brain without sleep – a prefrontal amygdala disconnect. Curr Biol. 2007;17:R877–R878. | ||
Picchioni D, Duyn JH, Horovitz SG. Sleep and the functional connectome. Neuroimage. 2013;80:387–396. | ||
Gao L, Bai L, Zhang Y, et al. Frequency-dependent changes of local resting oscillations in sleep-deprived brain. PLoS One. 2015;10:e0120323. | ||
Simpson JR Jr, Snyder AZ, Gusnard DA, Raichle ME. Emotion-induced changes in human medial prefrontal cortex: I. During cognitive task performance. Proc Natl Acad Sci U S A. 2001;98:683–687. | ||
Mason MF, Norton MI, Van Horn JD, Wegner DM, Grafton ST, Macrae CN. Wandering minds: the default network and stimulus-independent thought. Science. 2007;315:393–395. | ||
Yan H, Zhang Y, Chen H, Wang Y, Liu Y. Altered effective connectivity of the default mode network in resting-state amnestic type mild cognitive impairment. J Int Neuropsychol Soc. 2013;19:400–409. | ||
Dai XJ, Min YJ, Gong HH, et al. [Evaluation of the post-effect of acupuncture at sanyinjiao (SP 6) under sleep deprivation by resting-state amplitude of low-frequency fluctuation: a fMRI study]. Zhongguo Zhen Jiu. 2012;32:47–52. Chinese. | ||
Horovitz SG, Fukunaga M, de Zwart JA, et al. Low frequency BOLD fluctuations during resting wakefulness and light sleep: a simultaneous EEG-fMRI study. Hum Brain Mapp. 2008;29:671–682. | ||
Li HJ, Dai XJ, Gong HH, Nie X, Zhang W, Peng DC. Aberrant spontaneous low-frequency brain activity in male patients with severe obstructive sleep apnea revealed by resting-state functional MRI. Neuropsychiatr Dis Treat. 2015;11:207–214. | ||
Dai XJ, Nie X, Liu XM, et al. Gender differences in regional brain activity in patients with chronic primary insomnia: evidence from a resting-state fMRI study. J Clin Sleep Med. 2016;12(3):363–374. | ||
Huang X, Zhong YL, Zeng XJ, et al. Disturbed spontaneous brain activity pattern in patients with primary angle-closure glaucoma using amplitude of low-frequency fluctuation: a fMRI study. Neuropsychiatr Dis Treat. 2015;11:1877–1883. | ||
Dai XJ, Peng DC, Gong HH, et al. Altered intrinsic regional brain spontaneous activity and subjective sleep quality in patients with chronic primary insomnia: a resting-state fMRI study. Neuropsychiatr Dis Treat. 2014;10:2163–2175. | ||
Fan J, McCandliss BD, Fossella J, Flombaum JI, Posner MI. The activation of attentional networks. Neuroimage. 2005;26:471–479. | ||
Fan J, McCandliss BD, Sommer T, Raz A, Posner MI. Testing the efficiency and independence of attentional networks. J Cogn Neurosci. 2002;14:340–347. | ||
Satterthwaite TD, Elliott MA, Gerraty RT, et al. An improved framework for confound regression and filtering for control of motion artifact in the preprocessing of resting-state functional connectivity data. Neuroimage. 2013;64:240–256. | ||
Yan CG, Cheung B, Kelly C, et al. A comprehensive assessment of regional variation in the impact of head micromovements on functional connectomics. Neuroimage. 2013;76:183–201. | ||
Zang YF, He Y, Zhu CZ, et al. Altered baseline brain activity in children with ADHD revealed by resting-state functional MRI. Brain Dev. 2007;29:83–91. | ||
El Khouli RH, Macura KJ, Barker PB, Habba MR, Jacobs MA, Bluemke DA. Relationship of temporal resolution to diagnostic performance for dynamic contrast enhanced MRI of the breast. J Magn Reson Imaging. 2009;30:999–1004. | ||
Thompson WL, Kosslyn SM, Sukel KE, Alpert NM. Mental imagery of high- and low-resolution gratings activates area 17. Neuroimage. 2001;14:454–464. | ||
Ishai A, Haxby JV, Ungerleider LG. Visual imagery of famous faces: effects of memory and attention revealed by fMRI. Neuroimage. 2002;17:1729–1741. | ||
Wang W, Li KC, Shan BC, et al. [Study of acupuncture point Liv 3 with functional MRI]. Zhonghua Fang She Xue Za Zhi. 2006;40:29–35. Chinese. | ||
Lang PJ, Bradley MM, Fitzsimmons JR, et al. Emotional arousal and activation of the visual cortex: an fMRI analysis. Psychophysiology. 1998;35:199–210. | ||
Gusnard DA, Raichle ME, Raichle ME. Searching for a baseline: functional imaging and the resting human brain. Nat Rev Neurosci. 2001;2:685–694. | ||
Foster DJ, Wilson MA. Reverse replay of behavioural sequences in hippocampal place cells during the awake state. Nature. 2006;440:680–683. | ||
Wig GS, Grafton ST, Demos KE, Wolford GL, Petersen SE, Kelley WM. Medial temporal lobe BOLD activity at rest predicts individual differences in memory ability in healthy young adults. Proc Natl Acad Sci U S A. 2008;105:18555–18560. | ||
Laird AR, Eickhoff SB, Li K, Robin DA, Glahn DC, Fox PT. Investigating the functional heterogeneity of the default mode network using coordinate-based meta-analytic modeling. J Neurosci. 2009;29:14496–14505. | ||
Felician O, Anton JL, Nazarian B, Roth M, Roll JP, Romaiguère P. Where is your shoulder? Neural correlates of localizing others’ body parts. Neuropsychologia. 2009;47:1909–1916. | ||
Schaich Borg J, Hynes C, Van Horn J, et al. Consequences, action, and intention as factors in moral judgments:an fMRI investigation. J Cogn Neurosci. 2006;18(5):803–817. | ||
Raine A, Yang Y. Neural foundations to moral reasoning and antisocial behavior. Soc Cogn Affect Neurosci. 2006;1:203–213. | ||
Chee MW, Chuah YM. Functional neuroimaging and behavioral correlates of capacity decline in visual short-term memory after sleep deprivation. Proc Natl Acad Sci U S A. 2007;104:9487–9492. | ||
Horovitz SG, Braun AR, Carr WS, et al. Decoupling of the brain’s default mode network during deep sleep. Proc Natl Acad Sci U S A. 2009;106:11376–11381. | ||
Sämann PG, Tully C, Spoormaker VI, et al. Increased sleep pressure reduces resting state functional connectivity. MAGMA. 2010;23:375–389. | ||
Nie X, Li HJ, Wan AL, et al. Functional connectivity of paired default mode network subregions in primary insomnia. Neuropsychiatr Dis Treat. 2015;11:3085–3093. | ||
De Havas JA, Parimal S, Soon CS, Chee MW. Sleep deprivation reduces default mode network connectivity and anti-correlation during rest and task performance. Neuroimage. 2012;59:1745–1751. | ||
Chuah YM, Venkatraman V, Dinges DF, Chee MW. The neural basis of interindividual variability in inhibitory efficiency after sleep deprivation. J Neurosci. 2006;26:7156–7162. | ||
Drummond SP, Bischoff-Grethe A, Dinges DF, Ayalon L, Mednick SC, Meloy MJ. The neural basis of the psychomotor vigilance task. Sleep. 2005;28:1059–1068. | ||
Lawrence NS, Ross TJ, Hoffmann R, Garavan H, Stein EA. Multiple neuronal networks mediate sustained attention. J Cogn Neurosci. 2003;15:1028–1038. | ||
Yamasaki H, LaBar KS, McCarthy G. Dissociable prefrontal brain systems for attention and emotion. Proc Natl Acad Sci U S A. 2002;99:11447–11451. | ||
Backhaus J, Junghanns K, Born J, Hohaus K, Faasch F, Hohagen F. Impaired declarative memory consolidation during sleep in patients with primary insomnia: influence of sleep architecture and nocturnal cortisol release. Biol Psychiatry. 2006;60:1324–1330. | ||
Joo EY, Noh HJ, Kim JS, et al. Brain gray matter deficits in patients with chronic primary insomnia. Sleep. 2013;36:999–1007. | ||
Peng DC, Dai XJ, Gong HH, Li HJ, Nie X, Zhang W. Altered intrinsic regional brain activity in male patients with severe obstructive sleep apnea: a resting-state fMRI study. Neuropsychiatr Dis Treat. 2014;10:1819–1826. |
 © 2016 The Author(s). This work is published and licensed by Dove Medical Press Limited. The
full terms of this license are available at https://www.dovepress.com/terms
and incorporate the Creative Commons Attribution
- Non Commercial (unported, 3.0) License.
By accessing the work you hereby accept the Terms. Non-commercial uses of the work are permitted
without any further permission from Dove Medical Press Limited, provided the work is properly
attributed. For permission for commercial use of this work, please see paragraphs 4.2 and 5 of our Terms.
© 2016 The Author(s). This work is published and licensed by Dove Medical Press Limited. The
full terms of this license are available at https://www.dovepress.com/terms
and incorporate the Creative Commons Attribution
- Non Commercial (unported, 3.0) License.
By accessing the work you hereby accept the Terms. Non-commercial uses of the work are permitted
without any further permission from Dove Medical Press Limited, provided the work is properly
attributed. For permission for commercial use of this work, please see paragraphs 4.2 and 5 of our Terms.