Back to Journals » Diabetes, Metabolic Syndrome and Obesity » Volume 17
SIRT3 rs11246020 Polymorphism Associated Postprandial Triglyceride Dysmetabolism
Authors Yang L ![]() , Zhang Z, Zhen Y
, Zhang Z, Zhen Y ![]() , Feng J, Chen J
, Feng J, Chen J ![]() , Song G
, Song G
Received 15 December 2023
Accepted for publication 5 March 2024
Published 12 March 2024 Volume 2024:17 Pages 1279—1288
DOI https://doi.org/10.2147/DMSO.S450962
Checked for plagiarism Yes
Review by Single anonymous peer review
Peer reviewer comments 2
Editor who approved publication: Dr Konstantinos Tziomalos
Liqun Yang,1– 3 Zhimei Zhang,3 Yunfeng Zhen,3 Jing Feng,3 Jinhu Chen,3 Guangyao Song1– 3
1Department of Internal Medicine, Hebei Medical University, Shijiazhuang, Hebei Province, People’s Republic of China; 2Hebei Key Laboratory of Metabolic Disease, Shijiazhuang, Hebei Province, People’s Republic of China; 3Department of Endocrinology, Hebei General Hospital, Shijiazhuang, Hebei Province, People’s Republic of China
Correspondence: Guangyao Song, Department of Internal Medicine, Hebei Medical University, Shijiazhuang, Hebei Province, People’s Republic of China, Tel +86-0311-8598-8556, Email [email protected]
Purpose: Energy metabolism is regulated by SIRT3, no research has been done on the connection between lipid metabolism in the oral fat test and SIRT3 polymorphism. Thus, we conducted a case-control study to investigate the connection between postprandial lipid and SIRT3 polymorphism.
Patients and Methods: 402 non-obese Chinese subjects were enrolled and their postprandial lipid response to oral fat tolerance test (OFTT) was observed to understand the relationship between rs11246020 gene and postprandial triglyceride metabolism.
Results: In a binary logic regression model, a protective effect of the T allele of the rs11246020 SIRT3 for postprandial hypertriglyceridemia was shown (OR=0.417, 95% CI = 0.219– 0.794, p=0.008). Compared to the CC genotype, individuals with the TT+CT variant of the rs11246020 SIRT3 gene demonstrated significantly lower levels of homeostasis model assessment of insulin resistance (HOMA-IR) (p=0.04), postprandial plasma glucose (PPG) (p=0.037), fasting plasma glucose (FPG) (p=0.02), and 4-hour triglyceridemia (Tg) (p=0.032).
Conclusion: The C allele of rs11246020 SIRT3 gene may be a risk factor to increased possibility of postprandial triglyceridemia after an oral fat test, which involved in the mechanism of glucose and insulin metabolism.
Keywords: sirtuin, postprandial hypertriglyceridemia, insulin resistance, genetics
Introduction
Fasting blood lipids were the only basis for all prior research on the link between blood lipids and cardiovascular disease and arteriosclerosis. They are the primary focus of most recent lipid recommendations and expert agreements because of their diagnostic and therapeutic utility. Nevertheless, dietary factors, particularly triglycerides, have a significant impact on blood lipids. Since fasting does not last for most of the day, postprandial lipids might be a more accurate indicator of fat metabolism.
Postprandial dyslipidemia is now considered as a separate risk factor for atherosclerosis and diabetes, which can be attributed to the increasing attention paid to postprandial dyslipidemia.1,2 Low insulin sensitivity and reduced β-cell activity were also seen in individuals with regular fasting TG values but elevated after meals, according to our earlier research.3 Thus, postprandial TG detection may aid in the early diagnosis of β-cell dysfunction and insulin resistance.3
SIRTs are a kind of protein deacetylases that were first identified in yeast and shown to have the ability to increase longevity. Subsequent investigations have shown the presence of SIRTs in animals, which are linked to lifespan, aging, metabolism, and other illnesses.4–6 Currently, a total of seven SIRT species have been discovered and designated as SIRT1-7. SIRT1, the extensively researched sirtuin, is present in both the nucleus and cytoplasm. It has a role in regulating transcription factors and histone deacetylation, including p53, nuclear factor nf-κb (NF-κB), forkhead box protein O (FOXOs), and peroxisome proliferator-activated receptor-γ coactivator 1-α (PGC-1α). SIRT2 is an intracytoplasmic sirtuin, which is an enzyme involved in cellular energy sensing. It relies on NAD+ to carry out its enzymatic activity and is known for its anti-aging properties. Hence, their activity is intricately linked to metabolism.7,8 The protein deacetylase SIRT3, located in the mitochondria, plays a crucial role in regulating several essential functions of mitochondria, such as food oxidation, adenosine triphosphate (ATP) production, detoxification of reactive oxygen species, and maintenance of mitochondrial dynamics.9–13
Mounting data indicates that mitochondrial dysfunction contributes to the development of metabolic syndrome and diabetes.14 The dysregulation of many mitochondrial mechanisms has been linked to the development of metabolic diseases, such as poor fatty acid oxidation,15 oxidative damage caused by reactive oxygen species (ROS),16 inflammation,17 and a decrease in metabolic flexibility.14,18 In older individuals, there is a connection between high levels of insulin and glucose in the blood and a decline in mitochondrial function,19 suggesting a strong relationship between impaired mitochondrial activity and the metabolism of glucose.
SIRT3 KO mice livers exhibit an accumulation of long-chain acylcarnitine compounds and experience a decline in fatty acid oxidation.12 A separate study demonstrated that the levels and function of liver SIRT3 were reduced in mice subjected to a long-term high-fat diet, leading to an increase in protein acetylation and the development of fatty liver disease.20–22
Insulin resistance (IR), impaired glucose tolerance, weight gain, and other metabolic syndrome characteristics developed more quickly in SIRT3 KO mice given an high-fat diet(HFD).21 Therefore, SIRT3 has a crucial function in several essential pathways related to the overall balance of energy in the body.
SIRT3 deficient mice, when subjected to a high cholesterol diet, exhibited increased weight gain while maintaining similar glucose tolerance levels as wild-type mice.23 A research conducted on SIRT3 mutant mice given an HFD revealed a rise in fatty acid oxidation. This suggests that SIRT3 might potentially prevent insulin resistance in high-calorie situations by reducing fatty acid oxidation.24 SIRT3-deficient animals exposed to an HFD exhibit elevated levels of lipids in the blood, suggesting that SIRT3 plays a crucial role in regulating lipid balance.12
SIRT3 rs11246020 SNPs have been linked to the metabolic syndrome in two human investigations, indicating a potential function for SIRT3 in the condition in humans.21,25
Given the lack of genetic data assessing SIRT-3 as risk modulators for lipid metabolism and the evidence that suggests certain sirtuin family members may be involved in maintaining healthy lipid levels, we set out to investigate the relationship between the polymorphism of SIRT3 rs11246020 and postprandial triglyceride in a Chinese population.
Subjects and Methods
Study Subjects
All participants were recruited at Hebei Provincial People’s Hospital between May 2018 and August 2019. The research was a case-control investigation including 402 Chinese individuals aged 20–60 years who were not obesity. Oral glucose tolerance test and oral fat tolerance test were administered to all individuals.
All subjects provided written informed permission, and the research followed all protocols authorized by the Hebei General Hospital ethics committee. The study complied with the principles of the Declaration of Helsinki.
The subject inclusion criteria: 1) all participants were aged between 20 years and 60 years; 2) all participants had a body mass index (BMI) <28 kg/m2, according to the diagnostic criteria of non-obesity in China. 3) all participants were Han Chinese.
Registration for the study is available at http://www.chictr.org.cn/index.aspx as it was obtained on November 15, 2018, and the registration code for the study is Chi CTR1800019514.
Exclusion Criteria
Excluded from the study were subjects suffering from any chronic illness, including chronic diarrhea, Cushing’s syndrome, hypothyroidism, kidney/liver disease, coronary heart disease, obstructive biliary disease, pancreatic diseases, inherited lipoprotein metabolism disorders, hyperlipidemia, and individuals who had trauma, infectious procedures, or undergone significant surgery.
Oral Fat Tolerance Testing
A current description of the OFTT protocol has been provided.26 Volunteers must adhere to a regular diet for a minimum of one week prior to OFTT. The trial meal used in this investigation was formulated according to the Chinese Dietary Guidelines Pagoda. 15% protein, 20% carbs, and 60% fat make up a high-fat meal’s 1500 kcal total energy content. After fasting for 10 hours, fasting blood samples of the subjects were collected, and within 10 minutes of the sample collection, they had a high-fat lunch. Two, four, six, eight, and ten hours following a high-fat diet, centrifuged plasma was obtained and preserved at −80 °C using a Haier MDR-382E centrifuge from Qingdao, China. Throughout these ten hours, participants are permitted to consume a limited quantity of water but are prohibited from eating, engaging in physical activity, or smoking. The process for patient selection is shown in Figure 1.
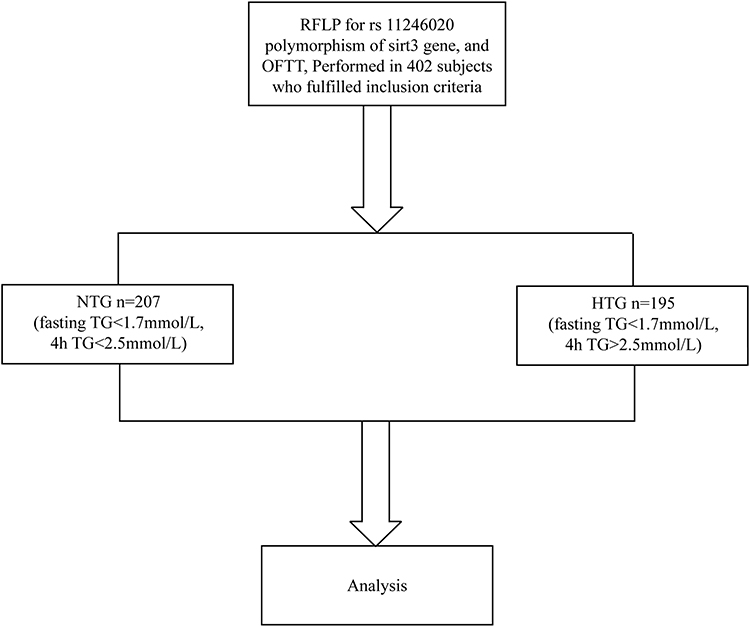 |
Figure 1 Flow chart of study. |
Anthropometric and Biochemical Measurements
The demographic data of the volunteers were gathered by proficient experts. There was information about the subjects’ ages, sexes, body mass indexes, systolic and diastolic blood pressures. After a fasting period of 8–12 hours, blood samples were taken from each volunteer’s veins to test for various enzymes and hormones, including thyroid stimulating hormone (TSH), total triiodo thyronine (TT3), total thyroid hormone (TT4), gamma-glutamyl transferase (γ-GT), uric acid (UA), low and high-density lipoprotein-cholesterol (LDL-C and HDL-C), triglyceride (TG), aspartate and alanine transaminases (AST and ALT), and fasting insulin (FINS). At 2, 4, 6, 8, and 10 hours after meal and during fasting, a biochemical analyzer (Hitachi 7600; Hitachi, Tokyo, Japan) measured the total cholesterol (TC) levels. A chemiluminescence method (Cosbas E601; Roche, Basel, Switzerland) measured the plasma insulin levels.The body mass index (BMI) was computed by dividing the body mass by the square of the height (kg/m2). The HOMA-IR(Homeostatic Model Assessment of Insulin Resistance) index was determined by dividing the product of insulin (μU/mL) and glucose (μmol/L) concentrations by 22.5 (HOMA-IR = FPG ((mmol/L) × FINS (m IU/L)/22.5). The trapezoidal approach was utilized for computing the areas under the curves for TG (TgAUC).
Genotyping and Sampling of Blood
Genomic DNA kits (GENE ray Biotechnology, Shanghai, China) were utilized to extract genomic DNA from the peripheral blood leukocytes. The SIRT3 C/T polymorphism identification was approached via the ligase detection reaction (LDR). The design of SIRT3 primers was based on the NC_000006 (NC_000006) GenBank reference sequence. An ABI 3730 genetic analyzer-based DNA sequencing manufactured by Applied Biosystems in the United States was utilized to investigate patient genotyping. The amplification primers were created using Primer Premier 5.0 software (Premier Biosoft Intl., CA USA) according to the following specifications: The sequence 5’- CGATGTTCTGCGTGTAGA −3’ (forward) and 5’- CTCCCATTCTTCTTTCACAAC −3’ (reverse) was provided and the Tm was 55°C. The PCR reaction system consisted of the following components: The experimental setup involved 10 umol of each primer and 30 ng of DNA in a 2 PCR mix obtained from Yisheng Biotechnology in Shanghai, China. The mixture was then diluted with distilled H2O to a final volume of 5.9 ul. A substantial quantity of the PCR mixture was prepared and distributed into 96-well PCR plates. The plates were then spun using centrifugation. The mixture was then subjected to the following amplification conditions: an initial denaturation for 5 minutes at 95 °C, followed by 35 cycles of denaturation at 94 °C for 20 seconds, annealing at 55 °C for 20 seconds, and extension at 72 °C for 40 seconds. Finally, there was a final extension at 72 °C for 10 minutes. In the LDR connection reaction, the probe (GENE ray Biotechnology, Shanghai, China) was introduced into each PCR reaction well, thoroughly mixed, subjected to centrifugation, and amplified for 30 cycles at 94°C for 20 seconds and 58°C for 90 seconds. 1 ul of the product was combined with 9 ul of highly purified formamide. The mixture was then heated to 95 °C for 3 minutes, rapidly cooled in an ice bath, and subsequently sequenced using the Gene Marker V2.2.0 software (PA, USA).
Statistical Analysis
For continuous variables, Shapiro–Wilk test is used to test normality. Data with normal distribution is represented by mean ± standard deviation, and data with non-normal distribution is expressed as a median value (P25, P75). The clinical features of both cohorts were compared using an unpaired t-test, which was applied to two groups in total. The Chi-square test was used to compare the polymorphic form distributions among the groups. Applying the Mann–Whitney test, we compared the groups’ gene expression levels. The relationship between the variables was determined using Spearman correlation. The relationship between gene polymorphism and postprandial triglyceride was analyzed by binary Logistic regression analysis. A two-tailed distribution of P < 0.05 was considered to indicate statistical significance. The SPSS 26.0 statistical package was employed for the study.
Results
The oral fat test was administered to all 402 participants in the study, who had a BMI below 28 kg/m2. The participants’ ages averaged 43.67 ± 13.30 years, with 213 males. The subjects were separated into two groups according to their fasting and postprandial triglyceride levels. Triglycerides were normal in one group (NTG; n = 207; fasting TG < 1.7 mmol/L, 4-hour TG < 2.5 mmol/L). According to the expert panel’s statement,27 the other group is the one with elevated postprandial triglycerides (HTG) (n=195; fasting TG<1.7 mmol/L, 4hTG>2.5 mmol/L).
Table 1 presents the overall clinical features of two groups of individuals.The levels of SBP, DBP, ALT, AST, γ-GT, TC, HDL-C, FPG, FINS, HOMA-IR, and UA were remarkably elevated compared to the NTG group (p<0.05).
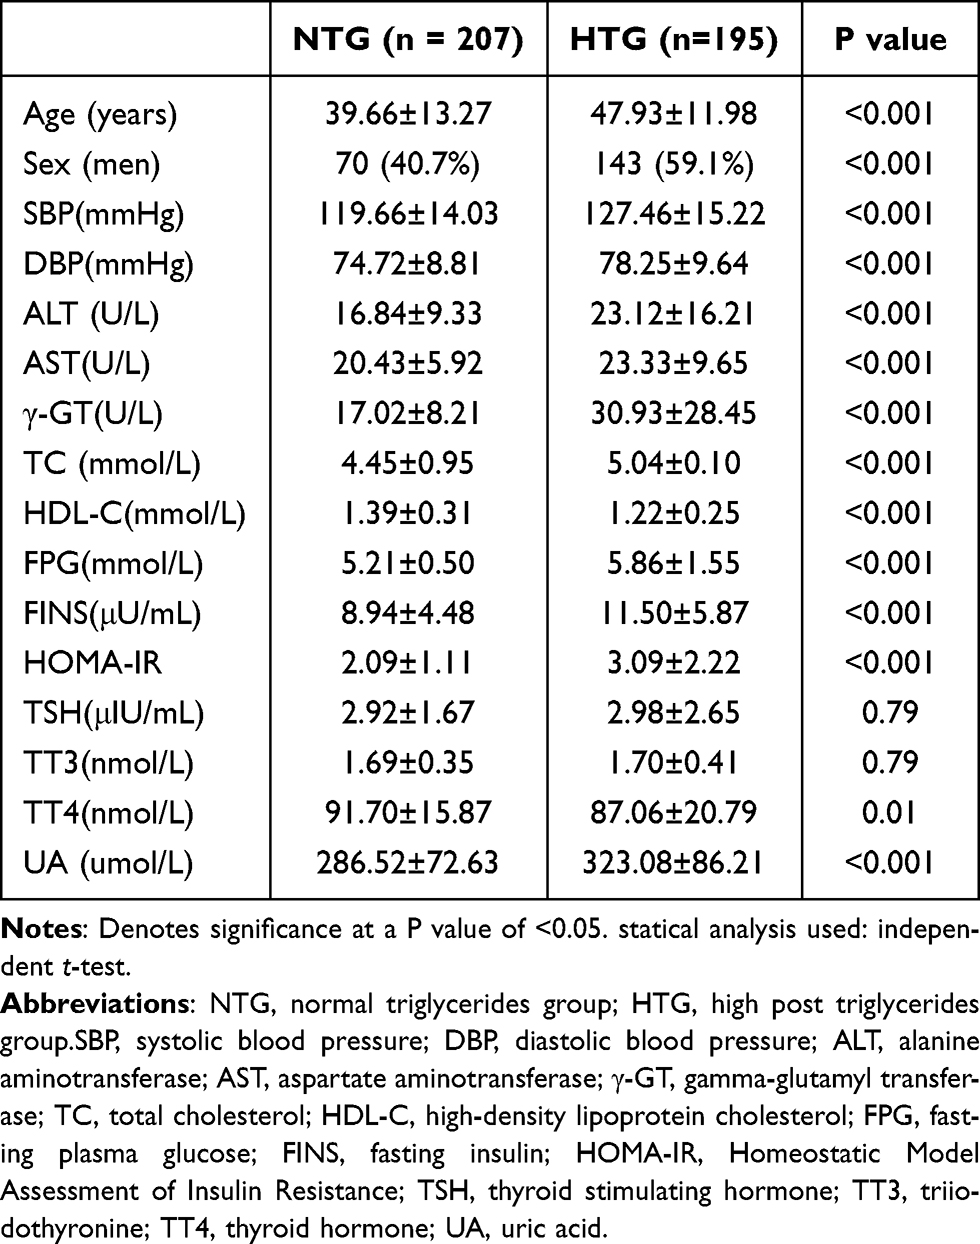 |
Table 1 Clinical and Biochemical Parameters of the Study Groups |
The study found that the frequency of the T allele of the rs11246020 polymorphism in the SIRT3 gene was considerably lower in individuals with HTG at 5.9%, compared to individuals with NTG at 11.4%. The study found a significant correlation between the T allele and normal triglyceride levels (OR=0.489(0.291–0.823) p=0.006) (Table 2).
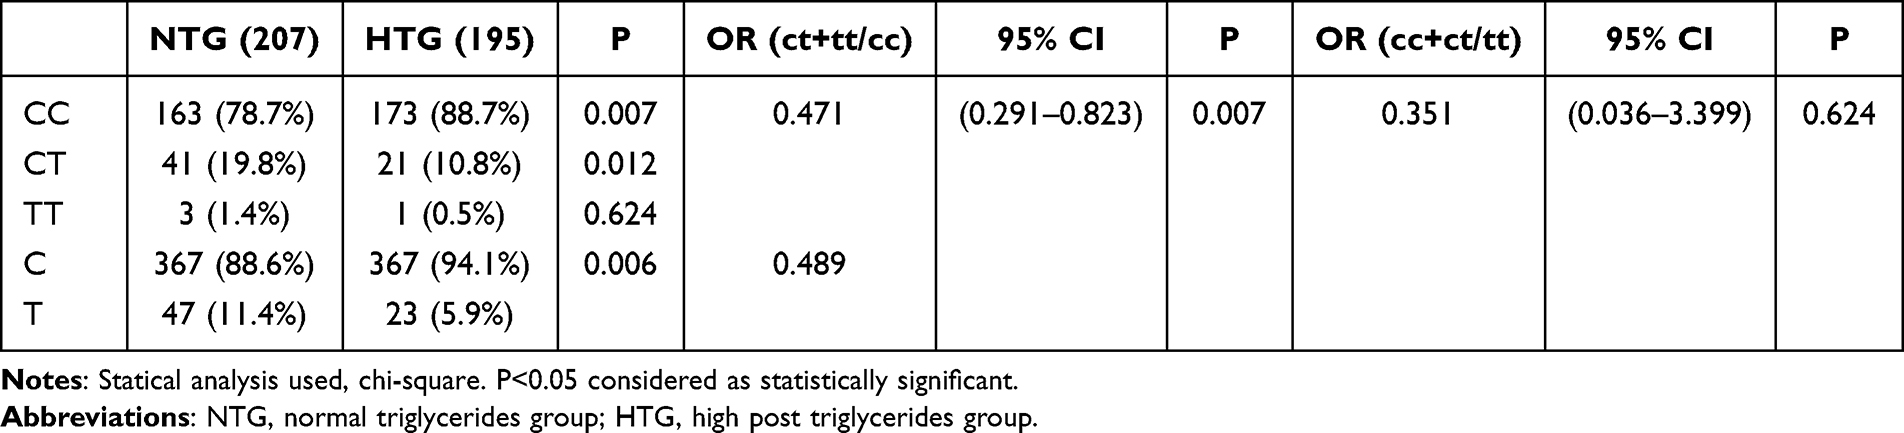 |
Table 2 Genotypic and Allelic Frequencies and Estimates of Relative Risks for the rs11246020 Polymorphic Form of SIRT3 Gene in Oral Fat Tolerance Groups |
Our research confirmed that the genotypic distribution follows the Hardy-Weinberg model.
An oral fat test was conducted for 10 hours on 402 patients. Lipid samples were obtained at 2-hour intervals for 10 hours following the oral fat test. Levels of postprandial triglycerides (PPTg) and glycaemic parameters were examined between individuals with the CC genotype and CT+TT genotype of the rs11246020 polymorphism form of the SIRT3 gene. The study discovered that individuals with TT+CT genotypes (T allele) of the rs11246020 polymorphic form of the SIRT3 gene had remarkably more diminished levels of Tg 4h and Tg 10 h, and Tg 10h AUC (p=0.032, 0.009, and 0.018, respectively). Additionally, Table 3 demonstrates that they exhibited lower levels of fasting plasma glucose (p=0.02), postprandial plasma glucose (p=0.037), and HOMA-IR (p=0.04) than the CC genotype group.
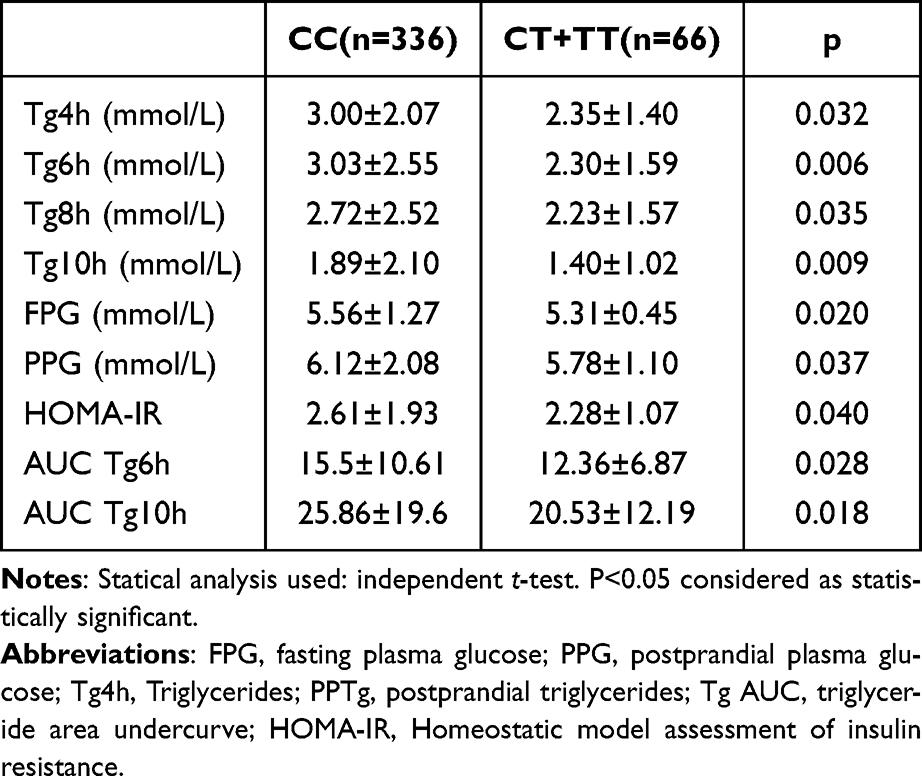 |
Table 3 Comparison of Postprandial Triglyceride, Glycaemic and Insulin Resistance Parameters Between Risk and Wild Type Genotypes of rs11246020 Polymorphic Form of SIRT3 Gene in All the Subjects |
In binary logic regression analysis, the CT+TT genotype of rs11246020 remained protect factor of high postprandial hypertriglyceridemia relative to the CC genotype category (OR=0.417, p=0.008) after adjustment for age, gender, BMI, TC, HOMA-IR, FPG and FINS(Table 4).
 |
Table 4 Binary Logic Regression Analysis of Study Participants with Age, Sex, BMI, TC, HOMA-IR, FPG and FINS as Variables in the Model |
Figure 2 shows that there was a significant positive correlation of Tg AUC 10h with HOMA-IR (r=0.294, p<0.001) FPG (r=0.330, p<0.001) and PPG (r=0.371, p<0.001) in C genotype subjects but not in subjects with T genotype; In T genotype subjects Tg AUC 10h was also associated with HOMA-IR (r=0.316, p=0.01).
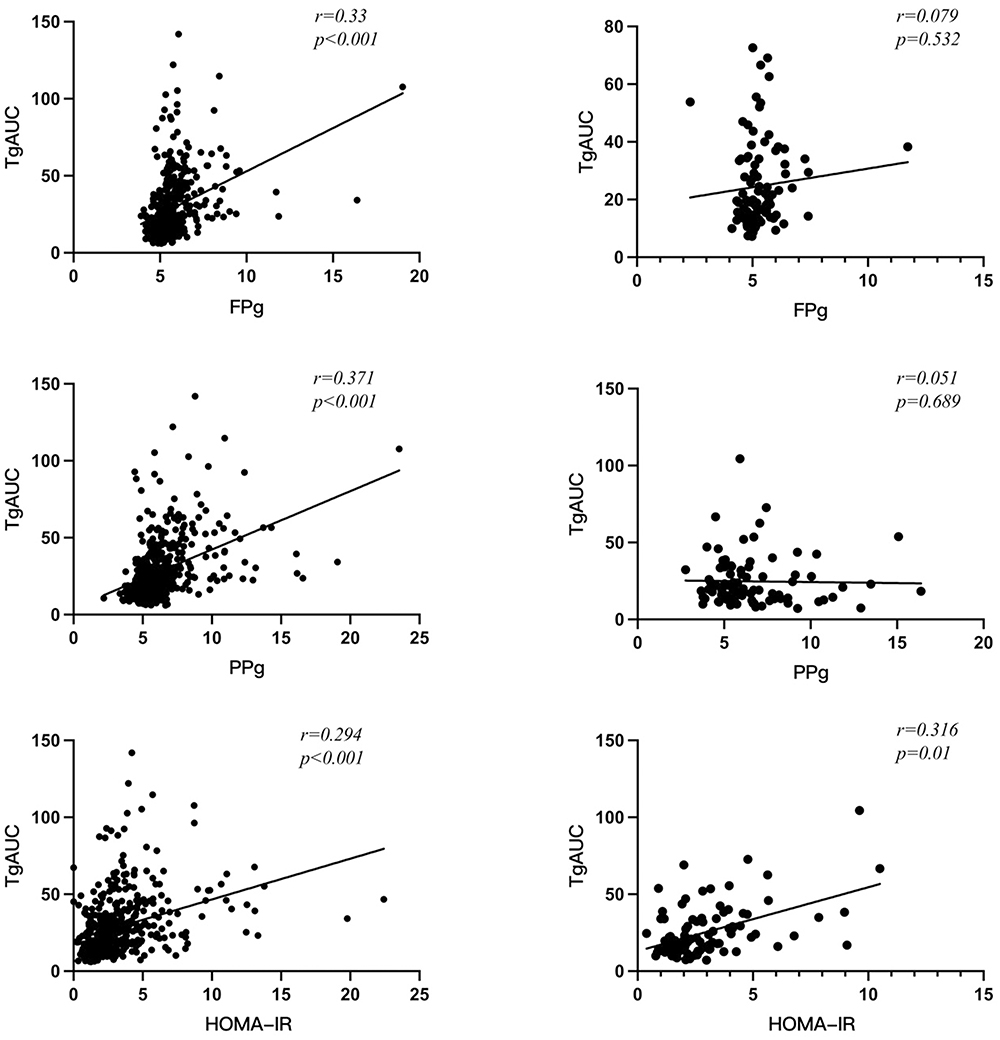 |
Figure 2 Correlation of C and T genotypes of rs11246020 polymorphic form of SIRT3 gene with Tg10h AUC, glycaemic and insulin resistance parameters. Abbreviation: FPg, fasting plasma glucose; PPg, postprandial plasma glucose; Tg AUC, triglyceride area under curve; HOMA-IR, Homeostatic model assessment of insulin resistance;statical analysis used: Pearson correlation. P<0.05 considered as statistically significant. |
Discussion
In our current study, we have discovered a noteworthy correlation between the SIRT3 rs11246020 polymorphisms and the likelihood of developing postprandial hypertriglyceridemia. The presence of the C allele might substantially elevate the risk of hypertriglyceridemia in the non-obese Chinese population. This is the first research that we are aware of that examines the relationship between postprandial hypertriglyceridemia and the SIRT3 rs11246020 polymorphism.
The single sirtuin with strong deacetylase function within mitochondria is called sirtuin3, and it plays a crucial role in maintaining lipid homeostasis, the redox state, and the epigenetic landscape in hepatocytes.10
Berberine activates SIRT3 to ameliorate nonalcoholic fatty liver produced by a high-fat diet in rats.28 The literature mentions the SIRT3 gene’s significance in influencing lipid metabolism, however, this is a poorly explored field.21,29
When we tested the oral fat tolerance of the non-obese participants, we found that those with postprandial hyperlipidemia had a much greater frequency of the C allele compared to those with normal postprandial hyperlipidemia. Furthermore, after a high-fat diet, the C allele is a risk factor for higher blood lipids. Lower postprandial TG at 4, 6, 8, and 10 hours was seen in the TT/CT genotype cohort with the rs11246020 polymorphism compared to the CC genotype.
Another observation is that the T allele had lower blood glucose levels throughout fasting and postprandial periods, and it also has a lower HOMA-IR than the C allele. These findings suggest that the presence of the C allele is correlated with an increased risk of both elevated blood glucose levels and insulin resistance.
Regarding the postprandial blood lipid investigation, we discovered that there is a correlation between the T allele TgAUC10h and HOMA-IR as well as between the C allele TgAUC10h and postprandial blood lipid, fasting blood glucose, and postprandial blood glucose. This finding provides more evidence of the strong relationship between postprandial triglyceride levels and insulin resistance and blood glucose. Since the age and gender of our recruited population did not match, a further regression analysis was conducted when studying the relationship between sirt3rs11246020 gene polymorphism and postprandial blood lipid. The regression analysis showed that after adjusting for interfering factors such as age and gender, C allele was still closely related to postprandial hyperlipidemia.
Prior research has demonstrated that animals with a SIRT3 gene deletion exhibit peripheral insulin resistance. As a result of reduced skeletal muscle hexokinase 2 (HK2) and pyruvate dehydrogenase (PDH) activity, enhanced FAO and decreased glucose absorption may be the underlying mechanism.13,30
Comparable research has revealed elevated ROS in the skeletal muscles of SIRT3 KO mice. This is linked to insulin resistance in a number of metabolically active tissues, such as the liver, white adipose tissue, and skeletal muscle.31–33 These studies have shown that SIRT3 is related to both lipid metabolism and blood glucose metabolism.
We examined postprandial lipids due to the fact that individuals spend the majority of the day in a condition of postprandial lipids, rather than in a fasting state. Numerous research have shown how important postprandial blood lipids are in relation to blood glucose, arteriosclerosis, and metabolic disorders.34,35 An additional study by Boren, J. et al proved that elevated triglycerides after food consumption are a risk factor for both diabetes and cardiovascular disease.36
Our prior research has additionally validated that postprandial TG levels are a distinct risk factor for compromised β-cell activity and insulin resistance.3 The relationship between postprandial triglyceride metabolism and the SIRT3 rs11246020 gene polymorphism was also established by our research. The TG levels after a meal were considerably greater in individuals with the C allele compared to those with the T allele. Hirschey et al found a correlation between the SIRT3 gene polymorphism and metabolic syndrome.21 Additionally, Zhang Shuang et al discovered that SIRT3 rs11246020 increases the likelihood of NAFLD.25 Currently, there are no studies documenting the correlation between genetic variation in SIRT3 and postprandial lipid levels.
Furthermore, we have shown that the SIRT3 rs11246020 gene polymorphism is linked to insulin resistance and blood glucose metabolism. Notably, those with the C allele exhibited considerably higher blood glucose levels compared to those with the T variant. Both the T and C alleles have been linked to HOMA-IR, suggesting a potential association between SIRT3 and blood glucose metabolism as well as insulin resistance, which should be investigated further.
Our study has certain limitations, When the recruited population was grouped according to postprandial blood lipids, age and gender were not matched, which may lead to bias. However, we corrected age and gender, and still confirmed the correlation of SIRT3 polymorphism on postprandial hypertriglyceridemia. The study population was limited to the Han Chinese population and may not be applicable to other ethnic groups. In addition, our study needs to be validated by prospective cohort studies.
Conclusion
The presence of polymorphism in the SIRT3 gene rs11246020 is strongly linked to postprandial hypertriglyceridemia, with allele C being identified as a risk factor for this condition. The SIRT3 gene is additionally linked to blood glucose levels and insulin resistance. In the future, we need to verify this conclusion in larger population studies.
Data Sharing Statement
Upon a reasonable request, individuals can obtain the datasets in this study directly from the corresponding author.
Study/Trial Registration and Ethics Statements
The study plan was entered into the China Clinical Trial Registry with the following number: Chi CTR1800019514, with the registration date being 15 November 2018. The research protocol was accepted by the Hebei General Hospital’s ethics committee on February 26, 2018, with approval number 2018 NO.2.
Informed Consent
Every volunteer provided informed consent.
Acknowledgments
For assisting in this study, the personnel of China’s Hebei Institute of Endocrinology and Metabolic Diseases are greatly appreciated by all authors.
Research funding from the Hebei Provincial Government was utilized to support this work.
Disclosure
The authors report no conflicts of interest in this work. No animal experiments were conducted in this study.
References
1. Tomlinson B, Chan P, Lam CWK. Postprandial hyperlipidemia as a risk factor in patients with type 2 diabetes. Expert Rev Endocrinol Metab. 2020;15(3):147–157. doi:10.1080/17446651.2020.1750949
2. Zhao Y, Liu L, Yang S, et al. Mechanisms of atherosclerosis induced by postprandial lipemia. Front Cardiovasc Med. 2021;8:636947. doi:10.3389/fcvm.2021.636947
3. Liu L, Hou X, Song A, et al. Oral fat tolerance testing identifies abnormal pancreatic β-cell function and insulin resistance in individuals with normal glucose tolerance. J Diabetes Investig. 2022;13(11):1805–1813. doi:10.1111/jdi.13867
4. Bonkowski MS, Sinclair DA. Slowing ageing by design: the rise of NAD(+) and sirtuin-activating compounds. Nat Rev Mol Cell Biol. 2016;17(11):679–690. doi:10.1038/nrm.2016.93
5. Haigis MC, Sinclair DA. Mammalian sirtuins: biological insights and disease relevance. Annu Rev Pathol. 2010;5:253–295. doi:10.1146/annurev.pathol.4.110807.092250
6. Imai S, Guarente L. NAD+ and sirtuins in aging and disease. Trends Cell Biol. 2014;24(8):464–471. doi:10.1016/j.tcb.2014.04.002
7. Mouchiroud L, Houtkooper Riekelt H, Moullan N, et al. The NAD+/sirtuin pathway modulates longevity through activation of mitochondrial UPR and FOXO signaling. Cell. 2013;154(2):430–441. doi:10.1016/j.cell.2013.06.016
8. Rajamohan SB, Pillai VB, Gupta M, et al. SIRT1 promotes cell survival under stress by deacetylation-dependent deactivation of poly(ADP-ribose) polymerase 1. Mol Cell Biol. 2009;29(15):4116–4129. doi:10.1128/MCB.00121-09
9. Jacobs KM, Pennington JD, Bisht KS, et al. SIRT3 interacts with the daf-16 homolog FOXO3a in the mitochondria, as well as increases FOXO3a dependent gene expression. Int J Biol Sci. 2008;4(5):291–299. doi:10.7150/ijbs.4.291
10. Ahn BH, Kim HS, Song S, et al. A role for the mitochondrial deacetylase Sirt3 in regulating energy homeostasis. Proc Natl Acad Sci U S A. 2008;105(38):14447–14452. doi:10.1073/pnas.0803790105
11. Samant SA, Zhang HJ, Hong Z, et al. SIRT3 deacetylates and activates OPA1 to regulate mitochondrial dynamics during stress. Mol Cell Biol. 2014;34(5):807–819. doi:10.1128/MCB.01483-13
12. Hirschey MD, Shimazu T, Goetzman E, et al. SIRT3 regulates mitochondrial fatty-acid oxidation by reversible enzyme deacetylation. Nature. 2010;464(7285):121–125. doi:10.1038/nature08778
13. Jing E, O’Neill BT, Rardin MJ, et al. Sirt3 regulates metabolic flexibility of skeletal muscle through reversible enzymatic deacetylation. Diabetes. 2013;62(10):3404–3417. doi:10.2337/db12-1650
14. Gao AW, Canto C, Houtkooper RH. Mitochondrial response to nutrient availability and its role in metabolic disease. EMBO Mol Med. 2014;6(5):580–589. doi:10.1002/emmm.201303782
15. Ji H, Friedman MI. Reduced capacity for fatty acid oxidation in rats with inherited susceptibility to diet-induced obesity. Metabolism. 2007;56(8):1124–1130. doi:10.1016/j.metabol.2007.04.006
16. Bonomini F, Rodella LF, Rezzani R. Metabolic syndrome, aging and involvement of oxidative stress. Aging Dis. 2015;6(2):109–120. doi:10.14336/AD.2014.0305
17. Hotamisligil GS. Inflammation and metabolic disorders. Nature. 2006;444(7121):860–867. doi:10.1038/nature05485
18. Andreux PA, Houtkooper RH, Auwerx J. Pharmacological approaches to restore mitochondrial function. Nat Rev Drug Discov. 2013;12(6):465–483. doi:10.1038/nrd4023
19. Petersen KF, Befroy D, Dufour S, et al. Mitochondrial dysfunction in the elderly: possible role in insulin resistance. Science. 2003;300(5622):1140–1142. doi:10.1126/science.1082889
20. Bao J, Scott I, Lu Z, et al. SIRT3 is regulated by nutrient excess and modulates hepatic susceptibility to lipotoxicity. Free Radic Biol Med. 2010;49(7):1230–1237. doi:10.1016/j.freeradbiomed.2010.07.009
21. Hirschey MD, Shimazu T, Jing E, et al. SIRT3 deficiency and mitochondrial protein hyperacetylation accelerate the development of the metabolic syndrome. Mol Cell. 2011;44(2):177–190. doi:10.1016/j.molcel.2011.07.019
22. Kendrick AA, Choudhury M, Rahman SM, et al. Fatty liver is associated with reduced SIRT3 activity and mitochondrial protein hyperacetylation. Biochem J. 2011;433(3):505–514. doi:10.1042/BJ20100791
23. Winnik S, Gaul DS, Preitner F, et al. Deletion of Sirt3 does not affect atherosclerosis but accelerates weight gain and impairs rapid metabolic adaptation in LDL receptor knockout mice: implications for cardiovascular risk factor development. Basic Res Cardiol. 2014;109(1):399. doi:10.1007/s00395-013-0399-0
24. Alrob OA, Sankaralingam S, Ma C, et al. Obesity-induced lysine acetylation increases cardiac fatty acid oxidation and impairs insulin signalling. Cardiovasc Res. 2014;103(4):485–497. doi:10.1093/cvr/cvu156
25. Zhang S, Zhu, X, Lu, X. Association of SIRT3 gene variation with risk of non-alcoholic fatty liver disease and functional study of the gene in a mouse model. J Third Milit Med Univ. 2017;39(8):737–742. doi:10.16016/j.1000-5404.201611187
26. Hou X, Guan Y, Tang Y, et al. A correlation study of the relationships between nonalcoholic fatty liver disease and serum triglyceride concentration after an oral fat tolerance test. Lipids Health Dis. 2021;20(1):54. doi:10.1186/s12944-021-01483-z
27. Kolovou GD, Mikhailidis DP, Kovar J, et al. Assessment and clinical relevance of non-fasting and postprandial triglycerides: an expert panel statement. Curr Vasc Pharmacol. 2011;9(3):258–270. doi:10.2174/157016111795495549
28. Xu X, Zhu X-P, Bai J-Y, et al. Berberine alleviates nonalcoholic fatty liver induced by a high-fat diet in mice by activating SIRT3. FASEB J. 2019;33(6):7289–7300. doi:10.1096/fj.201802316R
29. Li Y, Liang J, Tian X, et al. Intermittent fasting promotes adipocyte mitochondrial fusion through Sirt3-mediated deacetylation of Mdh2. Br J Nutr. 2023;130(9):1473–1486. doi:10.1017/S000711452300048X
30. Lantier L, Williams AS, Williams IM, et al. SIRT3 is crucial for maintaining skeletal muscle insulin action and protects against severe insulin resistance in high-fat–fed mice. Diabetes. 2015;64(9):3081–3092. doi:10.2337/db14-1810
31. Jing E, Emanuelli B, Hirschey MD, et al. Sirtuin-3 (Sirt3) regulates skeletal muscle metabolism and insulin signaling via altered mitochondrial oxidation and reactive oxygen species production. Proc Natl Acad Sci U S A. 2011;108(35):14608–14613. doi:10.1073/pnas.1111308108
32. Matsuzawa N, Takamura T, Kurita S, et al. Lipid-induced oxidative stress causes steatohepatitis in mice fed an atherogenic diet. Hepatology. 2007;46(5):1392–1403. doi:10.1002/hep.21874
33. Hoehna KL, Salmonb AB, Hohnen-Behrensa C, et al. Insulin resistance is a cellular antioxidant defense mechanism. Proc Natl Acad Sci USA. 2009;106(42):17787–17792. doi:10.1073/pnas.0902380106
34. Cohen JD, Cziraky MJ, Cai Q, et al. 30-year trends in serum lipids among United States adults: results from the national health and nutrition examination surveys II, III, and 1999–2006. Am J Cardiol. 2010;106(7):969–975. doi:10.1016/j.amjcard.2010.05.030
35. Katsiki N, Kolovou G. Postprandial lipid profile in patients with type 2 diabetes. Curr Med Res Opin. 2014;30(1):121. doi:10.1185/03007995.2013.842545
36. Boren J, Matikainen N, Adiels M, Taskinen MR. Postprandial hypertriglyceridemia as a coronary risk factor. Clin Chim Acta. 2014;431:131–142. doi:10.1016/j.cca.2014.01.015
 © 2024 The Author(s). This work is published and licensed by Dove Medical Press Limited. The
full terms of this license are available at https://www.dovepress.com/terms
and incorporate the Creative Commons Attribution
- Non Commercial (unported, 3.0) License.
By accessing the work you hereby accept the Terms. Non-commercial uses of the work are permitted
without any further permission from Dove Medical Press Limited, provided the work is properly
attributed. For permission for commercial use of this work, please see paragraphs 4.2 and 5 of our Terms.
© 2024 The Author(s). This work is published and licensed by Dove Medical Press Limited. The
full terms of this license are available at https://www.dovepress.com/terms
and incorporate the Creative Commons Attribution
- Non Commercial (unported, 3.0) License.
By accessing the work you hereby accept the Terms. Non-commercial uses of the work are permitted
without any further permission from Dove Medical Press Limited, provided the work is properly
attributed. For permission for commercial use of this work, please see paragraphs 4.2 and 5 of our Terms.