Back to Journals » Journal of Inflammation Research » Volume 16
Single-Cell RNA Sequencing and Transcriptome Analysis Revealed the Immune Microenvironment and Gene Markers of Acute Respiratory Distress Syndrome
Authors He D, Yu Q ![]() , Zeng X, Feng J, Yang R, Wan H, Zhong Y, Yang Y, Zhao R, Lu J, Zhang J
, Zeng X, Feng J, Yang R, Wan H, Zhong Y, Yang Y, Zhao R, Lu J, Zhang J
Received 18 May 2023
Accepted for publication 27 July 2023
Published 1 August 2023 Volume 2023:16 Pages 3205—3217
DOI https://doi.org/10.2147/JIR.S419576
Checked for plagiarism Yes
Review by Single anonymous peer review
Peer reviewer comments 2
Editor who approved publication: Professor Ning Quan
Dan He,1,* Qiao Yu,2,* Xiaona Zeng,2,* Jihua Feng,2 Ruiqi Yang,2 Huan Wan,2 Ying Zhong,2 Yanli Yang,2 Ruzhi Zhao,2 Junyu Lu,3,4 Jianfeng Zhang1,2,4
1Department of General Practice, The Second Affiliated Hospital of Guangxi Medical University, Nanning, 530007, People’s Republic of China; 2Department of Emergency Medicine, The Second Affiliated Hospital of Guangxi Medical University, Nanning, 530007, People’s Republic of China; 3Intensive Care Unit, The Second Affiliated Hospital of Guangxi Medical University, Nanning, 530007, People’s Republic of China; 4Guangxi Health Commission Key Laboratory of Emergency and Critical Medicine, Nanning, 530007, People’s Republic of China
*These authors contributed equally to this work
Correspondence: Jianfeng Zhang, Junyu Lu, The Second Affiliated Hospital of Guangxi Medical University, No. 166 Daxuedong Road, Nanning, Guangxi, 530007, People’s Republic of China, Tel +86 7713277166, Fax +86 7713277285, Email [email protected]; [email protected]
Background: Acute respiratory distress syndrome (ARDS) is caused by severe pulmonary inflammation and the leading cause of death in the intensive care unit.
Methods: We used single-cell RNA sequencing to compare peripheral blood mononuclear cells from sepsis-induced ARDS (SEP-ARDS) and pneumonic ARDS (PNE-ARDS) patient. Then, we used the GSE152978 and GSE152979 datasets to identify molecular dysregulation mechanisms at the transcriptional level in ARDS.
Results: Markedly increased CD14 cells were the predominant immune cell type observed in SEP-ARDS and PNE-ARDS patients. Cytotoxic cells and natural killer (NK) T cells were exclusively identified in patients with PNE-ARDS. An enrichment analysis of differentially expressed genes (DEGs) suggested that Th1 cell differentiation and Th2 cell differentiation were enriched in cytotoxic cells, and that the IL-17 signaling pathway, NOD receptor signaling pathway, and complement and coagulation cascades were enriched in CD14 cells. Furthermore, according to GSE152978 and GSE152979, 1939 DEGs were identified in patients with ARDS and controls; they were mainly enriched in the Kyoto Encyclopedia of Genes and Genomes pathways. RBP7 had the highest area under the curve values among the 12 hub genes and was mainly expressed in CD14 cells. Additionally, hub genes were negatively correlated with NK cells and positively correlated with neutrophils, cytotoxic cells, B cells, and macrophages.
Conclusion: A severe imbalance in the proportion of immune cells and immune dysfunction were observed in SEP-ARDS and PNE-ARDS patients. RBP7 may be immunologically associated with CD14 cells and serve as a potential marker of ARDS.
Keywords: acute respiratory distress syndrome, single-cell RNA sequencing, biomarker, immune disorders, differentially expressed genes
Introduction
Acute respiratory distress syndrome (ARDS) is a heterogeneous clinical syndrome secondary to alveolar damage with multiple causes that is associated with multiple pathophysiological abnormalities.1–3 ARDS is characterized by endothelial cell dysfunction and local inflammation. The incidence of ARDS in intensive care units is 10.4%, and the global mortality rate is approximately 40%.4,5 ARDS is induced by endothelial cell dysfunction and local inflammation, and systemic inflammatory immune responses and dysfunction have an important role in ARDS.6 Important factors associated with the high mortality rate of ARDS are its treatment, which is largely focused on clinical management, and the lack of targeted therapies.7 Therefore, the identification of diagnostic biomarkers and elucidation of immunomodulatory pathogenesis are of great clinical importance to improving treatment strategies for ARDS.8
When categorized by frequency, the most common underlying causes of ARDS in the emergency department include sepsis, aspiration, pancreatitis, blood transfusion, pneumonia, trauma, and burns.9 Sepsis-induced ARDS (SEP-ARDS) and pneumonic ARDS (PNE-ARDS) are often associated with high mortality rates or long-term disability.10,11 Studies have shown that pulmonary fibrosis is a major cause of poor outcome in patients with SEP-ARDS.12 Pneumonia is a type of lung infection caused by microbial infection, resulting in the accumulation of exudates in the lung parenchyma that compromise respiratory function.13 Recently, outbreaks of coronavirus disease (COVID-19) have led to an increase in ARDS and highlighted the challenges associated with this syndrome.14,15 To address the unmet therapeutic needs of SEP-ARDS and PNE-ARDS, we reasoned that identifying the pathogenic commonalities between SEP-ARDS and PNE-ARDS could facilitate the development of novel therapeutic targets.
Inflammatory damage and diffuse lung parenchymal injury are characteristics of ARDS.16 Despite numerous studies, the prognosis remains poor because of the complexity of its cause and pathogenesis. The current treatments for ARDS include respiratory support and immunotherapy.17 Accumulating evidence has shown that the dynamic balance between inflammatory responses is important for pathogenesis and prognosis of ARDS.18 Omics technologies offer new opportunities for the development of diagnostic tools and personalized treatments for ARDS.19 Recently, single-cell RNA sequencing (scRNA-seq) has been used to identify early gene markers and the immune landscape of ARDS to potentially identify opportunities for adjuvant therapies.20,21 However, the complex interplay between these immune cells, their specific contributions to Sterile and Pneumonia-induced ARDS (SEP-ARDS and PNE-ARDS), and the precise molecular mechanisms remain to be fully elucidated.
Therefore, to describe the pathobiology and associated immunity is important to develop new treatments. This study explored immune cell subset dysregulation during pathology assessments based on scRNA-seq of peripheral blood samples from patients with ARDS. The results were combined with transcriptome data to identify potential molecular dysregulation mechanisms in and diagnostic targets of ARDS.
Materials and Methods
Sample Collection
Peripheral blood samples were collected from one adult patient with PNE-ARDS, two adult patients with SEP-ARDS, and one adult healthy volunteer at the Second Affiliated Hospital of Guangxi Medical University.22 All patients met the Berlin definition of ARDS, did not undergo organ transplantation, did not have active malignancies, and were not treated with systemic immunosuppressants or glucocorticoids. Clinical information of the sample was shown in Supplementary Table S1. This study was approved by the research ethics committee of The Second Affiliated Hospital of Guangxi Medical University and conformed to the Declaration of Helsinki. All participants provided written informed consent before the start of the study.
Single-Cell Suspension and scRNA-Seq
Peripheral blood mononuclear cells (PBMCs) were isolated from peripheral blood using gradient centrifugation in a Falcon tube. The cells were washed three times, and PBMCs were cultured in RPMI-1640 medium with 10% fetal bovine serum. Under a microscope, single cells with intact morphology and high cell viability were randomly placed in lysis buffer. The cDNA was obtained from mRNA, and the amplified cDNA was pooled and fragmented. Libraries were subsequently constructed using the 10× Genomics Single Cell 5’ library and gel bead kit version 1.1. The constructed libraries were used for scRNA-seq with the HiSeq Platform (Illumina).
scRNA-Seq Data Analysis
Raw data were processed using Cell Ranger version 3.0.8 (10× Genomics). Preprocessing of the raw data was performed using Cell Ranger version 3.0.8. STAR (version 2.5.2) was used to align the reads that met the quality criteria with the human reference genome (hg19). Low-quality cells with less than 201 or more than 9000 expressed genes, as well as more than 20% mitochondrial gene expression were removed for quality filtering.
The major cell types were annotated according to the average expression of the following selected gene sets: CD14 cells (VCAN, CST3, CSTA, CLEC7A, and RETN); cytotoxic cells (CCL5, KLRD1, PRF1, and TGFB1); CD4 T cells (IL7R, LTB, RPS12, RPS6, and PIK3IP1); natural killer (NK) T (NKT) cells (GZMA, GZMH, and NKG7); NK cells (GNLY, SPON2, KLRB1, GZMB, and CTSW); CD16 (LST1, IFITM3, PSAP, LILRA1, and COTL1); and B cells (IGHM, CD79A, IGLC2, HLA-DRA, and CD74).
The t-distributed stochastic neighbor embedding method of the Seurat package23 was used for cluster visualization after determining cell clusters. A pseudotime trajectory analysis of the cells was performed using the Monocle package.24 Differentially expressed genes (DEGs) of the cells were identified using the limma package25 (P < 0.05). Enrichment analyses of biological processes and the Kyoto Encyclopedia of Genes and Genomes (KEGG) were performed using the clusterProfiler package.26
Public Data Collection and Processing
We collected GSE15298027 from Gene Expression Omnibus database, including GSE152978 and GSE152979 datasets. The GSE152979 dataset included gene expression profiling of nasal brushings from 40 pediatric ARDS samples and 20 samples from healthy controls using the Illumina HiSeq 2500 based on the GPL16791 platform. The GSE152978 dataset included gene expression profiling of nasal brushings from eight pediatric ARDS samples and five samples from healthy controls using the Illumina HiSeq 2500 based on the GPL16791 platform. The expression matrices were counted using STAR. A principal component analysis was performed for linear dimension reduction to determine the significantly available dimensions after GSE152978 and GSE152979 were combined in batches.
The limma package was used to obtain DEGs of patients with ARDS and controls, with statistical significance set at P < 0.05. An enrichment analysis of DEGs was performed using the clusterProfiler package. A gene set enrichment analysis (GSEA) was performed to identify enriched pathways in ARDS using the clusterprofiler package. The area under the receiver-operating characteristic curve (AUC) was calculated using the pROC package.28
Immune Evaluation
The single-sample GSEA (ssGSEA) scores of the GSE152979 dataset were obtained using the GSVA package29 to evaluate the number of immune cells in ARDS. Next, the ssGSEA scores of patients with ARDS and controls were compared to show differences. A correlation analysis was performed using Pearson’s correlation coefficient.
Results
Single‐cell Transcription Atlas in ARDS
A schematic representation of this study is shown in Figure 1. During this study, 15,889 cells were obtained from one PNE-ARDS sample, two SEP-ARDS samples, and one healthy control sample (Supplementary Figure S1). After removing low-quality cells according to the quality control criteria, 12,572 cells finally passed quality filtering and were included in further analyses (Supplementary Figure S2).
 |
Figure 1 Study flowchart. Abbreviations: AUC, area under the receiver-operating characteristic curve; DEGs, differentially expressed genes; PBMCs, peripheral blood mononuclear cells; PNE-ARDS, pneumonic acute respiratory distress syndrome; scRNA-seq, single-cell RNA sequencing; SEP-ARDS, sepsis-induced acute respiratory distress syndrome; ssGSEA, single-sample gene set enrichment analysis; t-SNE, t-distributed stochastic neighbor embedding. |
To determine the major cell populations, we first performed graph-based cell clustering. According to the expression of marker genes for cell lineage, we identified four major cell types (cytotoxic cells, CD14 cells, B cells, and CD4 T cells) in the samples (Figure 2A and B). The percentages of CD14 cells, cytotoxic cells, and CD4 T cells were higher in patients with SEP-ARDS than those in patient with PNE-ARDS and healthy controls; B cells were more abundant in patient with PNE-ARDS and healthy controls than in patients with SEP-ARDS (Figure 2C). The cell cycle analysis suggested that most cells were in the G1 phase (Figure 2D). A pseudotime trajectory analysis showed a significant differentiation trend from CD14 cells to cytotoxic cells, CD4 T cells, and B cells (Figure 2E, F), thus indicating the potential degrees of differentiation and transcriptional heterogeneity of immune cells in ARDS.
 |
Figure 2 Identification of cell populations using single-cell RNA sequencing. (A) The t-distributed stochastic neighbor embedding (t-SNE) plots of major immune cells in peripheral blood mononuclear cells of sepsis-induced acute respiratory distress syndrome (SEP-ARDS) patients, pneumonic acute respiratory distress syndrome (PNE-ARDS) patients, and healthy controls were analyzed, with colors representing cell types. (B). Identification of marker genes for each cell population. The size of the dot corresponds to the percentage of cells in the cell population expressing the gene. The depth of the color represents the average expression level of the gene. (C) Frequency of cell types in each group. (D) Proportion of cells in M1, S, and G2/M phases during the cell cycle analysis. (E) Pseudotime trajectory analysis of major immune cells. Each dot corresponds to one cell, and each color represents one cell type. (F) Radiation maps show significant differential expression of each branch. Purple represents high expression and green represents low expression. |
To better define the major populations and subpopulations of cells in ARDS, we performed separate graph-based cell clustering of the three groups of samples. According to the expression of marker genes for cell lineage (Figure 3B, D and F), we identified seven major cell types in the different groups. In the patient with PNE-ARDS (Figure 3A), we found seven cell types (NKT, CD16, NK, cytotoxic, CD14 cells, CD4 T cells, and B cells), five cell types (CD16, NK, CD14 cells, B cells, and CD4 T cells) in patients with SEP-ARDS (Figure 3C), and five cell types (CD16, NK, CD14 cells, B cells, and CD4 T cells) in healthy controls (Figure 3E). As shown in Figure 3G, CD14 cells (41.7%) were the predominant immune cell type in patient with PNE-ARDS, followed by cytotoxic cells (18.9%), and CD4 T cells (14.5%). CD14 cells (71.04%) were the predominant immune cell type in patients with SEP-ARDS (Figure 3H), followed by NK cells (15.29%) and CD4 T cells (10.04%). CD14 cells (33.64%) were also the predominant immune cell type in healthy controls (Figure 3I), followed by CD4 T cells (21.99%) and NK cells (21.05%). Unsurprisingly, there were significant differences in the proportions of immune cells in samples when patients with ARDS and healthy controls were compared.
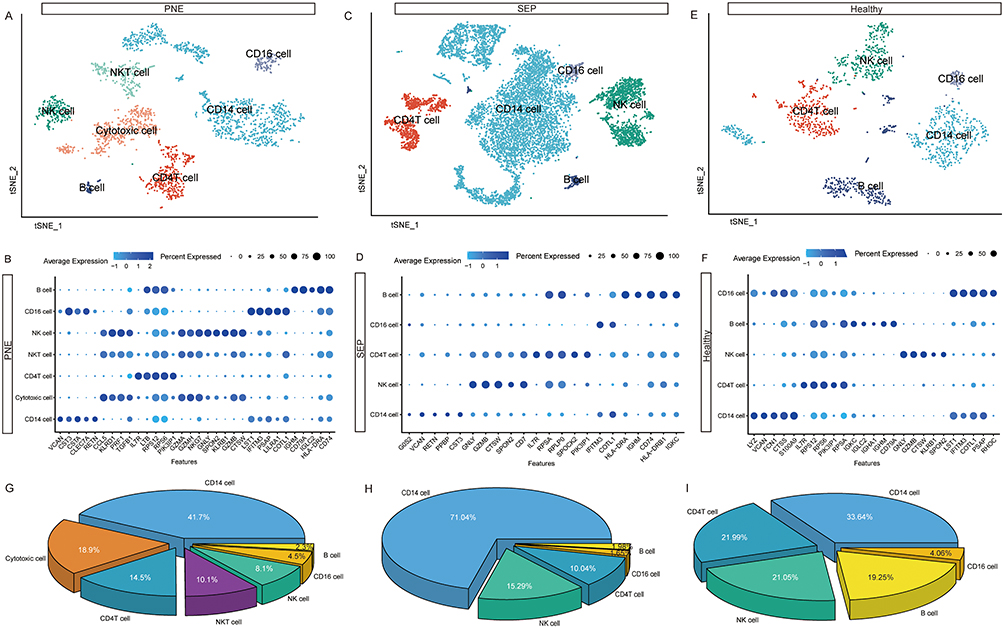 |
Figure 3 Single-cell immune landscape of acute respiratory distress syndrome patients and healthy controls. (A) The t-SNE plot of major immune cells of PNE-ARDS patients. (B) Identification of marker genes for each cell population of PNE-ARDS patients. The size of the dot corresponds to the percentage of cells in the cell population expressing the gene. The depth of the color represents the average expression level of the gene. (C) The t-SNE plot of major immune cells from SEP-ARDS patients. (D) Identification of marker genes for each cell population. The size of the dot corresponds to the percentage of cells in the cell population expressing the gene in SEP-ARDS. The depth of the color represents the average expression level of the gene. (E) The t-SNE plot of major immune cells from healthy controls. (F) Identification of marker genes for each cell population of healthy controls. The size of the dot corresponds to the percentage of cells in the cell population expressing the gene. The depth of the color represents the average expression level of the gene. (G) The percentages of major immune cells in PNE-ARDS patients. (H) The percentages of major immune cells in SEP-ARDS patients. (I) The percentages of major immune cells in healthy controls. Abbreviations: PNE, pneumonic acute respiratory distress syndrome; SEP, sepsis-induced acute respiratory distress syndrome; t-SNE, t-distributed stochastic neighbor embedding. |
Differentially Expressed Genes Among Immune Cells
Based on the gene expression profiles of major cell populations from all samples, we analyzed significant DEGs in major immune cells of SEP-ARDS and PNE-ARDS patients to identify immune cell-related molecular mechanisms. Compared to the other three immune cells, 7370 DEGs were found in CD14 cells, 2292 DEGs were found in cytotoxic cells, 923 DEGs were found in CD4 T cells, and 486 DEGs were found in B cells (Figure 4A). An enrichment analysis of DEGs showed that they were mainly enriched in T-cell migration, positive T-cell selection, and thymocyte migration of biological processes (Figure 4B). In the KEGG pathways, Th1 cell differentiation, Th2 cell differentiation, the PI3K-Akt signaling pathway, and the NOD receptor signaling pathway were mainly enriched by DEGs (Figure 4C). Additionally, we analyzed the enrichment of KEGG pathways in immune cells (Figure 4D). Th1 cell differentiation and Th2 cell differentiation (hsa04658) were mainly enriched in cytotoxic cells; the IL-17 signaling pathway (hsa04657), NOD receptor signaling pathway (hsa04621), and complement and coagulation cascades (hsa04610) were mainly enriched by genes of CD14 cells.
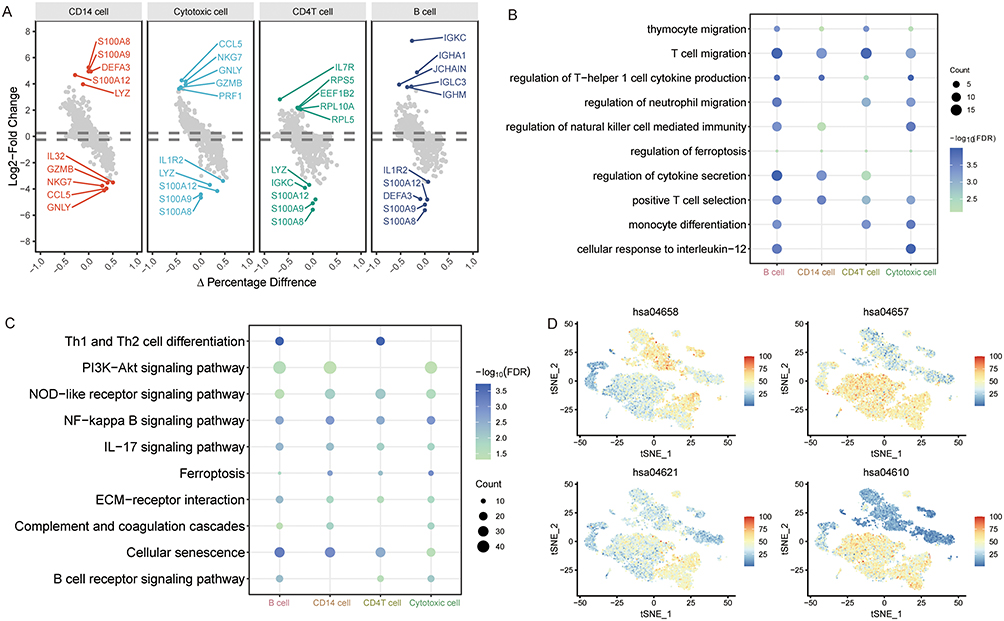 |
Figure 4 Differentially expressed genes and related molecular mechanisms of major immune cells. (A) Differentially expressed genes of each immune cell compared to others. Genes with the largest fold change during differential expression are labeled. (B) Biological processes of differentially expressed genes in different immune cells. The size of the dot corresponds to the cell count. The depth of the color represents the false discovery rate (FDR). (C) Kyoto Encyclopedia of Genes and Genomes pathways of differentially expressed genes in different immune cells. The size of the dot corresponds to the cell count. The depth of the color represents the FDR. (D) Enrichment levels of KEGG pathways in each cell type. Colors ranging from blue to red indicate increased expression. |
Altered Expression of Transcriptional Programs in ARDS
Because of the limited sample size used for scRNA-seq, we utilized public data to explore the transcriptional signatures of ARDS. The principal component analysis results showed that the batch effects of the GSE152978 and GSE152979 samples were corrected in the data by merging the batches (Supplementary Figure S3). Next, we performed a differential analysis and identified 1939 DEGs of patients with ARDS and controls (Figure 5A), which included 1230 upregulated and 709 downregulated DEGs. These DEGs were mainly enriched during viral gene expression, regulation of mitogen-activated protein kinase activity, and regulation of apoptotic signaling pathways of biological processes (Figure 5B). Additionally, ribosome, COVID-19, and human papillomavirus infections were mainly involved in these DEGs (Figure 5C). Additionally, we performed GSEA to detect the enrichment of KEGG pathways of immune cells enriched in ARDS (Figure 5D). Patients with ARDS had stronger complement and coagulation cascades and NOD receptor signaling pathway enrichment. Healthy controls had stronger enrichment of Th1 cells, Th2 cells, and the IL-17 signaling pathway.
 |
Figure 5 Comparative transcriptome analysis of ARDS patients and controls. (A) Volcano plots showing differentially expressed genes of ARDS patients and controls. Genes with the largest fold change (FC) in differential expression are labeled. (B) Biological processes of differentially expressed gene enrichment. The size of the dot corresponds to the gene count. The depth of the color represents the FDR. (C) Kyoto Encyclopedia of Genes and Genomes pathways of differentially expressed gene enrichment. The size of the dot corresponds to the gene count. The depth of the color represents the FDR. (D) Gene set enrichment analysis shows the immune cells related to KEGG pathway enrichment in ARDS. Abbreviations: FDR, false discovery rate; NES, normalized enrichment score. |
Screening of Hub Genes
Through clustering and visualization of gene expression and signaling pathways, we identified four subpopulations (Figure 6A). The upregulated genes in ARDS were associated with the HIF-1 signaling pathway and cell cycle; downregulated genes in ARDS were mainly enriched in ribosomes and the PI3K-Akt signaling pathway.
 |
Figure 6 Identification and evaluation of hub genes. (A) Heatmap of differentially expressed genes of ARDS patients and controls and pathway enrichment results for each subpopulation. Genes in the heatmap are labeled at random. (B) Column plot of hub gene expression of ARDS patients and healthy controls. (C) AUC value, fold change (FC) in expression, and P value for hub genes in ARDS. (D) Expression of hub genes in immune cells. The depth of the color represents the high expression level of hub gene. Abbreviations: ARDS, acute respiratory distress syndrome; AUC, area under the receiver-operating characteristic curve; DEG, differentially expressed gene. |
To further identify immune-related candidate genes in ARDS, we performed an intersection analysis of DEGs of immune cells and DEGs of patients with ARDS and controls. We identified 232 common DEGs. Subsequently, DEGs with |log2 (fold change)| >0.5 according to public data and |log2 (fold change)| >1 according to scRNA-seq in were used to screen hub genes. Twelve hub genes (C5AR1, CLEC12A, CLIC3, CYBB, FOS, HP, ITM2A, PLBD1, RBP7, RGS2, RPS17, and TYMS) were identified. Among them, CLEC12A, CLIC3, CYBB, HP, PLBD1, RPS17, and TYMS were upregulated and C5AR1, FOS, ITM2A, RBP7, and RGS2 were downregulated in ARDS (Figure 6B). The calculated results suggested that hub genes have a sensitive predictive role in the diagnosis of ARDS, with AUC values more than 0.63, especially for RBP7 (Figure 6C). Furthermore, C5AR1, CLEC12A, RGS2, PLBD1, RBP7, and HP were highly expressed in CD14 cells, CLIC3 was highly expressed in cytotoxic cells, ITM2A was highly expressed in CD4 T cells, CYBB and TYMS were highly expressed in CD14 and B cells, and FOS and RPS17 were highly expressed in cytotoxic cells, CD14 cells, CD4 T cells, and B cells (Figure 6D).
Assessment of Immune Cells in ARDS
To further evaluate immune abnormalities in ARDS, we utilized ssGSEA to calculate the differential levels of immune cells of patients with ARDS and controls. NK cells (P < 0.05), Th17 cells (P < 0.05), and mast cells were decreased in ARDS, whereas macrophages and Th2 cells were increased in ARDS (Figure 7A). A correlation analysis was performed to explore the correlation between immune cells. In ARDS, the positive correlation between cytotoxic cells and NK CD56dim cells was the greatest, whereas the negative correlation between NK cells and macrophages was the greatest (Figure 7B). Additionally, the correlation results showed that hub genes had a significantly negative correlation with NK cells and a significant positive correlation with neutrophils, cytotoxic cells, B cells, and macrophages (Figure 7C). However, the correlation between hub genes and immune checkpoint was calculated (Figure 7D). We found a positive correlation between CYBB, RGS2, FOS, PLBD1, HP, CLIC3, CLEC12A, C5AR1, CXCL8, ITGB2, LAIR1, SLAMF7, and TLR4; however, we found a negative correlation between CADM1, HSPA12A, HSPA2, NOS2, and RAET1G.
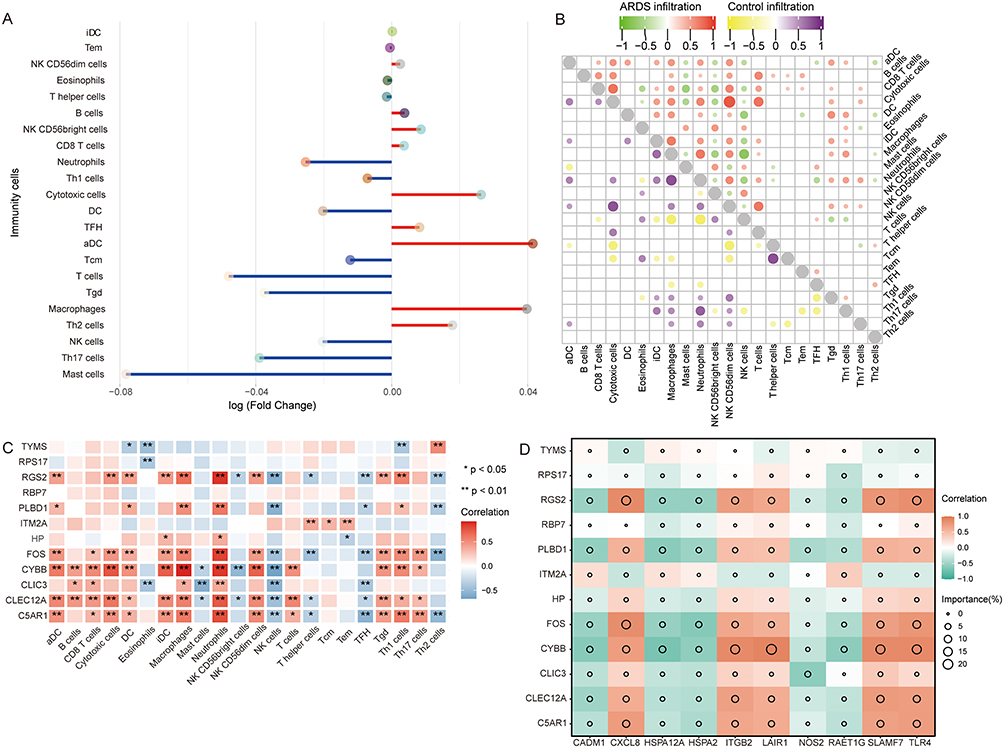 |
Figure 7 Immune dysfunction in ARDS. (A) Increased or decreased immune cells in ARDS are assessed by a single-sample gene set enrichment analysis. Red represents increased and blue represents decreased immune cells. (B) Correlation between immune cells. Red indicates a positive correlation and green indicates a negative correlation for ARDS patients. Purple indicates a positive correlation and yellow indicates a negative correlation for controls. (C) Correlation between immune cells and hub genes. Red indicates a positive correlation and blue indicates a negative correlation for ARDS patients. *P<0.05, **P<0.01. (D) Correlation between the immune checkpoint and hub genes. Red indicates a positive correlation and green indicates a negative correlation. Abbreviation: ARDS, acute respiratory distress syndrome. |
Discussion
ARDS is a complex immune disorder involving multifaceted mechanisms.30,31 The identification of ARDS immune signatures is essential to ensure effective treatment. Recent studies have utilized single-cell transcriptomics to dissect the immune landscape driving Neo-crown pneumonia pathogenesis.32 During this study, we sought to characterize the diversity of immune cell profiles of PBMCs from PNE-ARDS and SEP-ARDS patients. We found that cell proportions and gene expression profiles were also different in PNE-ARDS and SEP-ARDS patients, which may reflect differences in the immune responses of the two types of ARDS. Furthermore, by collecting and reanalyzing previous data and comparing them with the data of the current study, common gene expression and immune differences in ARDS will also be revealed. To our knowledge, this is the first study to identify potential common immune mechanisms in PBMCs associated with both diseases. Our study provides novel insights into the predominant immune cell types in SEP-ARDS and PNE-ARDS, which enhancing our understanding of this complex disease and paving the way for future research on potential therapeutic targets and diagnostic markers.
During this study, we provided a immune map in PNE-ARDS and SEP-ARDS patients. CD14 cells were the most abundant immune cells in both PNE-ARDS and SEP-ARDS patients. CD14 is expressed on the surfaces of macrophages and neutrophils and involved in immune responses.33 CD14, a key marker and facilitator of pro-inflammatory macrophage function, was recently found to be associated with cytokine storms in new crown pneumonia.34 CD14+ monocytes are increased in PBMCs of patients with severe new coronavirus pneumonia.35 The higher number of CD14 cells in patients with SEP-ARDS than in those without ARDS and could serve as a potential biomarker of SEP-ARDS disease severity and mortality.36
Our study highlighted that immune cell populations appeared more severely imbalanced in PNE-ARDS and SEP-ARDS patients than those in the healthy population. Although CD14 was the largest cell population in all three groups, this is still suggestive of immune dysfunction in patients with ARDS. The proportions of B cells in PNE-ARDS and SEP-ARDS patients were much smaller than that in healthy controls, suggesting impaired B cell function in patients with ARDS. B-cell levels were significantly higher in patients with ARDS with a favorable prognosis.37 Increased proliferation of B cells occurred weeks after clearance of COVID-19, which added to the clinical effects of long-lasting immune alterations.38 Additionally, NK cells and CD4 T cells were reduced in ARDS patients, similar to the findings of Torres et al.39
Additionally, larger proportions of cytotoxic cells and NK T cells were observed in patient with PNE-ARDS; however, they were not identified in patients with SEP-ARDS. The hyperactivation of T cells in patients with ARDS leads to strong cytokine release, which has cytotoxic effects on the respiratory system.40 Yao et al found a functional defect in cytotoxic killing by NK and CD8 T cells in PBMCs with severe new coronavirus pneumonia.41 Increasing the cytotoxic response improves the inflammatory milieu of new crown pneumonia, reduces the length of the hospital stay, and may improve patient outcomes. Collectively, for PNE-ARDS and SEP-ARDS patients, there is a functional defect in immune responses that may contribute to the important pathological mechanisms of ARDS.
However, through an enrichment analysis, we found that Th1 cell differentiation, Th2 cell differentiation, the PI3K-Akt signaling pathway, the NOD receptor signaling pathway, the IL-17 signaling pathway, and complement and regulation coagulation cascades were enriched in immune cells. Activation of PI3K-Akt is protective against ARDS.16 Inhibition of the activation of NOD receptors can block the progression of ARDS.42 Abnormal complement activation, causing feedback-mediated hypercoagulability and hyperinflammation, leads to tissue damage.43 Interestingly, Th1 cell differentiation and Th2 cell differentiation were mainly enriched in cytotoxic cells; others were mainly enriched in CD14 cells. These results suggested that the cytotoxic cells of SEP-ARDS were more skewed toward Th1 cell immunity and the tendency of PNE-ARDS to activate Th17 cell immunity.
An analysis of the transcriptome data according to GSE152978 and GSE152979 revealed that the DEGs may be associated with the activation of complement and regulation of complement and coagulation cascades and the NOD receptor signaling pathway in ARDS, which are related to the immunosuppression of Th1 cells, Th2 cells, and IL-17. Notably, among the immune cells analyzed, the ssGSEA scores were significantly lower than those of normal cells, suggesting a possible impairment in immune cell function.44 We found results consistent with those of scRNA-seq studies that identified increased immune dysregulation and inflammatory signatures after comparing the transcriptomes of healthy controls and patients with ARDS. Additionally, among the identified hub genes, RBP7, which was downregulated in ARDS, had the largest AUC value and may be more sensitive for predicting ARDS. RBP7, a neutrophil-associated gene, has decreased expression in sepsis-induced ARDS.45 Although there are limited reports of the association between RBP7 and ARDS, this analysis suggested that it may serve as an important marker of ARDS. A significant negative correlation between RBP7 and ferroptosis was observed. With ARDS, cells appear to be overloaded with iron because of ferroptosis, rendering the disease increasingly severe.46 Therefore, RBP7 may have a protective role in ARDS.
Limitations
Our study had some limitations. First, the small sample size used for scRNA-seq may have limited the interpretation of the results. Second, immune abnormalities of patients with ARDS may have been the result of multiple factors; therefore, further collected more clinical samples for verification to verify the scientific nature of the research is required. Additionally, a data analysis of PNE-ARDS and SEP-ARDS has not yet allowed for the specific assessment of the defined etiological dynamics. Importantly, the expression of RBP7 in ARDS was not validated, which is also one of the focuses of future studies. Finally, the present results require validation among a large sample, and in-depth investigations of the in vivo and in vitro molecular mechanisms should be performed.
Conclusion
Our study showed that the analysis of single cells using sequencing is a better way of studying cell diversity and heterogeneity. The proportions of immune cells, especially B cells, NK cells, and cytotoxic cells, were abnormal in PNE-ARDS and SEP-ARDS patients compared to those in healthy controls. Immune dysfunction may be associated with Th1 cells, Th2 cells, IL-17, PI3K-Akt, NOD receptor signaling pathways, and complement and coagulation cascades. Additionally, RBP7 as a potential ARDS biomarker may have a predictive role in the diagnosis of ARDS. Our findings underscore the complexity of ARDS, emphasizing the importance of an integrated, multi-dimensional approach to studying this severe and often fatal disease.
Data Sharing Statement
The raw data from this study have been deposited in the Genome Sequence Archive at the National Genomics Data Center (GSA: HRA002203 and HRA002228), which can be accessed at https://ngdc.cncb.ac.cn; Public data used in this study were obtained from Gene Expression Omnibus (GEO) database (https://www.ncbi.nlm.nih.gov/geo) with GSE152980, GSE152978 and GSE152979 datasets.
Ethics Approval and Consent to Participate
This study was approved by the research ethics committee of The Second Affiliated Hospital of Guangxi Medical University and conformed to the Declaration of Helsinki. All participants provided written informed consent before the start of the study.
Funding
This study was supported by the Key Research and Development project of Guangxi (Guike AB23026012), Guangxi Natural Science Foundation (2021GXNSFBA196017), Joint Project on Regional High-Incidence Diseases Research of Guangxi Natural Science Foundation under Grant No. 2023GXNSFDA026023, the National Natural Science Foundation of China (81960343) and the High-level Medical Expert Training Program of Guangxi “139” Plan Funding (G201903027).
Disclosure
The authors declare that there are no conflicts of interest in this work.
References
1. Sinha P, Bos LD. Pathophysiology of the acute respiratory distress syndrome: insights from clinical studies. Crit Care Clin. 2021;37(4):795–815. doi:10.1016/j.ccc.2021.05.005
2. Zhang J, Luo Y, Wang X, et al. Global transcriptional regulation of STAT3- and MYC-mediated sepsis-induced ARDS. Ther Adv Respir Dis. 2019;13:1753466619879840.
3. Zheng X, Luo Y, Li Q, et al. Two gene set variation index as biomarker of bacterial and fungal sepsis. Biomed Res Int. 2020;2020:8182358. doi:10.1155/2020/8182358
4. Zhang Q, Wang Y, Qu D, Yu J, Yang J. Role of HDAC6 inhibition in sepsis-induced acute respiratory distress syndrome (Review). Exp Ther Med. 2021;21(5):422. doi:10.3892/etm.2021.9866
5. Bellani G, Laffey JG, Pham T, et al. Epidemiology, patterns of care, and mortality for patients with acute respiratory distress syndrome in intensive care units in 50 countries. JAMA. 2016;315(8):788–800. doi:10.1001/jama.2016.0291
6. Ming T, Dong M, Song X, et al. Integrated analysis of gene co-expression network and prediction model indicates immune-related roles of the identified biomarkers in sepsis and sepsis-induced acute respiratory distress syndrome. Front Immunol. 2022;13:897390. doi:10.3389/fimmu.2022.897390
7. Lu J, Li Q, Wu Z, et al. Two gene set variation indexes as potential diagnostic tool for sepsis. Am J Transl Res. 2020;12(6):2749–2759.
8. Feng J, Pang J, He D, et al. Identification of genes with altered methylation and its role in early diagnosis of sepsis-induced acute respiratory distress syndrome. Int J Gen Med. 2021;14:243–253. doi:10.2147/IJGM.S287960
9. Gragossian A, Siuba MT. Acute respiratory distress syndrome. Emerg Med Clin North Am. 2022;40(3):459–472. doi:10.1016/j.emc.2022.05.002
10. Hu Q, Hao C, Tang S. From sepsis to acute respiratory distress syndrome (ARDS): emerging preventive strategies based on molecular and genetic researches. Biosci Rep. 2020;40(5). doi:10.1042/BSR20200830
11. Meyer NJ, Gattinoni L, Calfee CS. Acute respiratory distress syndrome. Lancet. 2021;398(10300):622–637. doi:10.1016/S0140-6736(21)00439-6
12. Feng K, Huang W, Shang J, et al. Knockdown of lncRNA-ASLNC12002 alleviates epithelial-mesenchymal transition of type II alveolar epithelial cells in sepsis-induced acute respiratory distress syndrome. Hum Cell. 2023;36(2):568–582. doi:10.1007/s13577-022-00837-8
13. Quinton LJ, Walkey AJ, Mizgerd JP. Integrative physiology of pneumonia. Physiol Rev. 2018;98(3):1417–1464. doi:10.1152/physrev.00032.2017
14. Swenson KE, Swenson ER. Pathophysiology of acute respiratory distress syndrome and COVID-19 lung injury. Crit Care Clin. 2021;37(4):749–776. doi:10.1016/j.ccc.2021.05.003
15. Lu J, Zeng X, Lu W, et al. Documenting the immune response in patients with COVID-19-induced acute respiratory distress syndrome. Front Cell Dev Biol. 2023;11:633. doi:10.3389/fcell.2023.1207960
16. Huang J, Wang B, Tao S, et al. D-tagatose protects against oleic acid-induced acute respiratory distress syndrome in rats by activating PTEN/PI3K/AKT pathway. Front Immunol. 2022;13:928312. doi:10.3389/fimmu.2022.928312
17. Lu J, Lv S, Pang J, et al. M2c macrophages protect mice from adriamycin-induced nephropathy by upregulating CD62L in tregs. Mediators Inflamm. 2022;2022:1153300. doi:10.1155/2022/1153300
18. Liu Z, Liu D, Wang Z, et al. Association between inflammatory biomarkers and acute respiratory distress syndrome or acute lung injury risk: a systematic review and meta-analysis. Wien Klin Wochenschr. 2022;134(1–2):24–38. doi:10.1007/s00508-021-01971-3
19. Battaglini D, Al-Husinat L, Normando AG, et al. Personalized medicine using omics approaches in acute respiratory distress syndrome to identify biological phenotypes. Respir Res. 2022;23(1):318. doi:10.1186/s12931-022-02233-0
20. Jiang Y, Rosborough BR, Chen J, et al. Single cell RNA sequencing identifies an early monocyte gene signature in acute respiratory distress syndrome. JCI Insight. 2020;5(13). doi:10.1172/jci.insight.135678
21. Panda R, Castanheira FV, Schlechte JM, et al. A functionally distinct neutrophil landscape in severe COVID-19 reveals opportunities for adjunctive therapies. JCI Insight. 2022;7(2). doi:10.1172/jci.insight.152291
22. Mo J, Yang Y, Feng J, et al. Single-cell analysis reveals dysregulated inflammatory response in peripheral blood immunity in patients with acute respiratory distress syndrome. Front Cell Dev Biol. 2023;11:1199122. doi:10.3389/fcell.2023.1199122
23. Pont F, Tosolini M, Fournie JJ. Single-Cell Signature Explorer for comprehensive visualization of single cell signatures across scRNA-seq datasets. Nucleic Acids Res. 2019;47(21):e133.
24. Trapnell C, Cacchiarelli D, Grimsby J, et al. The dynamics and regulators of cell fate decisions are revealed by pseudotemporal ordering of single cells. Nat Biotechnol. 2014;32(4):381–386. doi:10.1038/nbt.2859
25. Ritchie ME, Phipson B, Wu D, et al. limma powers differential expression analyses for RNA-sequencing and microarray studies. Nucleic Acids Res. 2015;43(7):e47. doi:10.1093/nar/gkv007
26. Wu T, Hu E, Xu S, et al. clusterProfiler 4.0: a universal enrichment tool for interpreting omics data. Innovation. 2021;2(3):100141. doi:10.1016/j.xinn.2021.100141
27. Williams JG, Joshi R, Haslam D, et al. Multi-omic characterization of pediatric ARDS via nasal brushings. Respir Res. 2022;23(1):181. doi:10.1186/s12931-022-02098-3
28. Robin X, Turck N, Hainard A, Tiberti N, Lisacek F, Sanchez JC, Muller M. pROC: an open-source package for R and S+ to analyze and compare ROC curves. BMC Bioinform. 2011;12(1):77. doi:10.1186/1471-2105-12-77
29. Hanzelmann S, Castelo R, Guinney J. GSVA: gene set variation analysis for microarray and RNA-seq data. BMC Bioinform. 2013;14:7. doi:10.1186/1471-2105-14-7
30. Zeng X, Feng J, Yang Y, et al. Screening of key genes of sepsis and septic shock using bioinformatics analysis. J Inflamm Res. 2021;14:829–841. doi:10.2147/JIR.S301663
31. Zhao C, Mo J, Zheng X, et al. Identification of an alveolar macrophage-related core gene set in acute respiratory distress syndrome. J Inflamm Res. 2021;14:2353–2361. doi:10.2147/JIR.S306136
32. Sinha S, Rosin NL, Arora R, et al. Dexamethasone modulates immature neutrophils and interferon programming in severe COVID-19. Nat Med. 2022;28(1):201–211. doi:10.1038/s41591-021-01576-3
33. Zingaropoli MA, Nijhawan P, Carraro A, et al. Increased sCD163 and sCD14 plasmatic levels and depletion of peripheral blood pro-inflammatory monocytes, myeloid and plasmacytoid dendritic cells in patients with severe COVID-19 pneumonia. Front Immunol. 2021;12:627548. doi:10.3389/fimmu.2021.627548
34. Jimenez-Duran G, Luque-Martin R, Patel M, et al. Pharmacological validation of targets regulating CD14 during macrophage differentiation. EBioMedicine. 2020;61:103039. doi:10.1016/j.ebiom.2020.103039
35. Roussel M, Ferrant J, Reizine F, et al. Comparative immune profiling of acute respiratory distress syndrome patients with or without SARS-CoV-2 infection. Cell Rep Med. 2021;2(6):100291. doi:10.1016/j.xcrm.2021.100291
36. Mahida RY, Price J, Lugg ST, et al. CD14-positive extracellular vesicles in bronchoalveolar lavage fluid as a new biomarker of acute respiratory distress syndrome. Am J Physiol Lung Cell Mol Physiol. 2022;322(4):L617–L624. doi:10.1152/ajplung.00052.2022
37. Zhu G, Liu Y, Zhang W, Huang Y, Li K. CD27(+)TIM-1(+) memory B cells promoted the development of Foxp3(+) Tregs and were associated with better survival in acute respiratory distress syndrome. Immunol Res. 2018;66(2):281–287. doi:10.1007/s12026-017-8983-2
38. Ramaswamy A, Brodsky NN, Sumida TS, et al. Immune dysregulation and autoreactivity correlate with disease severity in SARS-CoV-2-associated multisystem inflammatory syndrome in children. Immunity. 2021;54(5):1083–1095 e1087. doi:10.1016/j.immuni.2021.04.003
39. Torres M, Casado G, Vigon L, et al. Changes in the immune response against SARS-CoV-2 in individuals with severe COVID-19 treated with high dose of vitamin D. Biomed Pharmacother. 2022;150:112965. doi:10.1016/j.biopha.2022.112965
40. Mallis P, Michalopoulos E, Chatzistamatiou T, Stavropoulos-Giokas C. Mesenchymal stromal cells as potential immunomodulatory players in severe acute respiratory distress syndrome induced by SARS-CoV-2 infection. World J Stem Cells. 2020;12(8):731–751. doi:10.4252/wjsc.v12.i8.731
41. Yao C, Bora SA, Parimon T, et al. Cell-type-specific immune dysregulation in severely ill COVID-19 patients. Cell Rep. 2021;34(1):108590. doi:10.1016/j.celrep.2020.108590
42. Lu Q, Yu S, Meng X, et al. MicroRNAs: important regulatory molecules in acute lung injury/acute respiratory distress syndrome. Int J Mol Sci. 2022;23(10):5545.
43. Pryzdial ELG, Leatherdale A, Conway EM. Coagulation and complement: key innate defense participants in a seamless web. Front Immunol. 2022;13:918775. doi:10.3389/fimmu.2022.918775
44. Noureen N, Ye Z, Chen Y, Wang X, Zheng S. Signature-scoring methods developed for bulk samples are not adequate for cancer single-cell RNA sequencing data. Elife. 2022;11:e71994.
45. Kangelaris KN, Prakash A, Liu KD, et al. Increased expression of neutrophil-related genes in patients with early sepsis-induced ARDS. Am J Physiol Lung Cell Mol Physiol. 2015;308(11):L1102–L1113. doi:10.1152/ajplung.00380.2014
46. Qu M, Zhang H, Chen Z, et al. The role of ferroptosis in acute respiratory distress syndrome. Front Med. 2021;8:651552. doi:10.3389/fmed.2021.651552
 © 2023 The Author(s). This work is published and licensed by Dove Medical Press Limited. The
full terms of this license are available at https://www.dovepress.com/terms
and incorporate the Creative Commons Attribution
- Non Commercial (unported, 3.0) License.
By accessing the work you hereby accept the Terms. Non-commercial uses of the work are permitted
without any further permission from Dove Medical Press Limited, provided the work is properly
attributed. For permission for commercial use of this work, please see paragraphs 4.2 and 5 of our Terms.
© 2023 The Author(s). This work is published and licensed by Dove Medical Press Limited. The
full terms of this license are available at https://www.dovepress.com/terms
and incorporate the Creative Commons Attribution
- Non Commercial (unported, 3.0) License.
By accessing the work you hereby accept the Terms. Non-commercial uses of the work are permitted
without any further permission from Dove Medical Press Limited, provided the work is properly
attributed. For permission for commercial use of this work, please see paragraphs 4.2 and 5 of our Terms.
Recommended articles
Identification of Novel Biomarkers and Potential Therapeutic Targets for Systemic Sclerosis: An Integrated Analysis of Plasma Proteome-Wide Mendelian Randomization and Transcriptome
Li H, Li Q, Chen X, Mo L, Wang Y, Liu X, Wang X, Qu Z, Wang J, Li Y
Journal of Inflammation Research 2025, 18:17561-17588
Published Date: 17 December 2025